1. Introduction
This paper investigates whether and how existing local industries may play a constructive role in Smart Specialization Strategies (S3), from the initial process of domain prioritization, strategic policy design, through to implementation, delivery, and monitoring [
1,
2,
3]. In recent decades, the role of local industries as a driver for local and regional prosperity has gained increasing attention in the academic and policy arena [
4,
5,
6]. This mostly accrues as a result of a “large and growing proportion of employment” ([
7], p.16) that in turn implies a large part of job creation within the local economic system. “Their productivity performance means that they have a significant impact on local prices and thus on living standards” ([
7], p.16). We introduce the concept of cluster related to local industries according to the wide literature on cluster and cluster-based development [
8] and claim the definition of local clusters as that which “combine those industries that operate only locally, and that are present in similar density across all regions; their high employment numbers make them an important channel for creating shared prosperity in regions” ([
9], p.5).
Recently, the European Commission has emphasized the role of the cluster-based approach in designing and implementing S3 policy under structural funds, and research and innovation programs [
1,
7]. Among the different issues related to how to underpin cluster policy and S3, open matters also indicate the role that local clusters can play as building-blocks of S3 [
1] to facilitate its operationalization.
The Smart Specialization literature, indeed, has highlighted how the policy operationalization process is still a challenging issue. Accordingly, the growing theory–practice gap [
10] is mostly related to the absence of a sound evidence-based methodology, alongside the rather vaguely-defined tools and instruments aimed at guiding and regulating its implementation [
10,
11]. However, these implementation challenges faced by European (EU) regions put a strain on the envisioned outcomes of smart specialization strategies in prompting knowledge-related regional growth and entrepreneurial possibilities built around existing place-based strengths and capabilities [
3,
10,
12]. The main goal of Smart Specialization—regarded as the cornerstone of the European Cohesion Policy reform—was to provide EU regions with the know-how required to leverage knowledge assets, place-based governance, and institutional capabilities [
3,
11]. Notwithstanding, a critical element of the place-based rationale rests on the need to galvanize local knowledge growth and diffusion mechanisms with a trickle-down effect from high-technology to low-technology sectors and activities [
3,
13]. In its application, such a local strengths strategy pivots on the identification of existing domains or fields where regions hold unique competitive advantages and whereby promoting diversification of technological and institutional trajectories [
11] via a regional self-search process, namely, an entrepreneurial discovery process [
14,
15,
16].
In its regional configuration, the research and innovation strategy for smart specialization (RIS3) explicitly implies an acknowledgment of regional sources of competitive advantage and future growth potential in the wider global competitive context ([
3], p.171). However, the processes of searching and exploring regional domains, core competencies, or complex technologies upon which “
extend the scope of existing activities” [
17], rests a controversial matter. An answer to this challenge is provided by a subsequent scholarly work proposing an upgraded, evidence-based theoretical framework for smart specialization, thereby enhancing the operationalization of place-based development policies. Such a revised framework combines the principle of
regional diversification [
15] with the concepts of
relatedness and
knowledge complexity [
11]. Accordingly, the idea is that the
variety of technological activities, related to the regional knowledge bases, and
the complexity of knowledge produced are key building blocks of a smart specialization policy [
11].
Considering this latter backdrop, the paper aims to contribute to the policy debate on smart specialization related to the potential role of existing local clusters (LCs) as key building blocks of its implementation [
7]. The smart specialization approach has deeply embedded an upgraded, systemic, and tailored cluster policy approach, where regional clusters are not understood as a self-sufficient target but rather as the provider of the knowledge-related infrastructure required to activate critical linkages between sectors, activities, firms, and entrepreneurship [
18,
19]. However, an understanding of the role of local clusters as a potential “starting point” for the implementation of smart specialization strategies is still lacking in the policy arena. In an attempt to address such a challenge, we investigated the nexus between smart specialization and local clusters. Despite the well-known relevance of regional or traded clusters to overall regional prosperity [
20], so far, much less attention has been devoted to local clusters in scholarly publications. Local clusters are a valuable indicator of the “health” of local and regional economies. The likelihood of improving regional competitiveness is explicitly linked to the productivity of a network of related local industries as their performance profile directly influences the cost of doing business and the overall cost of living [
4]. However, the need to investigate how to consider and whether to integrate or reconfigure existing local clusters throughout the whole smart specialization process [
1] reflects the growing concern on how to make the smart specialization approach efficient, and is alongside how to provide sharply-defined policy tools. We argue that a sound evidence-based understanding of existing knowledge-related strengths and capabilities, major challenges and likely potentials of local economic systems is a key prerequisite of an effective place-based approach. The use of best evidence available on local context capabilities and conditions—which local cluster appropriately capture—may contribute to corroborate a region’s ability to search for appropriate prioritization of S3 policy interventions and actions. In this regard, we conceive local clusters as the result of place-bound processes of accumulation of knowledge, capabilities and local specificities upon which leverage to forward diversification and competitive upgrading of local economic structures. As a result, we tackled three related research questions to assess the behavior of local clusters:
RQ1—How does the LC characterization respond to the opportunities typically associated with smart specialization policy design and implementation rationale?
RQ2—How does such characterization respond to the risks associated with the local economic context to which they are inherently exposed?
RQ3—How does their characterization adapt to continuous socio-economic changes, market pressures, and technological changes?
This paper introduces a dynamic assessment approach to answer thoroughly these research questions and it aims to contribute to the debate in two ways. First, it provides a conceptual framework for smart specialization built around the concepts of local clusters’
adaptiveness and
responsiveness (inferred from the interpretative framework of Bezzi, [
21]) to context conditions inherent to local economic systems. Second, it combines the adaptiveness and responsiveness measures (conceptual and quantitative) in a Dynamic SWOT analysis strategic framework [
21] to predict the behavior of local clusters in response to context-based economic conditions. The added value of this framework is that it assesses the validity of the Dynamic SWOT analysis framework in providing new evidence on the dynamic interdependency between existing endogenous strengths and capabilities and wider, exogenous context conditions.
We drew on the study conducted principally by Porter and Delgado [
20,
21,
22,
23] on cluster definitions, confluent within the U.S. Cluster Mapping Initiative that includes a “robust set of data-driven cluster definitions”, for both local and traded clusters in US contexts, namely from State to County level [
24]. We identified an existing set of measures to profile the
characterization of local clusters to propose two classes of conceptual variables: (i) The
potential policy outcomes/rewards for
general domains from adopting
smart specialization, and (ii) the potential
risks associated with the relevant socio-economic context conditions.
The dynamic SWOT analysis application to the case of San Diego provided interesting insights in building the conceptual framework for analyzing LCs against exogenous and endogenous factors. The findings may help explain how to relate LCs with smart specialization as building blocks, based on potential risks and opportunities associated with the local economic system.
The paper is articulated as follows. Firstly, the literature review on both the relevance of local clusters into the regional economy and S3 for the local economic system allows the authors to frame the leading indicators accounting for (i) the characterization of local clusters; (ii) the potential policy outcomes/rewards for general domains of adopting smart specialization and (iii) the potential risks associated with the relevant socio-economic context conditions. Secondly, the indicators, drawn from the literature review, are arranged into the conceptual framework built on Dynamic SWOT Analysis, introducing adaptiveness and responsiveness as main concepts for the potential input of building blocks in S3 policy design and implementation.
2. Literature Review
This section critically reviews aspects of prior scholarship that provide foundation of knowledge relevant to our purpose of explaining whether and how local industries can play a constructive role for smart specialization design and delivery. We first offer a brief review of the literature on local clusters, “unpacking” their notion by means of several scholarly positions [
6,
20,
25] and highlighting their distinctive features (cluster structure, productivity, and innovation) whereby they contribute, as well as regional clusters, to local and regional prosperity [
4]. Second, we review the contemporary debate on smart specialization [
2,
3,
10,
11,
14] by discussing critical views, issues, and unanswered questions that have been recently raised in academic and policy arenas [
1,
26], so as to highlight beneficial and negligible/counterproductive effects of the challenges that regions engaged in smart specialization policy actions and interventions are most likely to display, which in turn affect pre-existing economic structures on a local scale. In what concerns the possible impact of opportunities and challenges faced by regions, the extent to which they affect the effectiveness of the policy implementation—by either increasing or undermining domain identifications and policy prioritization—is likely to differ significantly between different contexts and places, owing to the heterogeneous “absorptive capacities” of regions [
27]. Indeed, recent evidence has shown how policy impacts, ergo such region’s metabolization capacity, rest heavily on the quality of the existing governance structure and institutions, and administration system of the region [
3,
11].
2.1. Factors Driving Local Clusters Development and Regional Prosperity
Among territorial innovation models [
28], regional clusters—here broadly defined as a sheer concentration of related firms, economic agents, supporting organizations and competences displaying a broad array of inter-industry interdependencies [
20]—and regional innovation systems have long been situated as a major conceptual underpinning of regional innovation policies [
26]. Despite the widespread understanding of regional clusters as the key driver of regional prosperity [
8], the debate on clusters had long granted much less attention to local clusters. However, in recent decades, local clusters have attracted growing consideration in the research and policy arena, over time they have obtained higher recognition in several studies [
1,
6,
20,
25].
Nevertheless, how do we position local clusters in the current debate? Local clusters lie at the crossroads of the following scholarly debates: The tension between “regional innovation systems” and place-based development policies, in the matter of regional smart specialization strategy [
1,
26]. Moreover, we argue that the notion of local clusters [
20] have a common ground in the debate on localized production systems, which Moulaert and Sekia ([
28], p.292) describes as a “generalisation of the industrial district view of local economic development”. In what concerns the similarities between local cluster (LC) and localized production system (LPS) logic, their view of regional economic development both underlie a convergence with existing development trajectory while encompassing local–global tension. The socio-economic development process that LPS includes is a cumulative and evolutionary one, as well as implying a trade-off between “local diffuse industrialization rooted in local communities, and exogenous economic pressures” ([
28], p.292). Alongside the development pattern convergence taking place across localized production systems, local clusters—to which we refer to as a “latent” element in the regional development process—are deemed to matter critically in terms of contributing to “shared” local and regional prosperity [
4,
24].
Drawing insights from the cluster literature [
4,
20,
29], the distinctive profile of a regional economy is explained by the occurrence, concentration, and linkages between three main types of industries, namely, traded, local and resource-dependent industries. Such classification, in turn, reflects industry’s variations in (i) localization attributes and geographical pattern, (ii) market size and orientation, (iii) key economic performance indicators reflecting their productive profile, and (iv) competitive dynamics.
In what concerns traded or exporting industries, they incorporate groups of related firms (i) emerging exclusively in prosperous and buoyant regions holding specific competitive advantages and, largely benefiting from co-location and physical concentration, (ii) typically serving cross-regional markets and, whose size being unconstrained by local demand is “virtually” boundless, (iii) typically identifying highly innovative industries, displaying high productivity profiles (measured by patenting growth), high employment specialization and wages, and (iv) facing high degree of exposure to competition from beyond the regional boundaries [
4,
20,
29].
Concerning
local clusters, they refer to groups of related industries (i) typically
located across every geography, regardless of regional competitive advantages profiles and for whom, an
establishments concentration is not an essential prerequisite, (ii) primarily serving
local needs and
markets and, whose
size, as much as growth opportunities, is therefore heavily contingent upon
local demand [
8,
20,
24], (iii) typically identifying industries with the highest
employment and
income share of the region, modest employment specialization profiles and related wages, and (iv) facing limited exposure to cross-regional competition for employment [
7,
29], as the latter is usually evenly distributed across geographical location, in proportion to the regional population size. In addition, Guo et al. [
30] identified four basic endogenous and exogenous conditions associated with local clusters: (i) To the same extent, they tend to operate in
agglomerated and economically active areas; (ii) they generate increasing opportunities as they grow in
complexity; (iii) they attract increasingly specialized functions; and (iv) they create local linkages and networks whereby the firms within a specific industry operate. As highlighted in the academic debate on
traded-local clusters linkages, such industries are mutually dependent under the prospect of
structure and
competitive dynamics [
25]. Indeed, on the one hand, the demand for the local industries is heavily contingent upon exporting industries [
29]. On the other hand, productivity and competitiveness are influenced by output figures and the efficiency of local industries, [
20,
25]. However, as pointed out by Ketels [
31,
32], although being spatially dispersed, such local companies might have linkages in terms of input–output relations, skills, labor, and other factors, regardless of their location across the regions.
As we have already stressed, overall regional competitiveness heavily rests on its “
repertoire” of
competitive exporting industries [
20]; nonetheless, local clusters are a valuable indicator of the “health” of both local and regional economies. In fact, following the pace of agglomeration processes, to some extent local clusters leverage agglomeration processes, whereby they provide specialized support (i.e., supply chains) to thriving
traded clusters [
25]. Moreover, the vast majority of regional
employment and
income comes from
jobs generated in local clusters, without stating how they contribute to fostering local development opportunities, well-being, and prosperity. The possibility of improving overall regional competitiveness is explicitly linked to local clusters’
productivity, as their performance profile affects the cost of doing business and the overall cost of living [
4]. Their role and development matter especially non-EU countries, as in the case for instance of the US where the co-existence of specific context conditions—welfare and economic traditions, labor market regulations, government traditions, business culture, and socio-cultural fabric—contribute increasing the likelihood of systemic market failures (i.e., greater socio-economic vulnerability). Against market failures arguments, we claim that local clusters—viewed as the
micro-level dynamics (intra- and inter-firm knowledge linkages and externalities, commonalities, cooperative actions, partnerships) underlying existing structure of a local economy—contribute to providing and furthering local opportunities of “shared” development [
20,
29,
32]. We review, indeed, how local clusters can play a substantial role in activating and corroborating the process of local accumulation and development of core knowledge, competences and institutional capabilities, which is a crucial concern in the debate on related variety that paves the way for novel activities in the region.
Based on the above considerations, we put forward two hypotheses on local clusters towards building a conceptual framework to operationalize smart specialization. This framework embeds the role of local clusters as building blocks of smart specialization strategies and in which the concepts of adaptiveness and responsiveness respectively reflect the local cluster’s degree of flexibility to changes as well as their “reactivity” through structural adjustments to structural and conditioning factors of a local economic system.
Hypothesis 1 (H1). Local clusters and the Local Economic System (LES) (demand-side). LES is hereby defined as the host of economic activities in a region whose sectoral agglomeration (either in terms of firm population or employment concentration) is caused by local-self augmenting processes. Such economic activities generate the demand of services by local clustered firms within the LES. Following Brenner and Mühlig [33], self-augmenting processes are the underlying mechanisms responsible for the existence of local clusters. In the literature, they are also called “Marshallian externalities or localization economies” or specific circumstances of location ([33], p.486). Hypothesis 2 (H2). Local clusters and the business environment (supply-side). The business environment is the host of the key factors determining the advantages for the clustering process, which is self-replicating and has competitive success built on agglomeration. The business environment conditions constitute the supply side for LCs in terms of “assets, capabilities, and structural market conditions that shape the level of productivity firms can achieve” ([32], p.6). However, it is more than a simple agglomeration as a result of the innovation arising from the cooperative interactions between firms [5]. 2.2. Emerging Opportunities and Challenges of Smart Specialisation
During the last two decades, the increasing polarization of knowledge, innovation, high-skills and income groups and the relentless economic crisis in the aftermath of the 2008 global financial crisis have reshuffled the geography of growth across EU regions [
11,
34,
35,
36]. Such a backdrop has urged on the need to develop a sharpened strategic approach to reduce growing regional disparities, employing a place-based policy framework for regional economic development [
12,
37]. The harsh criticism of traditional “one-size-fits-all” regional development strategies [
3,
38]—which have long proved to be ineffective in progressing economic diversification, even more so in the case of less technologically and institutionally dynamic regions—has prompted the need of a novel policy framework [
11]. The result is the emergence of an ambitious science and technology-centered policy program for regional development regarded as the cornerstone of the Europe 2020 growth strategy, namely Smart Specialization [
2,
14]. In contrast with the former configuration of regional development policies, smart specialization underpins a renewed definition of the place-based approach ([
3], p.85). Following McCann ([
3], p.83–85), the modern place-based imperative introduces (i) multi-scalarity governance arrangements and integrated interventions replacing overly centralized and sector-targeted approaches, (ii) place-sensitive policy initiatives, tools, and actions aimed at correcting multi-level market failures in lieu of a space-neutral/blind approach [
38], (iii) structural change approaches to addressing weaker regions’ development imbalances rather than short-term contingency-centered strategies. Therefore, the central goal of the strategy is not to envisage future regional growth opportunities ex-novo but rather to make such paths for economic upgrading highly consistent with the regions’ existing place-specific strengths and capabilities [
3,
10,
12,
39]. In other words, mainstream strategies such as specialization and diversification—that have long made regions particularly exposed to lock-in mechanisms and shocks—do not represent a major vector of regional development per se within the smart specialization changing paradigm. Instead, it is the patterns of specialized diversification across related technologies, which is deemed as vital to growth [
40]. To this end, the smart specialization multi-level governance imperative underpins a shared responsibility of regional and local actors (private sector, civil society, and institutions) working in partnership with governments in designing and delivering the programs and projects [
41]. Nonetheless, albeit to different extents, regions need the know-how to mobilize current place-bound knowledge and technology potential, governance, institutional and market-related capabilities to develop their comparative advantage in activities that are closely connected to different sets of core knowledge, technology, and competences. The tension underlined/underpinned by the smart specialization policy framework has been finely unfolded by Balland et al. [
11], both conceptually and empirically. As pointed out by the authors, its effectiveness inherently reflects a trade-off between a rational, cost and risk-minimizing strategy towards allocation and prioritization of public funding on specific domains of regional specialization, and a long-standing benefit-maximizing strategy via discovering/experimenting on new technological possibilities that are closely rooted to the region’s knowledge base and core competencies.
3. Materials and Methods
The research methodology aims to identify:
those factors influencing or inhibiting the clustering process of local industries (e.g., what are the key internal industry-related features and external regional factor/condition endowment attributes involved in the “self-replicating” ([
5], p.30) process;
those factors on which innovation policies—S3—could intervene to ensure a wide economic integration at a regional scale in a such a way that activates a “self-augmenting” process [
6].
The methodological framework borrows from an application of the Dynamic SWOT Analysis [
21] to unveil the potential of local clusters in S3 implementation. The study conducted for this purpose is based on two interrelated data processing methods, the former builds on relevant variables gathered by a specific literature review on the role of the local cluster to enhance the innovation process of a local economic system. The latter, inherent with local economic structure and with the official source of socioeconomic data, allows the measurements of the variables coming from the literature review. The challenge lies in building an assessment process of EU–S3 over investigating the exposure of US local clusters concerning Opportunities and Threats characterizing the S3 implementation.
The methodology is based on the following assumptions: The industries identified as “successful” are those with the highest pool of specialized and experienced employees [
29]. In the aim to identify structural and conditioning factors for local clusters, we integrated the theoretical framework of Porter [
5,
29,
42] with some considerations raised by Brenner, [
6,
33,
43] and defined them as endogenous (structural) and exogenous (conditioning) factors.
The research conducted is based on three main steps. The first concerns the analysis of six out-performing local industries in the San Diego region, for which we have collected data on industrial agglomeration and innovation from 1998 to 2014. Second, a spatialization procedure, namely the Cluster Spatialization Methodology (CSM), is employed to provide an understanding of the location factors, proximity, and distribution of economic characteristics within the selected LCs, combining the zip-code mapping of business pattern data with zoning. The third step is related to the exploratory case study selection process among the initial set of the local clusters selected and mapped. Drawing on the descriptive statistics, we select the best performing local industry upon which we test the application of a Dynamic SWOT analysis to explore the relationship between industry-internal attributes (strengths and weaknesses) and industry-external conditions (opportunities and threats).
3.1. Case Study Analysis: The San Diego Context
The San Diego regional economy encompasses strong traded and local industries that have been vitally contributing to the success of the region [
4]. The presence of military-related industries pivoted the local economic conditions until the 1990s when defense financial cutbacks caused severe challenges to the entire local economy [
4]. Nevertheless, the collaboration between private firms and research centers, and the partnership between local governments, businesses, and the academic sector have helped the region to emerge from an economic recession phase [
4]. These new forms of cooperation have allowed industrial diversification processes characterized by R&D investments, and, in turn, have facilitated the region’s highly-competitive position in traded industries, such as biotechnology, pharmaceuticals [
4], and ICT [
25]. However, local clusters strongly drive San Diego’s prosperity, covering approximately two-thirds of the state’s employment (64%). The economic structure is predominantly characterized by a “small and medium-sized business that serves the local market” [
4]. Beside biotechnology, pharmaceuticals and ICT, two industrial sectors are emerging in the San Diego region. The first is related to the blue economy, defined as “the sum of all economic activity having to do with oceans, seas, harbors, ports and coastal zones” ([
44], p.5). This sector is one of the current development drivers in the region that involves several activities connected to tourism, shipping, transportations, fishing, and shipbuilding activities [
45]. The second relevant sector is agriculture, which contributes
$2.88 billion to the local economic system, both in terms of local supply and exports. Moreover, agricultural production supports 16,648 jobs plus 5000 by the multiplier effect [
46]. The “emerging” activities connected with local productions and agriculture are vineyards and craft breweries, engaged both in exportation and local supply. The craft breweries provided an economic impact of
$1.1 billion on the county in 2017 [
46]. The business environment, connected with urban agglomeration dynamics, involves several actors from both private and public sectors and operates in the real estate, service networks, infrastructure, and transportation systems. The “San Diego Association of Governments” (SANDAG) is one of these key actors, being in charge of strategic planning for public transportation, environmental management, housing, open space, air quality, energy, fiscal management, economic development, and public safety. In terms of industrial agglomeration, as previously mentioned, the principal activities boosting the local industrial system are referred to as (i) military activities, (ii) the naval industry, (iii) bio-pharma, (iv) agriculture, and (v) tourism. Professional, scientific, and tech services (20.1%) are connected with aerospace, navigation and maritime technologies; ICT, strongly connected to R&D sectors and, thus, to universities and public or private research agencies, is considered as typical traded activities [
29].
3.2. San Diego Local Clusters Selection and Spatialisation
The cluster-based analysis of the US economic context, compiled by the data structure of the U.S. Cluster Mapping Initiative (USCMI), offers a robust set of indicators to identify both the economic performance of existing clusters and their potentialities. Among the query-results made possible by the USCMI, the so-called “Cluster portfolio” [
47] of a specific context under observation provides the structure of strongest traded clusters with regard to the last year of the available data including the performance of the top local clusters. According to Delgado et al. [
22], a strong cluster is “a cluster that has high employment specialization in a region (ranking in the top 25% of all regions by specialization and also meeting minimum criteria for employment and establishment)” (USCMI).
We referred to the portfolio of San Diego County in 2014.
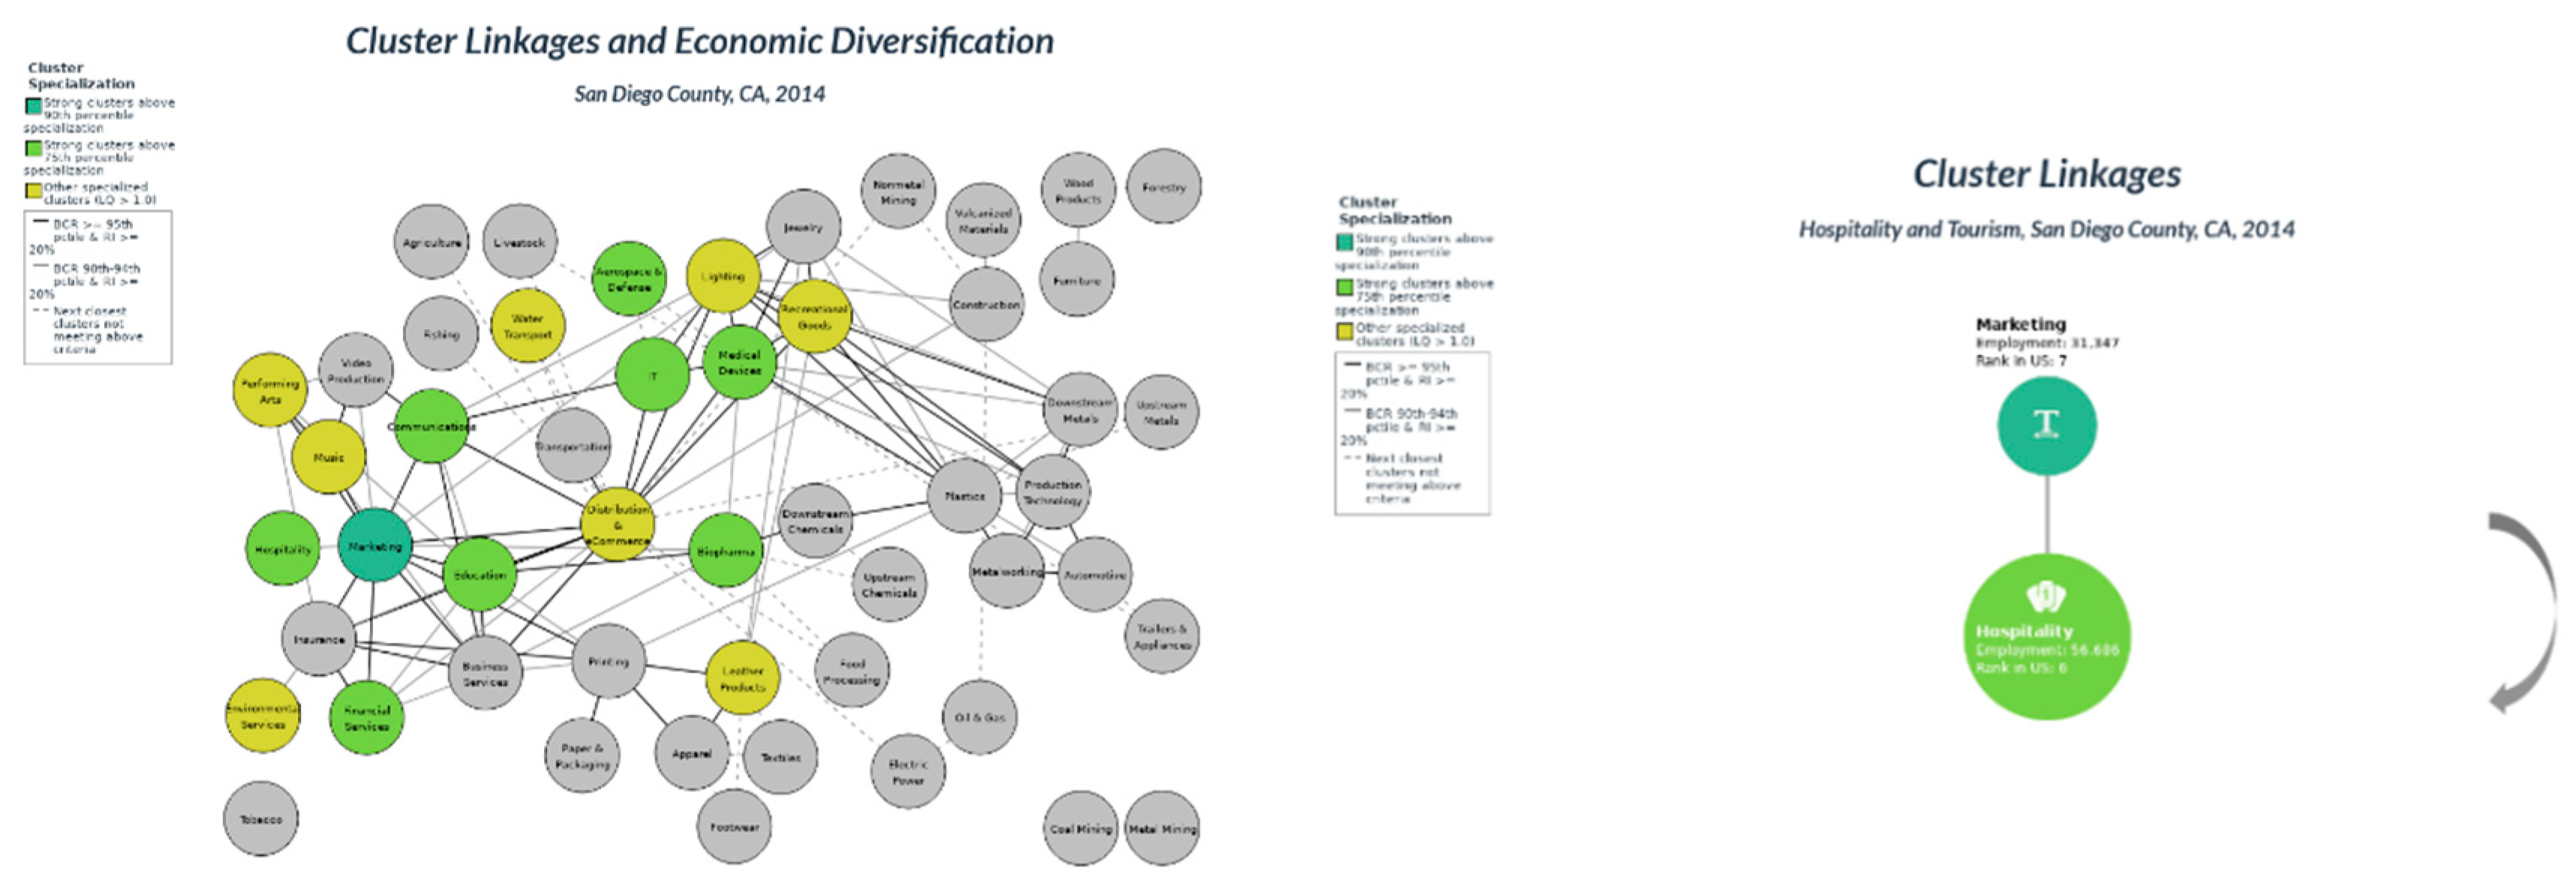
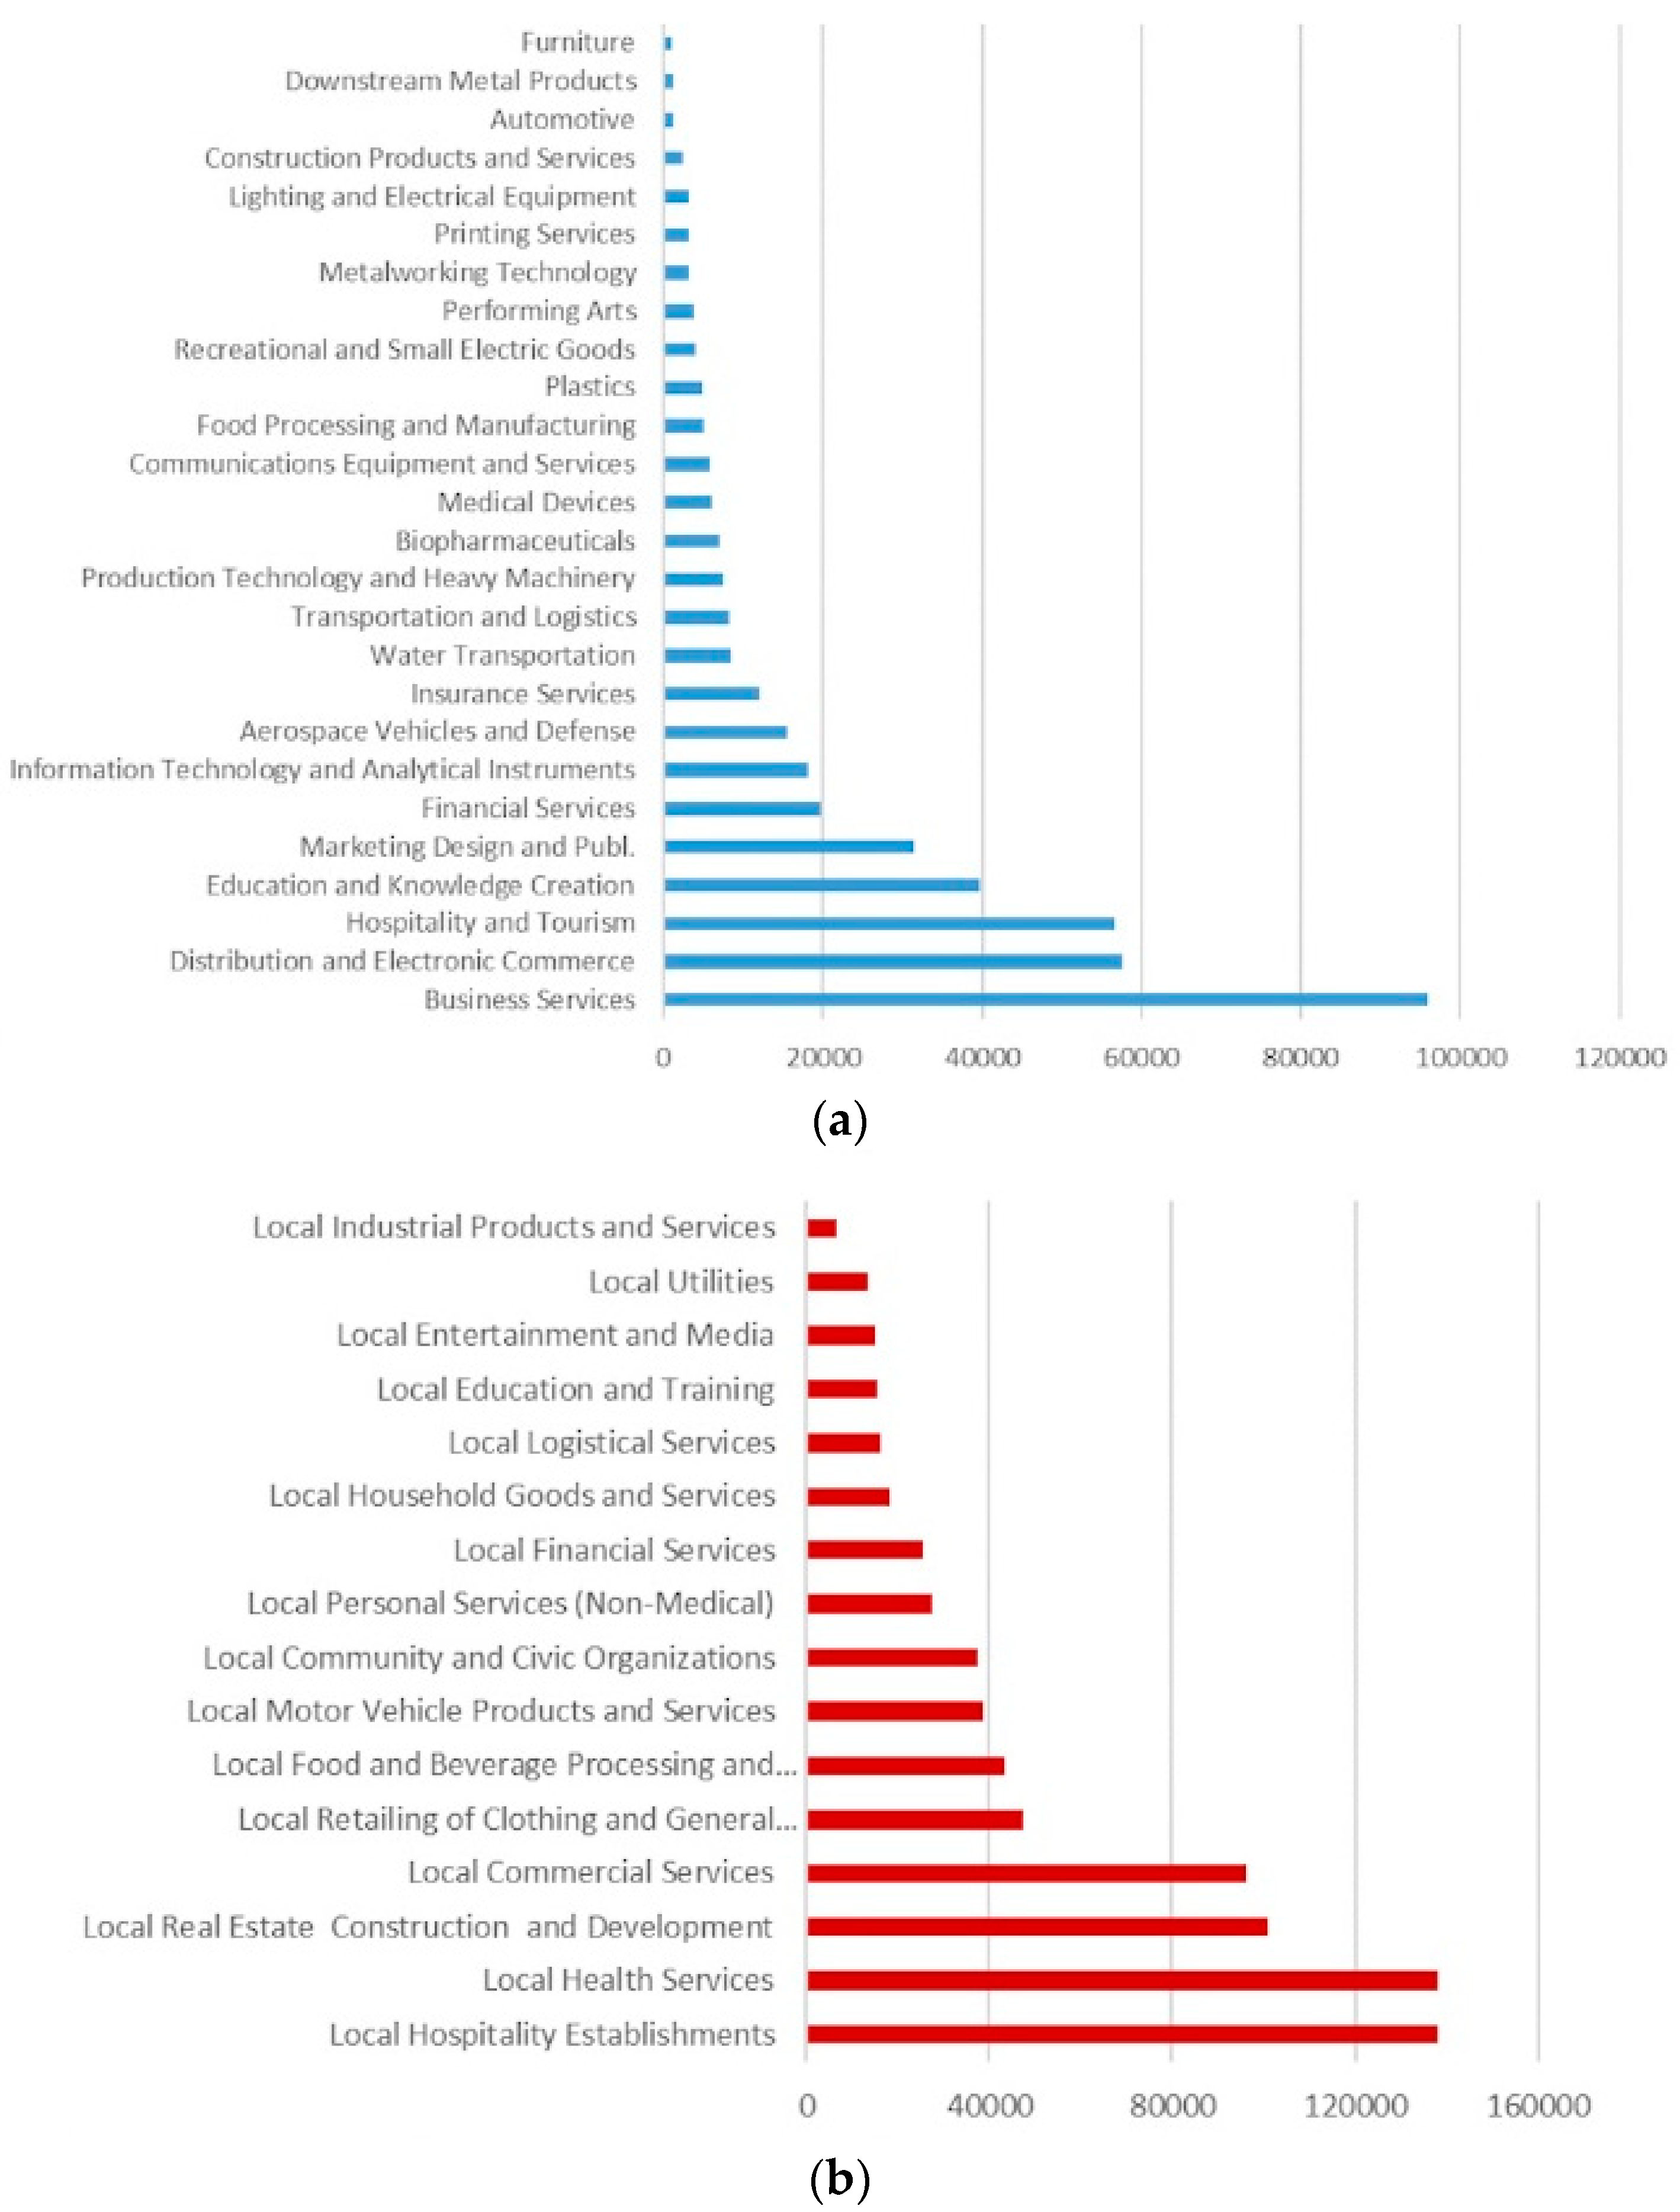
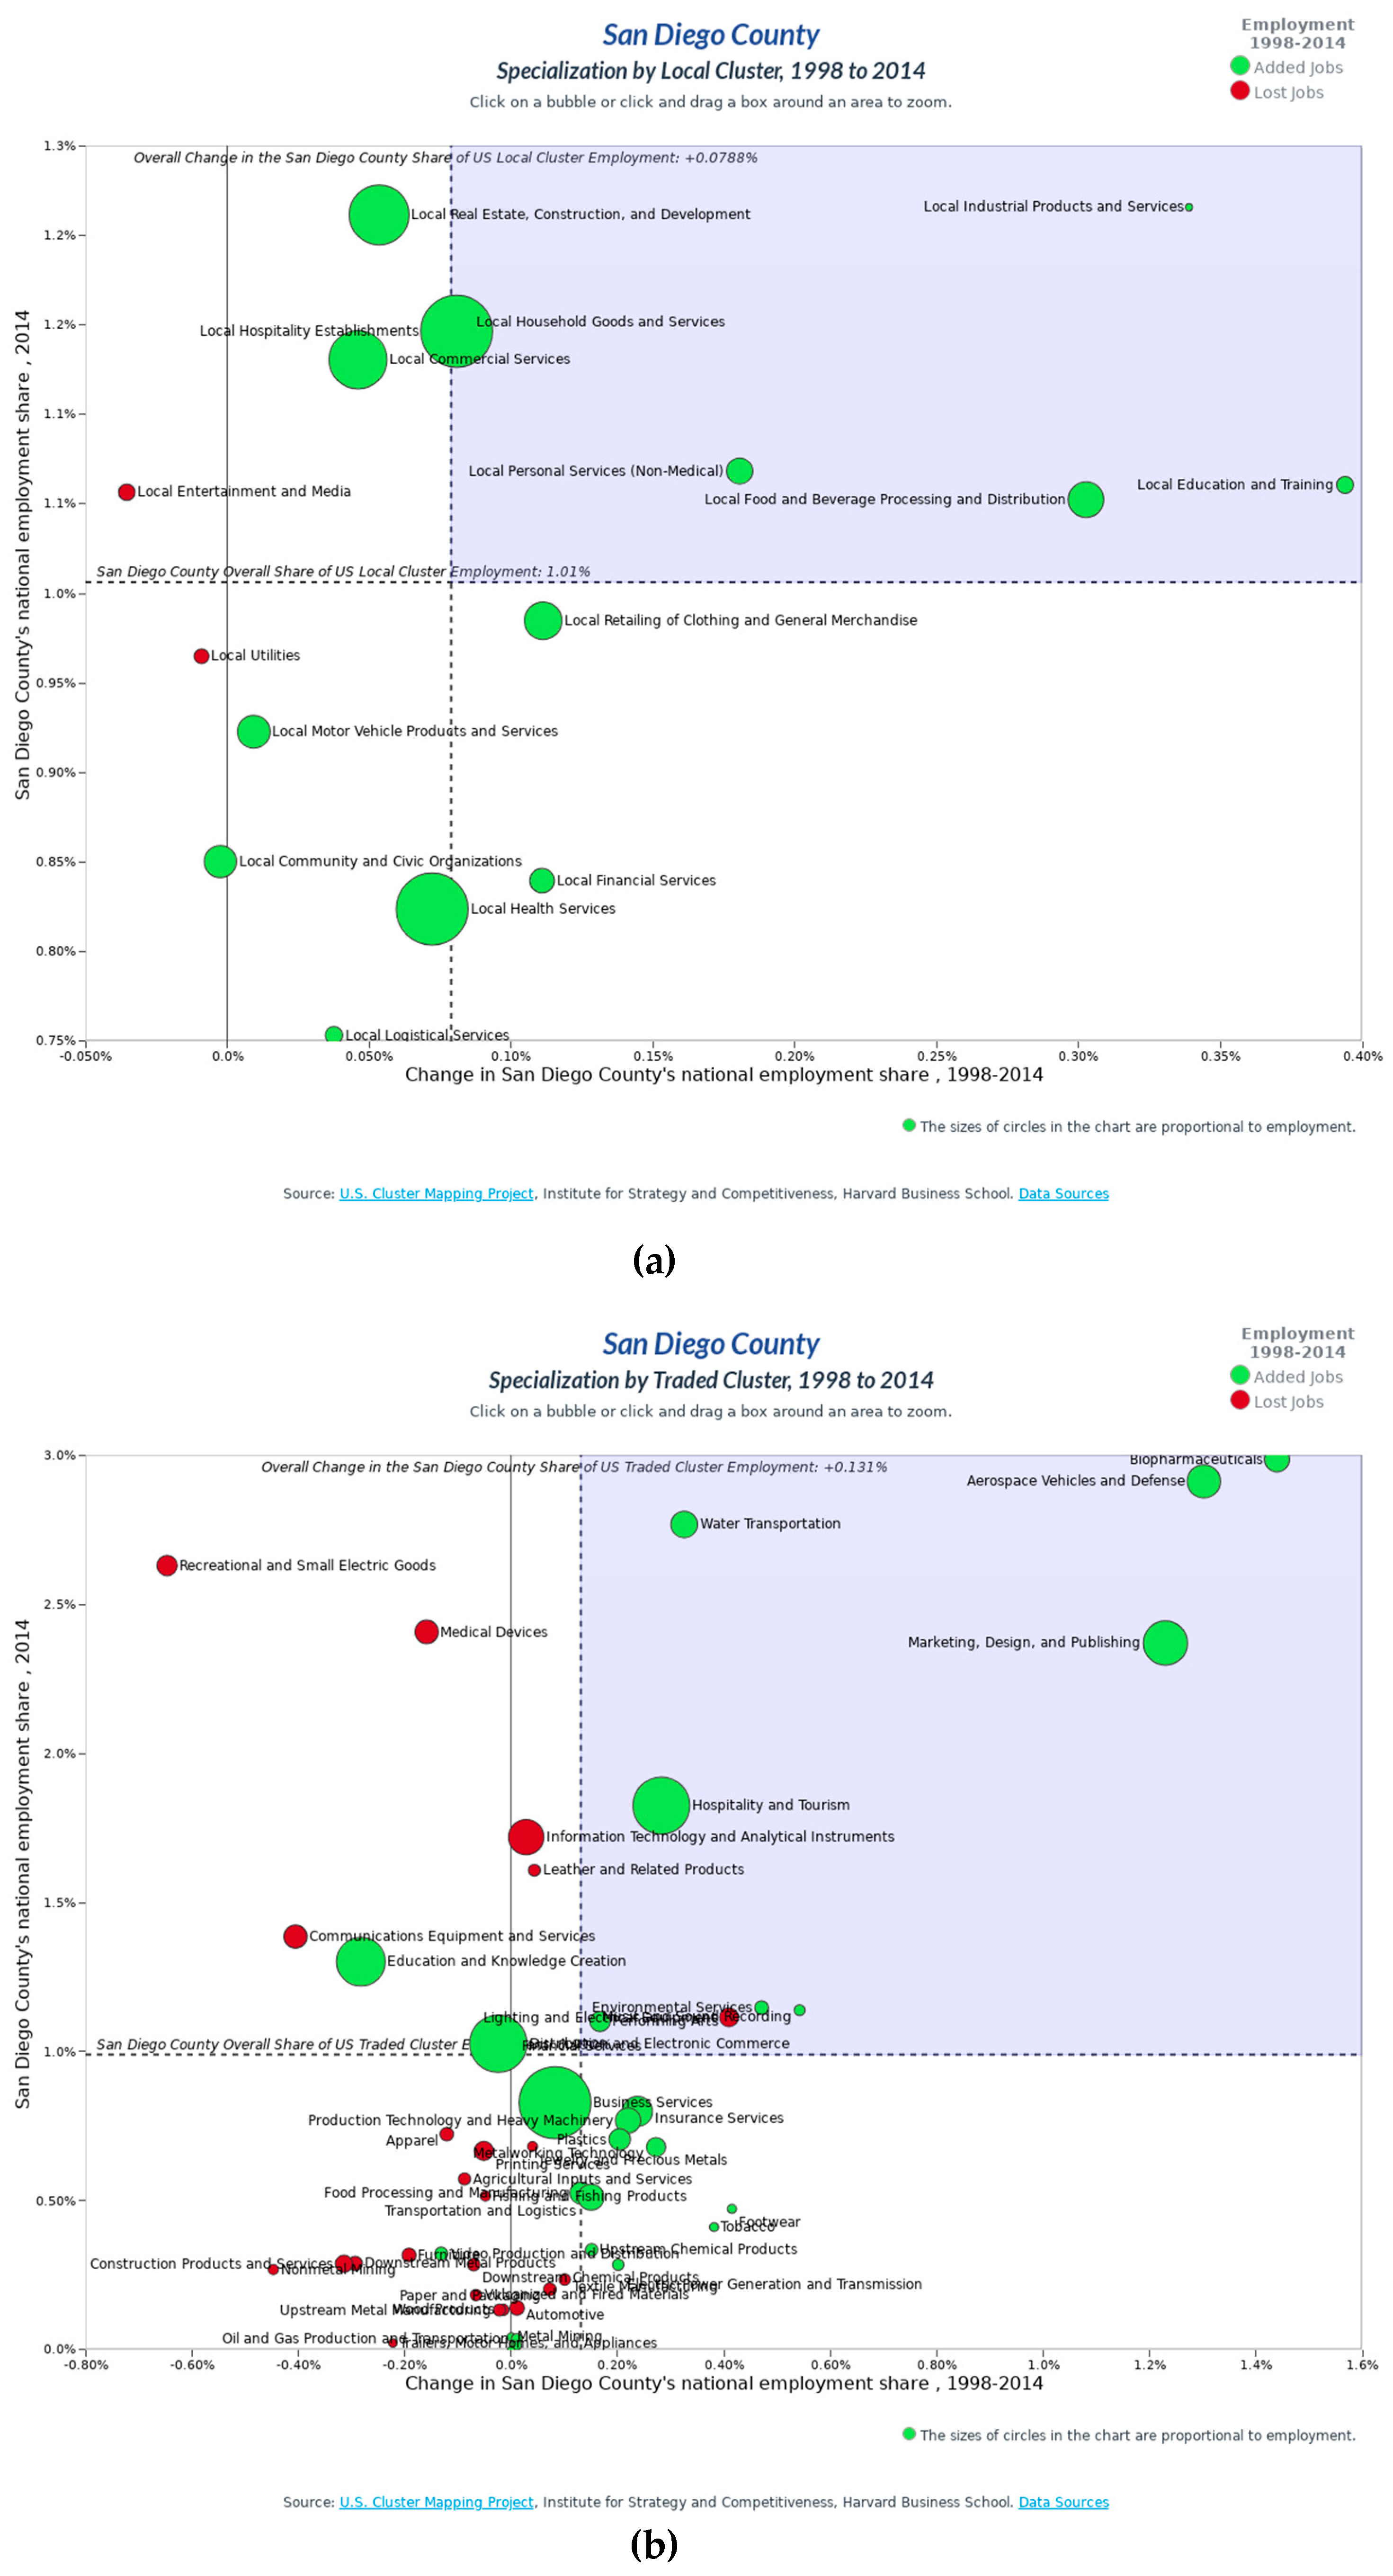
Figure 1 shows the employment by clusters, both traded (a) and local (b), whilst
Figure 2 displays the performance of traded and local clusters against the specialization indicator. The quota sampling technique was applied to a population of 16 local clusters in San-Diego county (
Figure 1 and
Figure 2).
The result consists of the selection of the region top 30% of cluster formations by employment-based location quotient values, which must exceed the cut-off point, LQi > 1.0. Six local clusters (Local Personal Services (Non-Medical); Local Household Goods and Services; Local Hospitality Establishments, Local Commercial Services; Local Real Estate, Construction, and Development; Local Industrial Products and Services) define the sample which has been spatialized via the Cluster Spatialization Methodology (CSM) [
48]. The CSM is based on both spatially-led and governance-oriented approaches to highlight the behavior of “place” in fostering knowledge dynamics to promote innovation. The scope is to build an evidence-based methodology that investigates the spatial planning and governance-oriented features of the cluster approach [
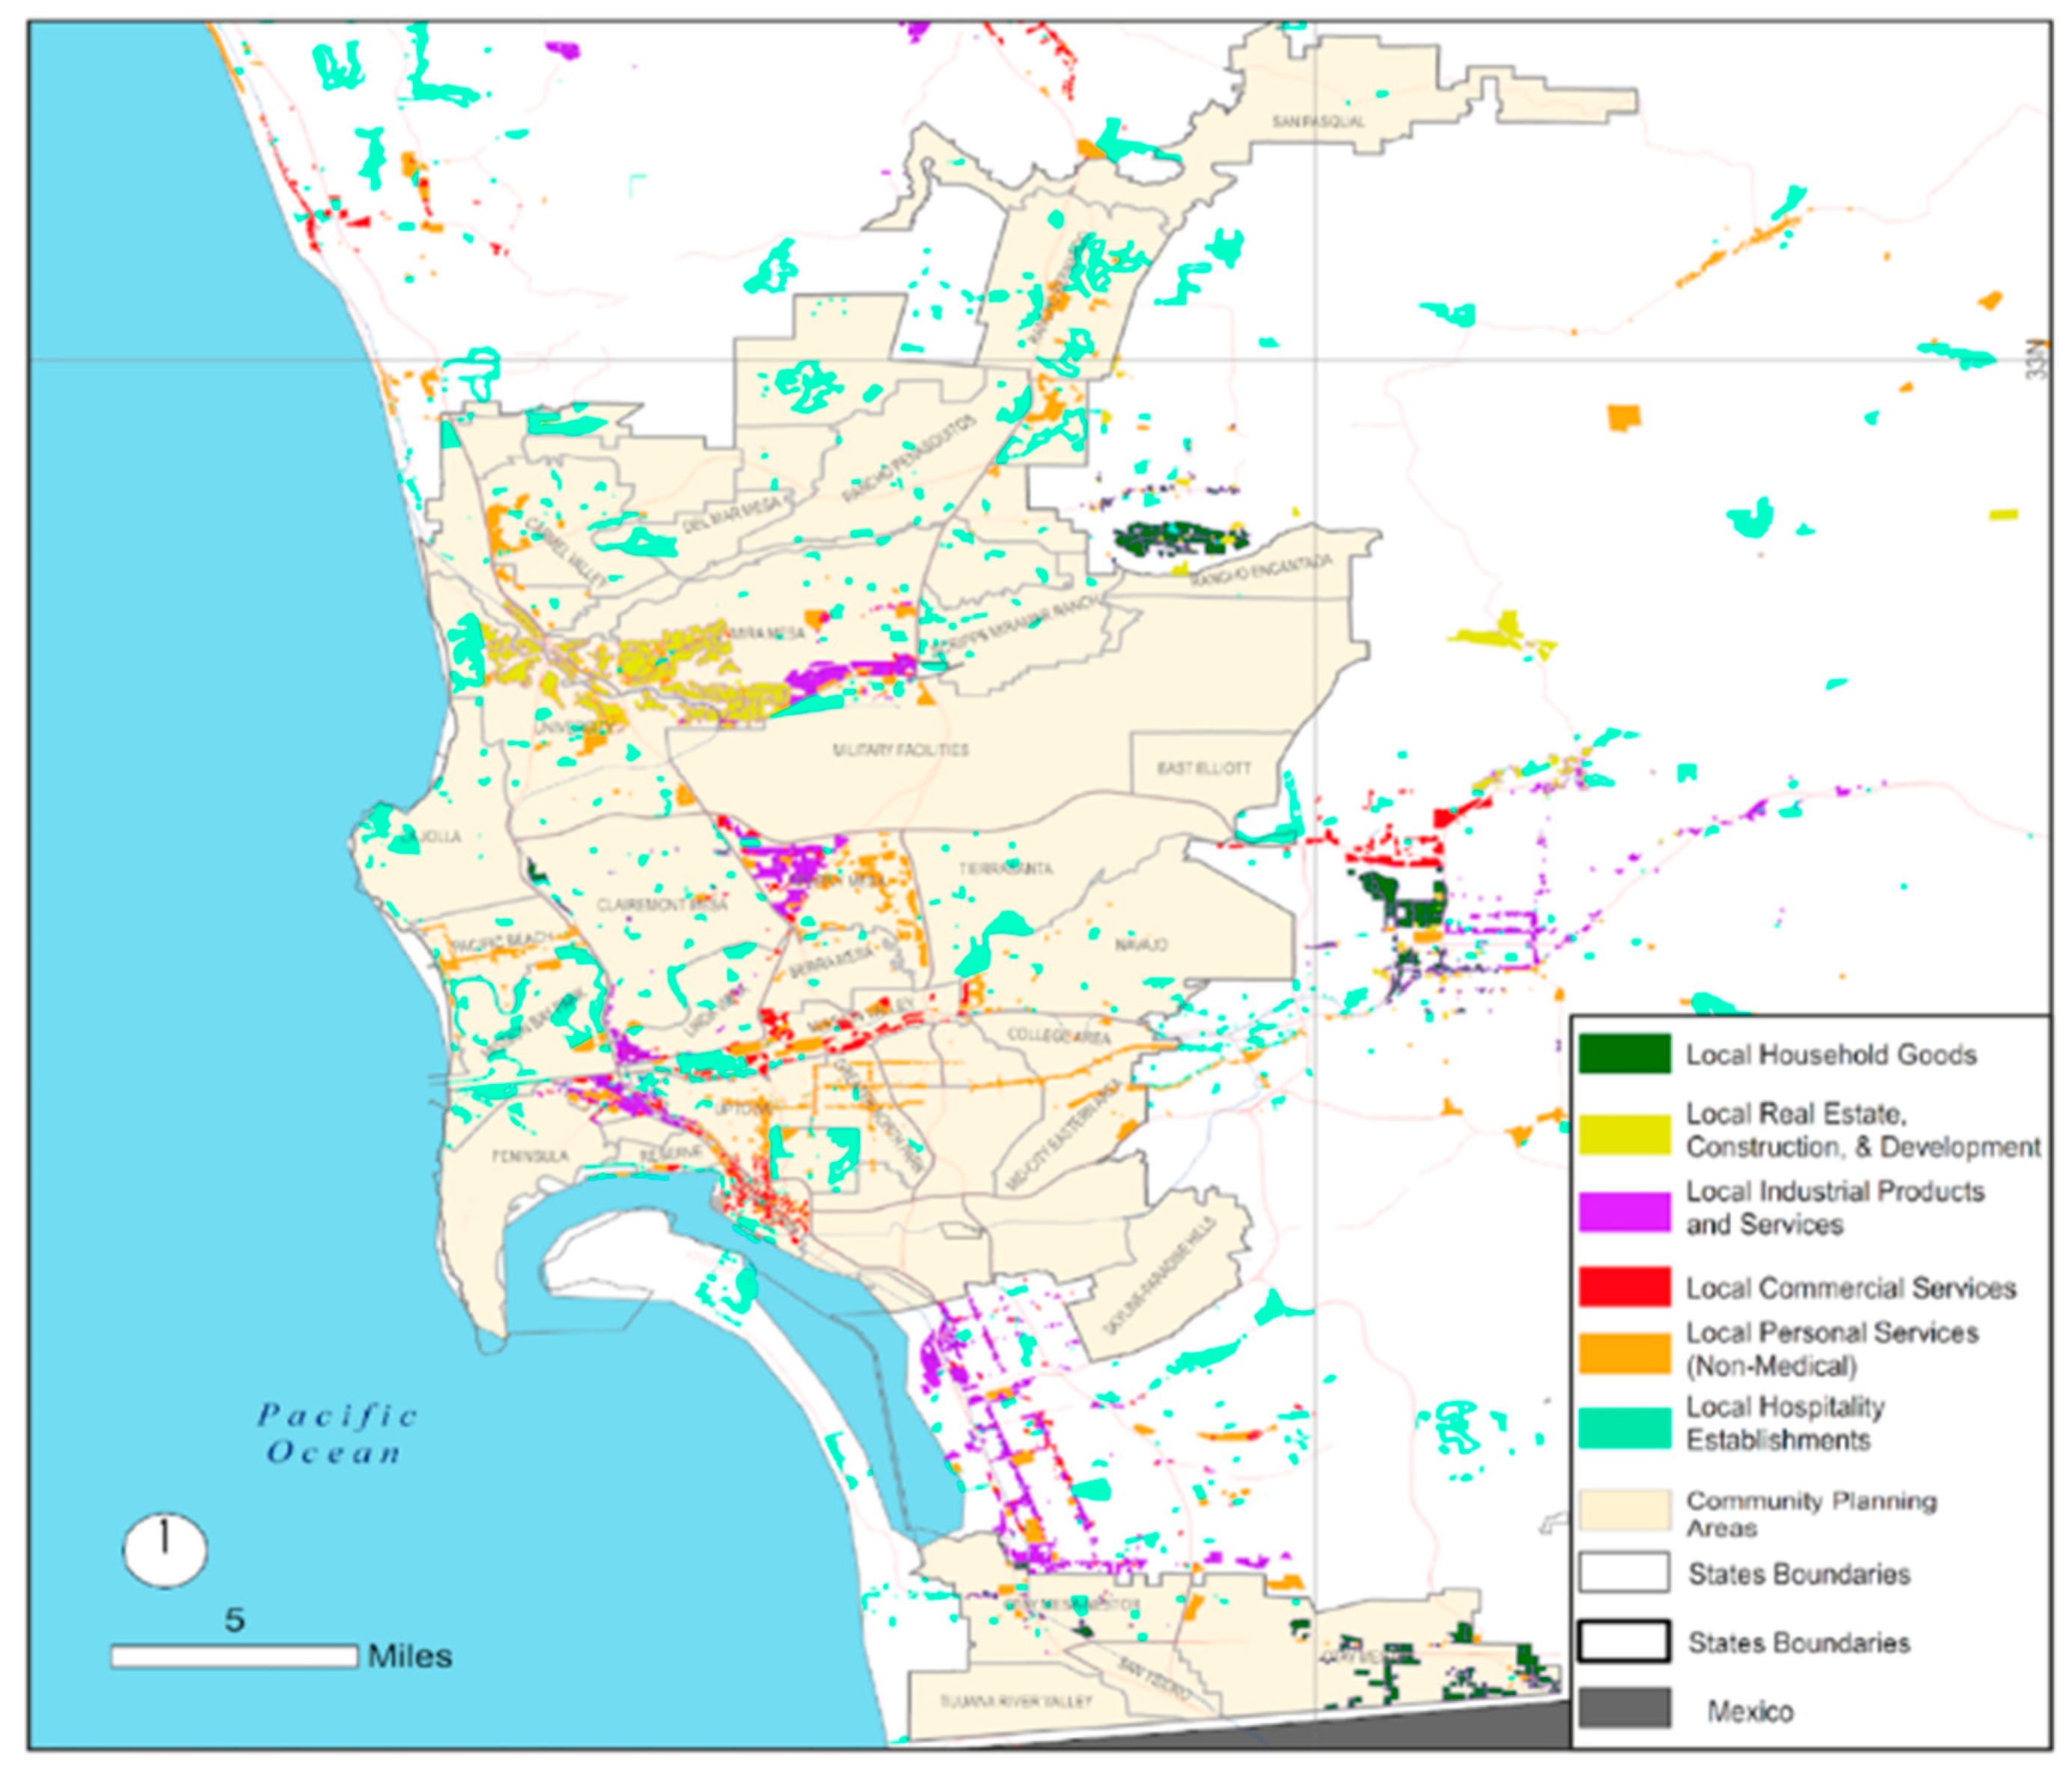
49]. The CSM was developed during the four-year research project Maps-Led in two US contexts, Boston and San Diego (
Figure 3).
While in Boston the CSM was tested on traded clusters, in San Diego the focus was shifted to local clusters, mainly due to the local economic structure [
4]. Accordingly, the specific localization of the six samples had the objective of disentangling and describing the role played by local clusters towards shaping the actual structure and influencing the potential structure of the San Diego local economy. The Maps-Led report on local clusters in San Diego depicted how their response to the main categories of indicators, classified within the USCMI (
Table 1) jointly with the spatial factors interfered with the CSM, resulted in defining three groups of “Local Cluster characterizations” [
6,
43,
50,
51,
52] (
Table 2).
3.3. The Exploratory Case Study: Local Hospitality Establishment Cluster
The selection criteria of the Local Cluster Hospitality Establishment (LCHE) as an exploratory case study, among the six sample of local clusters analyzed in San Diego, is multifactor dependent.
According to the main aim of the work, namely, to reveal the potential role of the local cluster in the building-block process of S3, the LCHE shares many commonalities with the European regions. Foray ([
2], p.92) used the “case of tourism as a possible priority as it is one that interests many regions” to turn it into “a sort of textbook case in numerous regions” to explain how S3 can be operationalized. Recently, Weidenfeld ([
53], p.19) pointed out how “tourism is a platform for diversifying other regional sectors and not only its own sub-sectors because of its ability to adapt its service products to new extra-regional markets and therefore generate new knowledge on market demands”.
The result of the San Diego local clusters analysis indicators put the LCHE under the characterization of “LC operating for traded cluster”, as the most performing among the six local clusters examined for the San Diego County (
Figure 1). The Local Hospitality Establishments cluster is defined as “local hospitality establishments that serve food and beverages (alcoholic and non-alcoholic), as well as recreational facilities including country clubs, fitness clubs, and bowling centers”. This cluster also contains gift and souvenir retail stores” ([
20], p.27). In detail, these activities are referred to as the broader “tourism” sector, which is particularly active in the San Diego region and which constitutes a large component of the local economy [
4]. The city of San Diego is an internationally-recognized tourist and convention center destination [
54]. It offers to visitors many amenities, natural resources, and entertainment attractions such as museums and zoos, or recreational activities such as golf courses and country clubs, athletic events, race tracks, theatres, and numerous artists and performers [
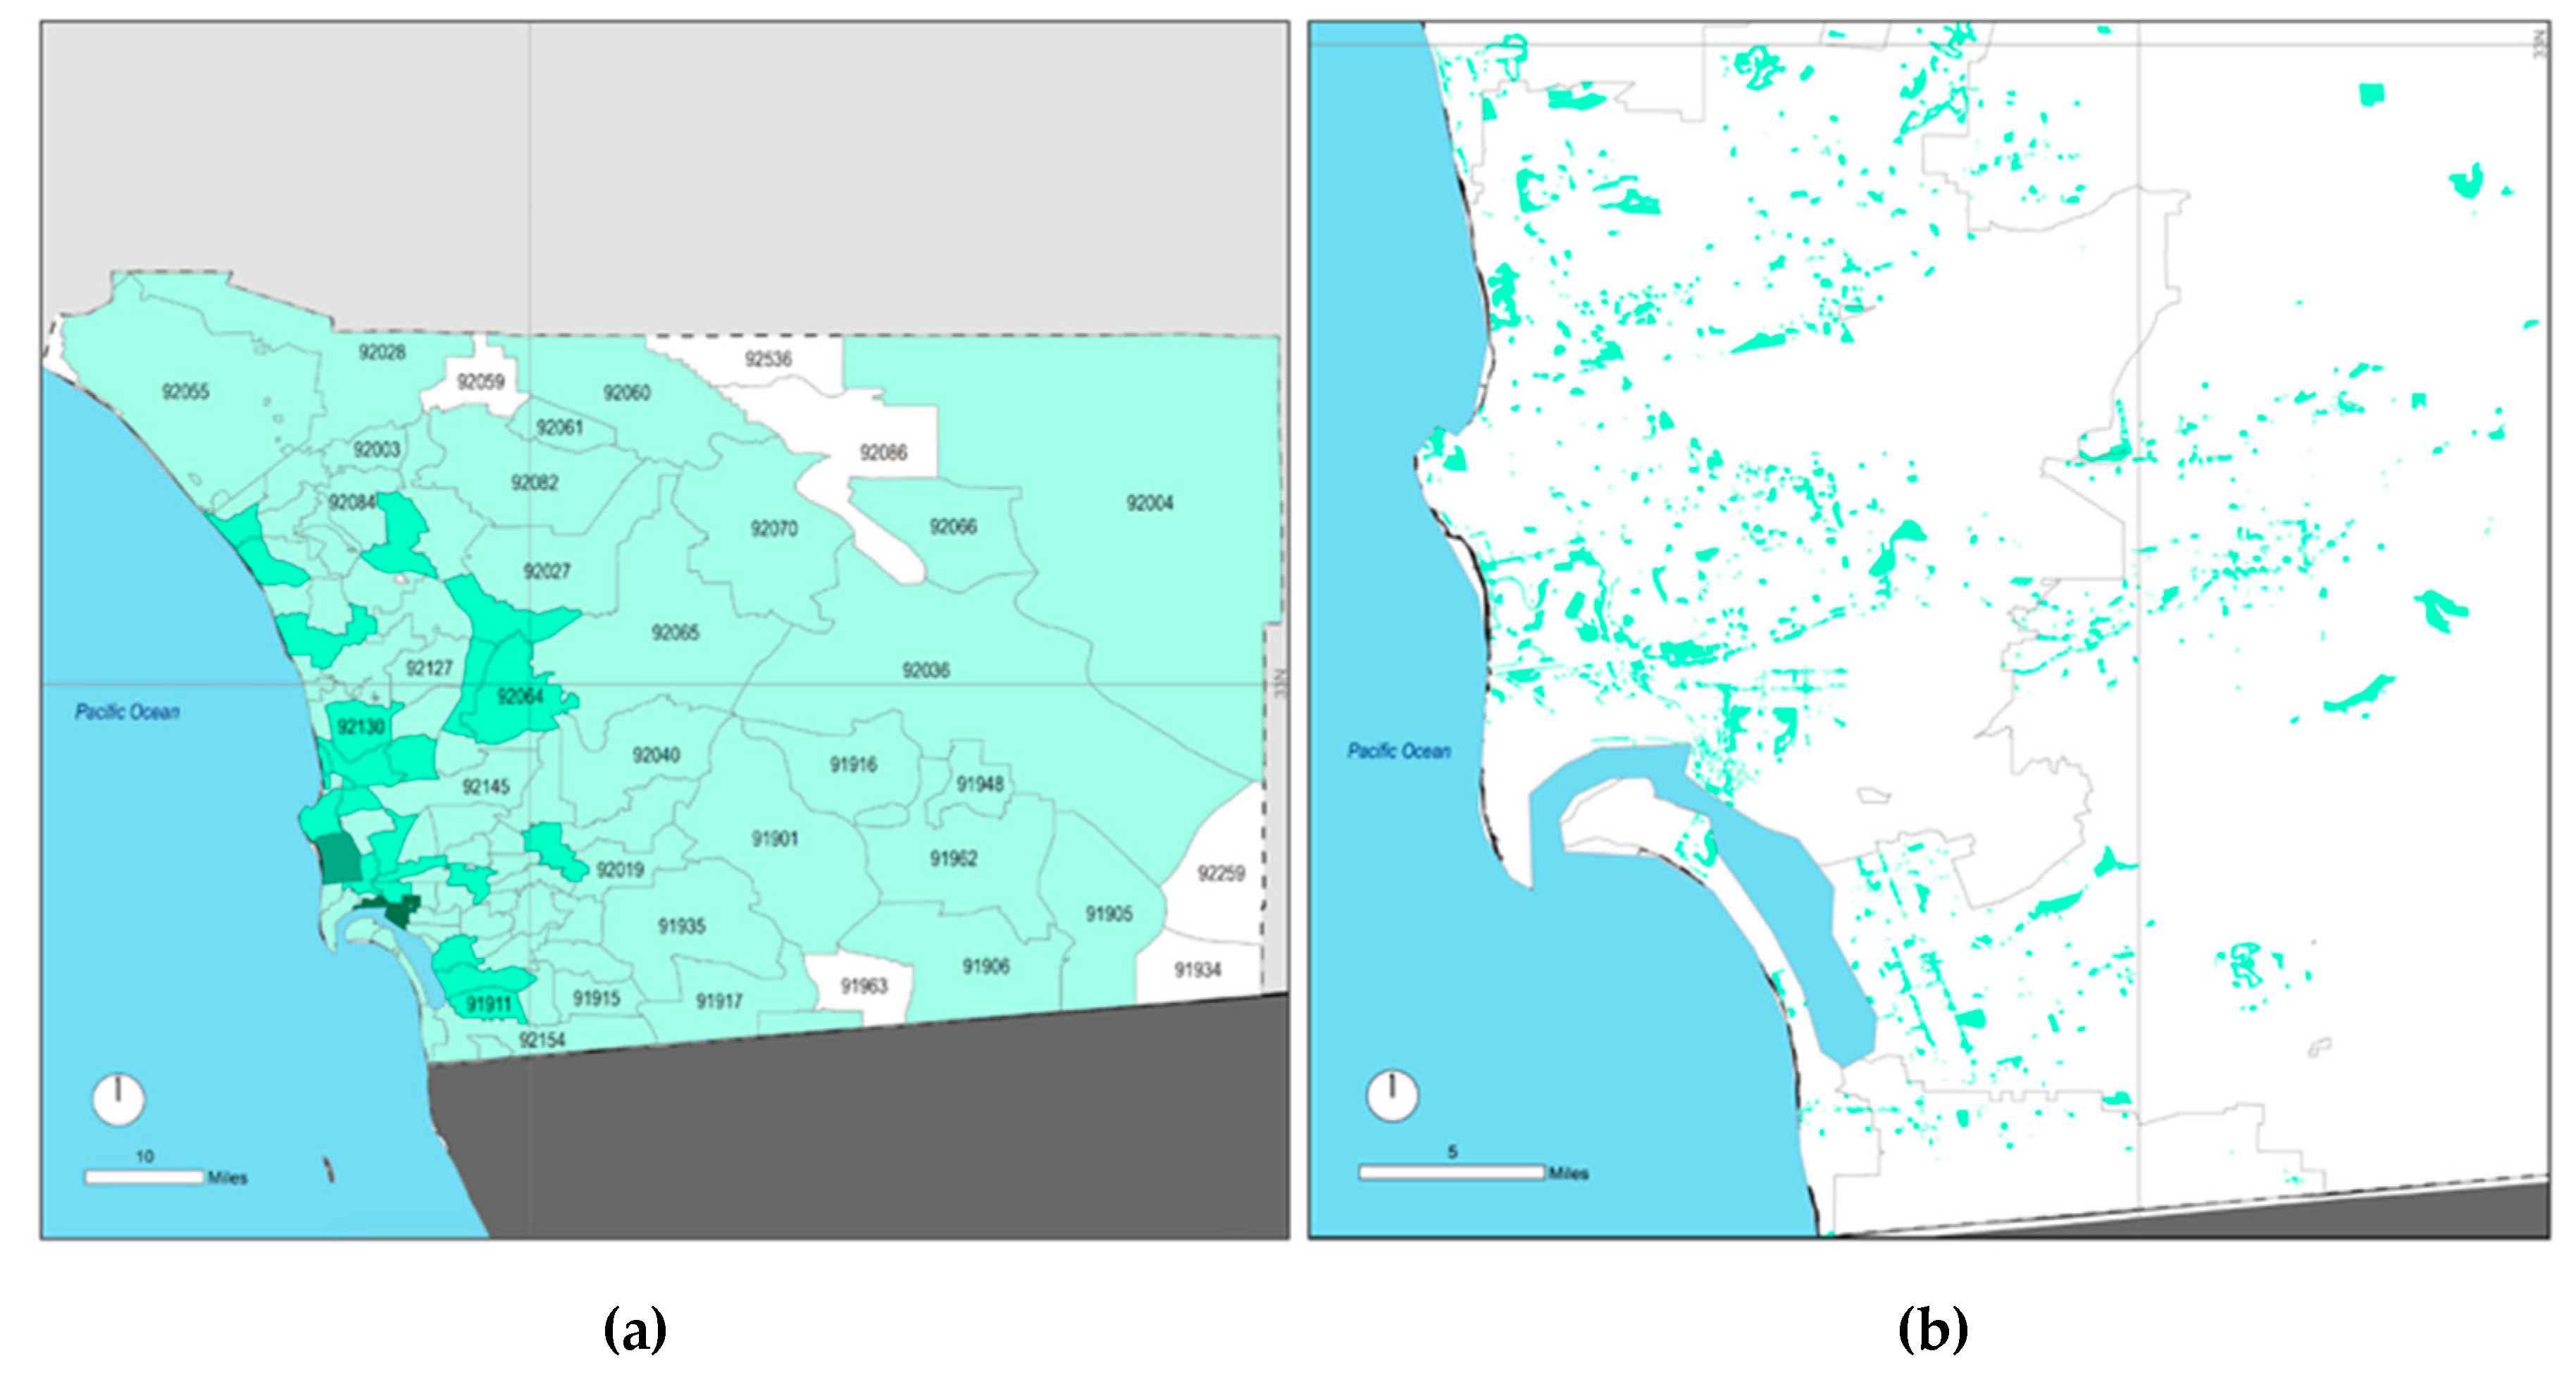
54]. From the visual analysis of the map (
Figure 3), significant clues emerge on the spatial configuration. Specifically, it can be noted the LCHE (depicted in cyan) features a scattered spatial configuration in proximity to the most important touristic sites: On the coastal area, in the downtown area, the La Jolla area, and the inland areas. The cluster morphology resulting from the CSM (
Figure 3) may help in defining the LCHE structure and describing the internal mechanism [
55], finally evidencing those productive sectors through which the less-integrated activities are related [
2,
53]. It is possible to argue that the structure definition of LCHE, based on the three sub-clusters of (i) Hospitality Establishments, (ii) Recreational Facilities and Instruction, (iii) Gifts and Souvenirs Retailing [
20], may represent a paradigmatic example among traditional sectors in which “the formation and development of a transformative activity” ([
13], p.1507) towards a transitional path [
56] is an S3 challenge. Finally, the cluster spatialization reveals some specific conditions of the LCHE physical configuration, following a pattern of settlement that is recognizable in other contexts in which tourism is a strong traditional sector (
Figure 4).
The highest density of establishments occurs in the zip-codes surrounding the downtown area, subsequent to the urban development processes deployed during the last two decades in the city (
Figure 2b), which experienced a revitalization process through the improvement of the Gaslamp district and the waterfront urban development projects. The area is characterized by the presence of a high number of hospitality establishments due to its specific location between the international airport and the city center. The distribution of the local clusters in the northern part of the city of San Diego is due to the presence of natural resources (coastal areas, natural parks) and amenities (public parks, attractions) such as the Balboa Park or the SeaWorld Park. The development of the local cluster in the southern part of the city of San Diego—including National City and Chula Vista, which are not part of the city of San Diego—is probably due to the proximity to the Mexico border and the city of Tijuana, which are particular attractive to international visitors.
In 2015, the San Diego county registered more than 34 million visitors spending more than
$9.9 billion [
54]. Although the wage level remained lower than the regional average in the past decade [
4], it increased by 14.92% during 2008–2014. The lower wage level is the result of seasonal or part-time employees, “who are just entering the workforce or are employed by more than one company” ([
54], p.12). However, despite the innovation capacity being a distinctive characteristic of traded clusters, the number of patents in the LCHE increased (+114%), as well as employment (+10.94%), job creation (+18.10%), and new establishment formation (+9.71%). Conversely, local-level based statistical analysis shows that the geographic area, in which local cluster hospitality is localized, registered the largest growth of population at risk of poverty. The poverty rate, in the area in which LCHE is localized, has been increasing over the years by 13.30%. In the San Diego region, despite the spur of continuous economic growth, concentrated poverty has worsened over the four years from 2010–2014 [
57]. High-income polarization is, in turn, statistically correlated to a set of factors such as diminishing private sector investments in commercial activities and less economic diversification, which in turn affects not only low-income households but also the consumers and as a whole affects the empowerment and development of local clusters. Considering the Location Quotient (LQ) as an economic indicator of clusters dashboard (
Table 1), the LCHE displayed a contraction of the 0.97%, in 2014. The decrease of the LQ value may depict a scarce propensity to employment concentration in favor of a spread territorial distribution.
Nevertheless, the strength of the specific local cluster selected together with the presence of the Hospitality and Tourism traded cluster reveals how the San Diego County regional economy is characterized by tourism-related activities.
3.4. The Dynamic SWOT Analysis Conceptual Framework
The D-SWOT Matrix, used for our purpose, employs its structure from an adaptation of the dynamic SWOT analysis proposed by Bezzi [
21] to evaluate the performance of a strategic program of public–private investment in a particular context. In an attempt to capture the relativeness among the elements building the SWOT, Bezzi [
21] carries out a comparison in pairs between the
n elements identified in the SWOT, regardless of the category to which they belong.
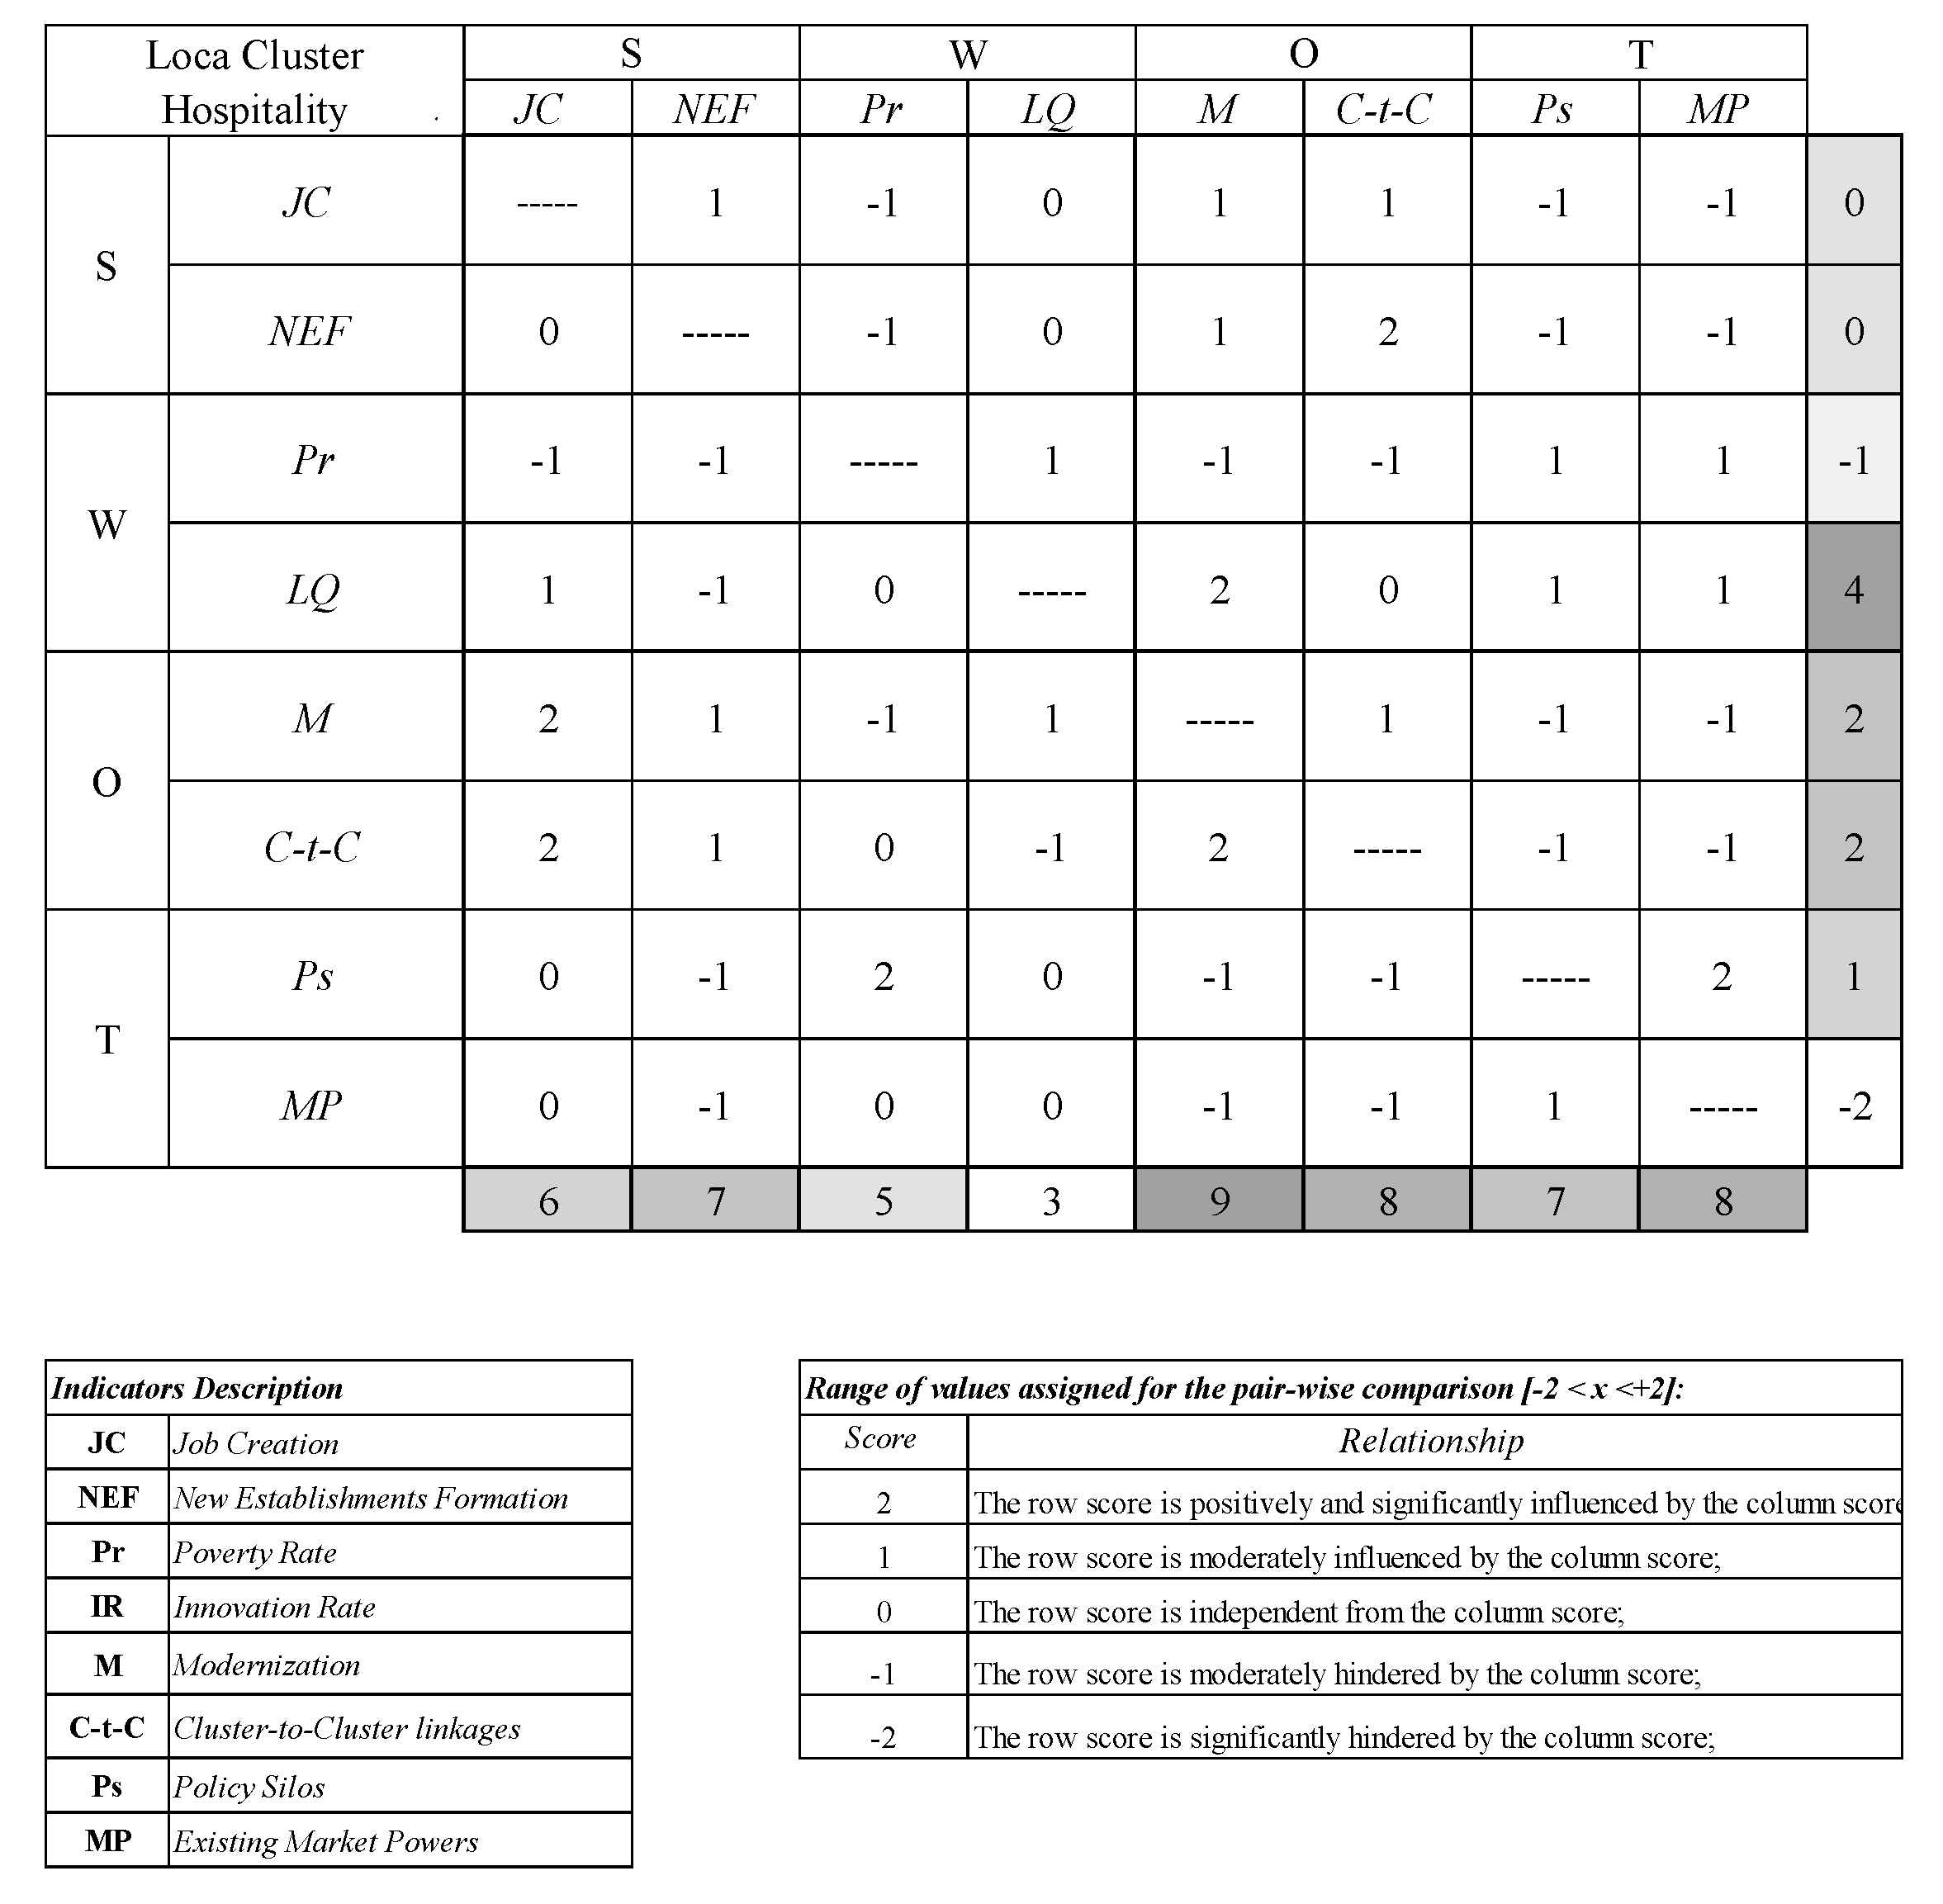
The comparison matrix allows the investigation of the nature of the relationship between selected indicators, determining whether a dependency occurs between the selected variables, or the level of influence exerted. The corresponding scores are commensurate to the weight unanimously assigned by a focus group to qualify the nature (positive versus negative) and quantify the intensity of the relationship (range of values −2 < aij < +2) among the n attributes included in the matrix:
The assigned values assume the following meanings:
−2 = the row element is strongly hindered, or even cancelled, by that of the column;
−1 = the row element is hindered by that of the column, nevertheless it is able to develop its effects, albeit in a reduced measure;
0 = the two elements are independent;
+1 = the row element shows increase in developing its effects due to the synergy achieved by the column element;
+2 = the row element achieves a remarkable increase due to the column element.
According to Bezzi [
21], the analysis per row displays the vectors related to the factors (internal and external) as dependent variables. They express their cogency and importance in light of the relationships with all the others. The totals per row show the “net” conditions of each case/factor, or their absolute importance, such as there are favorable or impeding conditions (Equation (1)).
Conversely, the analysis per column displays the vectors related to the factors (internal and external) as independent variables. They express their influence and the direction of the intervention in the light of the relationships with all the others. The totals per column reveal the conditions of each intervening factor or their absolute importance in acquiring the role of “moderator” (Equation (2)).
The application of D-SWOT consists of defining a set of elements able to explain the four categories: Strengths, weaknesses, opportunities, and threats related to the specific topic under assessment. Since there is not a one-to-one relationship between each row and column element, each element serves alternatively as a dependent and an independent variable.
Bezzi [
21] defines the D-SWOT matrix more closely to the evaluation of the relationships (dynamics) among the four categories (S, W, O, T) in a such a way to help the decision-makers in observing two different aspects:
The conditions of each case, in terms of absolute importance/cogency, towards analyzing by rows the response of relationships among the variables/indicators;
the ability to influence cases, towards analyzing by columns their influence and the direction of the intervention in the light of relationships with all others.
In this case, Bezzi [
21] suggests an algebraic sum, without considering whether they are positive or negative values. This analysis is essential to correct, if necessary, the strategic program, with alternative solutions concerning the identified moderators, to exploit the elements of strength and opportunity that in the previous analysis per row have slipped too low for their cause.
The D-SWOT matrix adapted for this study profiles the behavior of local clusters ([
6], p.18) related to two key factors:
Endogenous—marked as Strengths (S) and Weaknesses (W)—and
Exogenous—Opportunities (O) and Threats (T). These key-factors are supposed to highlight the relationships between the cluster business environment and the local economic system (LES). Using primary and secondary data, the investigation process has been organized as a squared Matrix, through which we can analyze the relationships (positive or negative) among the endogenous and exogenous factors.
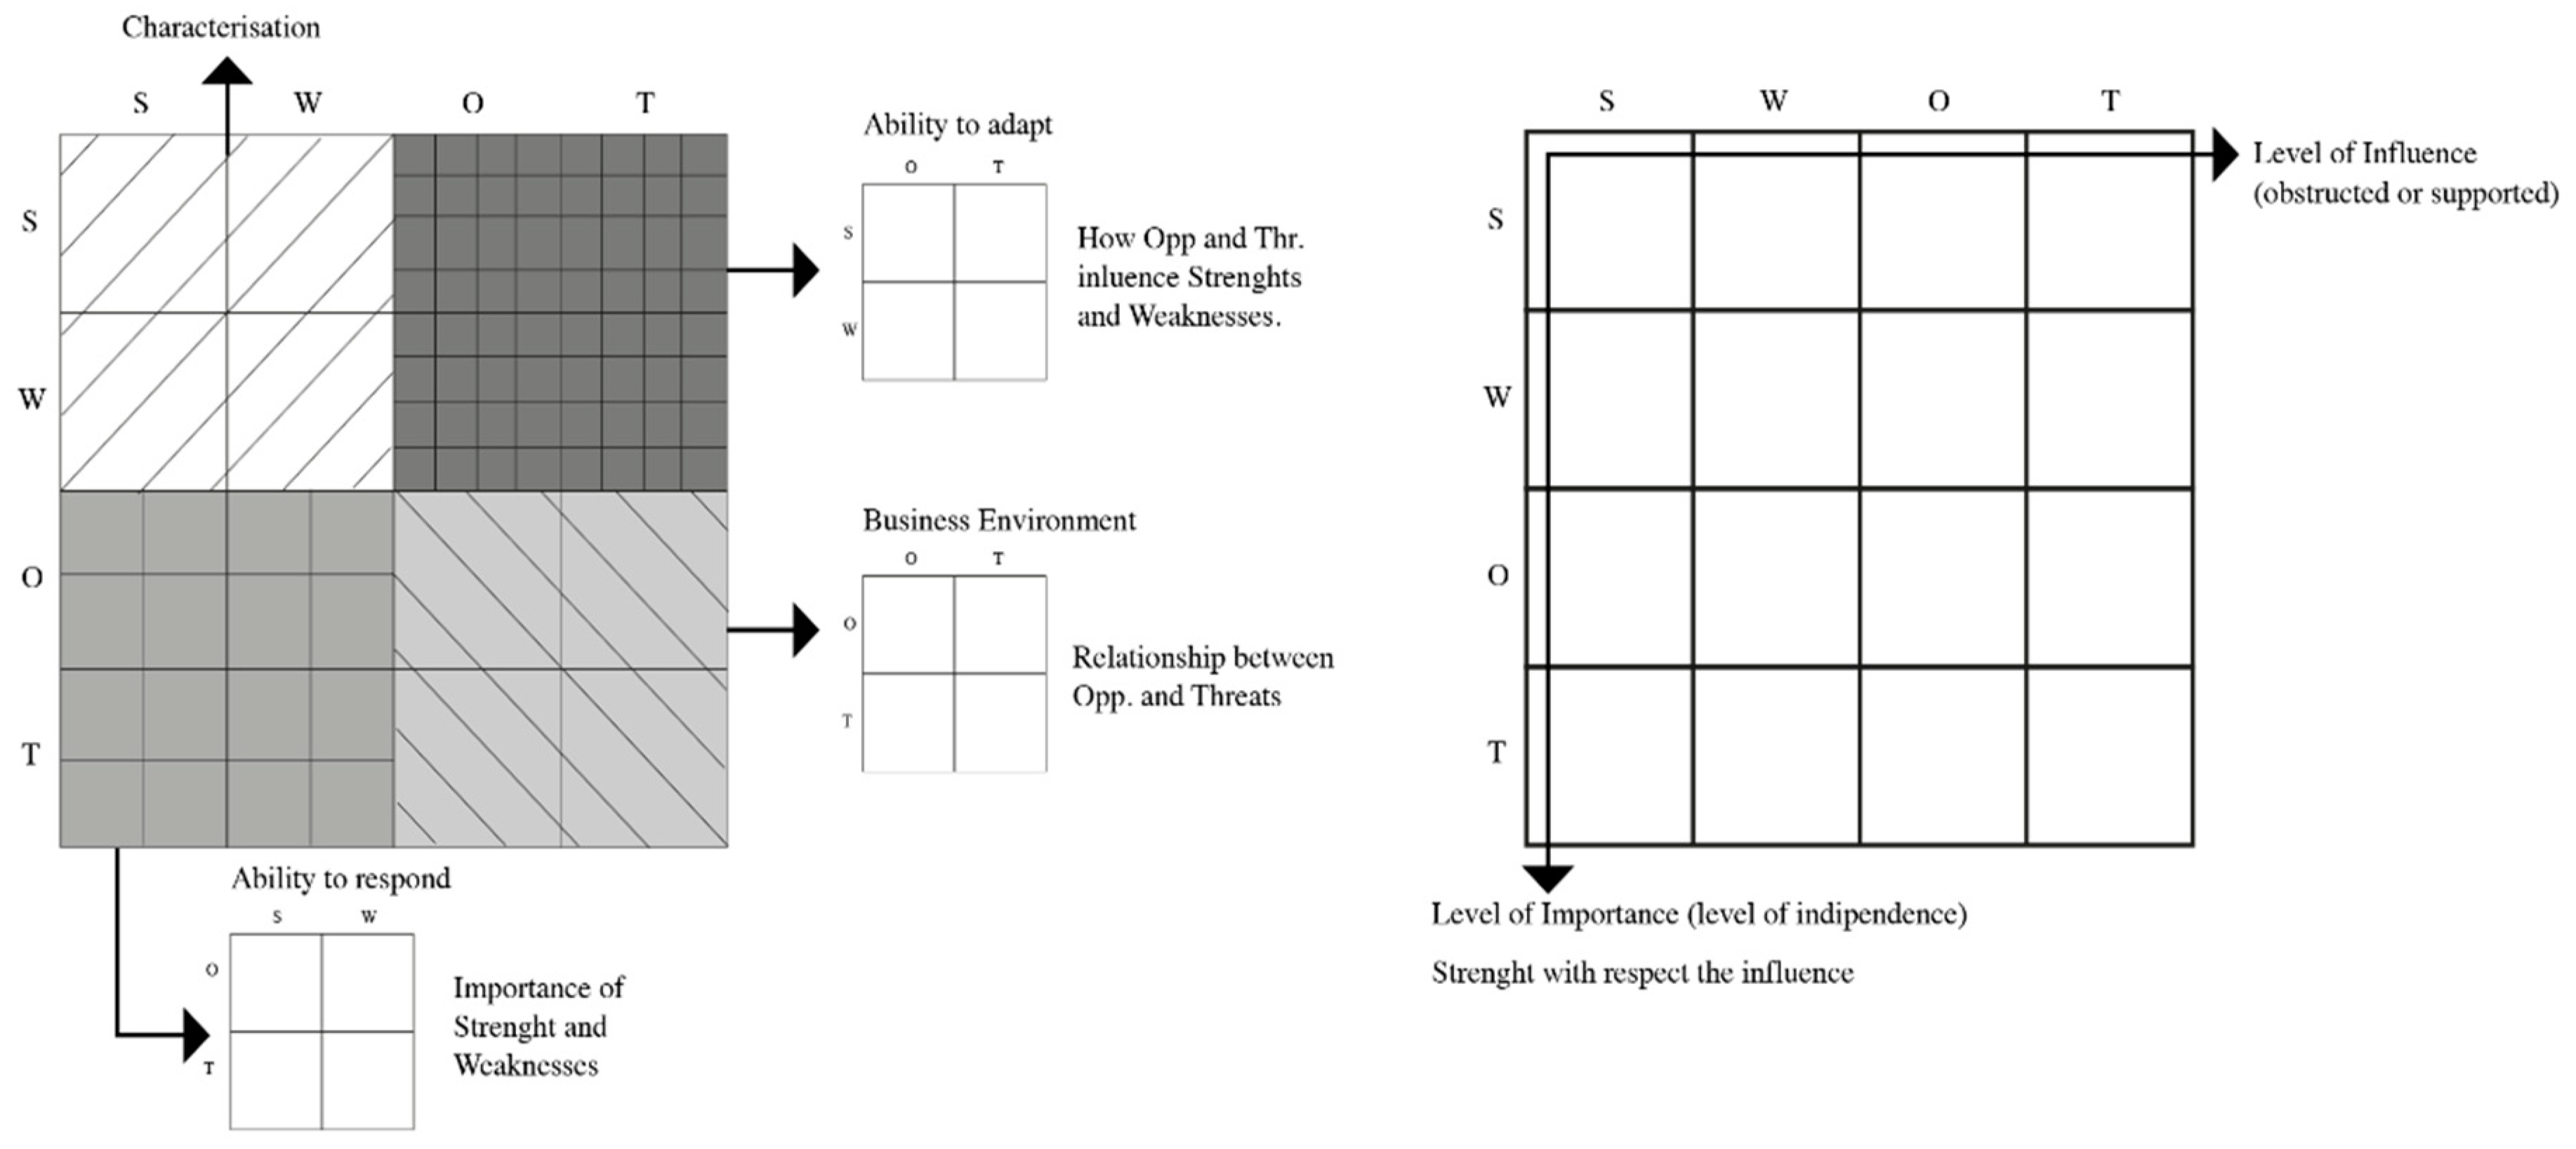
We further propose the D-SWOT matrix articulated in four sub-matrixes (
Figure 5) representative of the local cluster
Characterization, as a comparison among the structural factors characterizing the LC—endogenous variables, the general
Business Environment analyzed as a combination of factors deriving by the LES (threats), and the implementation opportunities provided by S3—exogenous variables. The dynamics between the first two submatrices discloses the adaptiveness ability, in terms of capacity to be flexible with respect to the changes, and the responsiveness processes—structural adjustments—in terms of reaction to the changes.
Albeit its qualitative line of inquiry and inherent subjective bias risk, a relational approach might yet lead the evaluator to a more credible/realistic understanding of some of the numerous conditions (and their interdependence) that matter for cluster development, and in turn for the competitiveness and prosperity of locations. Indeed, as found in the work on cluster development [
25], the determinants are specific aspects of the location such as specific qualities of the business environment, sector specificity as well as the long-term impact of specific entrepreneurial decisions by public and private sector leaders.
3.5. Endogenous and Exogenous Variables Identification
This section presents the four categories of selected factors that are considered in the assessment of the Local Cluster Hospitality establishment cluster. Endogenous factors, as the host of attributes that are directly and significantly influenced by variations in cluster-based firms’ agglomeration, such as productivity and specialization, or presence and strength of regional clusters. Conversely, exogenous factors are context conditions referred to the host of wider, global, or local circumstances that, as such, are thus independent of establishments density within a cluster, such as the federal tax policy and the education system [
4]. On the one hand, endogenous factors provide insights on the conditions that predominantly contribute, to varying degrees, to the current stage of development of the LCs analyzed below. Similarly, exogenous factors allow us to shift the focus on the complex set of industry-external circumstances that in a long-term perspective might both enhance efficiency growth at the cluster-level and alleviate income polarization effects at the cluster area of interest level and vice-versa. The regional economic system of San Diego is hence dynamically evaluated within the synoptic framework of the D-SWOT analysis. More specifically, while strengths and weaknesses incorporates attributes that are found as being the best predictors to the development of the Local Hospitality Establishment Cluster, opportunities and threats exemplifies both the most relevant challenges of clustering environment and the role-played by ameliorative strategies consistent with both the industry and the specific circumstance of the location (market-driven environment).
Such variables are adjusted upon the specific industry profile, based on the descriptive analysis of core economic performance data, to minimize the subjectivity bias which nonetheless any SWOT analysis is subject to.
The
Table 3 provides a synthesis of the comprehensive description including the source and the relevance of the selected variables, according to both the internal factors (strengths and weaknesses) and industry-external conditions (opportunities and threats).
3.5.1. Internal Factors: Strengths and Weakness
Job Creation. Among the best predictors of the growth of the Local Hospitality establishment industry in San Diego is job creation (JC), which indicates the absolute number of private jobs gained in the specific local industry of reference [
66]. Generally, strategies producing positive effects on the employment growth are related to tax credits, R&D, training programs, and the improvement of physical infrastructure. Properly designed strategies to increase job creation are those aiming at stimulating innovation, new-firm start-ups, and connecting the many factors influencing industrial agglomeration and regional growth [
67,
68]. Albeit the job creation is included in the cluster dashboard [
59] as an economic indicator of a specific cluster performance, it revels the regional condition related to the performance of the context as well [
50].
New Establishment Formation (
NEF). Defined as a single physical location where a given economic activity service is provided, the increase in the number of firms is widely acknowledged as a crucial element to investigate the clustering processes [
6]. Moreover, the attraction of specialized services or supply firms to the region, by making the latter more attractive, positively contribute to human capital and knowledge spillover, which are beneficial for other related firms [
33].
Poverty rate estimates by cluster’s geographical area of incidence (
PRj). By definition, the poverty rate reflects the share of the resident population whose income levels fall below the national poverty line [
67]. Growing inequalities and persistent poverty represent a major challenge in the U.S. and are deeply embedded in California. Despite the spur of continuous economic growth, the number of concentrated poverty neighborhoods in the San Diego region has significantly increased over the four years from 2010–2014 [
57]. Therefore, the poverty rate is conveniently included in the analysis of the weaknesses relevant to the selected cluster [
59].
Location quotient (
LQ): Employment-based LQ provides a measure of the concentration of the workforce employed in a particular industry in over the nation. It can reveal what makes a specific region “unique” in comparison to the national average [
20,
66]. The choice to take on the location quotients approach is convenient for this study for both data availability as well as for the considerable simplicity of the estimation which, however, provides an opportunity to gain insights of interest on the local industry composition [
69]. Nevertheless, the location quotient as an indicator of specialization shows much lower values for local clusters than traded. It is included among the weakness because it expresses the low tendency of specialization and leads into local characterization.
3.5.2. External Factors: Opportunities and Threats
The opportunities and threats come from observations on the cluster-specific business environment and from the discussion on the S3 rationale.
Modernization encompasses the development of specific applications of a general-purpose technology that produces a significant impact on the efficiency and quality of an existing (often traditional) sector [
15]. The aim is to act on those existing sectors and activities of the region’s economy, which best offer opportunities for achieving scale effects if they can better adopt and adapt to the newly emerging technological opportunities. In particular, to avoid bottlenecks in the value chains there is likely to be an emphasis on ensuring appropriate specialized skills training for the demands of the local activities [
14]. However, modernization is the expression of the opportunity that an “inclusive” innovation policy (S3, thereby) can offer via “an integrated vision of the transformative activity that must not focus only on the high-tech dimension of the structural change sought. The activity must also integrate actions that allow the adoption of high tech by the sector that will be a potential user” ([
56] p.826). According to Foray ([
13], p.1509), “as far as modernization of a traditional sector is concerned, this implies that the reality of innovation is not reduced to high-tech and cutting-edge research. In the realm of innovation, there is not only one game in town, in the sense of fundamental invention in a few key enabling technologies. Innovation is widely distributed over the whole spectrum of sectors (not just high tech) and invention processes (not only formal R&D)”. Based on the above considerations, the LHEC is representative of a traditional sector in which the interlinkages occurring among the sub-clusters’ structure depict the predominance of the sector less key-enable technology-oriented, namely the Hospitality Establishments (HE). The HE covers almost 85% of the employment and 90% of the specialization inside the structure of the LHEC. The other two sectors, Recreational Facilities and Instruction, and Gifts and Souvenirs Retailing share the rest: 9% and 1%, respectively, for specialization and 13% and 2%, respectively, for employment [
59].
Cluster-to-cluster linkages (inter-firm activities) is seen as an opportunity because it groups, in our understanding, the various forms of cooperation acting within clusters: Firm-to-firm, public–private, and intra-sectorial cooperation. These forms of cooperation could bring to the creation of new “emerging industries” [
7]. This process can contribute to the empowerment of cross-sectorial activities, competencies, and linkages [
7] favoring the emergence of new domains and market opportunities. According to the cluster dashboard provided by the US Clustermapping initiative [
59], the LHEC shows weak linkages compared with the whole networking system of clusters (
Figure 6) [
22].
Policy Silos refers to the scarce degree of integration of policies, strategic planning departments, and implementation tools, which could generate negative effects in terms of social investments affecting local development [
60]. Such fragmentation needs to be placed in a broader context and anchored in a policy framework that goes beyond a sectorial, geographical, and departmental “policy silos” pattern. The so-called cluster initiatives play the role over “orchestrating” [
61] the policy-mix, including “support to RDI, investment, training, the attraction of FDI and support to export” ([
62], p.14). The cluster dashboard [
59] offers a list of cluster Initiatives present against the context under observation, providing information on the connections with traded and local clusters.
For
Market Powers, most of the literature “has focused on Schumpeter’s 1942 position to understand whether a market structure involving large firms with a considerable degree of market power is the price that society must pay for rapid technological progress” ([
65], p.172). Understanding what society gains in the innovation backdrop and what it loses through high pricing and restrictions of output is a recurrent issue in the economics of antitrust enforcement [
65]. Conversely, some literature investigates “the paradox between the positive effect of industrial concentration on R&D spending and its non-positive effect on the number of innovations” ([
63], p.367). It is reasonable to argue that the industrial and regional innovation policies are strongly focused on adjustment (upgrade, reinforcement, refinancing) rather than structural changes. In these conditions, it a “noisy” restructuring process is observable, and the relatively strong regional lock-in can partly be explained by the mono-structure or one-dimensional market orientation. This is empirically explained by the lack of alternative industrial activities and by the specific characteristics of the leading industry, capital-intensive large enterprises, with the existence of only a few main actors in the region [
64] acting as a barrier to diversification. For our purpose, the market power may be described by the high predominance of one sub-cluster on others, hindering the spillover effect.
4. Results: Case Study D-SWOT Application
The set of indicators belongs to internal factors, both Strengths, and Weakness, and are measured according to the available data of the Census Bureau from 1998 to 2014. The corresponding scores assigned to qualify the nature (positive versus negative) and to quantify the intensity of the relationship within the range of values −2 < aij < +2 come from the application of linear regressions that can show relationships between a pair of variables at a time and how one can impact the other.
The linear regressions are built in such a way to avoid symmetric results since the purpose does not deal with predicting one variable from the other. More precisely, the corresponding scores are attributed only per row with the meaning of how much the row element is influenced by the column one, according to the following:
Consequently, the dependent variables are represented by the values of the selected indicators, the predictors are represented by the delta variation over time. Considering, for example, the first element of the matrix, Job creation JC/Establishment formation NEF, the model assumes
Y = JC and
X = the change over time of NEF. Conversely, the second element of the matrix leads to assumes
Y = NEF and
X the change over time of JC. The coefficient of each model is translated in gradient to rescale the influence level into the range −2, +2. (
Figure 7). The zero is explanatory of the absence of a statistically significant relationship: when the model reveals no correlation, and when the level of regression line elasticity is low, as the expression of the low significant influence.
The set of external factors, as indicators for Opportunities and Threats related to the S3 policy package, derives from the literature review above drawn up. Accordingly, the corresponding scores assigned to qualify the nature (positive vs. negative) and to quantify the intensity of the relationship within the range of values −2 <
aij < +2 combines, in qualitative terms, the likely significance of relationships in identifying a conceptual proxy variable for each factor (
Table 4).
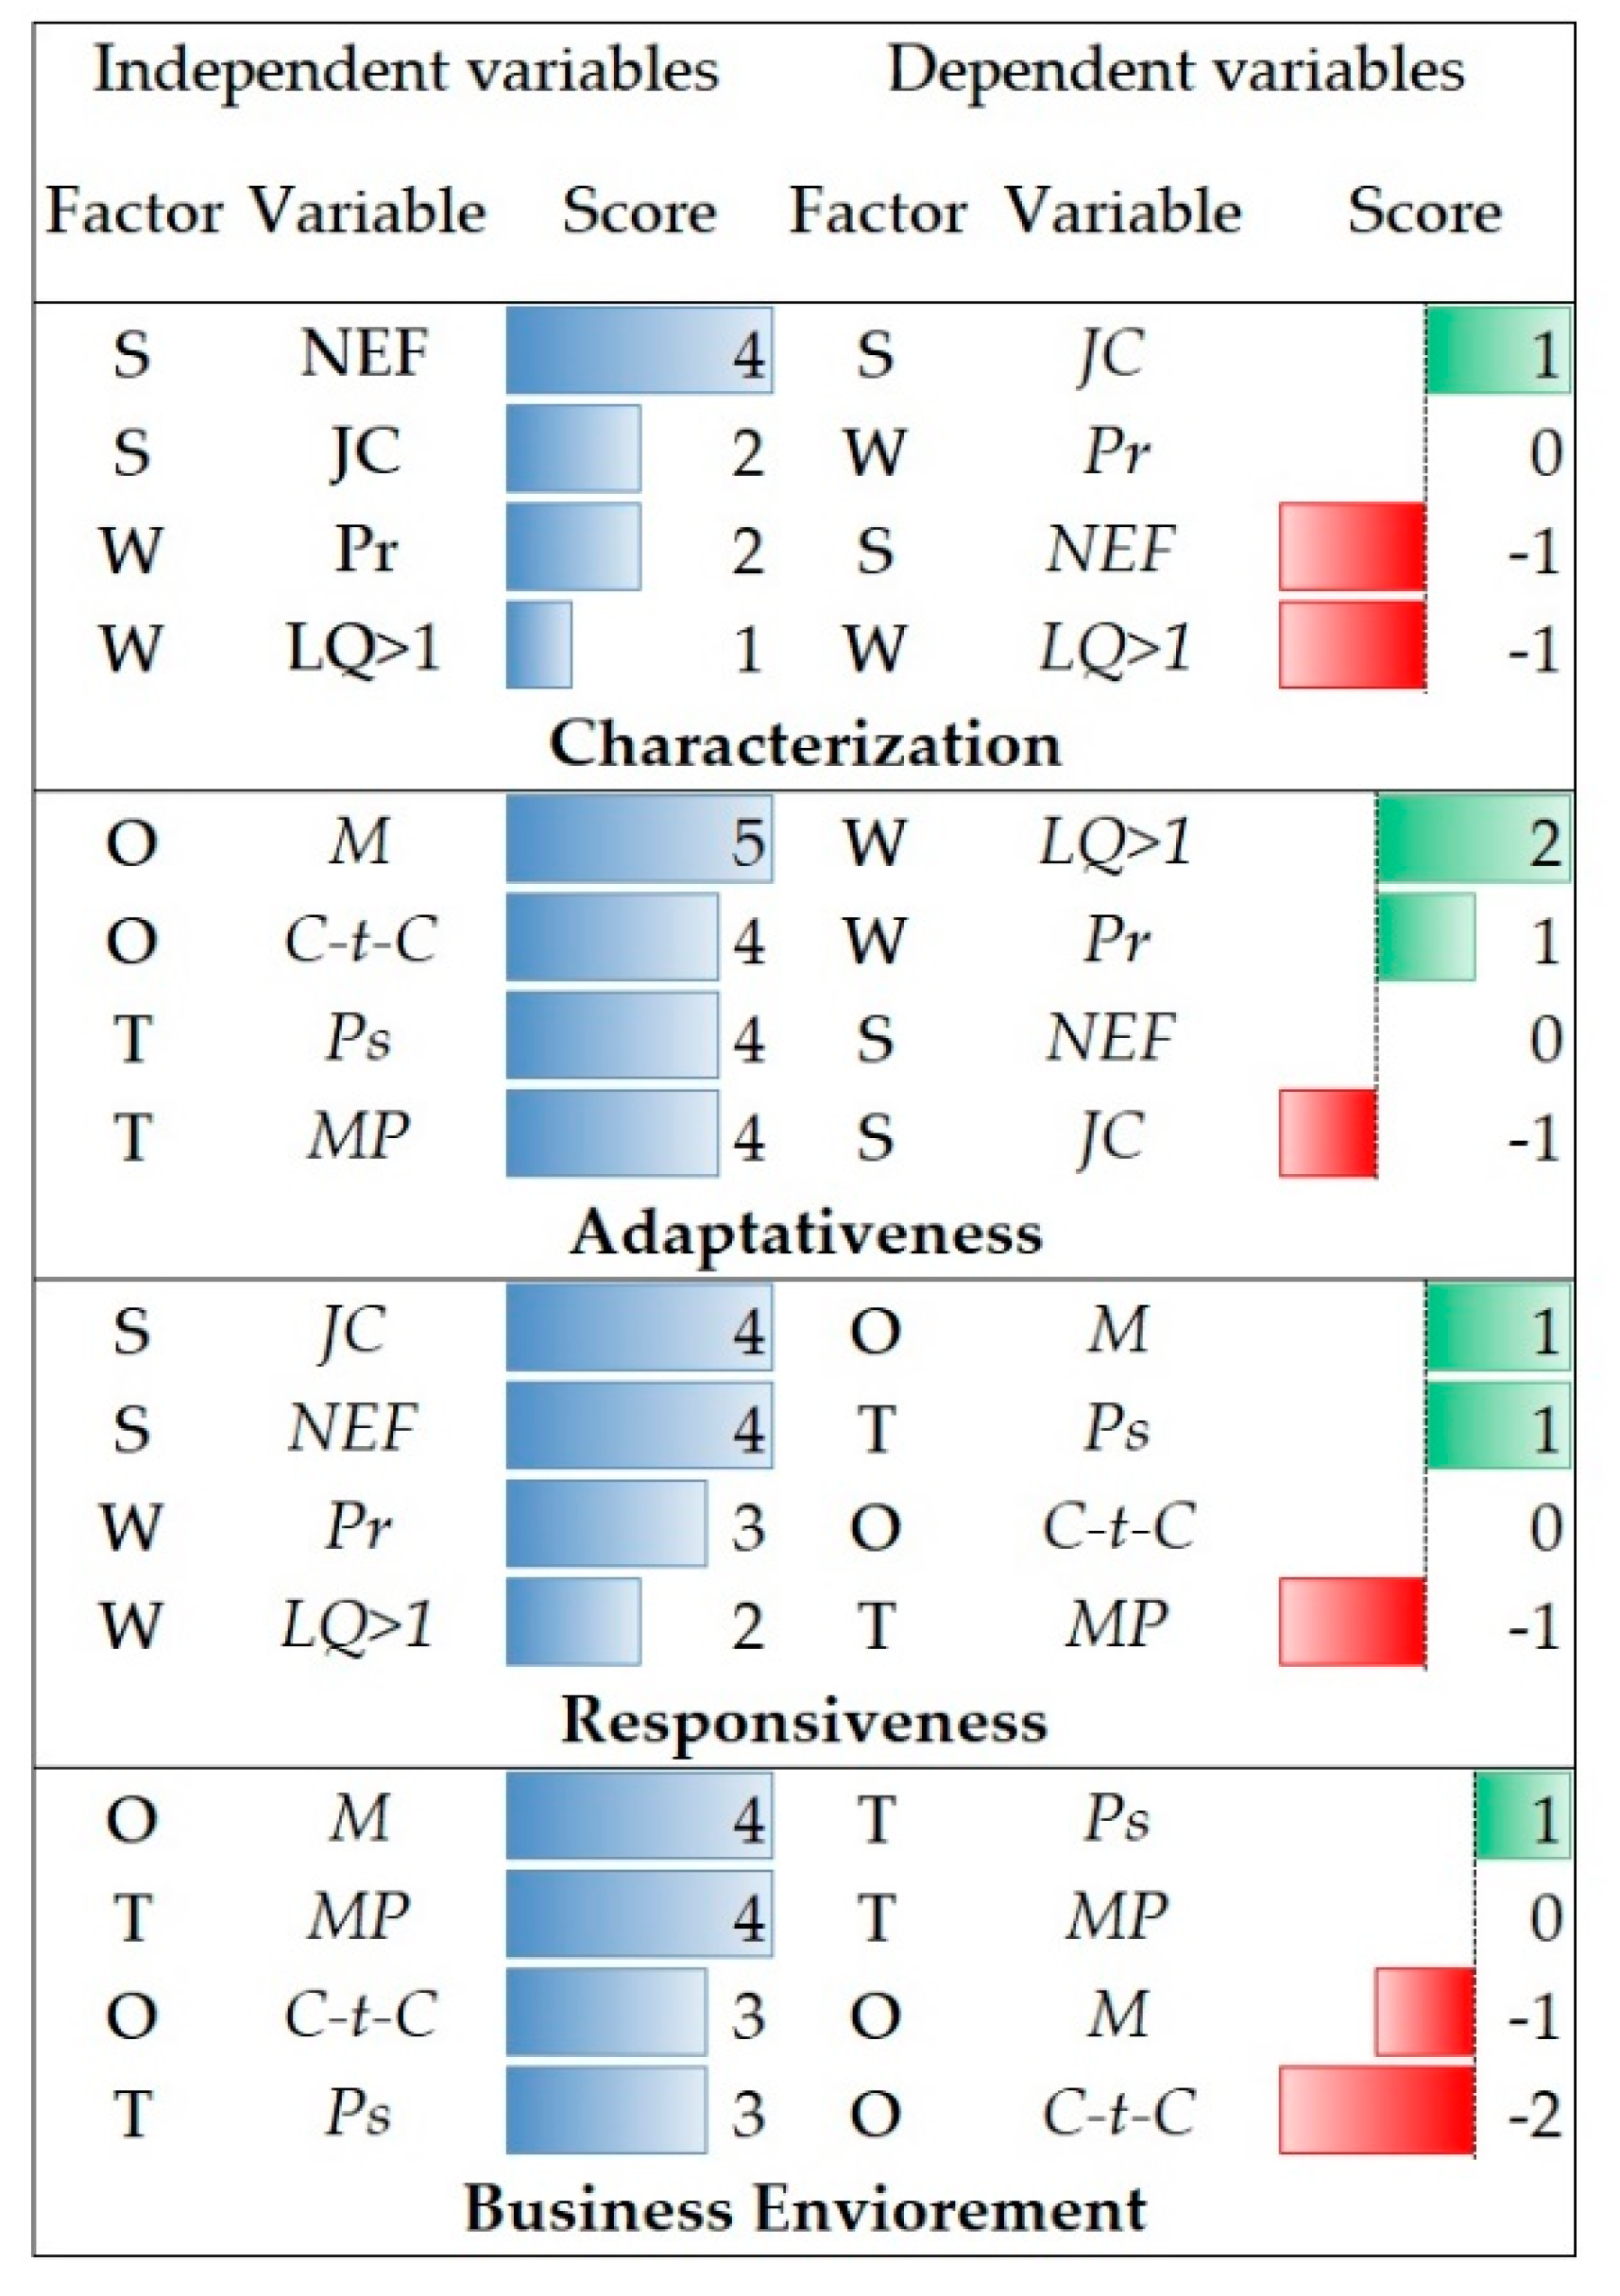
The matrix (
Figure 8) displays the overall results of the D-SWOT application. The
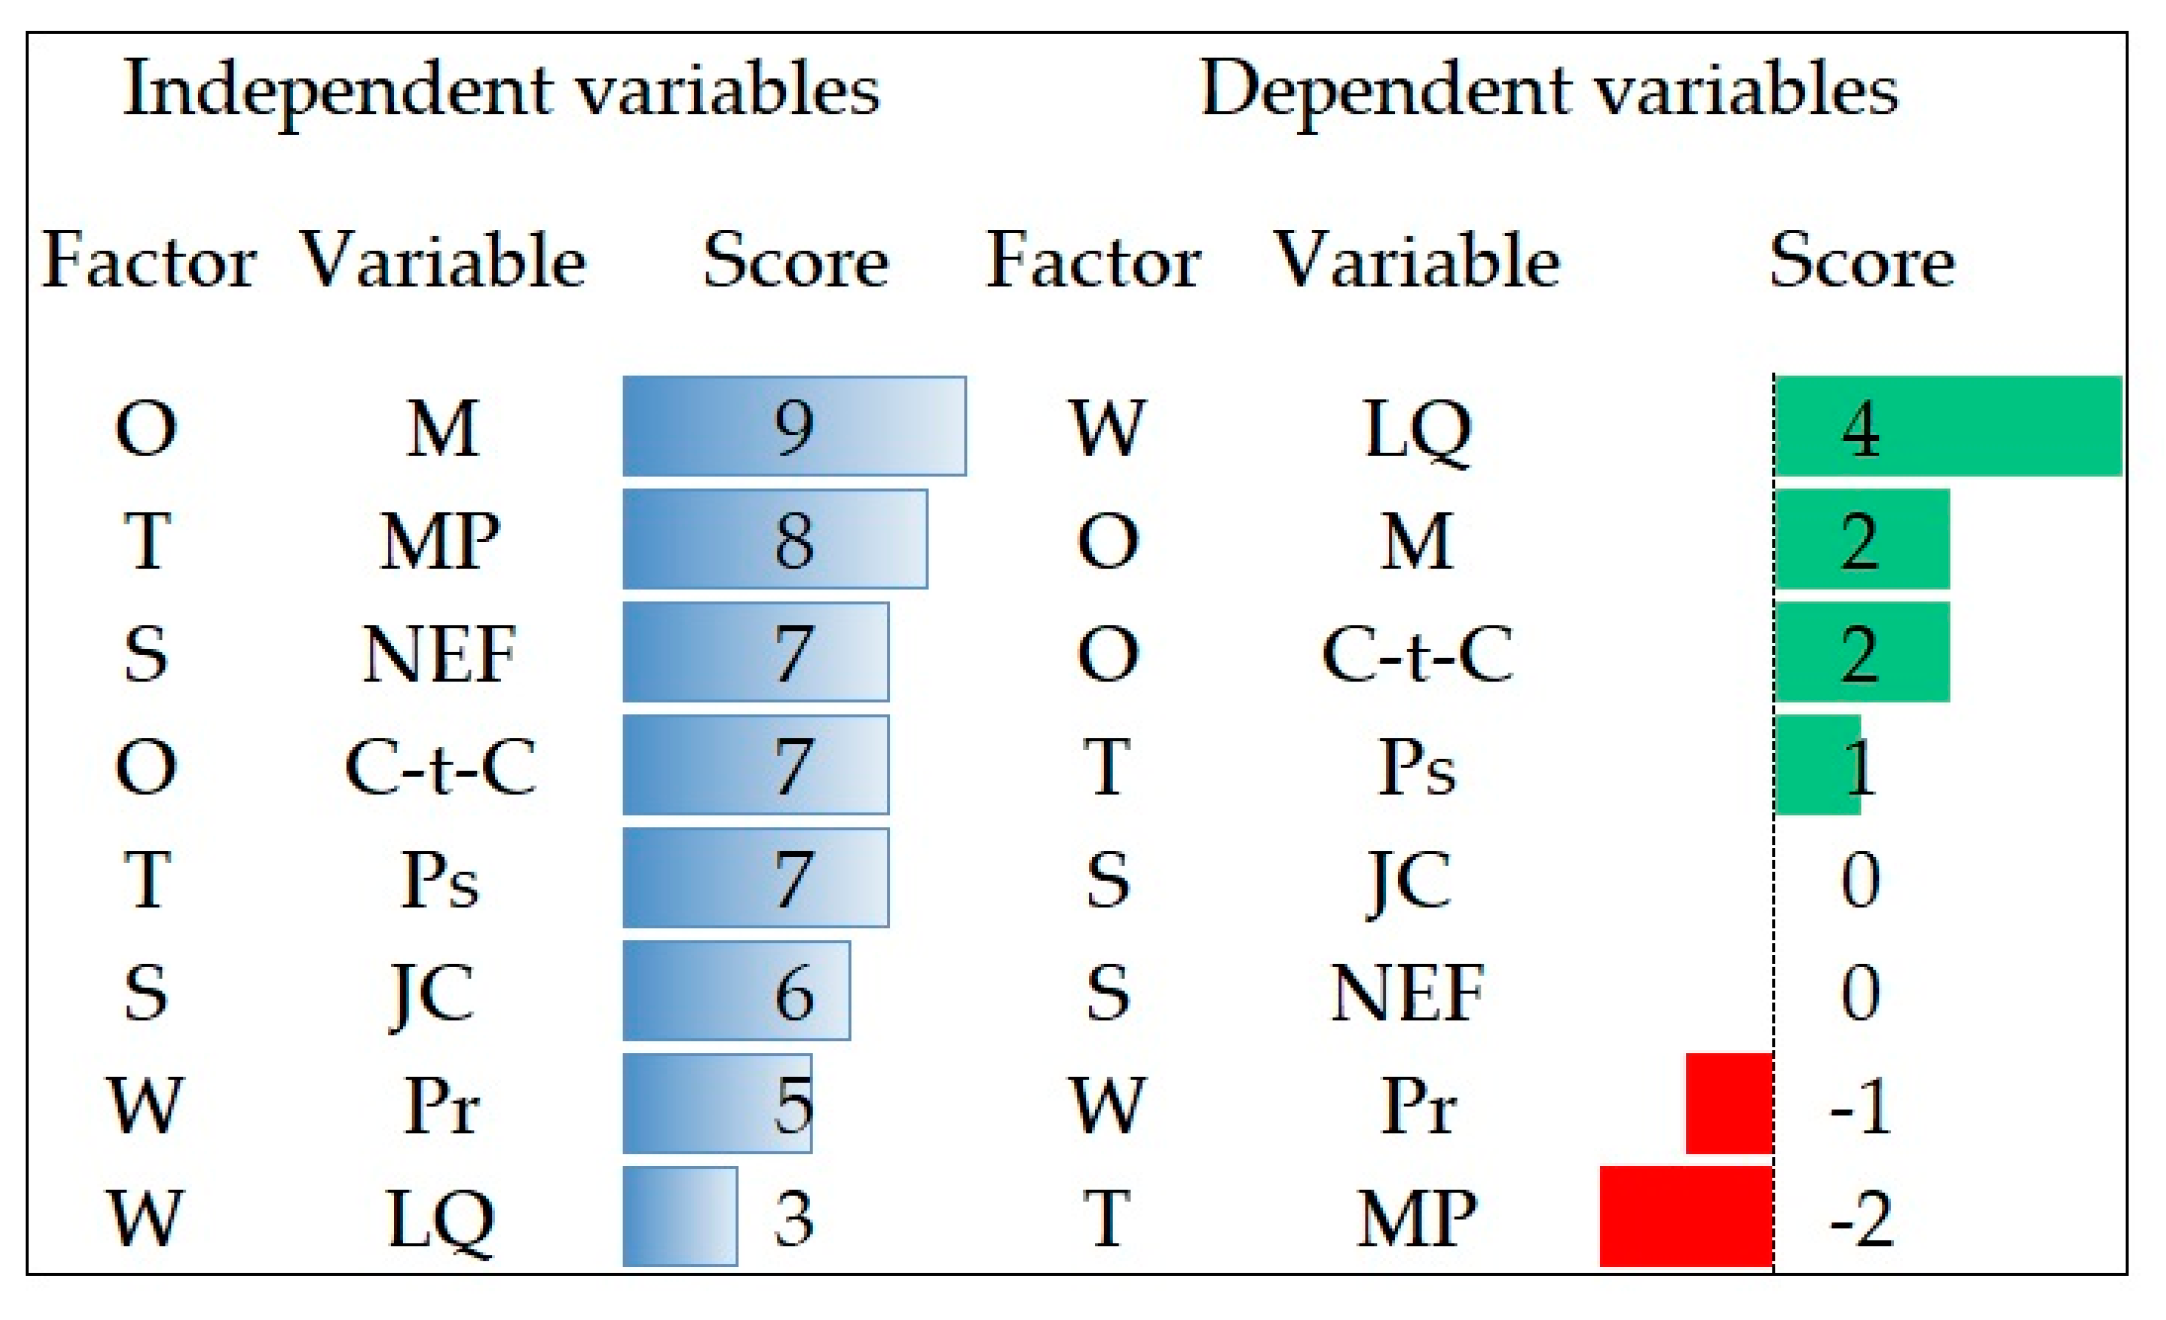
Figure 9 shows the totals per row and per column arranged in an ordered list, from the highest to the lowest score.
The results demonstrate a positive response to the opportunities related to the S3 block (
Figure 9). They suggest that the presence of existing local clusters needs to be empowered by modernization and cluster-to-cluster linkages through the transformative activity [
13]. Nevertheless, the results highlight Market Power as a strong negative moderator, hampering the diversification process that is considered relevant to S3 implementation. Further studies may better explain this likely risk in designing S3 policy for regional economies characterized by traditional sectors [
13] and a significant gap between the dynamic and non-dynamic part of its context [
6].
Following the specific implications of these findings, indeed, the factors most relevant to characterizing the local cluster under observation, namely, Job creation and New Establishment Formation, are not influenced by the so-called “moderators”, independent variables of the matrix. Conversely, the two factors that characterize the cluster by the relatively weak role they play, location quotient and poverty rate, are contrastingly influenced. The location quotient is hindered considerably, confirming the likely negative effect of market power on the innovation intensity [
62], and the poverty rate, instead, marks a moderate influence in the reduction of its weakness role, probably endorsing the role of NEF as a positive moderator [
51,
54].
The main relevant result remains the controversial effect of market power on S3 mechanisms in underpinning the design and implementation of transformative activity (M) in specific contexts, such as it arises from the analysis of the sub-matrices (
Figure 10).
Adaptiveness and responsiveness may explain the factors related to the “transitional path” [
13] as “the formation and development of a transformative activity” [
13] with the objective of a structural change, namely the modernization of a traditional sector [
13]. Both sub-matrices point out how Modernization may be hampered by Market Power properly in a traditional sector like Tourism with a low propensity to specialization.
6. Discussion and Conclusions
The D-SWOT analysis application has been tested in an explanatory case study in the form of “process tracing as an operational procedure for attempting to identify and verify the observable within -case implications of causal mechanisms and defines causal mechanisms” ([
73], p.5). The aim was to explore local industries that may respond to the S3 rationale in terms of inclusion policies of the emerging product activities and less integrated sectors [
13]. The analysis substantially intended to demonstrate three relevant aspects: (i) The hypothesis of LES as a synergetic structure of complex relationships in which all activities must be integrated to gain a factual development, (ii) the S3 approach carries out a key role to generate interrelations within LES, and (iii) the LCs may play an important role in the building-blocks of S3, such as structural preconditions to create local networks for boosting economic integration within the region.
The Local Cluster Hospitality Establishment in San Diego was selected as a single significant, critical, and high-impact case, according to the hypothesis set. We proposed a potential framework of endogenous and exogenous factors in disclosing the main aspects of the cluster-based literature connected with the operationalization of S3 (
Table 3).
The analysis explained the structural correlations among the key socio-economic indicators (job creation and poverty rate) and the pivot element of the S3 policies (Modernization and Cluster-to-cluster relations). The results, especially those related to the Business Environment matrix, converged in highlighting how central could be some dominant elements within a region (Market power and Policy silos) to annihilate the rising activities, in which the seeds of innovation are often enclosed. Following the implication of the case study analysis, we can argue that local clusters can respond and adapt to the exogenous challenges if operating under a policy framework aiming at combining competitive (micro-level) and structural (macro level) approaches [
32], against the regional disparities that narrow market-oriented policies may generate. We argue that the implementation of smart specialization strategies offers a range of advantages for the development of local economic systems—which are seen as particularly resourceful in the case of non-core or lagging regions [
5,
68].
Moving towards the transformative activity advanced by Foray [
13] in underpinning the modernization process of traditional sectors, the D-SWOT analysis provided intriguing clues (
Figure 9 and
Figure 10). The decoupling between the Market Power and the Modernization (transformative activity, thereby) causes a specific type of transitional failure, which to some extent involves the clustering process depending on the transformative activity in expanding innovation [
74]. The analysis of both the overall matrix and its configuration in four submatrices has unveiled the controversial aspect of innovation development and market power. Despite that the experimental study employed a restricted set of factors, significantly alike, the findings seem to introduce again into the political agenda the consideration of the effects rising from the “relation between market structure and innovation” ([
63], p.367). Wolman and Hincapie ([
8], p.137) reported as an example “of proximity-based agglomeration economies, such as “increased market power through brokered buying and selling, the better availability and use of specialized repair facilities, shared infrastructure, reduced risk and uncertainty for aspiring entrepreneurs, and better information.” Still, Vesson ([
63], p.368) pointed out that “while industrial concentration is generally found to have a positive effect on R&D spending, its effect on innovative output is mostly found to be non-positive”, highlighting “the paradox between the effects of industrial concentration on R&D and on innovative outputs, and the possible different effects of concentration on small and large firm R&D”. Accordingly, the market power effects on innovation expansion are now receiving attention in academic debate, principally in the US context where this backdrop is perceived as an emerging barrier to innovation development [
65,
74,
75,
76].
In aiming to disclose indicators more useful in evidence-oriented policy implementation, the study developed a conceptual framework toward the challenging issue of S3 operationalization. The RIS3 design phase implies the acknowledgment of regional sources through the identification of existing domains or fields where regions hold unique competitive advantages. The findings highlight the correlation between key socio-economic context indicators and S3 crucial policy elements, pointing out the LCs factors that may be taken into account and enhanced by policy-makers in the design, implementation, and monitoring of the S3 policy framework.


