Stock Market Integration of Pakistan with Its Trading Partners: A Multivariate DCC-GARCH Model Approach


1
College of Finance, Nanjing Agricultural University, Nanjing 210095, China
2
School of Business Administration, Shaheed Benazir Bhutto University, Shaheed Benazirabad, Nawabshah 67450, Pakistan
*
Authors to whom correspondence should be addressed.
Sustainability 2019, 11(2), 303; https://0-doi-org.brum.beds.ac.uk/10.3390/su11020303
Submission received: 27 November 2018
/
Revised: 19 December 2018
/
Accepted: 29 December 2018
/
Published: 9 January 2019
(This article belongs to the Special Issue Sustainable Financial Markets)
Abstract
:A decade after the global financial crisis, the developments in stock market integration have increased the stability and liquidity of markets, and decreased the diversification benefits for investors. International trade is an important determinant of stock market interdependence. The objective of this study is to analyze the co-movements and the portfolio diversification between the stock markets of Pakistan and its top trading partners, namely China, Indonesia, Malaysia, the United Kingdom, and the United States. We employed Dynamic Conditional Covariance (DCC)-Generalized Autoregressive Conditional Heteroscedasticity (GARCH) methodology with student t-distribution to examine time-varying correlation and volatilities of stock markets of Pakistan and its trading partners. We used Morgan Stanley capital international (MSCI) daily returns data of developed and emerging markets for the period 2005 to 2018. The results of the study highlighted that stock markets of Pakistan and its trading partners were closely integrated during the financial crisis of 2008, while the integration among stock markets decreased substantially after the period of financial crises. Furthermore, the results showed the slow decay process. Therefore, it is a positive sign for the Pakistani and international investors to diversify their portfolio among the stock markets of Pakistan and its trading partners.
1. Introduction
Trade and financial linkages are known to be important determinants of international stock market integration [1,2,3]. International stock markets have become more interconnected over time [4]. A high level of integration has reduced the benefits of portfolio diversification among developed markets, and therefore the investors moved their investments from developed to emerging markets [5]. The analysis of the degree of international stock market integration has attracted a great deal of interest. Various researchers have tested the integration between the markets using new techniques [6]. Still, the literature has a gap for new studies on the combination of developed and emerging markets with portfolio diversification benefits [7]. Trade plays a fundamental role in the linking of Pakistan with other countries. In this study, we selected the stock markets of the important trading partners of Pakistan. Interestingly, the top trade partners of Pakistan include both developed and emerging countries, which have a low integration among themselves, therefore such a portfolio can benefit portfolio investors.
The term “stock market integration” refers to an area of research in financial economics that covers many aspects of interrelationships between stock markets. Integration of financial markets is also described as “co-movement”, “synchronization” or “correlation” [8,9]. Stock market integration brings unification between the markets and reduces frictions. Globalization has played its role in increasing cross-border trade and capital flows by easing the barriers, due to which markets have integrated [10,11]. However, modern portfolio theory [12] suggests the investors find less integrated markets optimal for risk-adjusted returns. Therefore, from the investors’ viewpoint, market integration reduces portfolio divarication opportunities. Due to the unification of markets, the shocks originating in one market are more quickly transmitted to other markets, increasing the risk of contagion [13]. For example, The Global Financial Crisis (GFC) of 2007–2008 which started out in one sector of the US economy rapidly turned into a global crisis due to the interconnectedness of markets [14]. However, investors could gain portfolio diversification benefits by monitoring volatility and linkages among stock markets [15].
The GFC of 2007–2008 severely affected the global financial markets. With the outbreak of GFC the KSE-100 index lost 55 percent of its value. To control the worsening situation, the floor of Karachi Stock Exchange (KSE), was fixed for about 110 days [16]. The investors in Pakistan lost trust and a major capital flight was observed in subsequent days. After the GFC, three stock exchanges of Pakistan, namely, KSE, Lahore stock exchange (LSE), and the Islamabad Stock Exchange (ISE), went through major structural changes towards financial openness to encourage local and foreign investment. In 2015 three stock exchanges of Pakistan were integrated to form Pakistan stock exchange (PXE). As a result of this, PXE emerged as one of the best-performing markets of Asia in the year 2016. PXE was classified as an Emerging market (EM) by Morgan Stanly Capital International (MSCI) and the International Monetary Fund (IMF) in 2017 [17]. In 2017, the KSE-100 Index again dropped and posted a negative return of 20% in US dollar terms. This year was the worst for the PXE since the financial crisis which enveloped global equity markets in 2008 [18]. Investors avoided fluctuation in local stock markets by investing internationally [19].
According to studies conducted by Abdul Karim and Shabri Abd. Majid [20], and Paramati, et al. [21] trade between two counties is an important factor for long-term relationships between stock markets. Therefore, this study aims to analyze the integration of Pakistani stock markets with its trading partners. This study provides insight into a valuable combination of stock markets for portfolio investment based on the trade relationship. This study discovers a new horizon which is appealing for investors by which they can maximize portfolio return. Finally, it is also important for policymakers to understand the dynamic relationship of Pakistan with its trading partners. To the best of our knowledge, no prior study has been conducted with advanced techniques by taking into account the time-varying volatility and correlation among the selected markets. In this study, we tried to fill the gap in the empirical literature by determining the stock market integration of Pakistan with its trading partners. The present study systematically analyzes the short-run dynamics in a time-varying framework of this interdependence. Furthermore, we employed the dynamic conditional correlation-generalized autoregressive conditional heteroscedasticity (DCC-GARCH) model [22] to determine time-varying volatilities and correlation between stock markets.
The rest of the paper is structured as follows. The second section provides a review of the literature about the integrations of stock markets. The third section entails the data sources and empirical models. The fourth section describes the empirical results of the study. The last section concludes the study.
2. Review of Literature
The study of existing volatilities and correlations among the assets is the fundamental consideration for the investors. They prefer security portfolios with low risk and high returns. Fundamental modern portfolio theory [12] suggests diversifying the portfolio to reduce the risk. The concept of portfolio diversification was further strengthened by Grubel [23], who suggested diversifying the portfolio to international markets with a low correlation among them. Researchers have explored several combinations of the stock markets around the world. These studies found different levels of the relationship between international stock markets. These studies have focused on countries of different trade blocks or regional blocks.
The literature shows advantages as well as disadvantages of market integration. The integration of markets brings unification in the markets for investors; the market integration decreases the diversification benefits. Ferreira [24] states that market integration has a positive impact on the growth of the economy, and overall welfare is increased due to better allocation of household savings. Nonetheless, if capital inflows due to the integration are not properly allocated, market integration could cause financial instability and the growth is not achieved, and the risk of contagion is also increased due to market integration. Moreover, a common disadvantage found by researchers of stock market integration is that the increasing integration among the stock markets has decreased portfolio diversification benefits for investors, especially after the GFC [25,26].
The literature discloses that there are several determinants of international stock market integration. Some of the studies found trade linkage of countries as the most significant determinant of the mutual interdependence of stock markets [3,9,27,28]. Conversely, studies conducted by Gupta and Guidi [5] and Elyasiani, et al. [29] stated that bilateral trade does not affect the stock market synchronization between countries. Due to the increasing trade relationships among countries, empirical studies have again attempted to investigate stock market long-run relationships between trading partner countries, but these studies are limited to a few countries.
There is an extensive literature available on stock market integration between different regional and international markets. We mainly focused on studies based on the trade relationship from different parts of the world. Paramati, et al. [30] studied the stock market relationship between Australia and its trading partners. They used cointegration, asymmetric dynamic conditional correlation-generalized autoregressive conditional heteroscedasticity (AGDCC-GARCH), and multivariate regression models. The study found strong cointegration and correlation between Australia and its trading partners’ stock markets. Another study investigating the stock market relationship between China and Australia based on the trade linkages also found that trade relationship positively influences the stock market relationships between two countries. This study made use of ordinary least squire (OLS), dynamic OLS (DOLS), and fully modified OLS (FMOLS) models.
Moreover, Paramati, et al. [21] examined the relationship between the stock markets of Australia and its trading partners. To access the effect of trade intensity, they classified Australian trade partners into the major, medium, and minor trading partners. They examined the effect of each category of trading partner’s trade intensity separately. Results of the study revealed that trade intensity has no effect in the long-run on the relationship between markets. Results also showed that Australian stock markets were more integrated to developed countries as compared to less developed countries. Furthermore, during the global financial crisis, the level of integration of Australia with its partners increased, and was highest during the GFC, compared to pre- and post-GFC.
Furthermore, Vo [31] investigated trade and financial integration among Asian countries. The bidirectional causality was found generally among the selected markets. Results revealed that trade and stock markets affect each other in Asian countries. Dhanaraj, et al. [32] found that the integration of macroeconomic variables in newly industrialized Asian countries does not cause integration of their stock markets. Results showed that an increase in bilateral trade intensity does not increase the stock market integration. They estimated forecast error variance decomposition (FEVD) using the vector autoregressive (VAR) model and the macroeconomic variables were regressed on FEVD using time series regression. In a detailed study conducted by Vithessonthi and Kumarasinghe [33] used stock market prices data from 15 countries for 28 year period concluded that financial development of a country supports the stock market integration, while bilateral trade integration of a country does not affect its stock market integration with other countries.
Thuy bich nguyen and huynh lam [34] considered the relationship between Vietnam and five Asian countries to access the stock market integration. This study found a positive effect of financial integration on the stock market integration. The study used fixed and random effects models. Abdul Karim and Shabri Abd. Majid [20] selected the major trading partners of Malaysia to analyze short-term dynamic relationships and connectedness of stock prices. They applied the Autoregressive Distributed Lag (ARDL) model using weekly stock prices for a period of 16 years. These stock markets were found to be integrated and a positive effect of bilateral trade was found by the study. Similarly, Abdul Karim and Abdul Karim [35] studied the integration of the Malaysian stock market with its trading partners by using Vector Error Correction Model (VECM) and Granger causality tests with weekly data. They supported the idea that stronger trade ties the stock market integration between the countries.
In the North American Free Trade Agreement (NAFTA) region, Daelemans, et al. [36] uniquely examined the effect of the free-trade agreement on the volatility of stock market returns and exchange rate fluctuations. The free-trade agreement had reduced the volatility of returns and increased the exchange rate fluctuations between the US and Canada. In the case of Mexico, both the volatility of returns and the exchange rate were high. In Latin America, [24] studied the stock market integration between Portugal and Brazil amid increasing trade and investment between them. The author used non-linear methodologies such as detrended fluctuation analysis (DFA), detrended cross-correlation analysis (DCCA), and detrended moving-average cross-correlation analysis (DMCA). This study found that the stock market integration between two economies increased over the period and the economic crisis decreased the stock market integration. Chiou [37] mentions in his study that investors from Latin American countries could benefit more from international diversification as compared to the investors of the other developed countries of the study during the study period. However, the diversification benefits decreased due to the global financial crisis and the increased integration among the selected markets also. Panda and Nanda [25] examined the connectedness among the stock markets of the Latin American countries. They found an increasing connectedness among the countries with the passage of time. The study further disclosed that the asymmetry among the highly integrated markets was relatively less than the markets with low integration.
In the above review of previous studies, we found that there is stock market integration in most cases. Bilateral trade has an impact on stock market integration in the case of developed countries such as Australia. In the case of emerging economies, integration among stock markets and the impact of trade intensity on the stock markets is lower. Few studies are found from the literature which analyzed the relationship between stock markets in the context of emerging and developed countries based on the trade relationships. Therefore, we expect that a low level of integration could be found in the case of emerging and developed countries thus creating an opportunity for the investors. A summary of important empirical studies of stock market integration is shown in Table 1.
3. Data and Methodology
The aim of this study is to investigate the correlation of stock market of Pakistan and its trading partner countries to access the diversification benefits. Stock return series are time-varying, both intraday and across days. In light of this fact, application of models assuming time-invariant conditional variances is inappropriate [44].
3.1. Data
We selected the sample of 6 developed and emerging countries comprising of Pakistan, and its major trading partners namely China, Indonesia, Malaysia, US, and the UK. We collected the daily data of MSCI indices for these countries from DataStream database for the period from January 2005 to October 2018. The stock price indices are expressed in US dollars to avoid exchange rate fluctuations. We calculated the stock returns of these stock price indices and converted into natural log form for further analysis. The Logarithmic return series are calculated by using “first difference of the logarithm” function (dlog) in Eviews 10. The selected indices, symbols used for them, and their MSCI status are shown in Table 2.
3.2. Methodology
The analysis of volatility and correlation of assets have been the central point of discussion in portfolio management. The literature of stock market correlation shows that the methodologies applied vary with the available data and objective of the study. Studies on stock market integration used various Econometric tools like Correlation, VAR, VECM, Gangers causality, Impulse response, and GARCH model to study the relationship between different markets [43,45]. However, the GARCH family models have been extensively used by the studies besides the other methods.
The introduction of ARCH model [46] paved the way to the development of Generalized Autoregressive Conditional Heteroscedasticity (GARCH) model [47]. The univariate GARCH model assumes volatilities constant over the period among variables. It does not capture correlations among multiple time series [42,48]. Linear correlation measures such as Pearson correlation gives an overall correlation and does not consider the dynamic correlation [26]. The constant conditional correlation (CCC)-GARCH [49] model, however, has removed the shortcomings of univariate GARCH model, yet it is not a realistic model as it also considers correlation constant which is in fact dynamic. Engle [22] developed a dynamic model base on the CCC model which considers the conditional correlation as time-varying. Presently various variants of the GARCH model are being used to study volatilities and correlation of the stock markets returns. For example, BEKK, and AGDCC models have been used to compare with other GARCH models [50].
Besides the traditional time series models the multiscale correlation techniques of continuous wavelet transformation (CWT), Discrete wavelet transformation (DWT), and Maximum Overlap Discrete Wavelet Transform (MODWT) models have been used by recent studies. The Wavelet models have the ability to study the relationship between stock markets not only at different time horizons but also at frequency bands [51,52]. Recently Sakti, et al. [53] used wavelet coherence along with DCC-GARCH model to study time-varying correlation. Jaffar, et al. [54] used DCC-GARCH, Markov switching, and MODWT to study the portfolio diversification benefits.
3.3. Dynamic Conditional Correlation (DCC) GARCH Model
We selected the DCC-GARCH model developed by Engle [22] to addresses the time-varying volatilities and correlational among the assets. This model is based on Gaussian distribution which might be inefficient for heavy-tailed distribution. Pesaran and Pesaran [55] used the DCC-GARCH model assuming multivariate t-distribution which is suitable for heavy-tailed data. We used the DCC-GARCH model with both the distributions following prior studies conducted by Najeeb, Bacha and Masih [42], Jaffar, Dewandaru and Masih [54], and Buriev, et al. [56] to answer the research questions of our study. The general equation of the DCC-GARCH model is given below:
where is conditional variance matrix, is a k x k diagonal matrix having conditional variance , on its diagonals, and is time-varying correlation matrix (off-diagonal elements). The conditional variance () for assets are estimated using univariate GARCH (X, Y) model as shown in Equation (2).
where, , , and are non-negative and < 1; is the short-run persistence of the shocks to returns Y to long-run persistence (the GARCH effects), and the number of assets is denoted by k.
Furthermore, the residuals and the conditional standard deviations () are obtained. The conditional standard deviation is expressed by diagonal matrix , which consists () elements on its diagonals as shown in Equation (3).
The standardized residuals () are further used for estimating time-varying (dynamic) correlation matrix [57].
where is the diagonal matrix of its diagonal elements as given in Equation (5). is a symmetric positive definitive conditional covariance matrix, , and is unconditional covariance of the standardized residual of univariate GARCH model.
The conditional correlation can be expressed in typical correlation form by putting as follows:
Alternatively, the t-DCC-GARCH model of Pesaran and Pesaran [55] uses the devolatized returns and estimates the correlation model simultaneously against the DCC-GARCH model which used standardized returns and estimates model in two steps. We can estimate conditional correlation parameters using GARCH (1,1) model for conditional volatility is given in Equation (8) which can be used in the correlation matrix to determine the conditional correlation.
where represents the unconditional variance of the asset returns. , and are volatility parameters specific for an asset. (1 − − ) shows the restriction to test if the volatility is mean reverting. If the term (1 − − ) is equal to zero in this case the model shows integrated GARCH (IGARCH) process.
4. Empirical Results
4.1. Descriptive Statistics
To obtain summarized information about the logarithmic returns of the MSCI indices of the selected countries, the summary statistics are presented in Table 3. It is noted that the selected series have diversity in returns and volatility. The average return of the Indonesian stock market (0.0422) is the highest among the selected countries. The average return of the UK stock market is 0.097 which is the lowest return as compared to other countries. The standard deviation represents the risk or volatility of the returns in the stock markets. The standard deviation of the Chinese stock market returns is 1.6890, which is the highest; meanwhile the standard deviation of the Malaysian stock market returns (0.7494) is the lowest among the selected countries. As skewness of all the return series is negative, which is evidence for overall negative performance, and asymmetry in given return series, it relates with the findings of the study conducted by Arouri, et al. [58]. The kurtosis values represent the fatness of the tails of the distribution and distribution of data around the mean. All the kurtosis values are greater than 3 which show that data are not normally distributed [59,60]. The Jarque–Bera test of normality rejects the null hypothesis of normality at 1% significance level.
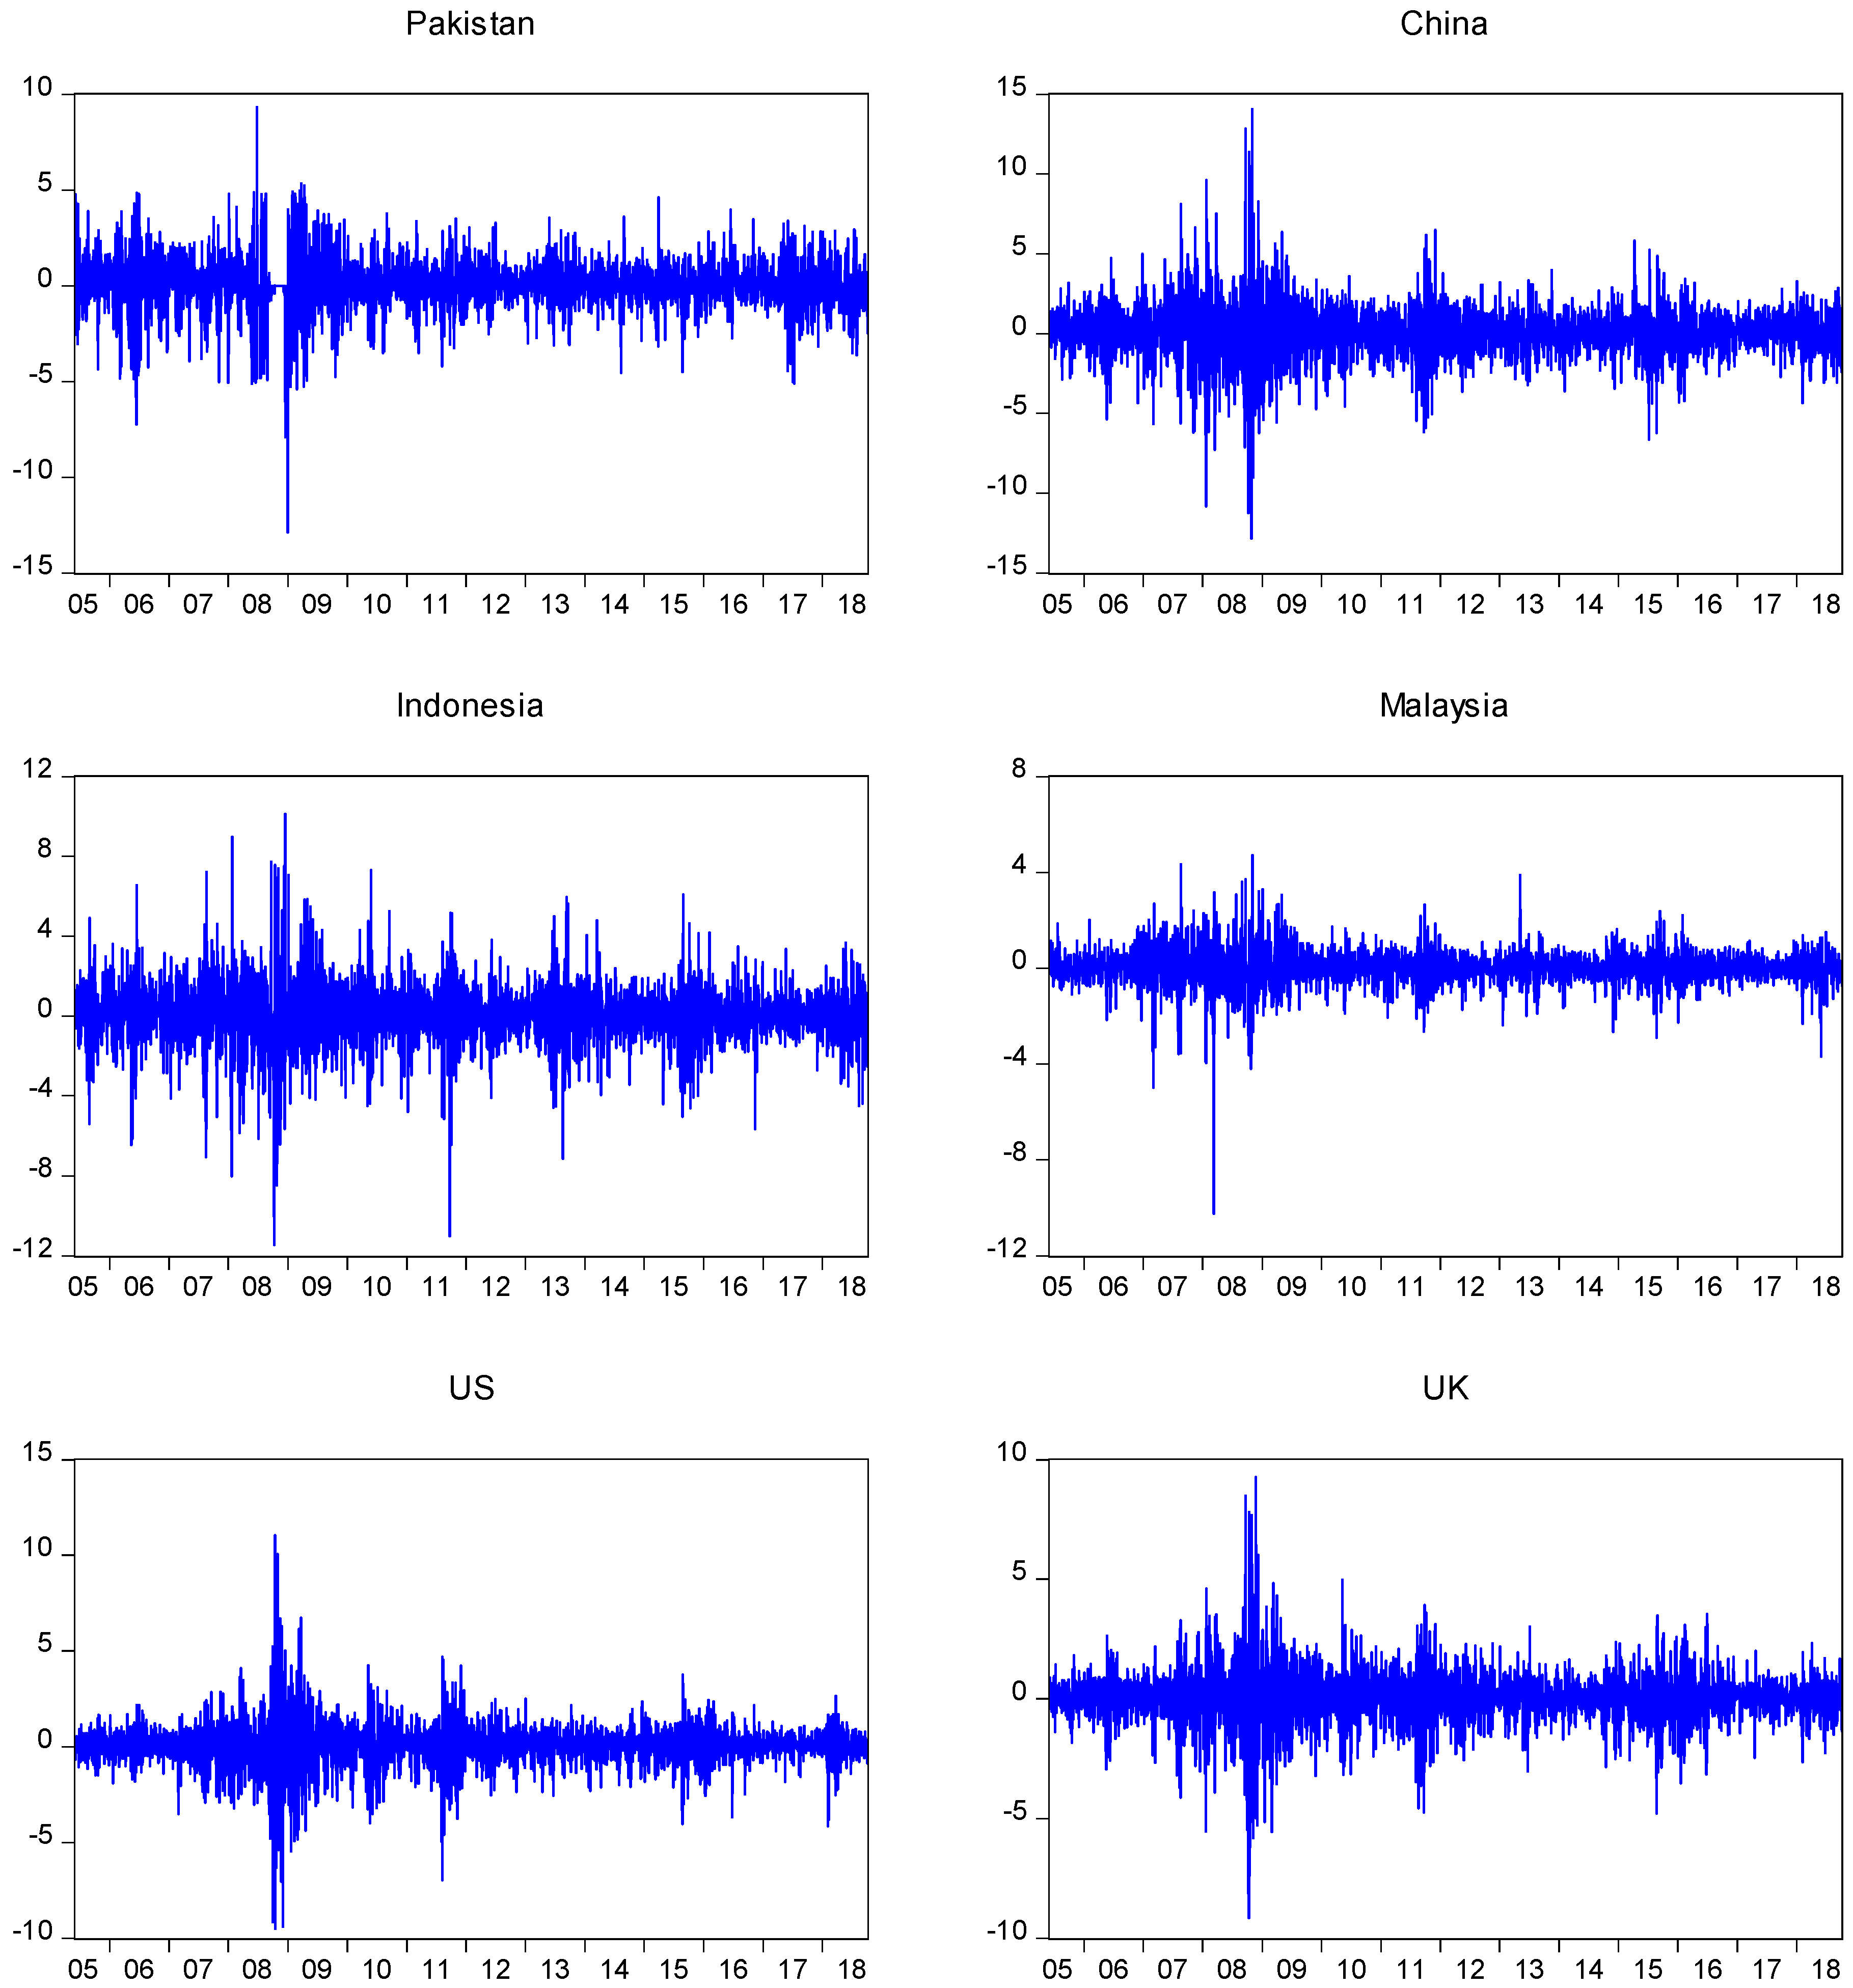
4.2. Dynamics of Daily Stock Prices and Returns
The time series graphs of the stock prices data show the changing mean and variance throughout the sample period of 2005–2018. All the indices showed a simultaneous decline around the year 2008 in response to the GFC. In the case of Pakistan, the graph shows stagnant period around the year 2008 which is due to the management’s decision of temporarily fixing the floor of KSE for 110 days. After lifting the floor, the index dropped to the level of 4782 points. US and Indonesia trend observably higher than the other markets, which shows that markets do not follow the same trend. The dissimilarity in the trend shows a low level of correlation among the markets. The time series graphs are shown in Figure 1. The graph of the return series is mean reverting with volatility clustering. The volatility is high around the year 2008, which was caused by the turbulent period of the financial crisis. The return volatility of Malaysia during the GFC is relatively low. Thus, results of preliminary tests make the DCC-GARCH model suitable for the study. The graphs of the return series are shown in Figure 2.
4.3. Stationarity and Residual Diagnostic Tests
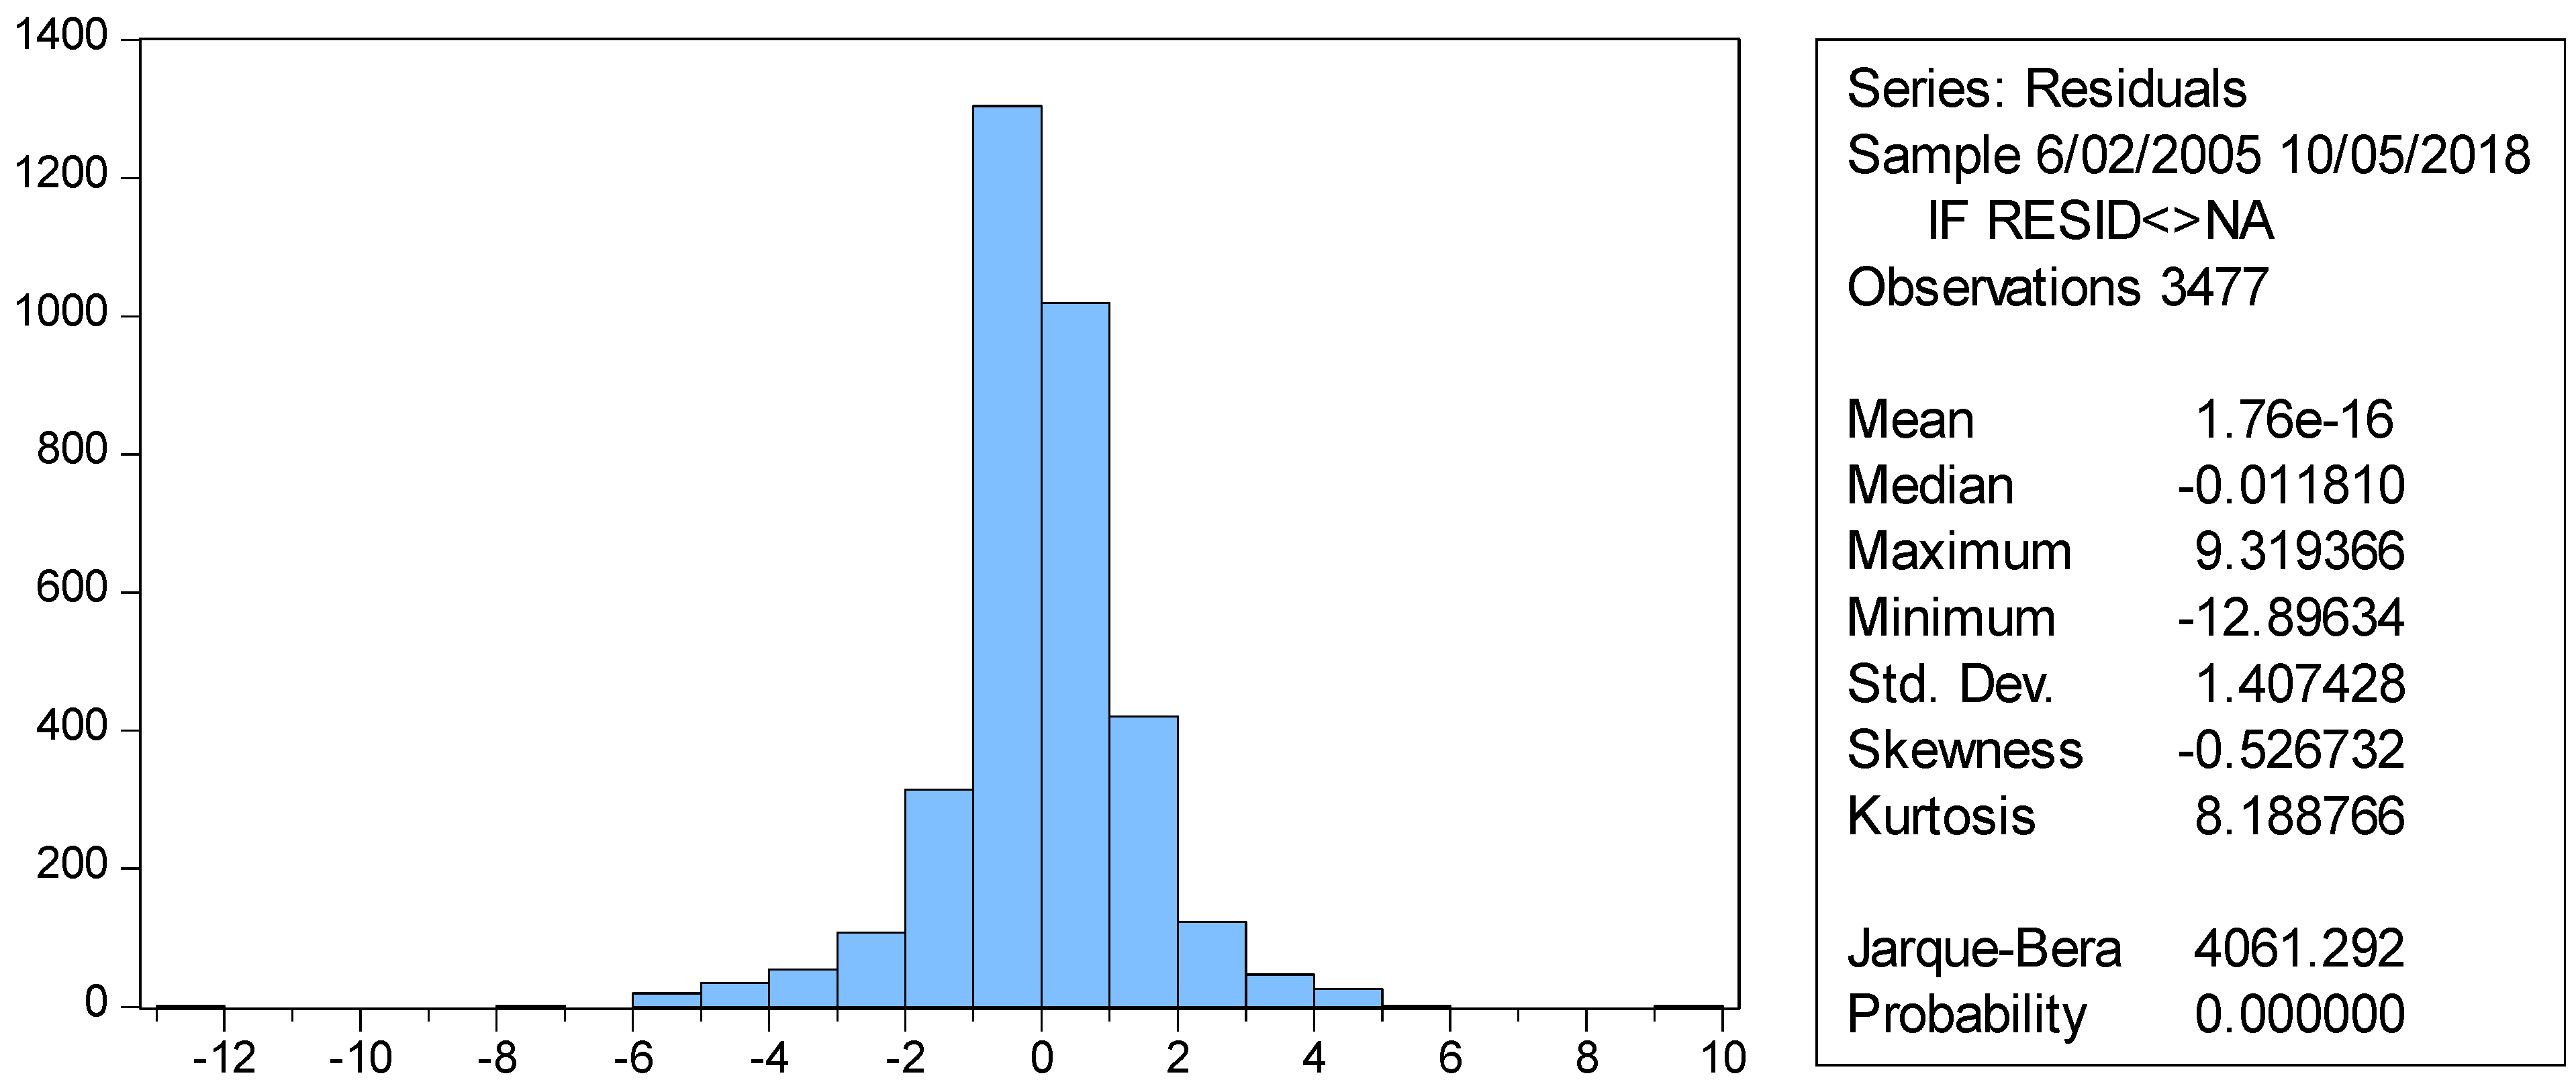
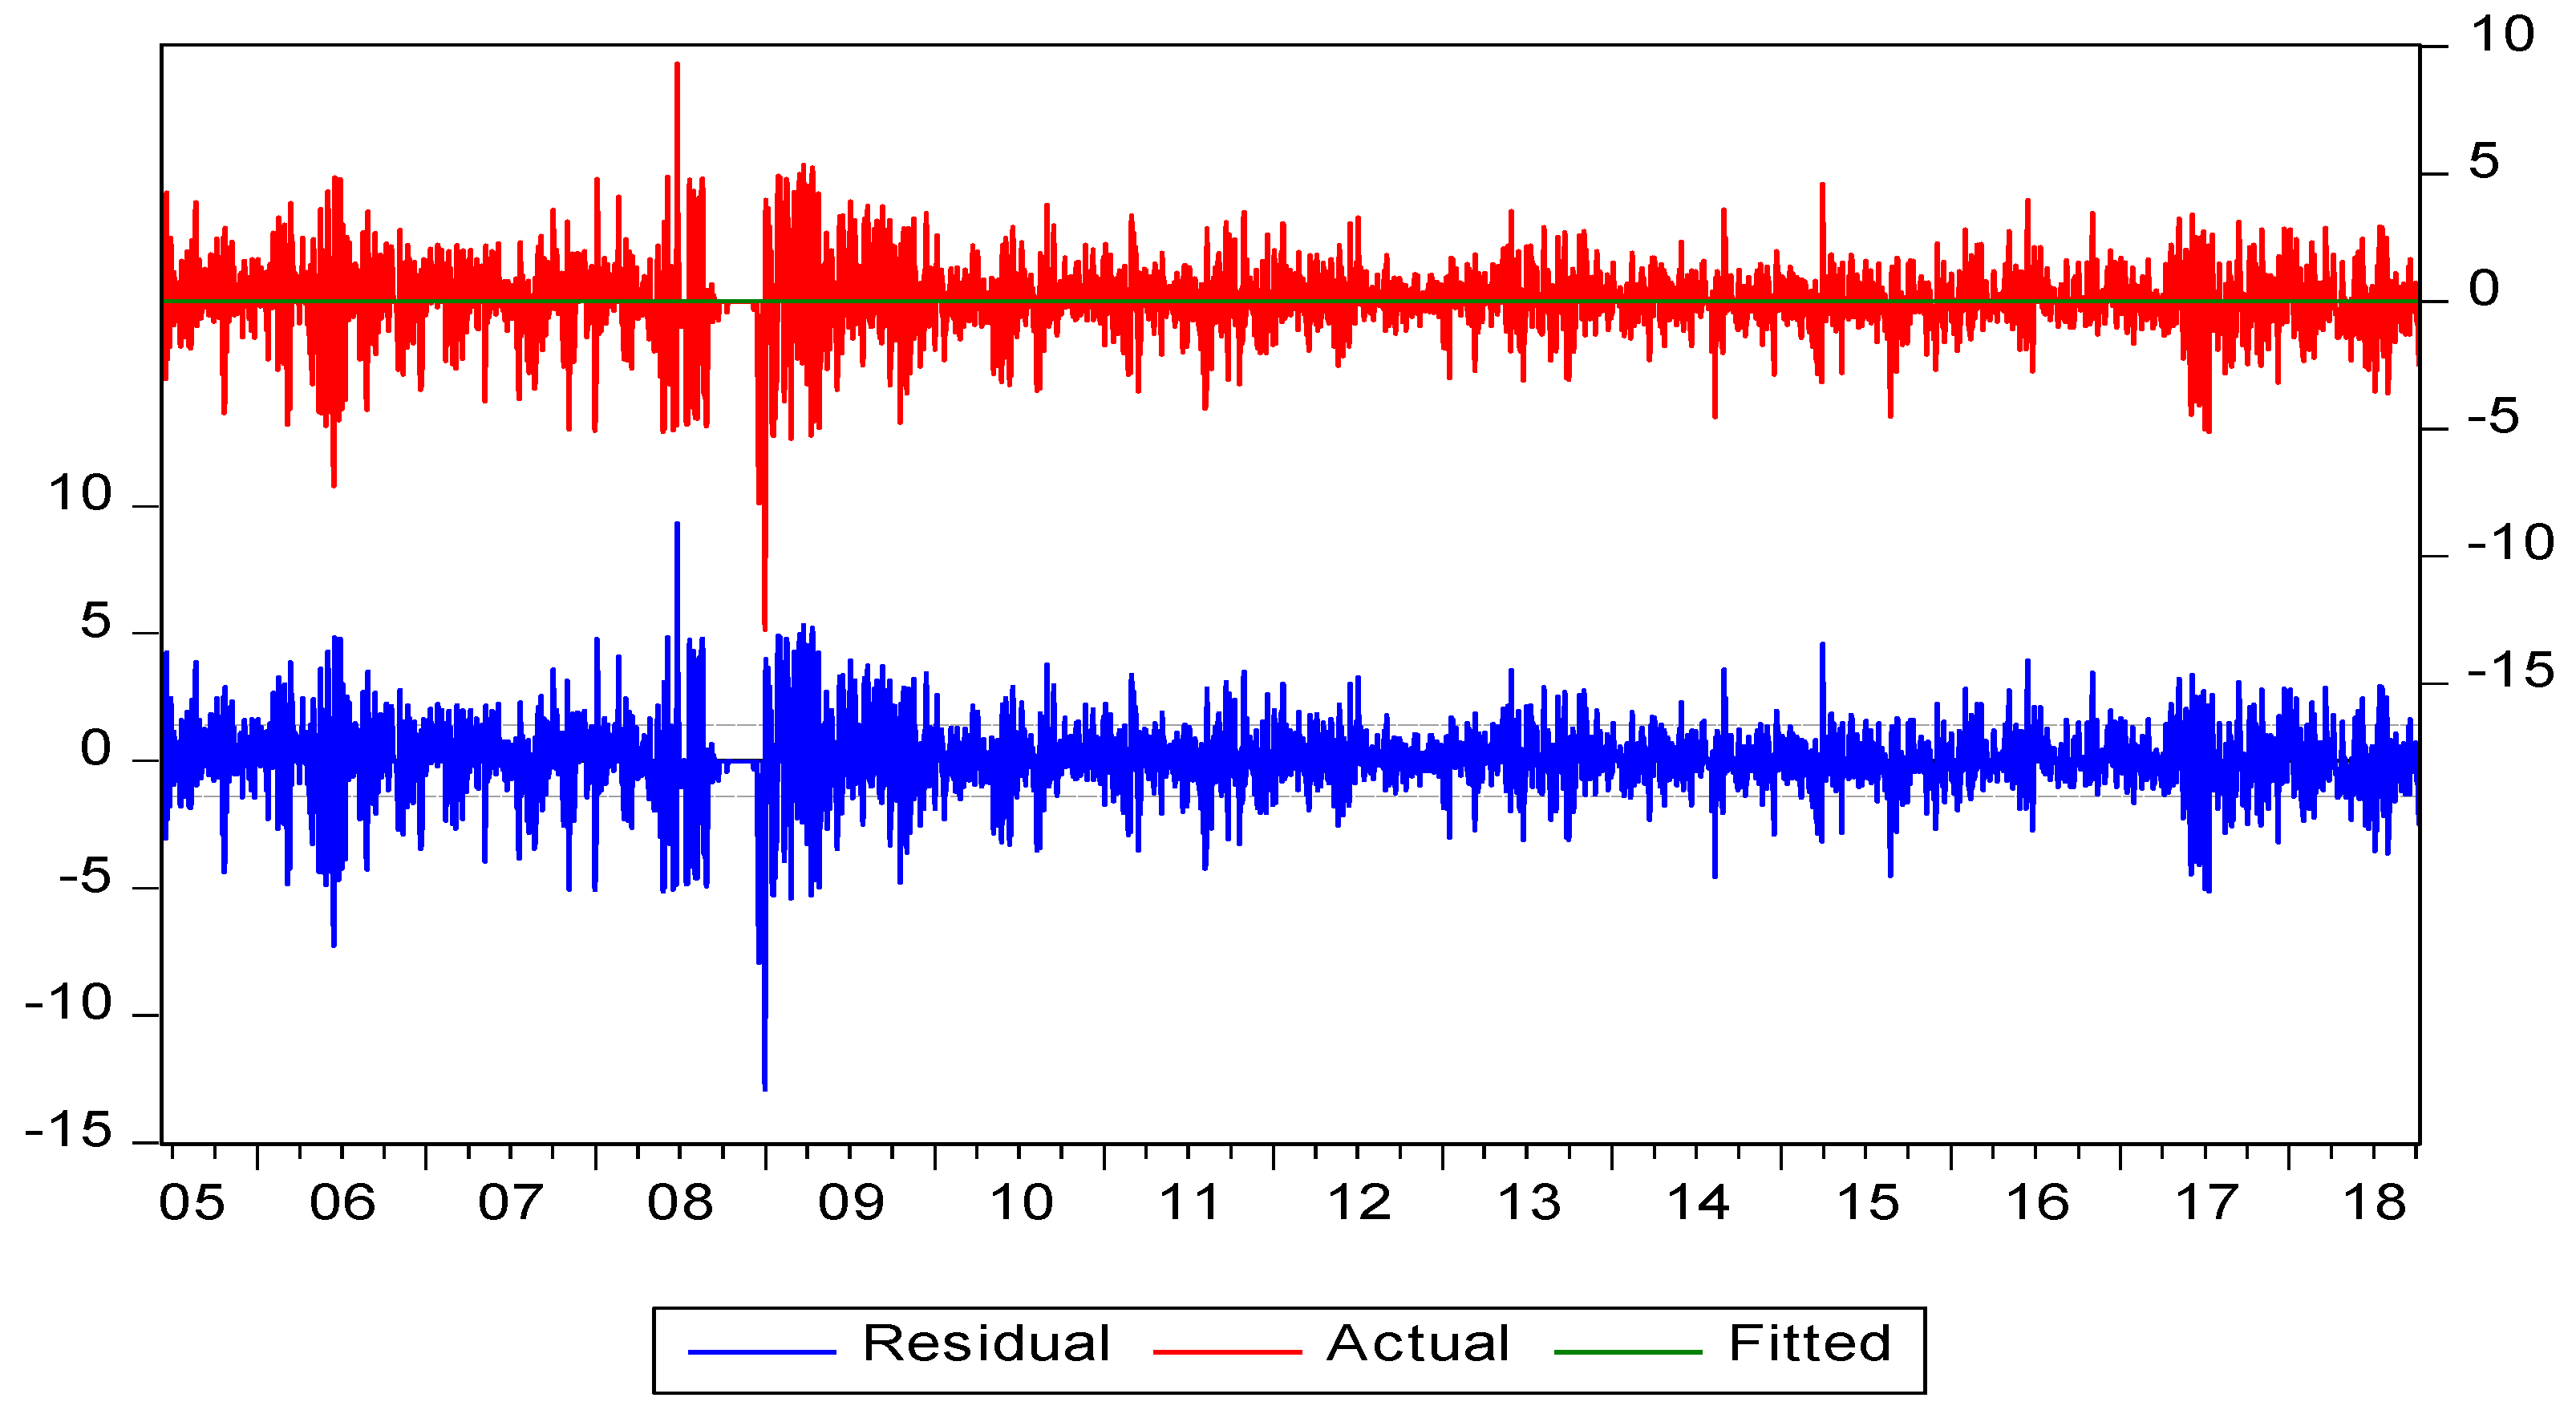
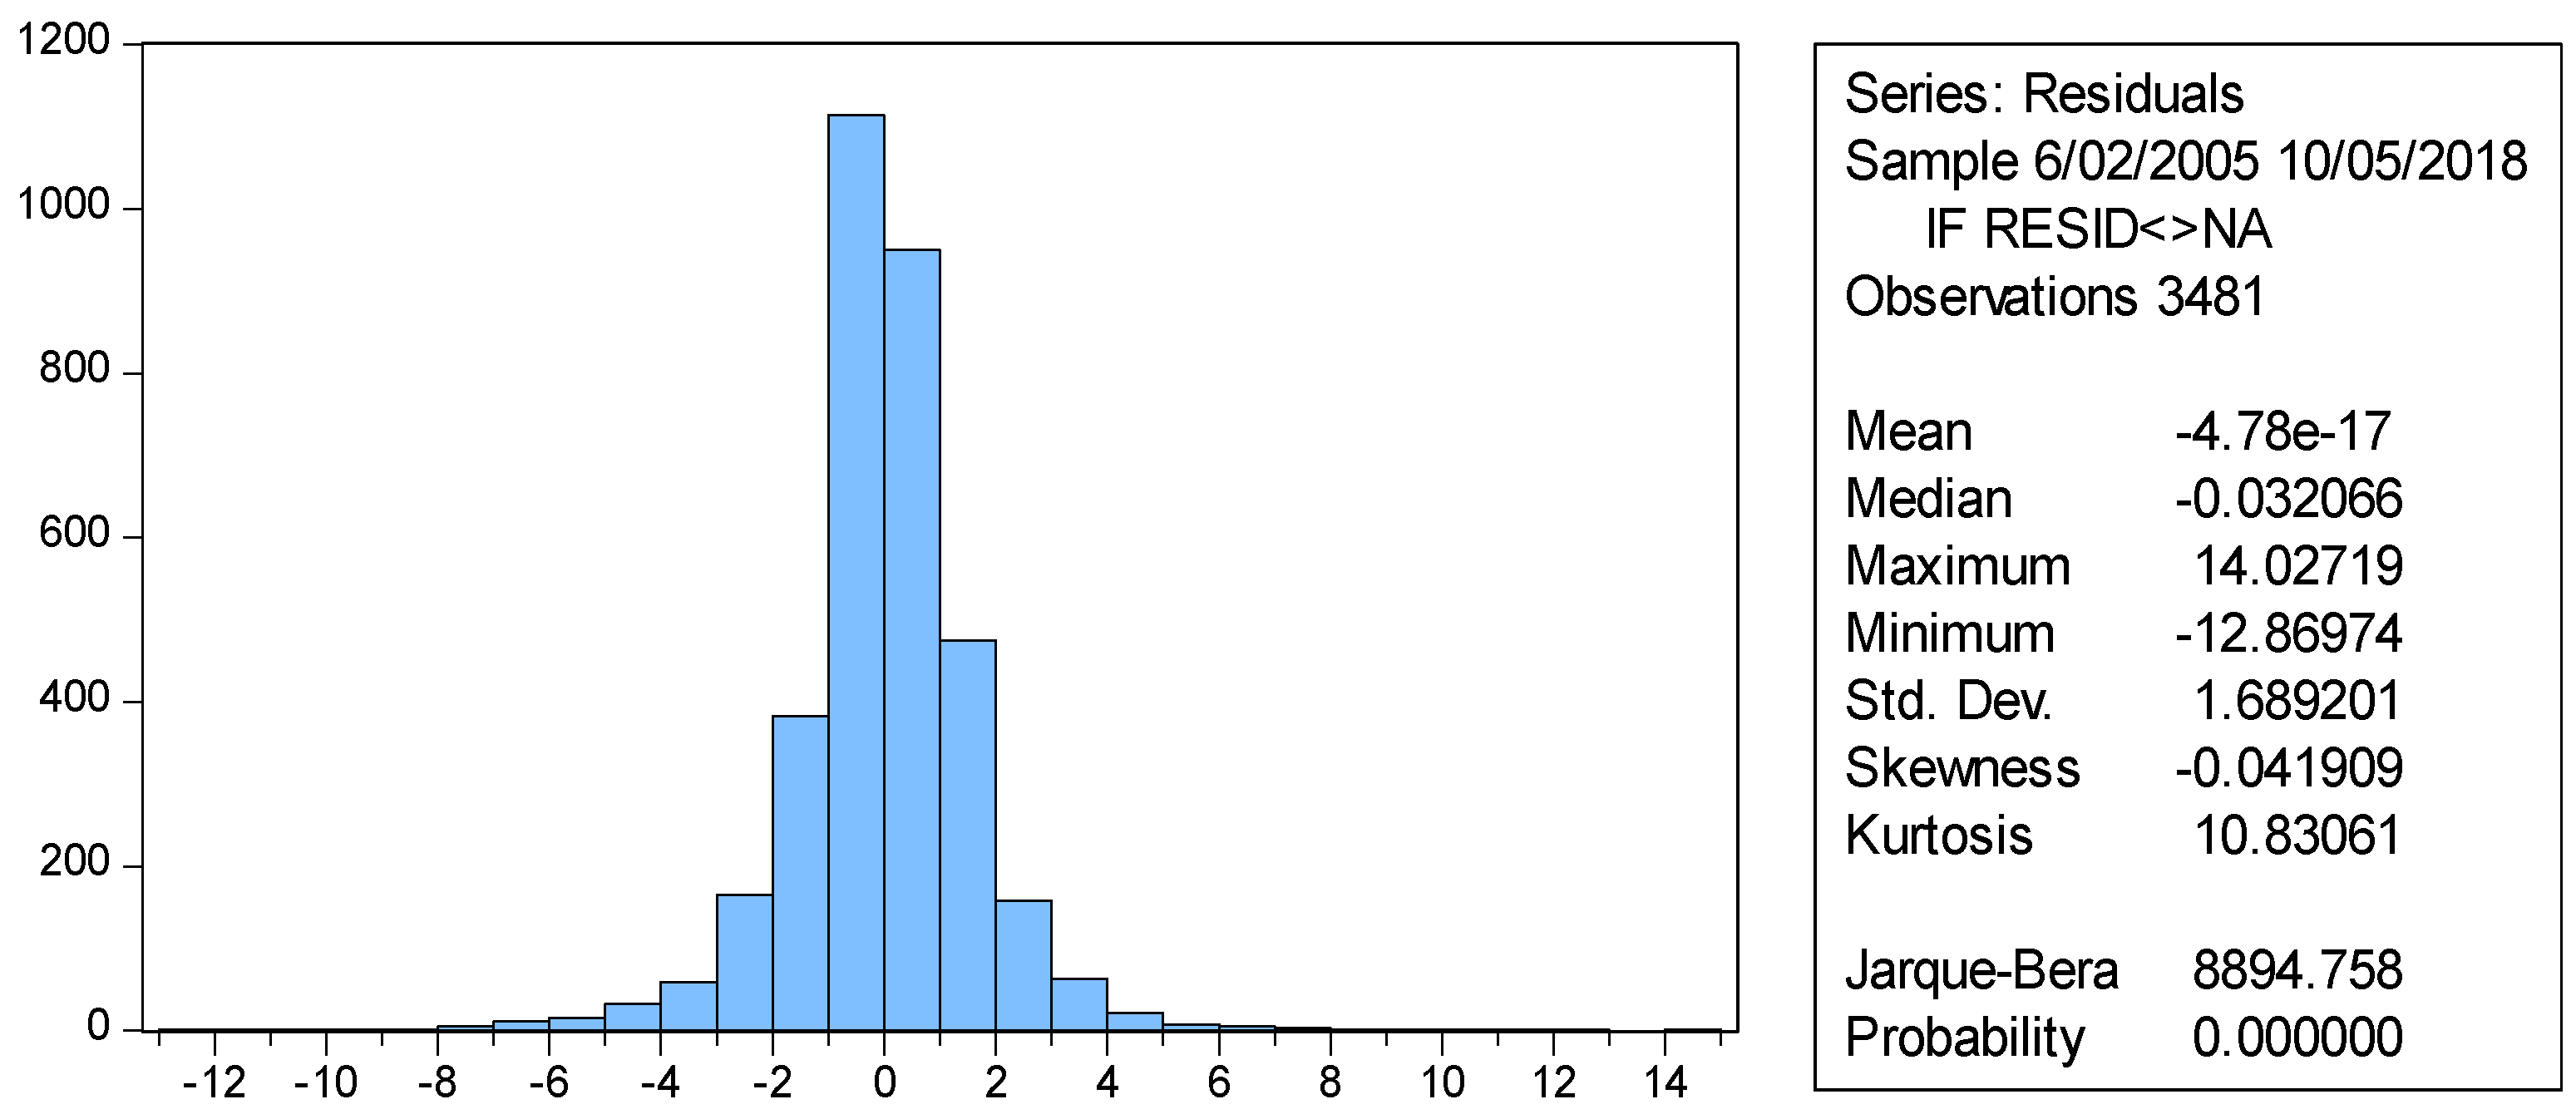
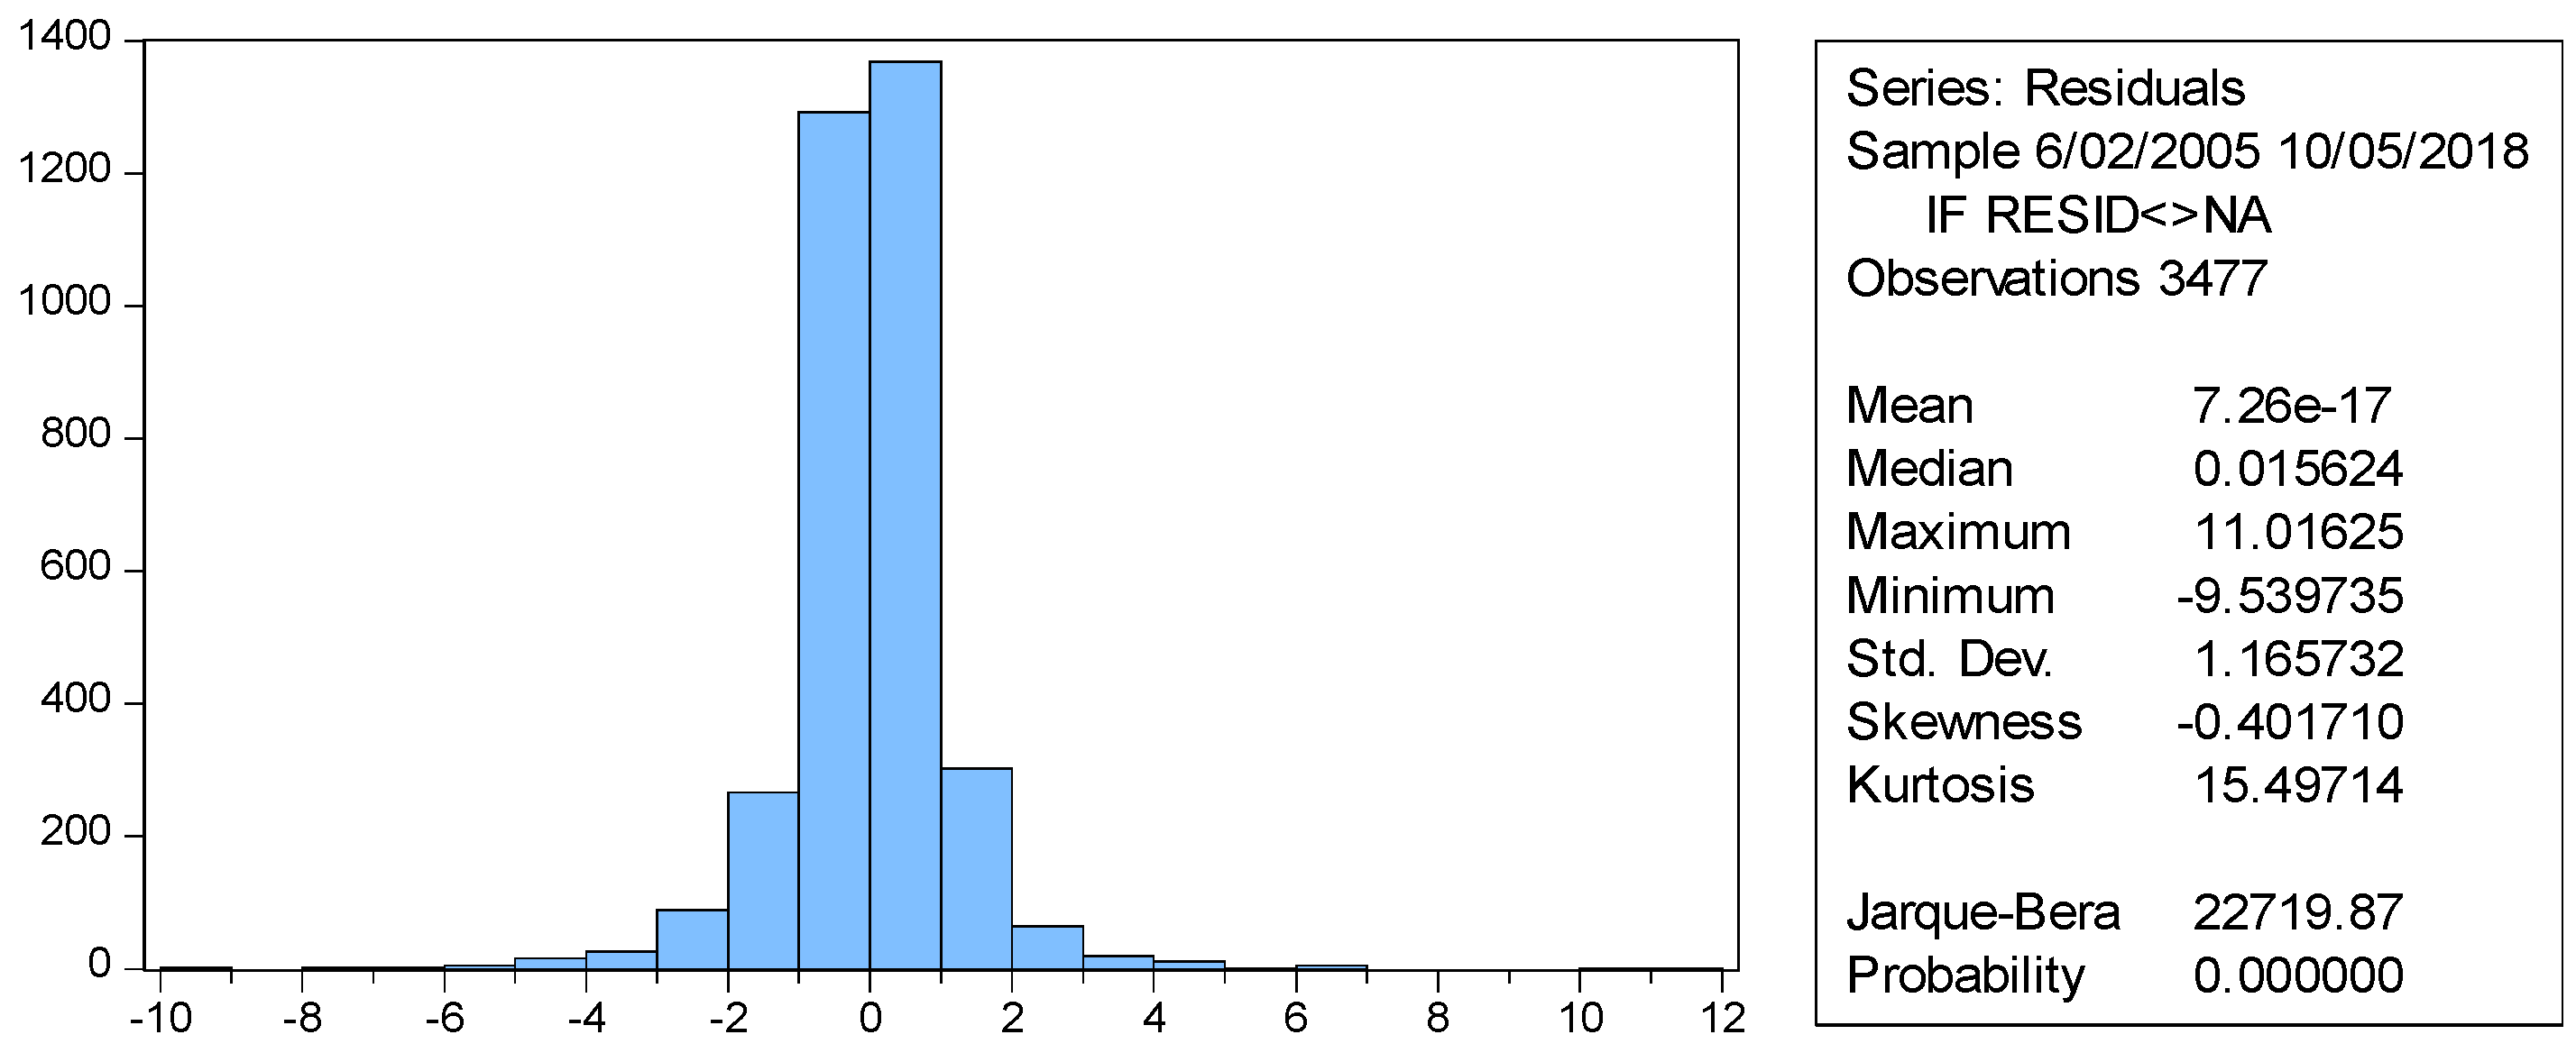
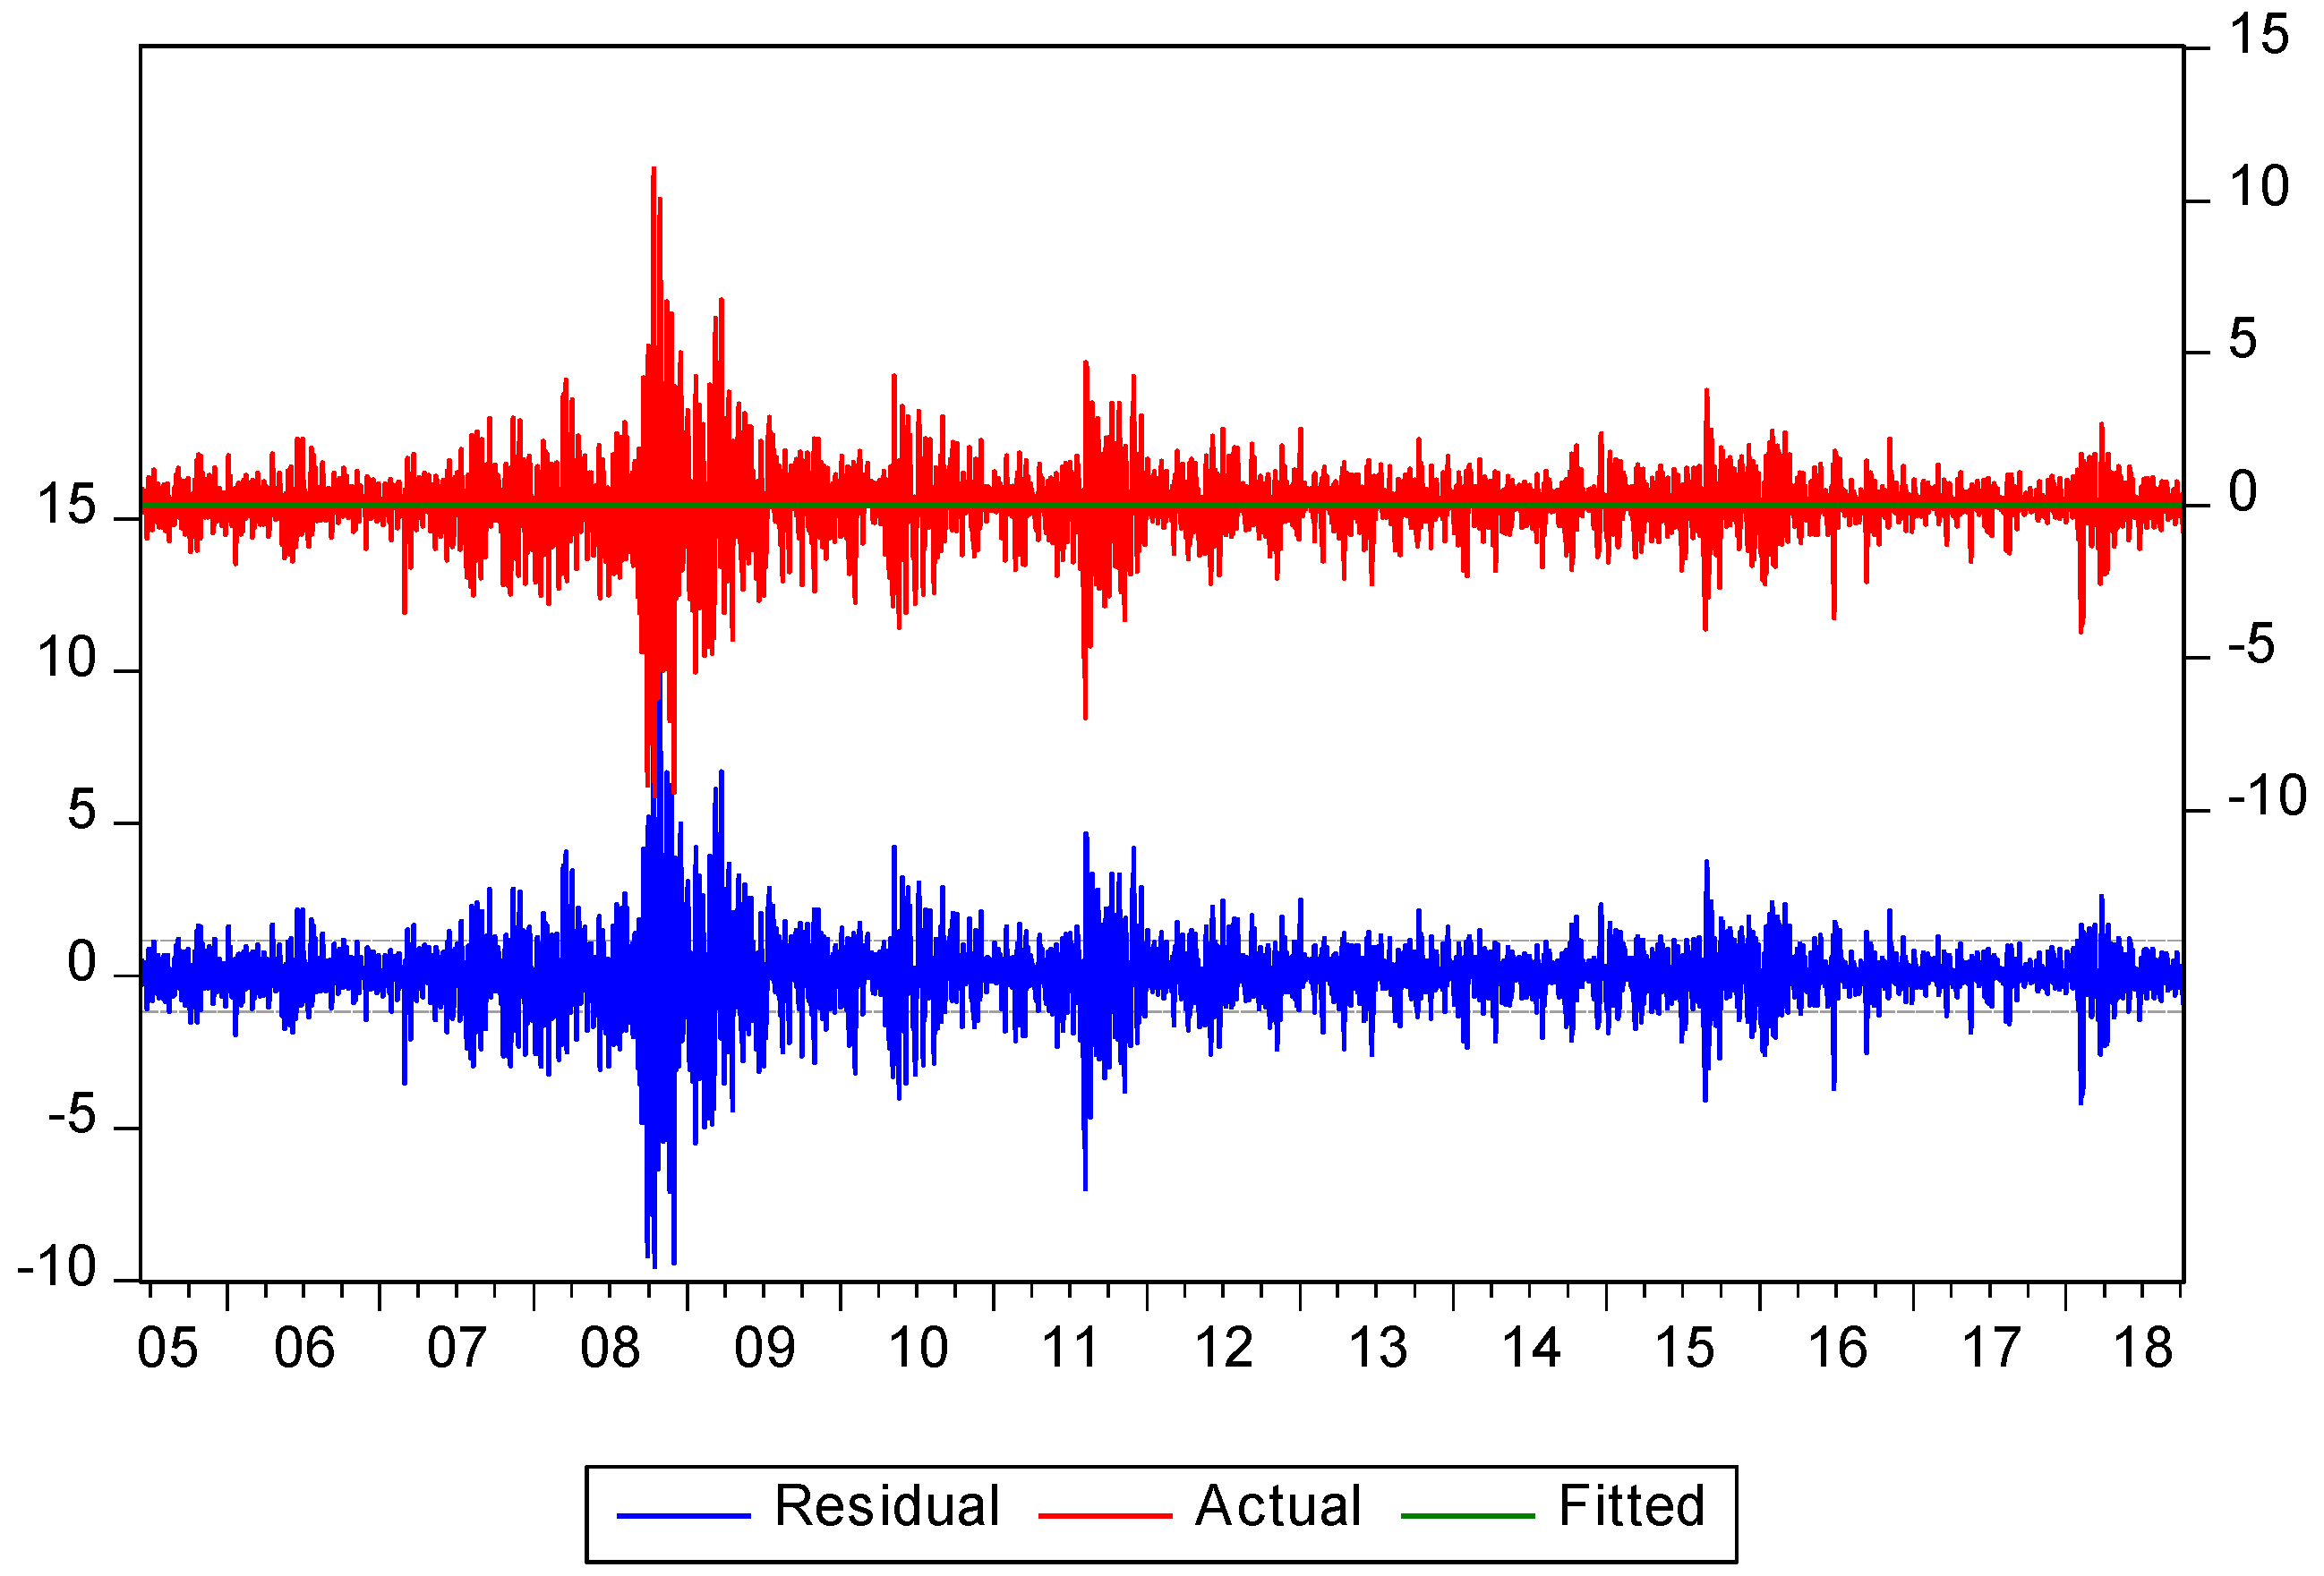
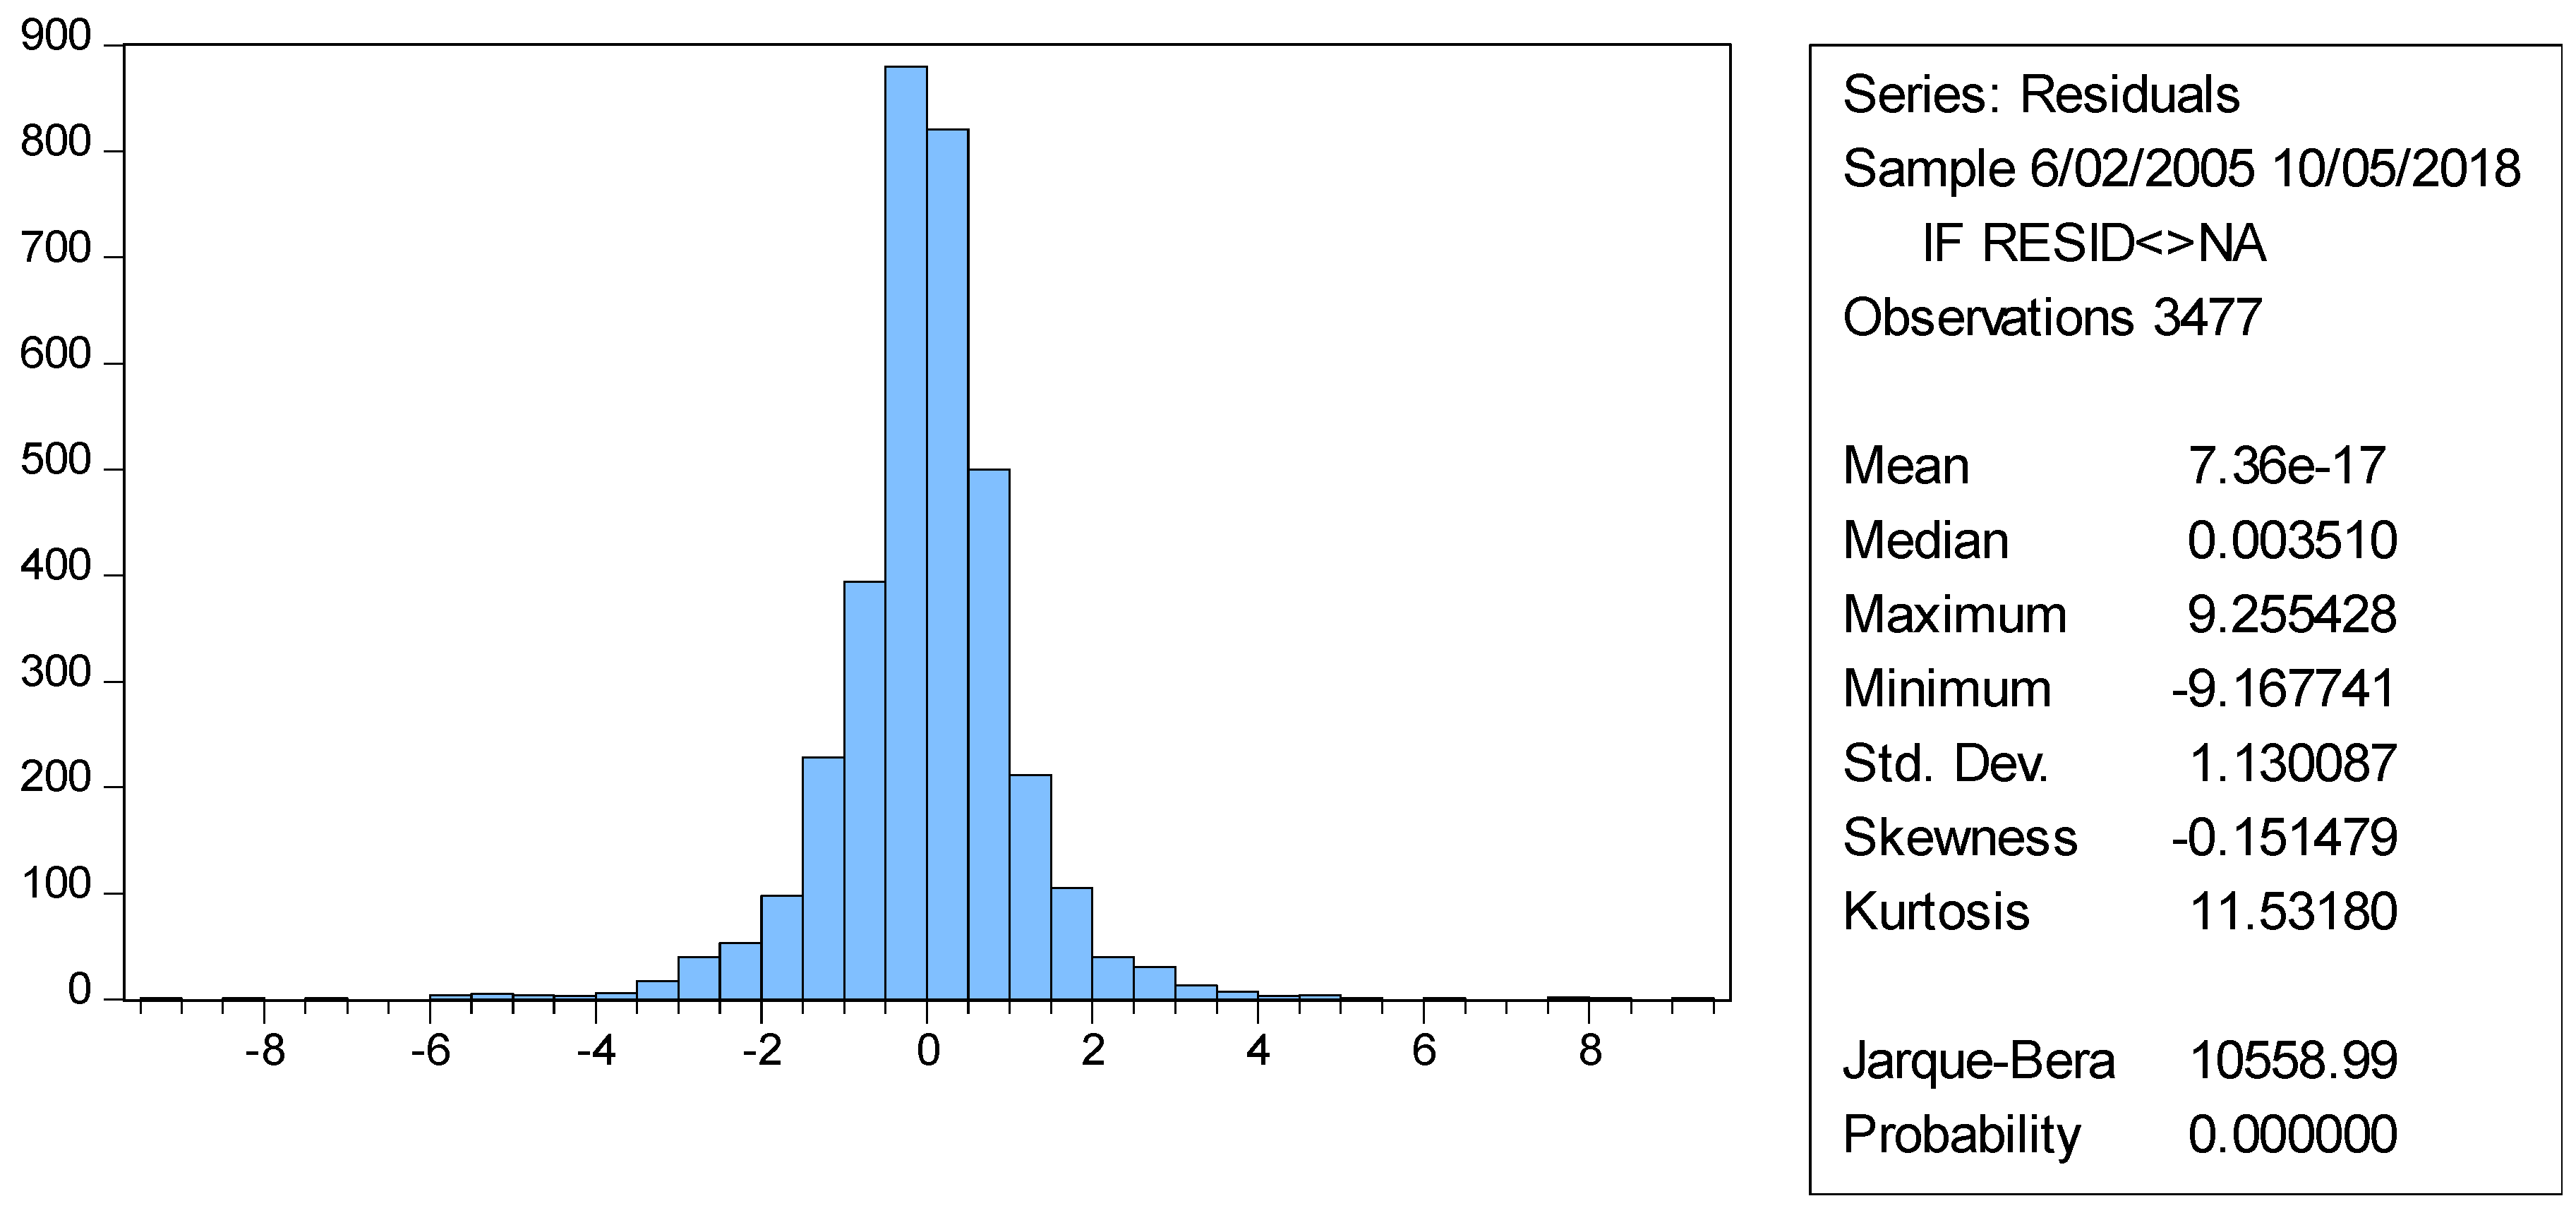
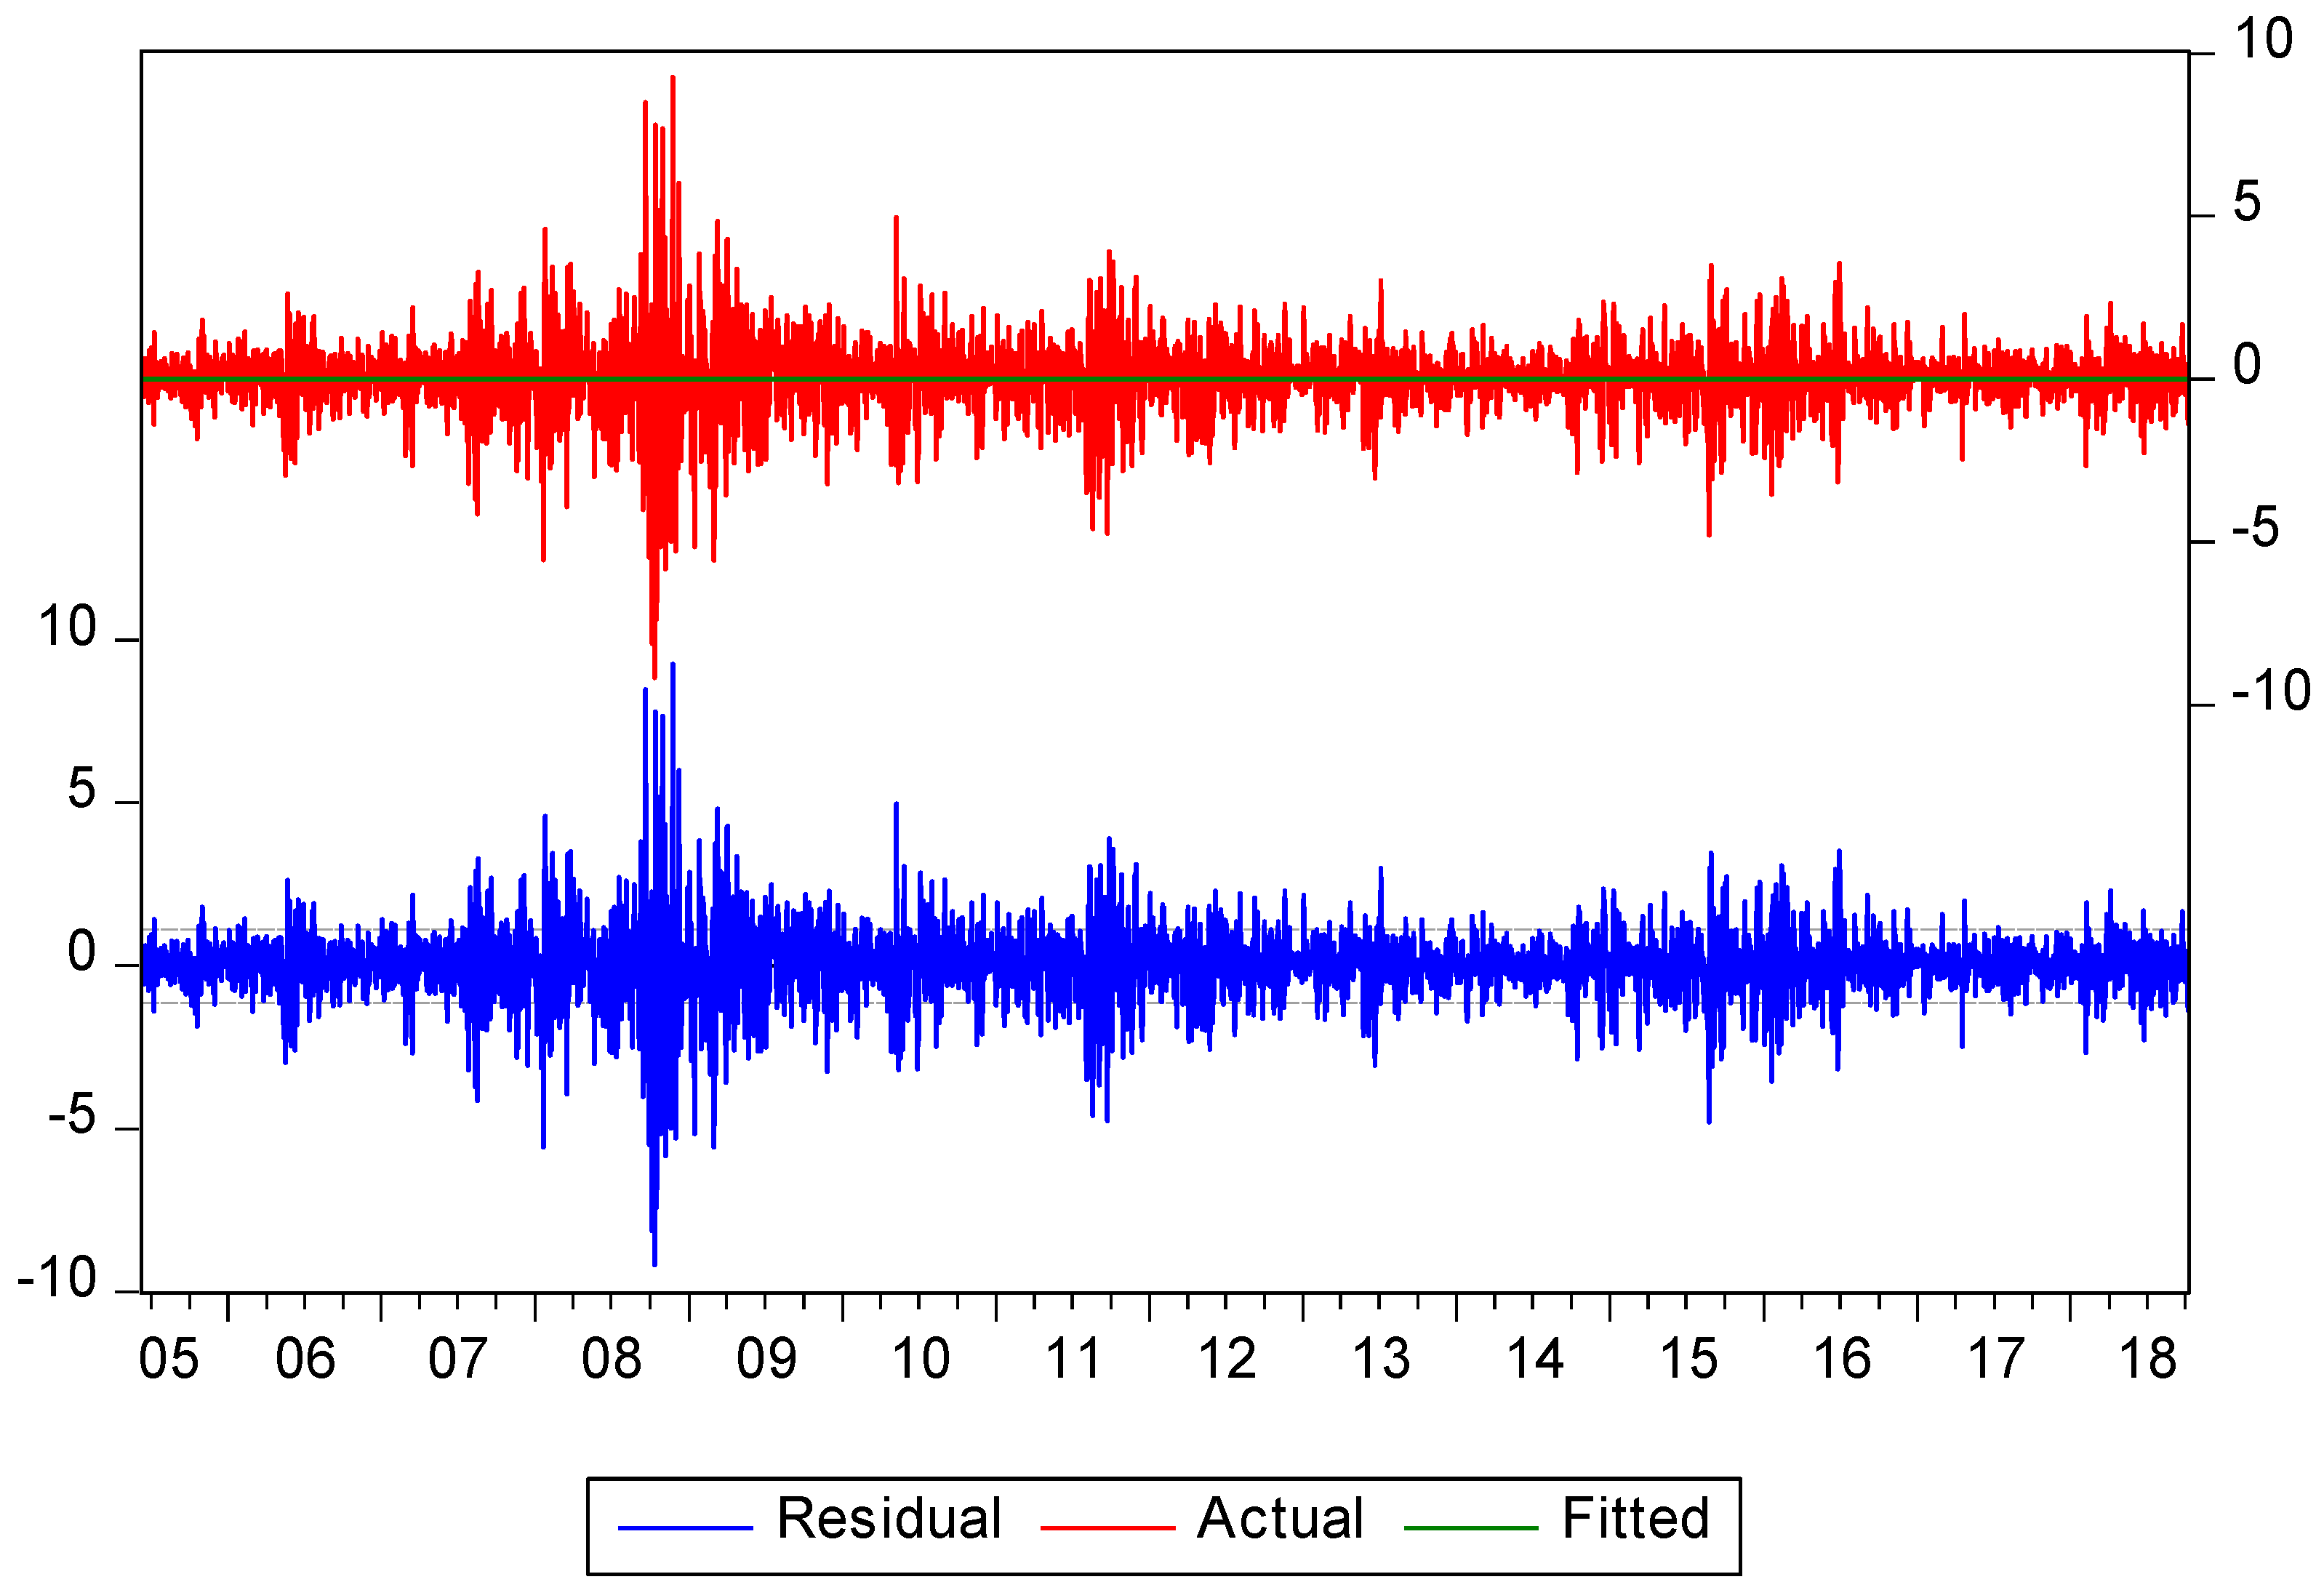
We performed different preliminary tests to justify the usage of GARCH family models which include Augmented Dickey–Fuller (ADF) test, Ljung–Box Q-statistics, Lagrange multiplier (LM) test, and ARCH effect, results are shown in Table 4. The results of the ADF tests of all the return series show the presence of unit root, which confirms that all the return series are stationary at level as well as at first difference. The normality graph shows that all the return series are not normally distributed. The residual diagnostic and the normality graphs for each series are given in Appendix A.
The Ljung–Box Q-statistics show that there is autocorrelation/serial correlation is present in all the series. The null hypothesis of no autocorrelation is rejected at 1% significance level for all the series except for China and UK. For China and UK, the null hypothesizes of no autocorrelation are rejected at the 10 percent significance level. The results of the LM test also support the results of Q-statistics test. The ARCH test highlights that heteroscedasticity or ARCH effect is present in all the series.
4.4. Correlation Matrix
Table 5 presents the results of the correlation matrix of stock returns for selected countries. All the values are positive which shows that stock markets move in the same direction. However, the correlation among the stock returns is in the range from 0.022 to 0.577 which is below 0.80 showing low co-movements and absence of multicollinearity [15]. The correlation between Pakistan and US stock returns is the lowest, while the correlation between UK and US is the highest. It indicates that the correlation between developed countries is higher, while the correlation between emerging and developed countries is lower. Pearson correlation is an average correlation which does not show the variations in the correction over the period. We performed more detailed correlation with DCC-GARCH model.
4.5. DCC-GARCH Model
The time-varying volatilities and correlations are important to determine the portfolio diversification benefits among the markets [60]. We used two DCC-GARCH models with Gaussian and t-distribution to make a comparison based on the maximum likelihood values.
Table 6 and Table 7 show the maximum likelihood estimates of volatility decay parameters ( and ) and as well as the correlation decay parameters ( and ) of the t-DCC and Gaussian DCC models for MSCI indices return series. In both the models, the decay parameters are highly significant. The sum of the volatility decay parameters ( and ) for each the series is less than 1 which shows that conditional volatilities are mean reverting with gradual decay of volatility. Thus, no evidence of Integrated GARCH (IGARCH) process is found. Similarly, the sum of correlation decay parameters ( and ) is also slightly less than 1 for all the returns which shows that conditional correlations are also mean reverting and the system will slowly return to the normality [54]. The RiskMetrics recommends a standard range of 0.95 to 0.97 for decay parameters [61]. This situation is favorable for investors to invest in a portfolio comprising of Pakistan and its trading partners, as shocks will be decayed slowly. Therefore, there are fewer chances for loss of investors abruptly.
The comparison of both models shows that the maximized log-likelihood value of the t-DCC model is higher than Gaussian DCC model. Further degrees of freedom for the t-DCC model are below 30 which show that t-DCC model is superior to the Gaussian model. Therefore t-DCC model is considered a suitable model for a distribution having high kurtosis (heavy-tailed) values [42,53,56,60]. Henceforth, we follow the results of the t-DCC model.
4.6. The Unconditional Volatility and Correlations
The unconditional volatilities and correlations estimated using t-DCC model describe the possible portfolio diversification benefits among the stock markets of Pakistan, China, Indonesia, Malaysia, US, and the UK. The diagonal elements of the covariance matrix represent the unconditional volatilities. We found that value of unconditional volatility in all the markets is near to 1 which is considered to be the high volatility in returns [56,60]. Table 8 reports the values for unconditional volatility ranking in which China shows the highest unconditional volatility, while Malaysia shows the lowest unconditional volatility, which indicates the stability in the Malaysian stock market. Pakistan and UK stock markets show moderate volatility as compared to other countries. Other than the results of these countries, the results do not show any remarkable difference of volatilities between developed and emerging markets.
Table 9 shows the unconditional correlation of the market pairs which describe the co-movements between the markets. We focused only on the correlation of Pakistani stock market with stock markets of its trading partners. The conditional correlation of the pairs MSCI index returns of Pakistan with all the markets is very low. The results highlight that Pakistan has the highest correlation with Malaysia (0.146) and has the lowest conditional correlation with the US (0.020). It can be inferred that the changes in emerging markets such as Malaysia will affect more to the Pakistani stock market than changes in any developed market such as the US. The low level of correlation is considered to be good for portfolio diversification. Thus, for investors, it is a feasible set of markets for portfolio investment.
4.7. The Plots of Conditional Correlation and Conditional Volatility
Figure 3 shows the values of conditional volatilities of stock markets of Pakistan and its trading partners. The values plotted on the graph show the time-varying nature of volatilities. The volatility shows an upward trend in the beginning and reaches the highest point during the financial crisis (2008). After the crisis period, all markets show close movements of volatilities except Pakistan which shows separate behavior from other markets, especially in the ending period. The reason for the temporary rise in the returns of the stock markets returns was due to the inclusion of Pakistan in the emerging markets by MSCI in the year 2017 [17]. Thus, Pakistan does not seem to be integrated with the other market which is a positive sign for the investors.
Figure 4 depicts the conditional correlation between the stock markets of Pakistan and its trading partners. The figure shows the similarity in the results of conditional and unconditional correlation of Pakistan with its trading partners. The lines representing the correlation of pairs Pakistani stock markets with its trading partners are mostly in the bottom touching with some lines crossing the zero showing less correlation. Stock market returns of Pakistan shows less correlation with developed markets which are the UK and the US. The emerging economies of China, Malaysia, and Indonesia have a higher correlation among them than the developed markets. The close movements of the correlation lines such as during the year 2008 can be attributed to the global financial crisis. During such periods, markets become more integrated and the diversification benefits are reduced. It is riskier for the investors to invest during periods of high integration between stock markets. This research has results consistent with the results with earlier studies in Asian countries [5,62].
5. Conclusions
After the global financial crisis of 2008–2009, the scenario of global markets has changed enormously. Due to the integration of global markets, the diversification benefits have become less. It is noted that financial shocks arising in one of the developed countries spread more quickly to other developed markets due to the integration among the developed markets. Diversifying the investments only among the developed countries is considered risky. However, due to the increasing integration among developed countries, investors are keen to invest in the emerging markets. Therefore, diversifying the investments in the combination of developed and emerging markets is desirable.
This study finds a useful combination of emerging and developed stock markets for formation of a portfolio. We applied the DCC-GARCH model on the MSCI indices of Pakistan and its top trading partners, namely China, Indonesia, Malaysia, US, and the UK. The selected model is suitable to study time-varying relationships between stock markets form small to a large number of parameters. This model captures the volatility and correlation at every period of the time, which helps to find out the news behind the shock. The descriptive statistics show that average volatility (risk) is low in all the selected indices. All the series show non-normal distributions having fat tails.
We compared results by employing Gaussian and t-distribution models following studies which adopted a modified DCC-GARCH model [55]. The results showed that the t-distribution is better fitted for the high kurtosis data. The model reported conditional as well as unconditional volatilities and correlation for the selected sample. The results of conditional volatilities and correlations confirmed the results of unconditional volatilities and correlations. We found higher fluctuations during the GFC. After the GFC, the fluctuations were small, which indicates the stability throughout the rest of the period. The decay factors of volatility and correlation show mean reverting slow decay process as the sum of volatility and correlation decay parameters is near to unity. The graph of the values of conditional correlation shows less correlation between the market pairs. We found low values of volatility and correlations for Pakistan and its trading partners.
There seems to be a good opportunity for investors and portfolio managers to invest in the given set of markets with low correlation among them. The conditional correction of Pakistan with its large trading partners seems low, while it is higher with small trading partners, where further studies to determine the relationship of bilateral trade to stock market co-movements is required. The findings of this study also have insight for policymakers regarding the flow of investment in these countries and integration with these countries.
Author Contributions
Conceptualized, drafted methodology, data collected & analyzed, and wrote-original manuscript, A.S.J.; reviewed and supervised this study, L.L.
Funding
This research received no external funding.
Acknowledgments
The authors would like to acknowledge the comments and suggestions given by anonymous reviewers which significantly improved the quality of our work. We recognize the overall support and guidance by Rashid Latief, Ph.D. Candidate, from College of Finance, Nanjing Agricultural University, China. Furthermore, we are thankful to Muhammad Arif from School of Business Administration, Shaheed Benazir Bhutto University, Shaheed Benazirabad, Pakistan for providing help in data collection for this research.
Conflicts of Interest
The authors declare that the research was conducted in the absence of any commercial or financial relationships that could be construed as a potential conflict of interest.
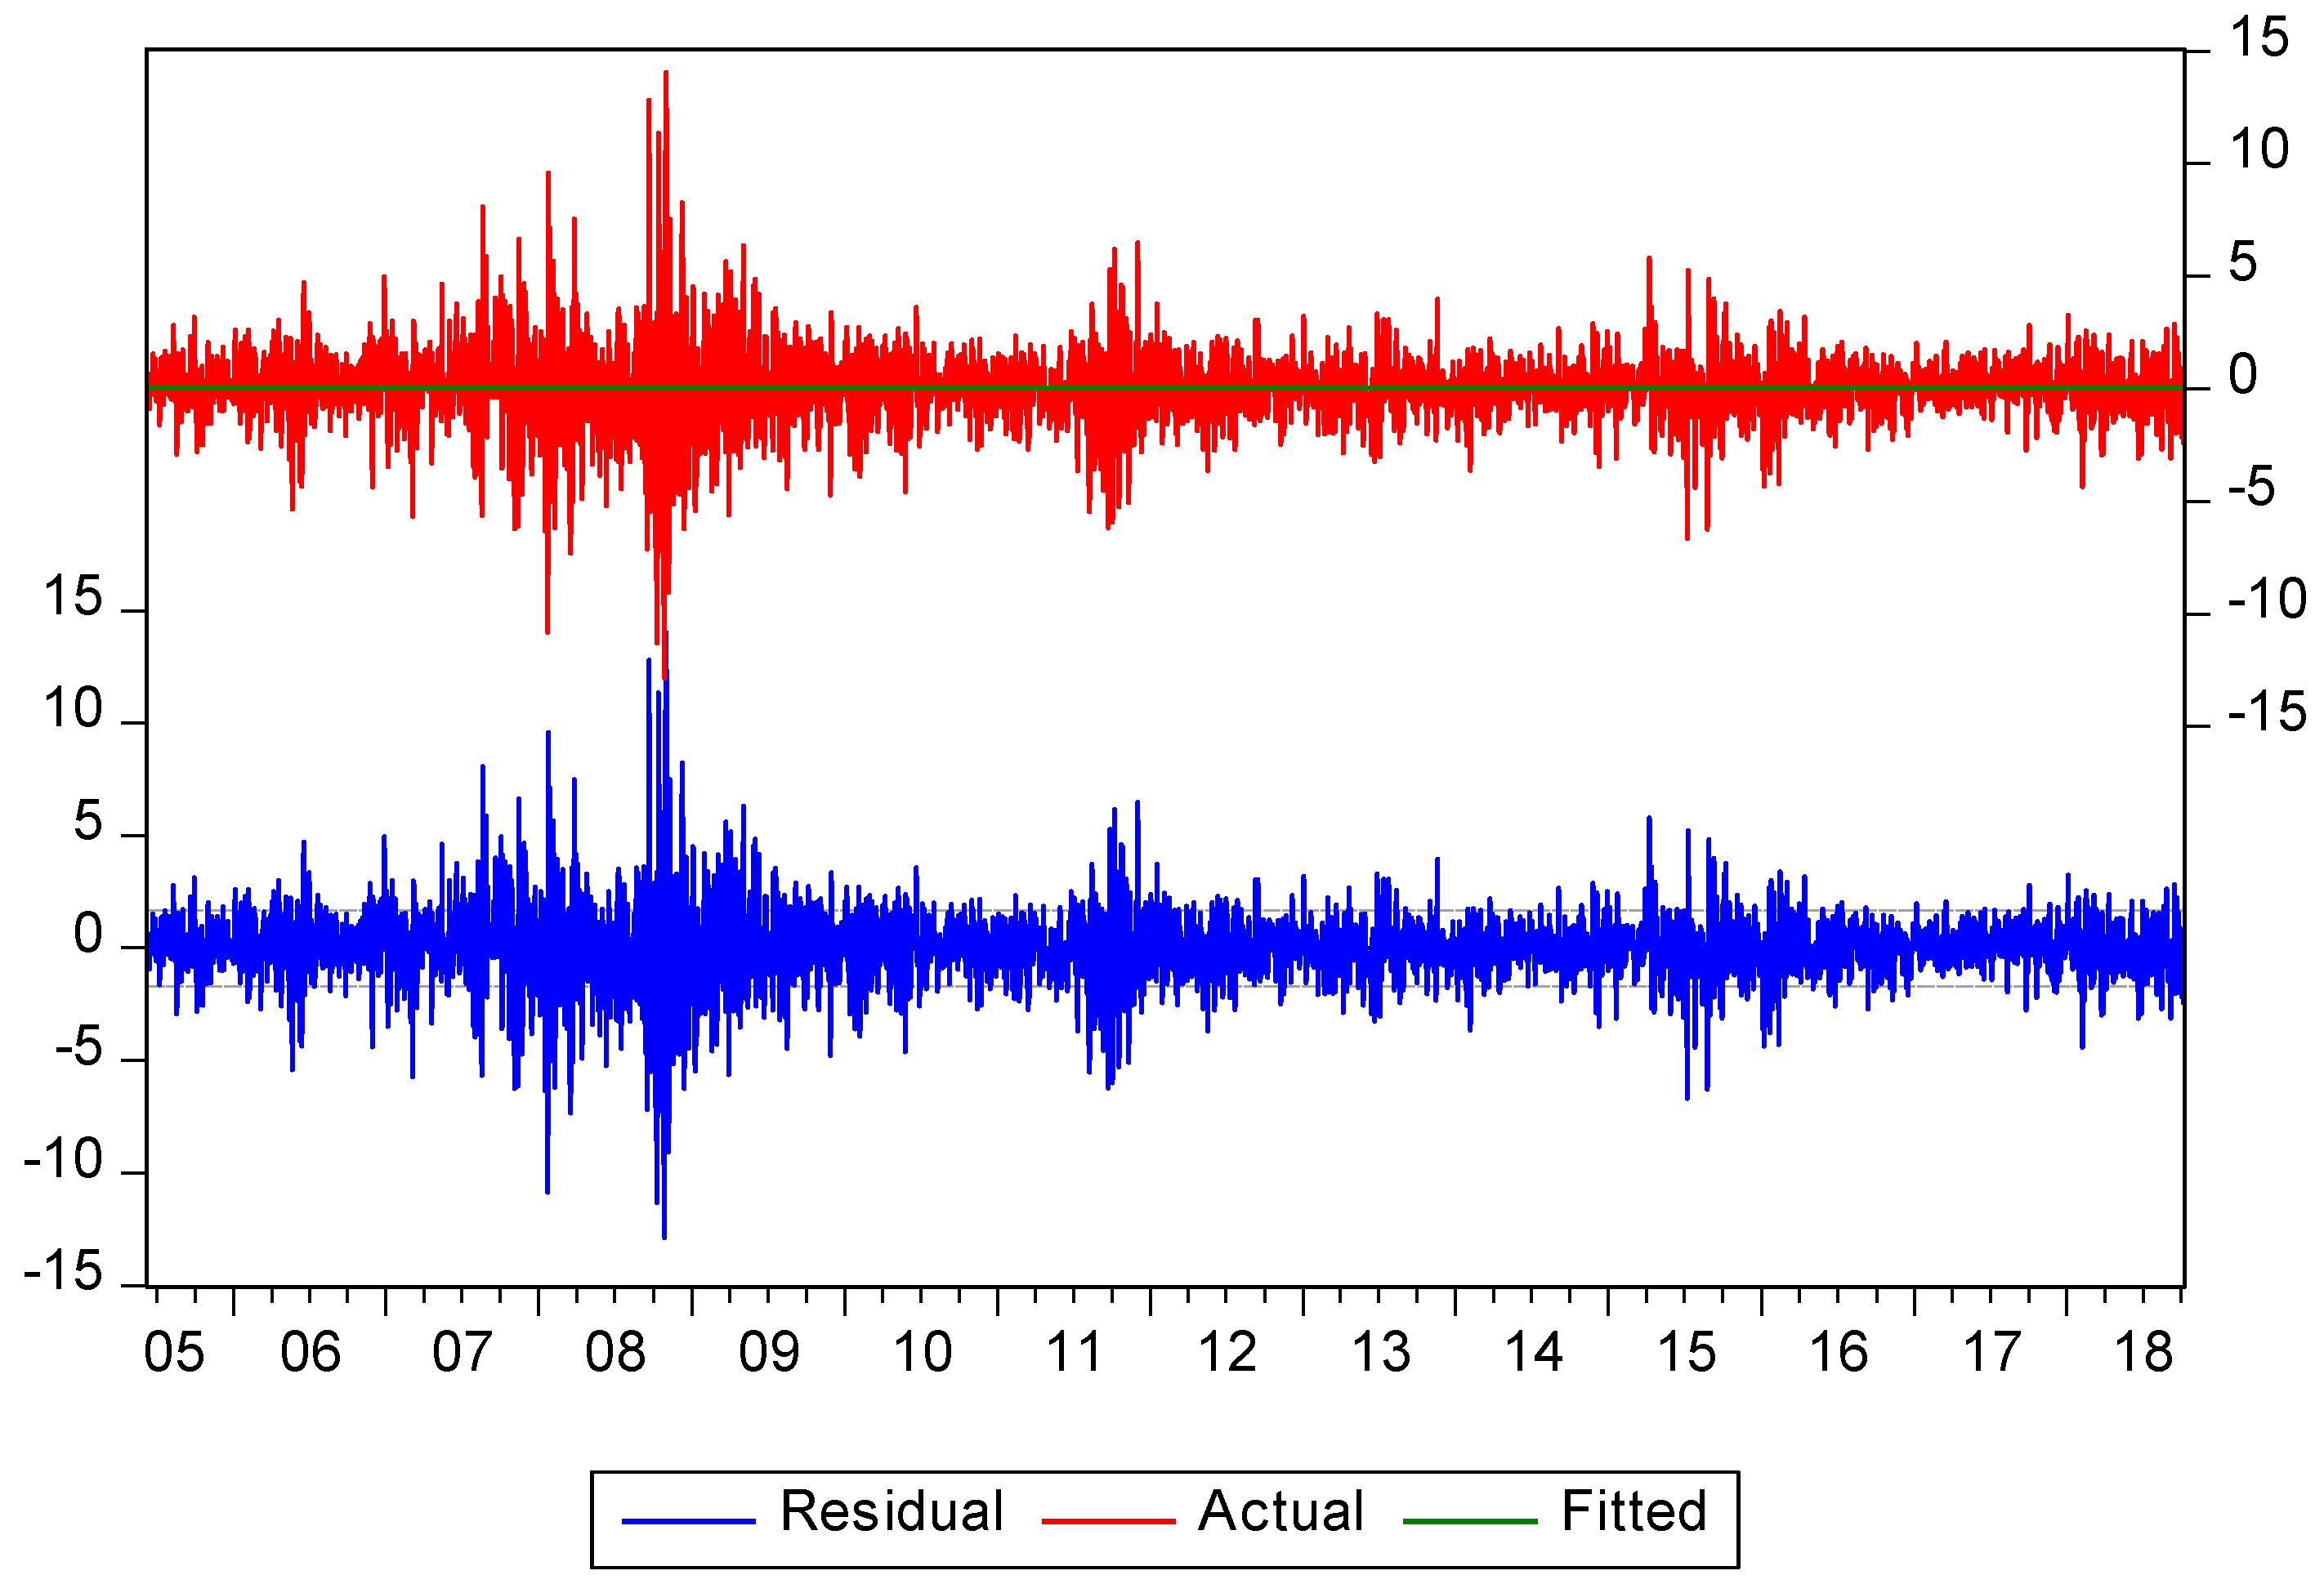
Appendix A
Figure A1.
Pakistani Series Normality Test.

Figure A2.
Pakistani Series Residuals.

Figure A3.
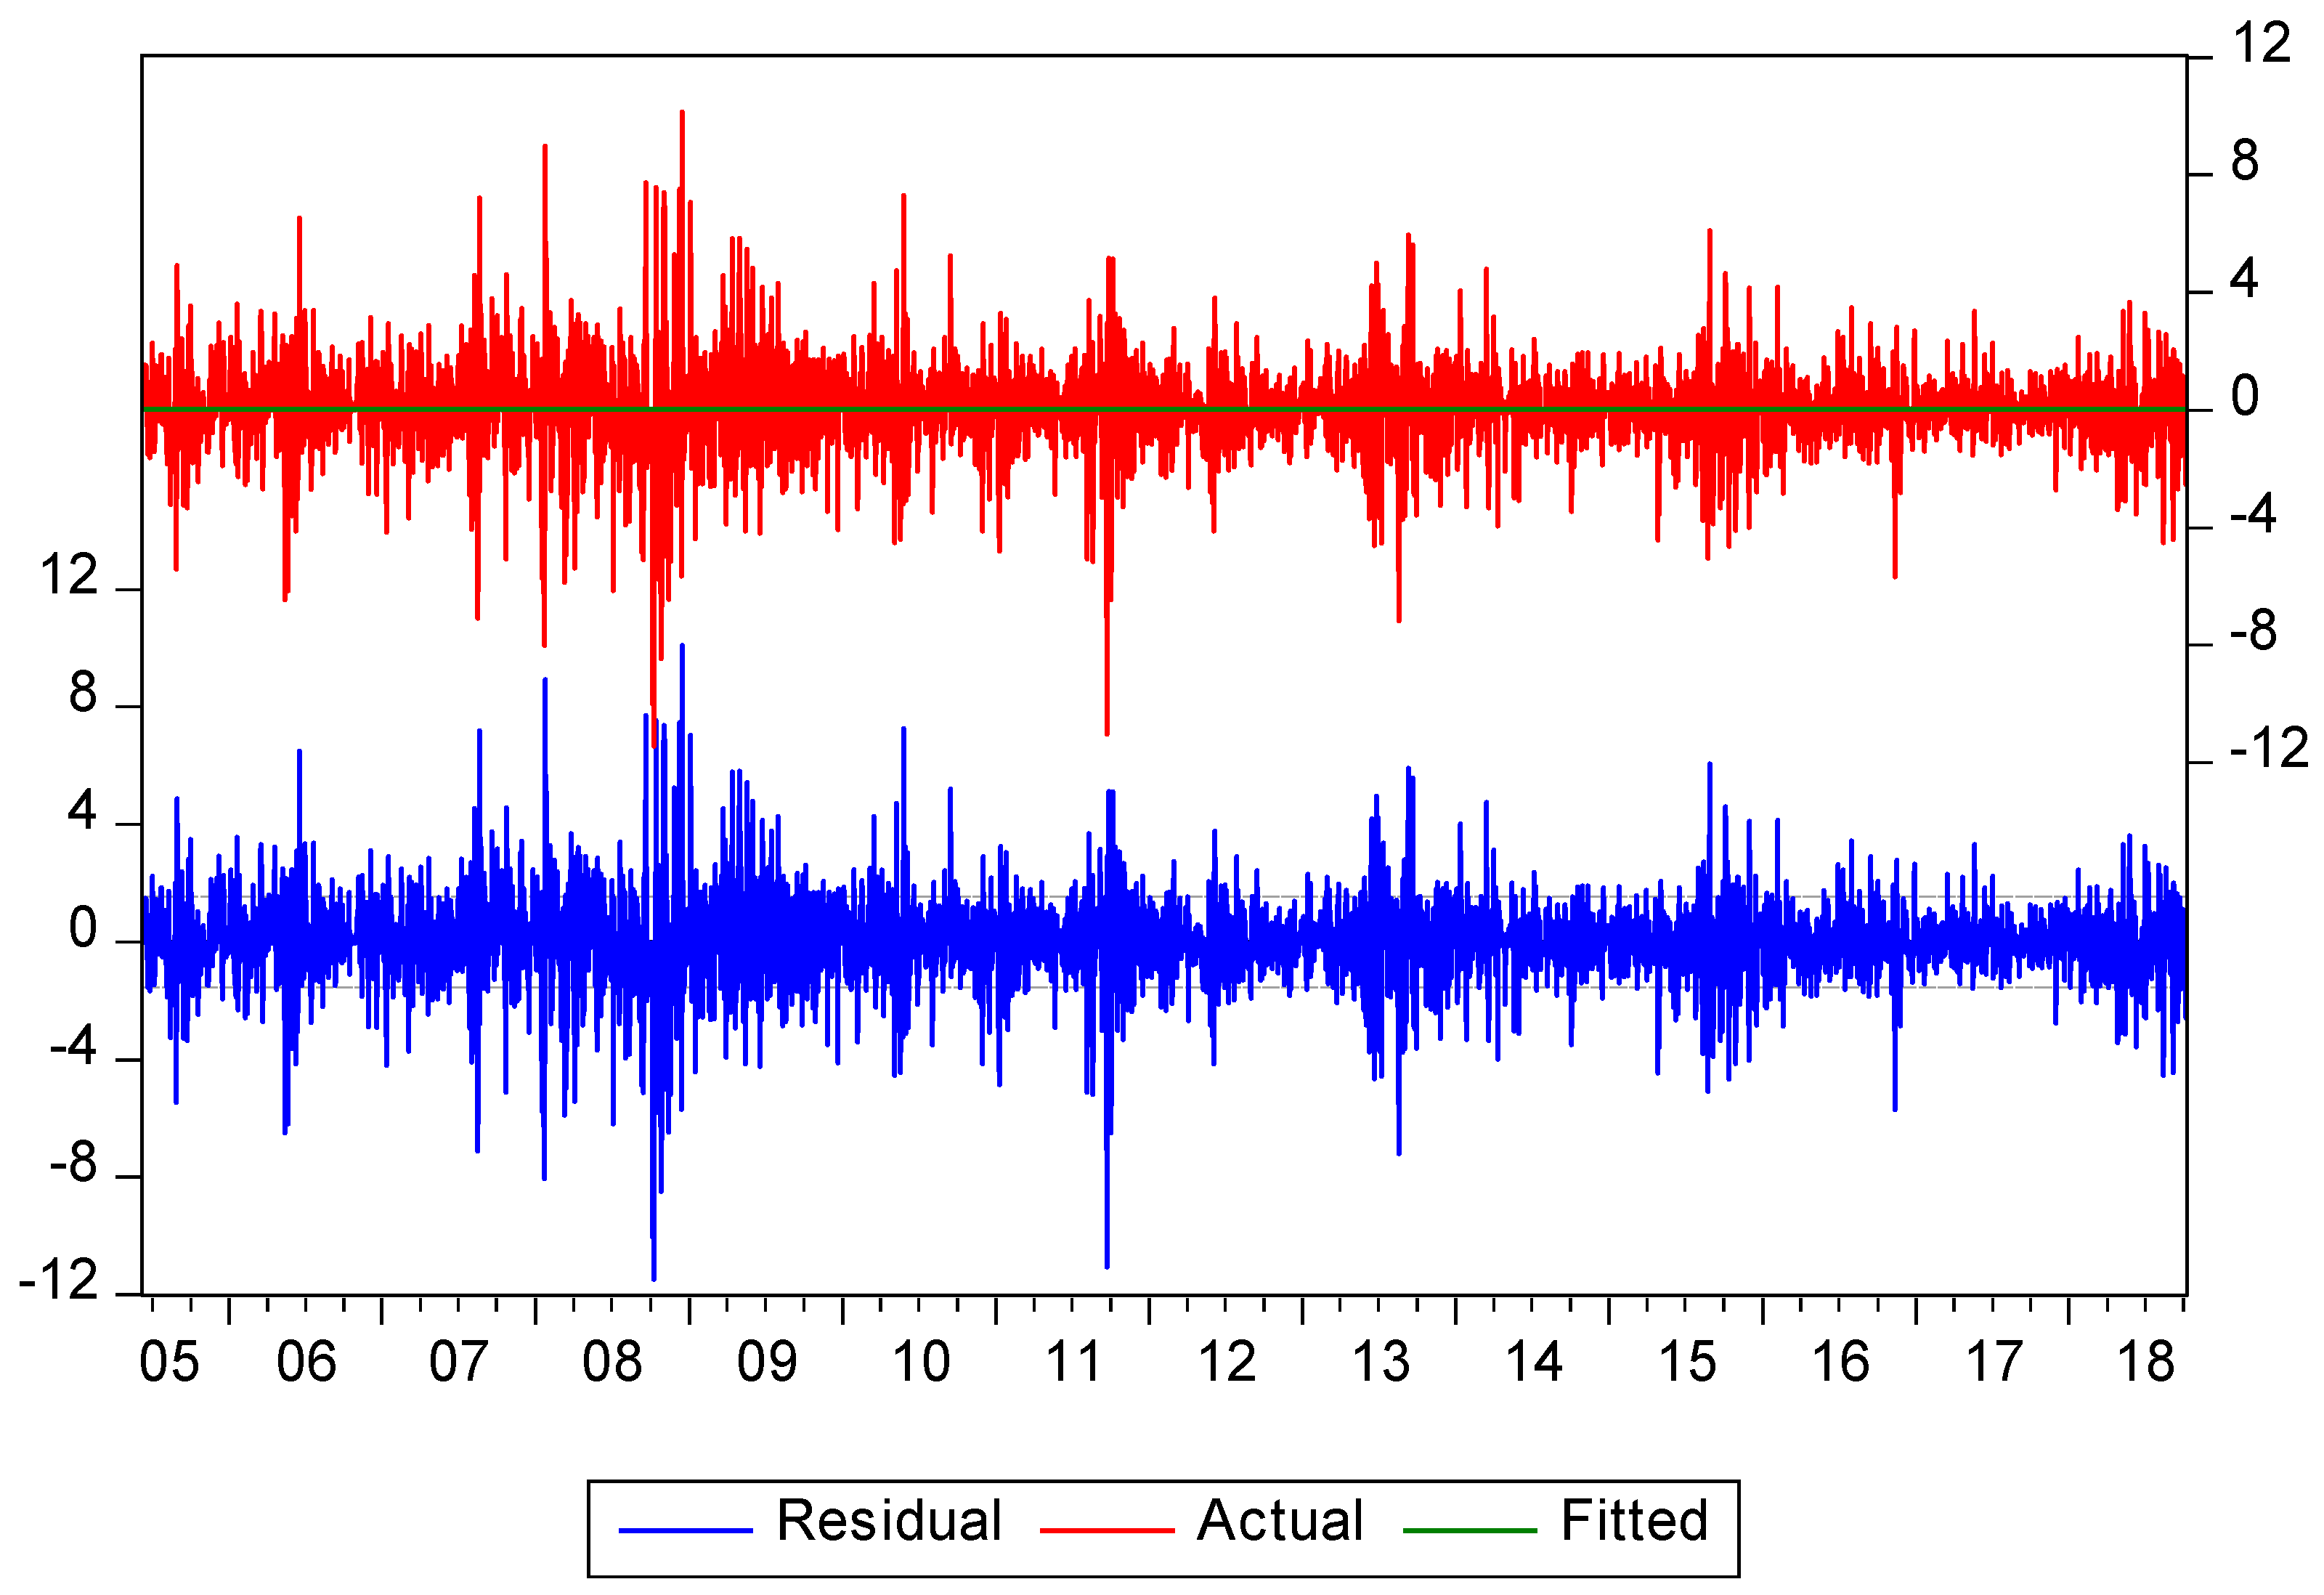
Chinese Series Normality Test.

Figure A4.
Chinese Series residual.

Figure A5.
Indonesian Series Normality Test.

Figure A6.
Indonesian Series residual.

Figure A7.
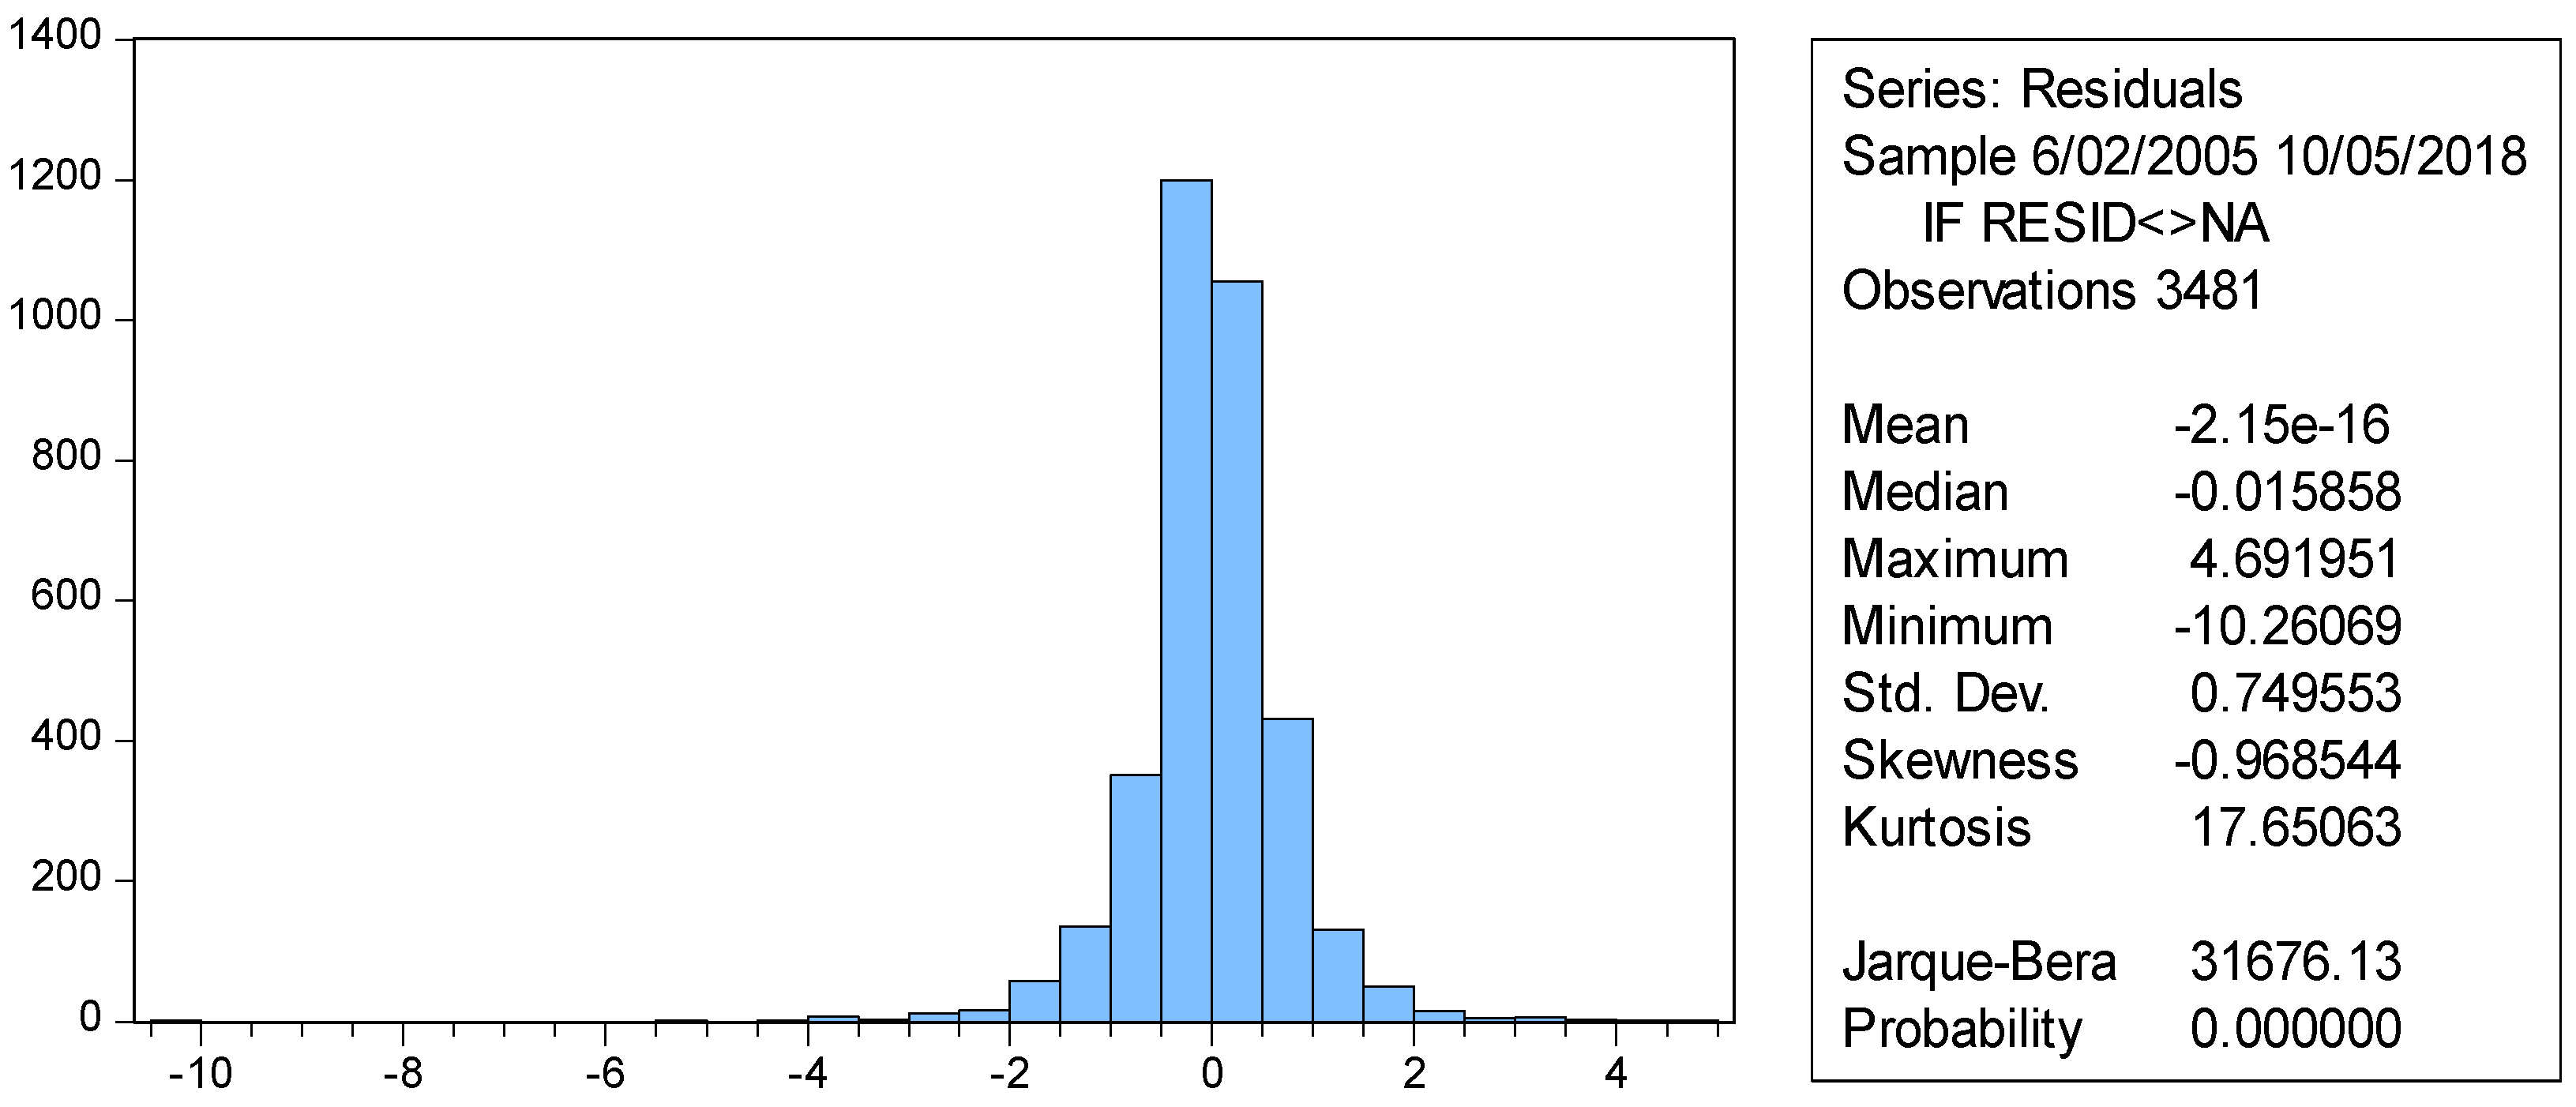
Malaysian Series Normality Test.

Figure A8.
Malaysian Series Residuals.

Figure A9.
US Series Normality Test.

Figure A10.
US Series Residuals.

Figure A11.
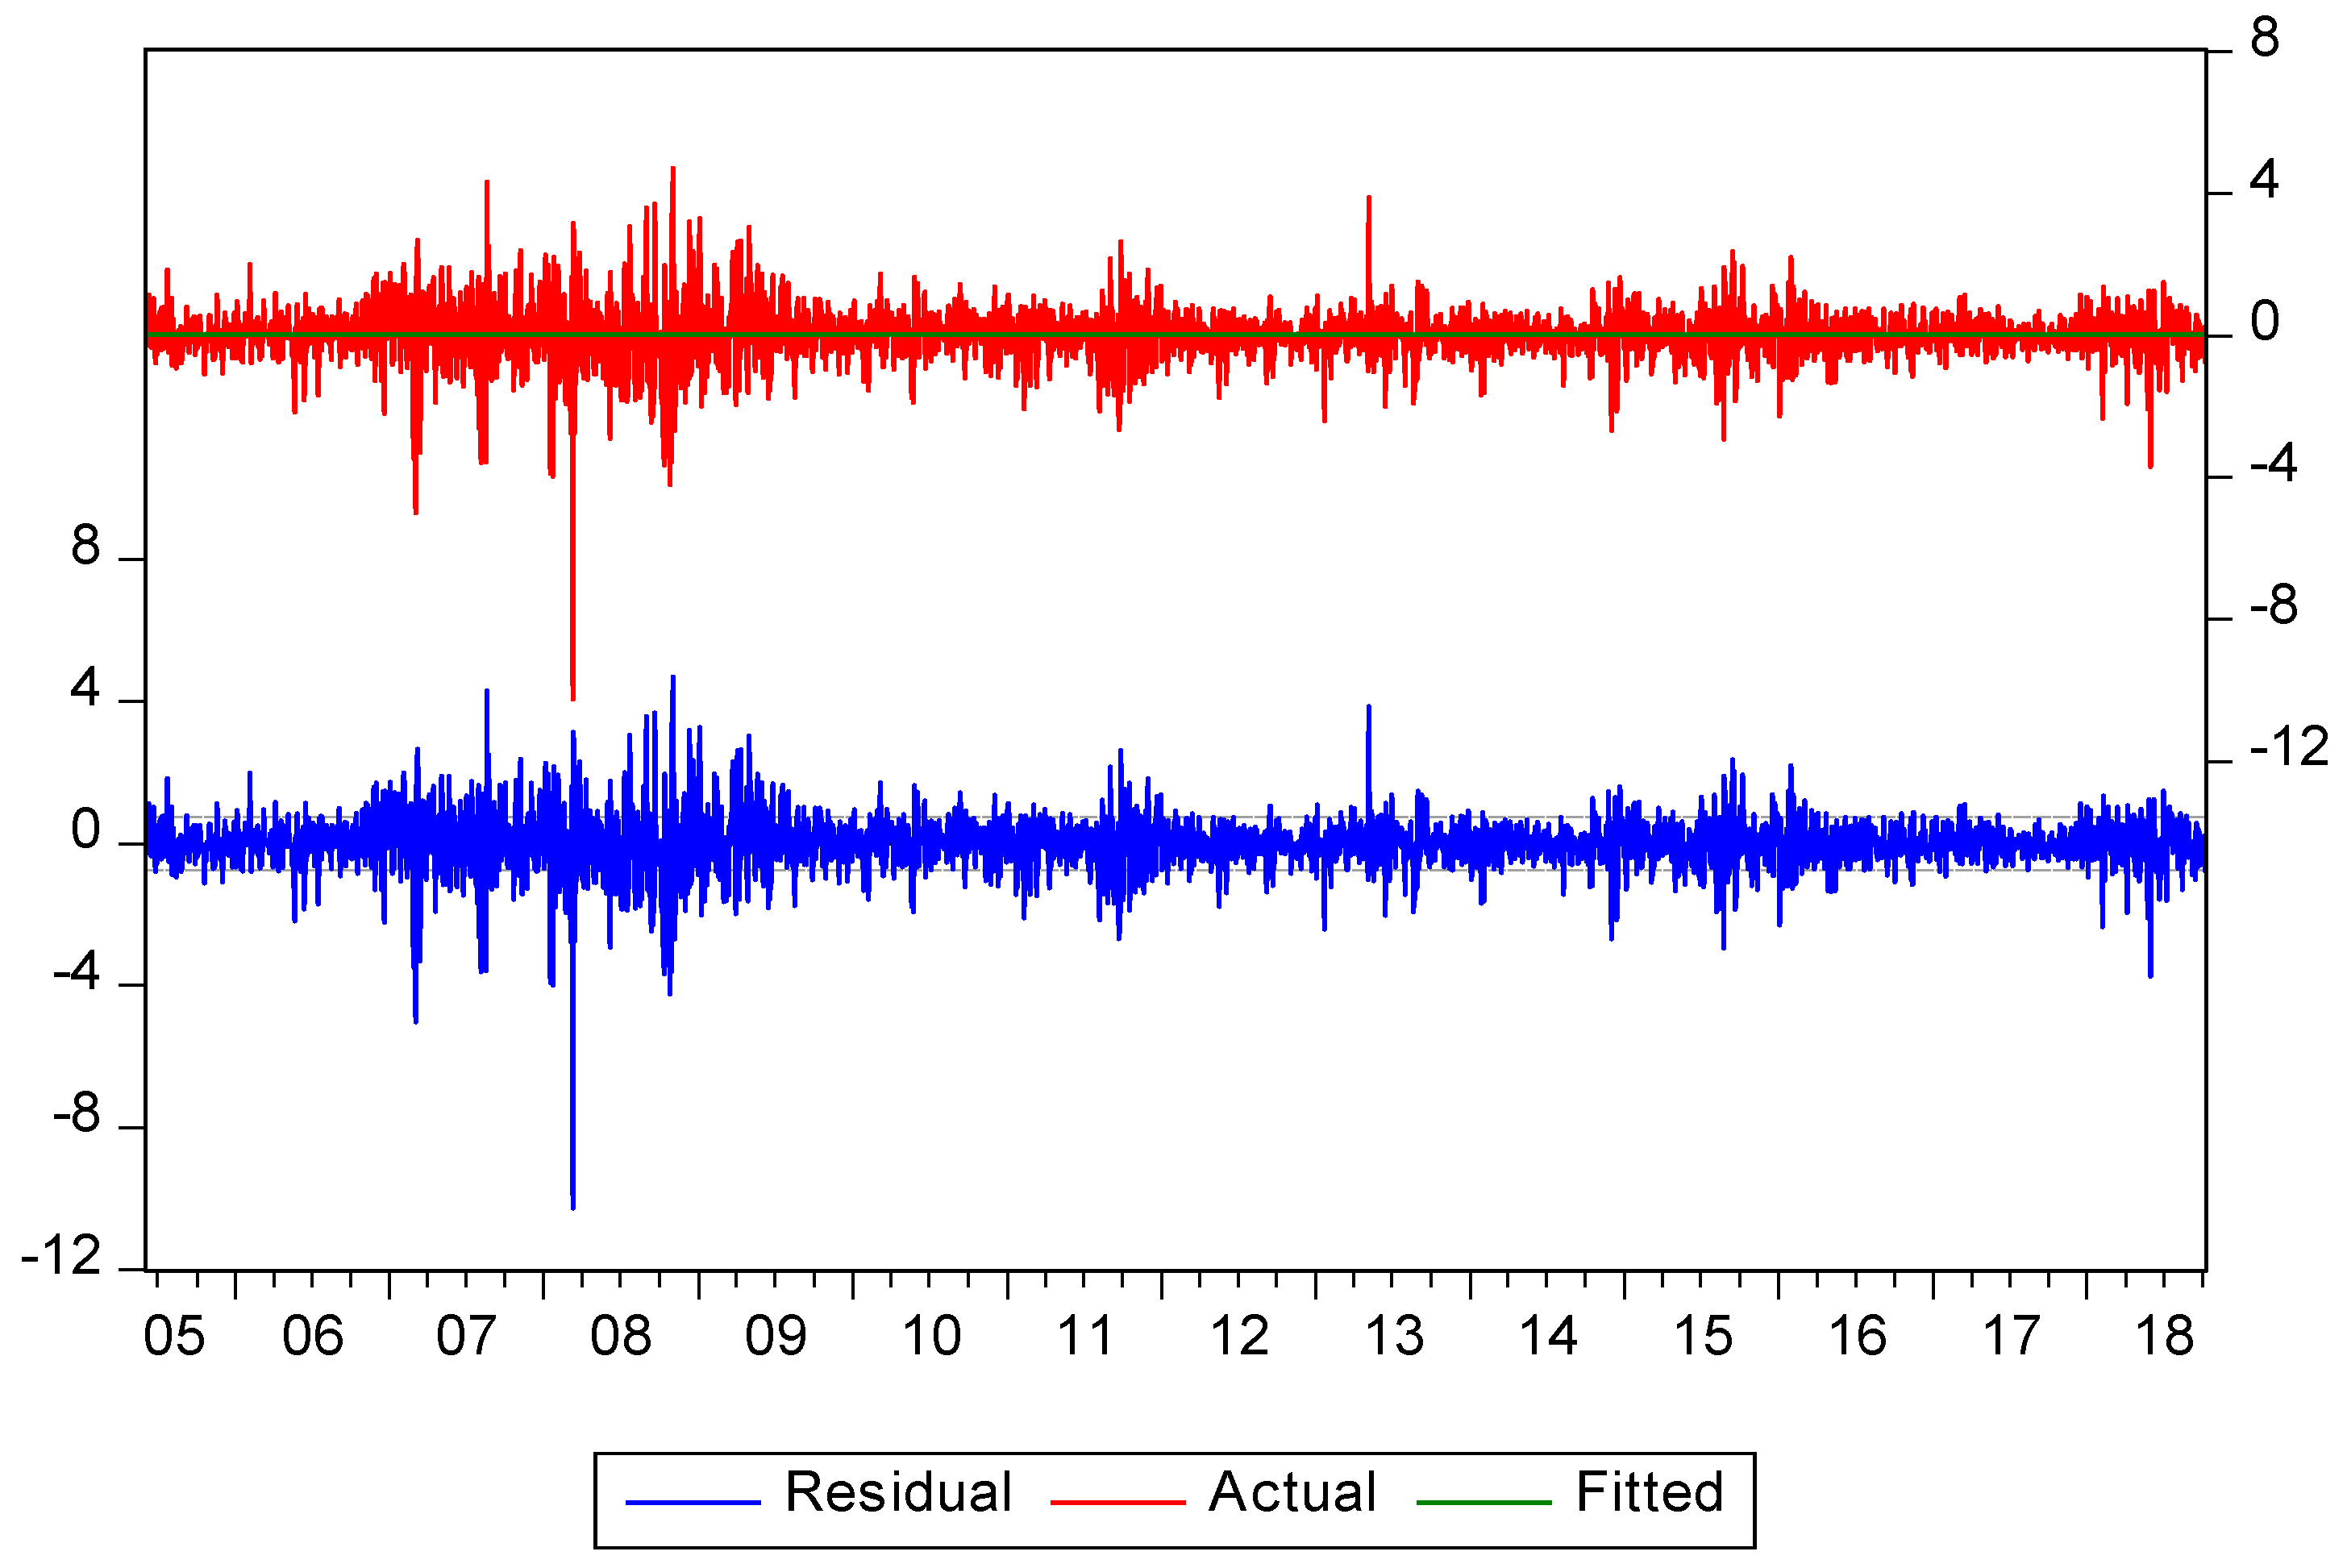
UK Series Normality Test.

Figure A12.
UK Series Residuals.

References
- Johnson, R.; Soenen, L. Asian economic integration and stock market comovement. J. Financ. Res. 2002, 25, 141–157. [Google Scholar] [CrossRef]
- Forbes, K.J.; Chinn, M.D. A decomposition of global linkages in financial markets over time. Rev. Econ. Stat. 2004, 86, 705–722. [Google Scholar] [CrossRef]
- Chen, N.-F.; Zhang, F. Correlations, trades and stock returns of the Pacific-Basin markets. Pac.-Basin Financ. J. 1997, 5, 559–577. [Google Scholar] [CrossRef]
- Manopimoke, P.; Prukumpai, S.; Sethapramote, Y. Dynamic Connectedness in Emerging Asian Equity Markets; Puey Ungphakorn Institute for Economic Research: Bangkok, Thailand, 2018. [Google Scholar]
- Gupta, R.; Guidi, F. Cointegration relationship and time varying co-movements among Indian and Asian developed stock markets. Int. Rev. Financ. Anal. 2012, 21, 10–22. [Google Scholar] [CrossRef] [Green Version]
- Chien, M.-S.; Lee, C.-C.; Hu, T.-C.; Hu, H.-T. Dynamic Asian stock market convergence: Evidence from dynamic cointegration analysis among China and ASEAN-5. Econ. Model. 2015, 51, 84–98. [Google Scholar] [CrossRef]
- Al Nasser, O.M.; Hajilee, M. Integration of emerging stock markets with global stock markets. Res. Int. Bus. Financ. 2016, 36, 1–12. [Google Scholar] [CrossRef]
- Marashdeh, H.A. Financial Integration of the MENA Emerging Stock Markets; University of Wollongong: Wollongong, Australia, 2006. [Google Scholar]
- Wälti, S. Stock market synchronization and monetary integration. J. Int. Money Financ. 2011, 30, 96–110. [Google Scholar] [CrossRef]
- De Brouwer, G. Financial Integration in East Asia; Cambridge University Press: Cambridge, UK, 1999. [Google Scholar]
- Obadan, M.I. Globalization of finance and the challenge of national financial sector development. J. Asian Econ. 2006, 17, 316–332. [Google Scholar] [CrossRef]
- Markowitz, H. Portfolio selection. J. Financ. 1952, 7, 77–91. [Google Scholar]
- Rogoff, K.S. The IMF Strikes Back. Available online: https://www.imf.org/en/News/Articles/2015/09/28/04/54/vc021003 (accessed on 11 August 2018).
- Chuluun, T. Global portfolio investment network and stock market comovement. Glob. Financ. J. 2017, 33, 51–68. [Google Scholar] [CrossRef]
- Vo, X.V.; Ellis, C. International financial integration: Stock return linkages and volatility transmission between Vietnam and advanced countries. Emerg. Mark. Rev. 2018, 36, 19–27. [Google Scholar] [CrossRef]
- Iqbal, A. Determinants of Political Governance and Investment Trends in Pakistan; Iqra University, Main Campus: Karachi, Pakistan, 2015. [Google Scholar]
- Siddiqui, S. Pakistan’s stock market: From Asia’s best to Asia’s worst|The Express Tribune. Pakistan Tribune, 19 December 2017. [Google Scholar]
- Siddiqui, S. PSX Ends as World’s Worst Market in 2017|The Express Tribune. The Express Tribune, 1 January 2018. [Google Scholar]
- Anwar, T.; Raza, M.Y. Economic Integration of Stock Markets: An Evidence from Pakistan, China and Malaysia Stock Exchanges. Manag. Organ. Stud. 2016, 3, 52. [Google Scholar] [CrossRef]
- Abdul Karim, B.; Shabri Abd. Majid, M. Does trade matter for stock market integration? Stud. Econ. Financ. 2010, 27, 47–66. [Google Scholar] [CrossRef]
- Paramati, S.R.; Gupta, R.; Hui, A. Trade and Investment Linkages and Stock Market Long-Run Relationship. Aust. Econ. Pap. 2016, 55, 149–169. [Google Scholar] [CrossRef]
- Engle, R. Dynamic conditional correlation: A simple class of multivariate generalized autoregressive conditional heteroskedasticity models. J. Bus. Econ. Stat. 2002, 20, 339–350. [Google Scholar] [CrossRef]
- Grubel, H.G. Internationally diversified portfolios: Welfare gains and capital flows. Am. Econ. Rev. 1968, 58, 1299–1314. [Google Scholar]
- Ferreira, P. Portuguese and Brazilian stock market integration: A non-linear and detrended approach. Port. Econ. J. 2017, 16, 49–63. [Google Scholar] [CrossRef]
- Panda, A.K.; Nanda, S. Time-varying synchronization and dynamic conditional correlation among the stock market returns of leading South American economies. Int. J. Manag. Financ. 2018, 14, 245–262. [Google Scholar] [CrossRef]
- Das, D.; Bhowmik, P.; Jana, R. A multiscale analysis of stock return co-movements and spillovers: Evidence from Pacific developed markets. Phys. A Stat. Mech. Appl. 2018, 502, 379–393. [Google Scholar] [CrossRef]
- Bracker, K.; Docking, D.S.; Koch, P.D. Economic determinants of evolution in international stock market integration. J. Empir. Financ. 1999, 6, 1–27. [Google Scholar] [CrossRef]
- Pretorius, E. Economic determinants of emerging stock market interdependence. Emerg. Mark. Rev. 2002, 3, 84–105. [Google Scholar] [CrossRef] [Green Version]
- Elyasiani, E.; Perera, P.; Puri, T.N. Interdependence and dynamic linkages between stock markets of Sri Lanka and its trading partners. J. Multinatl. Financ. Manag. 1998, 8, 89–101. [Google Scholar] [CrossRef]
- Paramati, S.R.; Roca, E.; Gupta, R. Economic integration and stock market dynamic linkages: Evidence in the context of Australia and Asia. Appl. Econ. 2016, 48, 4210–4226. [Google Scholar] [CrossRef]
- Vo, X.V. Trade integration and International financial Integration-Evidence from Asia. Singap. Econ. Rev. 2018. [Google Scholar] [CrossRef]
- Dhanaraj, S.; Gopalaswamy, A.K.; Babu, M.S. Trade, Financial Flows and Stock Market Interdependence: Evidence from Asian Markets; Madras School of Economics: Chennai, India, 2017. [Google Scholar]
- Vithessonthi, C.; Kumarasinghe, S. Financial development, international trade integration, and stock market integration: Evidence from Asia. J. Multinatl. Financ. Manag. 2016, 35, 79–92. [Google Scholar] [CrossRef]
- Nguyen, T.H.T.B.; Lam, A.H. Financial Development, International Trade, and Stock Market Integration: Evidence in Six Southeastern Asia Countries. J. Econ. Dev. 2017, 19, 5–17. [Google Scholar]
- Abdul Karim, Z.; Abdul Karim, B. Stock Market Integration: Malaysia and Its Major Trading Partners. Munich Personal RePEc Archive, MPRA Paper 2008. Available online: https://mpra.ub.uni-muenchen.de/id/eprint/26976 (accessed on 10 August 2018).
- Daelemans, B.; Daniels, J.P.; Nourzad, F. Free Trade Agreements and Volatility of Stock Returns and Exchange Rates: Evidence from NAFTA. Open Econ. Rev. 2018, 29, 141–163. [Google Scholar] [CrossRef]
- Chiou, W.-J.P. Who benefits more from international diversification? J. Int. Financ. Mark. Inst. Money 2008, 18, 466–482. [Google Scholar] [CrossRef]
- Paramati, S.R.; Zakari, A.; Jalle, M.; Kale, S.; Begari, P. The dynamic impact of bilateral trade linkages on stock market correlations of Australia and China. Appl. Econ. Lett. 2018, 25, 141–145. [Google Scholar] [CrossRef]
- Chevallier, J.; Nguyen, D.K.; Siverskog, J.; Uddin, G.S. Market integration and financial linkages among stock markets in Pacific Basin countries. J. Empir. Financ. 2018, 46, 77–92. [Google Scholar] [CrossRef]
- Diebold, F.X.; Yilmaz, K. Measuring Financial Asset Return and Volatility Spillovers, with Application to Global Equity Markets. Econ. J. 2009, 119, 158–171. [Google Scholar] [CrossRef]
- Diebold, F.X.; Yilmaz, K. Better to give than to receive: Predictive directional measurement of volatility spillovers. Int. J. Forecast. 2012, 28, 57–66. [Google Scholar] [CrossRef] [Green Version]
- Najeeb, S.F.; Bacha, O.; Masih, M. Does heterogeneity in investment horizons affect portfolio diversification? Some insights using M-GARCH-DCC and wavelet correlation analysis. Emerg. Mark. Financ. Trade 2015, 51, 188–208. [Google Scholar] [CrossRef]
- Jiang, Y.; Yu, M.; Hashmi, S.M. The Financial Crisis and Co-Movement of Global Stock Markets—A Case of Six Major Economies. Sustainability 2017, 9, 260. [Google Scholar] [CrossRef]
- Nath Mukherjee, K.; Mishra, R.K. Stock market integration and volatility spillover: India and its major Asian counterparts. Res. Int. Bus. Financ. 2010, 24, 235–251. [Google Scholar] [CrossRef] [Green Version]
- Sharma, A.; Seth, N. Literature review of stock market integration: A global perspective. Qual. Res. Financ. Mark. 2012, 4, 84–122. [Google Scholar] [CrossRef]
- Engle, R.F. Autoregressive conditional heteroscedasticity with estimates of the variance of United Kingdom inflation. Econom. J. Econom. Soc. 1982, 50, 987–1007. [Google Scholar] [CrossRef]
- Bollerslev, T. Generalized autoregressive conditional heteroskedasticity. J. Econom. 1986, 31, 307–327. [Google Scholar] [CrossRef] [Green Version]
- Kenourgios, D.; Samitas, A. Equity market integration in emerging Balkan markets. Res. Int. Bus. Financ. 2011, 25, 296–307. [Google Scholar] [CrossRef]
- Bollerslev, T. Modelling the coherence in short-run nominal exchange rates: A multivariate generalized ARCH model. Rev. Econ. Stat. 1990, 72, 498–505. [Google Scholar] [CrossRef]
- Su, J.-B.; Hung, J.-C. The Value-At-Risk Estimate of Stock and Currency-Stock Portfolios’ Returns. Risks 2018, 6, 133. [Google Scholar] [CrossRef]
- Ismail, M.T.; Audu, B.; Tumala, M.M. Comparison of forecasting performance between MODWT-GARCH(1,1) and MODWT-EGARCH(1,1) models: Evidence from African stock markets. J. Financ. Data Sci. 2016, 2, 254–264. [Google Scholar] [CrossRef]
- Hkiri, B.; Hammoudeh, S.; Aloui, C.; Shahbaz, M. The interconnections between US financial CDS spreads and control variables: New evidence using partial and multivariate wavelet coherences. Int. Rev. Econ. Financ. 2018, 57, 237–257. [Google Scholar] [CrossRef]
- Sakti, M.R.P.; Masih, M.; Saiti, B.; Tareq, M.A. Unveiling the diversification benefits of Islamic equities and commodities: Evidence from multivariate-GARCH and continuous wavelet analysis. Manag. Financ. 2018, 44, 830–850. [Google Scholar] [CrossRef]
- Jaffar, Y.; Dewandaru, G.; Masih, M. Exploring Portfolio Diversification Opportunities Through Venture Capital Financing: Evidence from MGARCH-DCC, Markov Switching, and Wavelet Approaches. Emerg. Mark. Financ. Trade 2018, 54, 1320–1336. [Google Scholar] [CrossRef]
- Pesaran, B.; Pesaran, M.H. Time Series Econometrics Using Microfit 5.0: A User’s Manual; Oxford University Press, Inc.: Oxford, UK, 2010. [Google Scholar]
- Buriev, A.A.; Dewandaru, G.; Zainal, M.-P.; Masih, M. Portfolio diversification benefits at different investment horizons during the Arab uprisings: Turkish perspectives based on MGARCH–DCC and wavelet approaches. Emerg. Mark. Financ. Trade 2018, 54, 3272–3293. [Google Scholar] [CrossRef]
- Lim, S.J.; Masih, M. Exploring Portfolio Diversification Opportunities in Islamic Capital Markets through Bitcoin: Evidence from MGARCH-DCC and Wavelet Approaches. Munich Personal RePEc Archive, MPRA Paper 2017. Available online: https://mpra.ub.uni-muenchen.de/id/eprint/79752 (accessed on 10 August 2018).
- Arouri, M.E.H.; Jawadi, F.; Nguyen, D.K. The Dynamics of Emerging Stock Markets; Physica-Verlag HD: Heidelberg, Germany, 2010; ISBN 978-3-7908-2389-9. [Google Scholar]
- Balanda, K.P.; MacGillivray, H. Kurtosis: A critical review. Am. Stat. 1988, 42, 111–119. [Google Scholar]
- Saiti, B.; Noordin, N.H. Does Islamic equity investment provide diversification benefits to conventional investors? Evidence from the multivariate GARCH analysis. Int. J. Emerg. Mark. 2018, 13, 267–289. [Google Scholar] [CrossRef]
- Pesaran, M.H. Time Series and Panel Data Econometrics; Oxford University Press: Oxford, UK, 2015. [Google Scholar]
- Narayan, S.; Sriananthakumar, S.; Islam, S. Stock market integration of emerging Asian economies: Patterns and causes. Econ. Model. 2014, 39, 19–31. [Google Scholar] [CrossRef]
Figure 1.
Dynamics of daily stock prices.

Figure 2.
Dynamics of daily equity market returns.

Figure 3.
A Plot of conditional Volatilities of daily returns.

Figure 4.
A Plot of conditional correlations of Pakistan and its trading partners.


Table 1.
Summary of Important Empirical Studies on Stock Market Integrations.
| Studies | Countries | Data and Frequency | Models | Results |
|---|---|---|---|---|
| Paramati, S. R., Roca, E., & Gupta, R. [30] | Australia and ten Asian trade partners. | MSCI weekly prices for the period 1999 to 2013. | Cointegration, AGDCC-GARCH, and Multiple regression models. | Increasing trade linkages have increased the stock market integration. |
| Paramati, S. R., Zakari, A., Jalle, M., Kale, S., & Begari, P. [38] | Australia and China. | MSCI weekly prices for the period January 1993 to December 2015. | OLS, DOLS, and, FMOLS models | Trade caused an increase in stock market integration and decreased the portfolio diversification. |
| Paramati, S. R., Gupta, R., & Hui, A. [21] | Australia, and 13 trade and investment partners. | Weakly closing prices from 1992 to 2013. | Cointegration, AGDCC-GARCH, and Multiple regression. | There are varying Cointegration and correlation which has changed before and after GFC. |
| Vithessonthi, C., & Kumarasinghe, S. [33] | Fifteen developed and the developing countries in Asia. | Daily MSCI stock returns 1985–2013 and other yearly economic indicators. | OLS Regression, Fixed Effect, Random effect, and correlation. | A country’s financial development has an impact on the stock market integration with international stock markets. |
| Thuy Bach Nguyen, T. H., & Huynh Lam, A. [34] | Vietnam and five ASEAN countries. | Daily MSCI stock returns 2000–2015 and other economic indicators. | OLS Regression, Fixed Effect, Random effect, and correlation. | Trade integration affect stock market integration. |
| Abdul Karim, B., & Shabri Abd. Majid, M. [20] | Major trading partners of Malaysia. | Weekly stock indices 1992–2008. | ARDL, and VAR models. | Malaysian stock market is found to be integrated with the stock markets of its trading partners. |
| Abdul Karim, Z., & Abdul Karim, B. [35] | Malaysia and its major trading partners. | Weekly data from 1998–2007. | Cointegration, VECM and Granger causality test. | The stronger the economic ties between the countries higher the stock market integration. |
| Chevallier, J., Nguyen, D. K., Siverskog, J., & Uddin, G. S. [39] | Fourteen countries from Pacific Basin. | Daily stock indices return for the period of 1993–2014. | Diebold and Yilmaz [40,41] Spillover index and impulse response. function (IRF). | ASEAN emerging markets are exposed to US shocks. Stock market interrelationship has increased over time which reduces the diversification benefits. |
| Daelemans, B., Daniels, J. P., & Nourzad, F. [36] | Canada, Mexico, and the United States. | Daily stock indices return for the period of 1994–2014. Bilateral exchange rates. | DCC-GARCH model. | Free-trade agreement affects differently to exchange rate and stock market returns. Canada and Mexico are more correlated as compared to the USA. |
| Najeeb, S. F., Bacha, O., & Masih, M. [42] | Different benchmark mark Islamic stock indices. | Daily closing prices for the period of 2006–2013. | DCC-GARCH, continuous wavelet transformation (CWT), and Maximum Overlap Discrete Wavelet Transform (MODWT) models. | There are portfolio diversification benefits for the investors in Islamic stock market for the short holding period. |
| Jiang, Yu, & Hashmi. [43] | Six Major Economies US, UK, mainland China, Hong Kong, Japan, and Germany. | Period divided into three sub-periods. Daily stock market prices June 2006 to July 2010. | VAR model, Granger causality tests and impulse response. | The GFC has increased the co-movements among the economies selected. |
| Ferreira, P. [24] | Portuguese and Brazilian. | Daily data from 1993 to 2016. The whole sample was divided into six sub-periods to make a comparison among the periods. | DFA, DCCA and DMCA. | The integration between the markets increased; however, the results showed that the Portuguese and Brazilian investors could gain as from the international portfolio diversification. |
| Panda, A. K., & Nanda, S. [25] | Six Leading South American countries. | Weekly stock indices from 1995 to 2015 | GJR-GARCH and DCC-GARCH. | Asymmetry in returns and the increasing integration among the countries is found. |
Table 2.
Selected countries and their indices.
| Stock Market | Symbols | Benchmark Indices | MSCI Status |
|---|---|---|---|
| Pakistan | PAK | MSCI Pakistan Index | Emerging market |
| China | CHIN | MSCI China Index | Emerging market |
| Indonesia | INDO | MSCI Indonesia Index | Emerging market |
| Malaysia | MAL | MSCI Malaysia Index | Emerging market |
| United States | US | MSCI USA Index | Developed market |
| United Kingdom | UK | MSCI UK Index | Developed market |
Table 3.
Descriptive statistics of MSCI indices returns.
| Pakistan | China | Indonesia | Malaysia | US | UK | |
|---|---|---|---|---|---|---|
| Mean | 0.0126 | 0.0319 | 0.0422 | 0.0192 | 0.0255 | 0.0097 |
| Median | 0.0000 | 0.0000 | 0.0121 | 0.0034 | 0.0410 | 0.0107 |
| Maximum | 9.3312 | 14.0593 | 10.1349 | 4.7111 | 11.0419 | 9.2652 |
| Minimum | −12.8845 | −12.8377 | −11.4490 | −10.2415 | −9.5141 | −9.1580 |
| Std. Dev. | 1.4120 | 1.6890 | 1.5556 | 0.7494 | 1.1650 | 1.1294 |
| Skewness | −0.5061 | −0.0417 | −0.3282 | −0.9687 | −0.4014 | −0.1513 |
| Kurtosis | 8.1403 | 10.8332 | 9.0177 | 17.6557 | 15.5153 | 11.5428 |
| Jarque–Bera | 3982.08 | 8903.23 | 5316.33 | 31707.11 | 22818.17 | 10601.26 |
| Probability | 0.000 | 0.000 | 0.000 | 0.000 | 0.000 | 0.000 |
| Sum | 44.007 | 111.179 | 146.765 | 66.865 | 88.662 | 33.939 |
| Sum Sq. Dev. | 6940.66 | 9930.06 | 8424.09 | 1955.17 | 4724.24 | 4440.29 |
| Observations | 3482 | 3482 | 3482 | 3482 | 3482 | 3482 |
Table 4.
ADF, Ljung–Box Q-statistics, LM, and ARCH effect tests.
| Pakistan | China | Indonesia | Malaysia | US | UK | |
|---|---|---|---|---|---|---|
| ADF(Level) | −36.2750 | −57.2736 | −54.2688 | −53.1820 | −46.2989 | −28.2440 |
| Probability | 0.0000 | 0.0000 | 0.0000 | 0.0001 | 0.0000 | 0.0000 |
| ADF (1st difference) | −24.3141 | −20.7381 | −20.8440 | −23.2532 | −22.9411 | −21.8649 |
| Probability | 0.0000 | 0.0000 | 0.0000 | 0.0001 | 0.0000 | 0.0000 |
| Q-Statistics | 81.5660 | 3.0101 | 24.0910 | 36.9440 | 32.1610 | 3.4023 |
| Probability | 0.0000 | 0.0830 | 0.0000 | 0.0000 | 0.0000 | 0.0650 |
| LM test | 91.7990 | 3.0249 | 24.1519 | 37.0981 | 44.2551 | 13.0839 |
| Probability | 0.0000 | 0.2204 | 0.0000 | 0.0000 | 0.0000 | 0.0014 |
| ARCH effect | 441.1908 | 238.1075 | 140.3748 | 48.9674 | 169.3661 | 207.7931 |
| Probability | 0.0000 | 0.0000 | 0.0000 | 0.0000 | 0.0000 | 0.0000 |
Table 5.
Correlation Matrix.
| Countries | Pakistan | China | Indonesia | Malaysia | US | UK |
|---|---|---|---|---|---|---|
| Pakistan | 1 | 0.089 | 0.111 | 0.145 | 0.022 | 0.052 |
| China | 1 | 0.542 | 0.502 | 0.233 | 0.408 | |
| Indonesia | 1 | 0.488 | 0.135 | 0.304 | ||
| Malaysia | 1 | 0.111 | 0.305 | |||
| US | 1 | 0.577 | ||||
| UK | 1 |
Table 6.
Maximum Likelihood estimates of the t-DCC model on stock indices daily returns.
| Parameter | Probability | |||
|---|---|---|---|---|
| Pakistan | 0.77099 | 0.19485 | 0.000 | 0.03416 |
| China | 0.91925 | 0.07022 | 0.000 | 0.01052 |
| Indonesia | 0.86909 | 0.11007 | 0.000 | 0.02084 |
| Malaysia | 0.87530 | 0.10905 | 0.000 | 0.01565 |
| US | 0.87884 | 0.11006 | 0.000 | 0.01110 |
| UK | 0.89884 | 0.08730 | 0.000 | 0.01385 |
The decay factors = 0.00509 where = 0.9892, and = 0.0056; Maximized Log-Likelihood = −26,121.4, df = 9.1781.
Table 7.
Maximum Likelihood estimates of the Gaussian DCC model on stock indices daily returns.
| Parameter | Probability | |||
|---|---|---|---|---|
| Pakistan | 0.78330 | 0.18530 | 0.000 | 0.03140 |
| China | 0.91792 | 0.07341 | 0.000 | 0.00866 |
| Indonesia | 0.87606 | 0.10457 | 0.000 | 0.01937 |
| Malaysia | 0.86978 | 0.11500 | 0.000 | 0.01522 |
| US | 0.87443 | 0.11311 | 0.000 | 0.01246 |
| UK | 0.87970 | 0.10420 | 0.000 | 0.01610 |
The decay factors = 0.00568 where = 0.9884, and = 0.0058; Maximized Log-Likelihood = −26,554.0.
Table 8.
Rank of unconditional volatilities.
| Rank | Countries | Benchmark Indices | Unconditional Volatility |
|---|---|---|---|
| 1 | China | MSCI China Index | 1.6871 |
| 2 | Indonesia | MSCI Indonesia Index | 1.6005 |
| 3 | Pakistan | MSCI Pakistan Index | 1.3600 |
| 4 | US | MSCI USA Index | 1.1215 |
| 5 | UK | MSCI UK Index | 1.1065 |
| 6 | Malaysia | MSCI Malaysia Index | 0.7606 |
Table 9.
t-DCC Estimated Unconditional Correlation and volatilities.
| Pakistan | China | Indonesia | Malaysia | US | UK | |
|---|---|---|---|---|---|---|
| Pakistan | 1.36000 | |||||
| China | 0.08813 | 1.68710 | ||||
| Indonesia | 0.11257 | 0.52269 | 1.60050 | |||
| Malaysia | 0.14648 | 0.47821 | 0.47924 | 0.76065 | ||
| US | 0.020233 | 0.23549 | 0.14842 | 0.09691 | 1.12150 | |
| UK | 0.053134 | 0.40849 | 0.31304 | 0.29587 | 0.56293 | 1.10650 |
© 2019 by the authors. Licensee MDPI, Basel, Switzerland. This article is an open access article distributed under the terms and conditions of the Creative Commons Attribution (CC BY) license (http://creativecommons.org/licenses/by/4.0/).
Share and Cite
MDPI and ACS Style
Joyo, A.S.; Lefen, L. Stock Market Integration of Pakistan with Its Trading Partners: A Multivariate DCC-GARCH Model Approach. Sustainability 2019, 11, 303. https://0-doi-org.brum.beds.ac.uk/10.3390/su11020303
AMA Style
Joyo AS, Lefen L. Stock Market Integration of Pakistan with Its Trading Partners: A Multivariate DCC-GARCH Model Approach. Sustainability. 2019; 11(2):303. https://0-doi-org.brum.beds.ac.uk/10.3390/su11020303
Chicago/Turabian StyleJoyo, Ahmed Shafique, and Lin Lefen. 2019. "Stock Market Integration of Pakistan with Its Trading Partners: A Multivariate DCC-GARCH Model Approach" Sustainability 11, no. 2: 303. https://0-doi-org.brum.beds.ac.uk/10.3390/su11020303
Note that from the first issue of 2016, this journal uses article numbers instead of page numbers. See further details here.