Response of Water Resources to Future Climate Change in a High-Latitude River Basin


1
Key Laboratory of Wetland Ecology and Environment, Northeast Institute of Geography and Agroecology, Chinese Academy of Sciences, No.4888, Shengbei Street, Changchun 130102, China
2
School of Renewable Natural Resources, Louisiana State University Agricultural Center, Baton Rouge, LA 70803, USA
3
Institute of Hydraulic and Electric Power, Heilongjiang University, No.74, Xuefu Road, Harbin 150080, China
4
Institute of Meteorology in Heilongjiang Province, Harbin 150080, China
*
Author to whom correspondence should be addressed.
Sustainability 2019, 11(20), 5619; https://0-doi-org.brum.beds.ac.uk/10.3390/su11205619
Submission received: 22 August 2019
/
Revised: 21 September 2019
/
Accepted: 11 October 2019
/
Published: 12 October 2019
(This article belongs to the Special Issue Water Resources and Green Growth)
Abstract
:Global water resources are affected by climate change as never before. However, it is still unclear how water resources in high latitudes respond to climate change. In this study, the water resource data for 2021–2050 in the Naoli River Basin, a high-latitude basin in China, are calculated by using the SWAT-Modflow Model and future climate scenarios RCP4.5 and RCP8.5. The results show a decreasing trend. When compared to the present, future streamflow is predicted to decrease by 2.73 × 10⁸ m3 in 2021–2035 and by 1.51 × 108 m3 in 2036–2050 in the RCP4.5 scenario, and by 8.16 × 10⁸ m3 in 2021–2035 and by 0.56 × 108 m3 in 2036–2050 in the RCP8.5 scenario, respectively. Similarly, groundwater recharge is expected to decrease by −1.79 × 10⁸ m3 in 2021–2035 and −0.75 × 10⁸ m3 in 2036–2050 in the RCP 4.5 scenario, and by −0.62 × 10⁸ m3 in 2021–2035 and −0.12 × 10⁸m3 in 2036–2050 in the RCP 8.5 scenario, respectively. The worst impact of climate change on water resources in the basin could be frequent occurrences of extremely wet and dry conditions. In the RCP 4.5 scenario, the largest annual streamflow is predicted to be almost 14 times that of the smallest one, while it is 18 times for the groundwater recharge. Meanwhile, in the RCP 8.5 scenario, inter-annual fluctuations are expected to be more severe. The difference is 17 times between the largest annual streamflow and the lowest annual one. Moreover, the value is 19 times between the largest and lowest groundwater recharge. This indicates a significant increase in conflict between water use and supply.
1. Introduction
Observational evidence has showcased the huge impact of climate change on global natural and human systems in recent decades—and it is predicted to continue [1,2,3,4,5]. Among them, water resources is one of the most direct and important elements affected by climate change [6,7,8,9,10].
Changes in water resources, as a result of global warming, are not uniform [5]. This uncertainty has instigated discussions on the impact of precipitation, temperature, and other climate variables on water resources. The impact is mainly investigated in terms of space (global [3,10,11], watershed [8,12], and regional scales [13,14,15]) and time (evaluation of the past [16,17,18], and future predictions [6,19]). Despite a number of relevant studies, these impacts in high-latitude watersheds need to be further studied [20,21].
In addition, there are fewer studies on the comprehensive effect of climate change on both groundwater and surface water [22,23]. Groundwater is less visible and its relationship with climate is more complex. Most previous studies have focused on the impact of climate change on surface water [24,25]. However, these two storage mechanisms are intrinsic parts of closely linked components in the hydrological system. The development and utilization of any component affects the others. Therefore, joint research on groundwater-surface water is necessary to ensure accurate estimation of water resources for future climate change scenarios, and for the sustainable development and utilization of water resources in high-latitude watersheds [26]. Furthermore, combined simulation of groundwater-surface water (CSGW-SW) is an important way to predict water resources in a watershed under climate change scenarios. With the rapid development of computational power, remote sensing technology, and geographic information systems, many hydrological models have been created, providing powerful technical support for the CSGW-SW; they include Modflow-Daflow [27], InHM Model [28], GSFLOW [29], MIKE SHE-MIKE 11 [30], MODHMS [31], Land Model(CLM)-ParFlow [32], and HydroGeoSphere [33], among others. Among these, SWAT-Modflow, which is a coupling hydrological model, offers easy operation, has a good visual interface, and requires low basic data. It has, hence, been widely used by international scholars to simulate and predict water resources in a watershed [34,35,36,37,38].
The main purpose of this study is to quantitatively evaluate the response of water resources in high-latitude basins to future climate change. The study specifically aims to (1) evaluate the impact of future climate change on water resources in high-latitude watersheds, and (2) construct a comprehensive hydrological model based on combined simulation of groundwater-surface water.
2. Materials and Methods
2.1. Study Area
The Naoli River, the primary tributary of the Wusuli River, is located in Heilongjiang Province, which has the highest latitudes in the country (Figure 1). The basin covers a total land area of approximately 24,200 km2 ((45°43′–47°35′ N and 131°31′–134°10′ E). Its climate is characterized by temperate humid and semi-humid continental monsoons; with long-term annual average temperature of 3.5 °C, precipitation of 518 mm (60%–72% of which fall in May and September), wind speed of 3.7 m/s~4.2 m/s, and solar radiation of 99~110 kcal/cm2.
Global climate change has greatly altered meteorological elements (precipitation, evaporation, and temperature) in the basin [39,40,41]. As a result, changes in streamflow and groundwater resources have also occurred [42,43]. As one of the most important grain production bases in the country, in addition to being a large inland freshwater wetland, changes in climate and water resources are of great significance to the Naoli River basin. It is, therefore, necessary to study the response of water resources to future climate change in the basin.
2.2. Data Collection
In order to construct a coupled model and predict future water resources, we have collected a large amount of data. Daily meteorological data from 45 stations in the Naoli River Basin were obtained for the period of 2008–2015 from the China Meteorological Assimilation Driving Datasets, which is developed based on China Land Data Assimilation System (CLDAS) and can be download from the website (http://www.cmads.org/) [44]. The Global Downscale Daily Dataset (NEX-GDDP), temperature and precipitation, released by the NASA Earth Exchange-Beijing Normal University–Earth System Model (BNU-ESM), was selected as the data of future climate change scenario. The dataset was derived from the downscaling climate scenario of GCM output under CMIP5, and its components were chosen based on the specific expertise and experience available to the research center, and furthermore with an eye to how the research strengths of the center can improve and develop it. In detail, the model itself consists of four separate components simulating the atmosphere (CAM3.5), ocean (MOM4p1), land (CoLM) and sea ice (CICE4.1), and one coupler component (CPL6.0) connecting these four components. The Lund–Potsdam–Jena (LPJ) dynamic vegetation model (DVM) and the idealized ocean biogeochemical module (iBGC) are included in the CoLM and MOM4pl, respectively [45]. It is widely used in understanding climate change mechanisms and climate attribution. A detailed description of the BNU-ESM can be found in Ji et al. [46]. Two typical concentration paths, RCP4.5 and RCP8.5, with spatial resolution of 0.25 × 0.25 degree. Both the shallow groundwater level of 50 wells and streamflow of 4 hydrological station across the Naoli River Basin for 2008–2015 was collected from the Jiamusi Bureau of Hydrology. In addition, other relevant datasets have been collected, including DEM, land use, Soil type, reservoirs, water use, and hydrogeological parameters (Table 1). All these data were qualitatively checked before use.
2.3. SWAT-Modflow Model
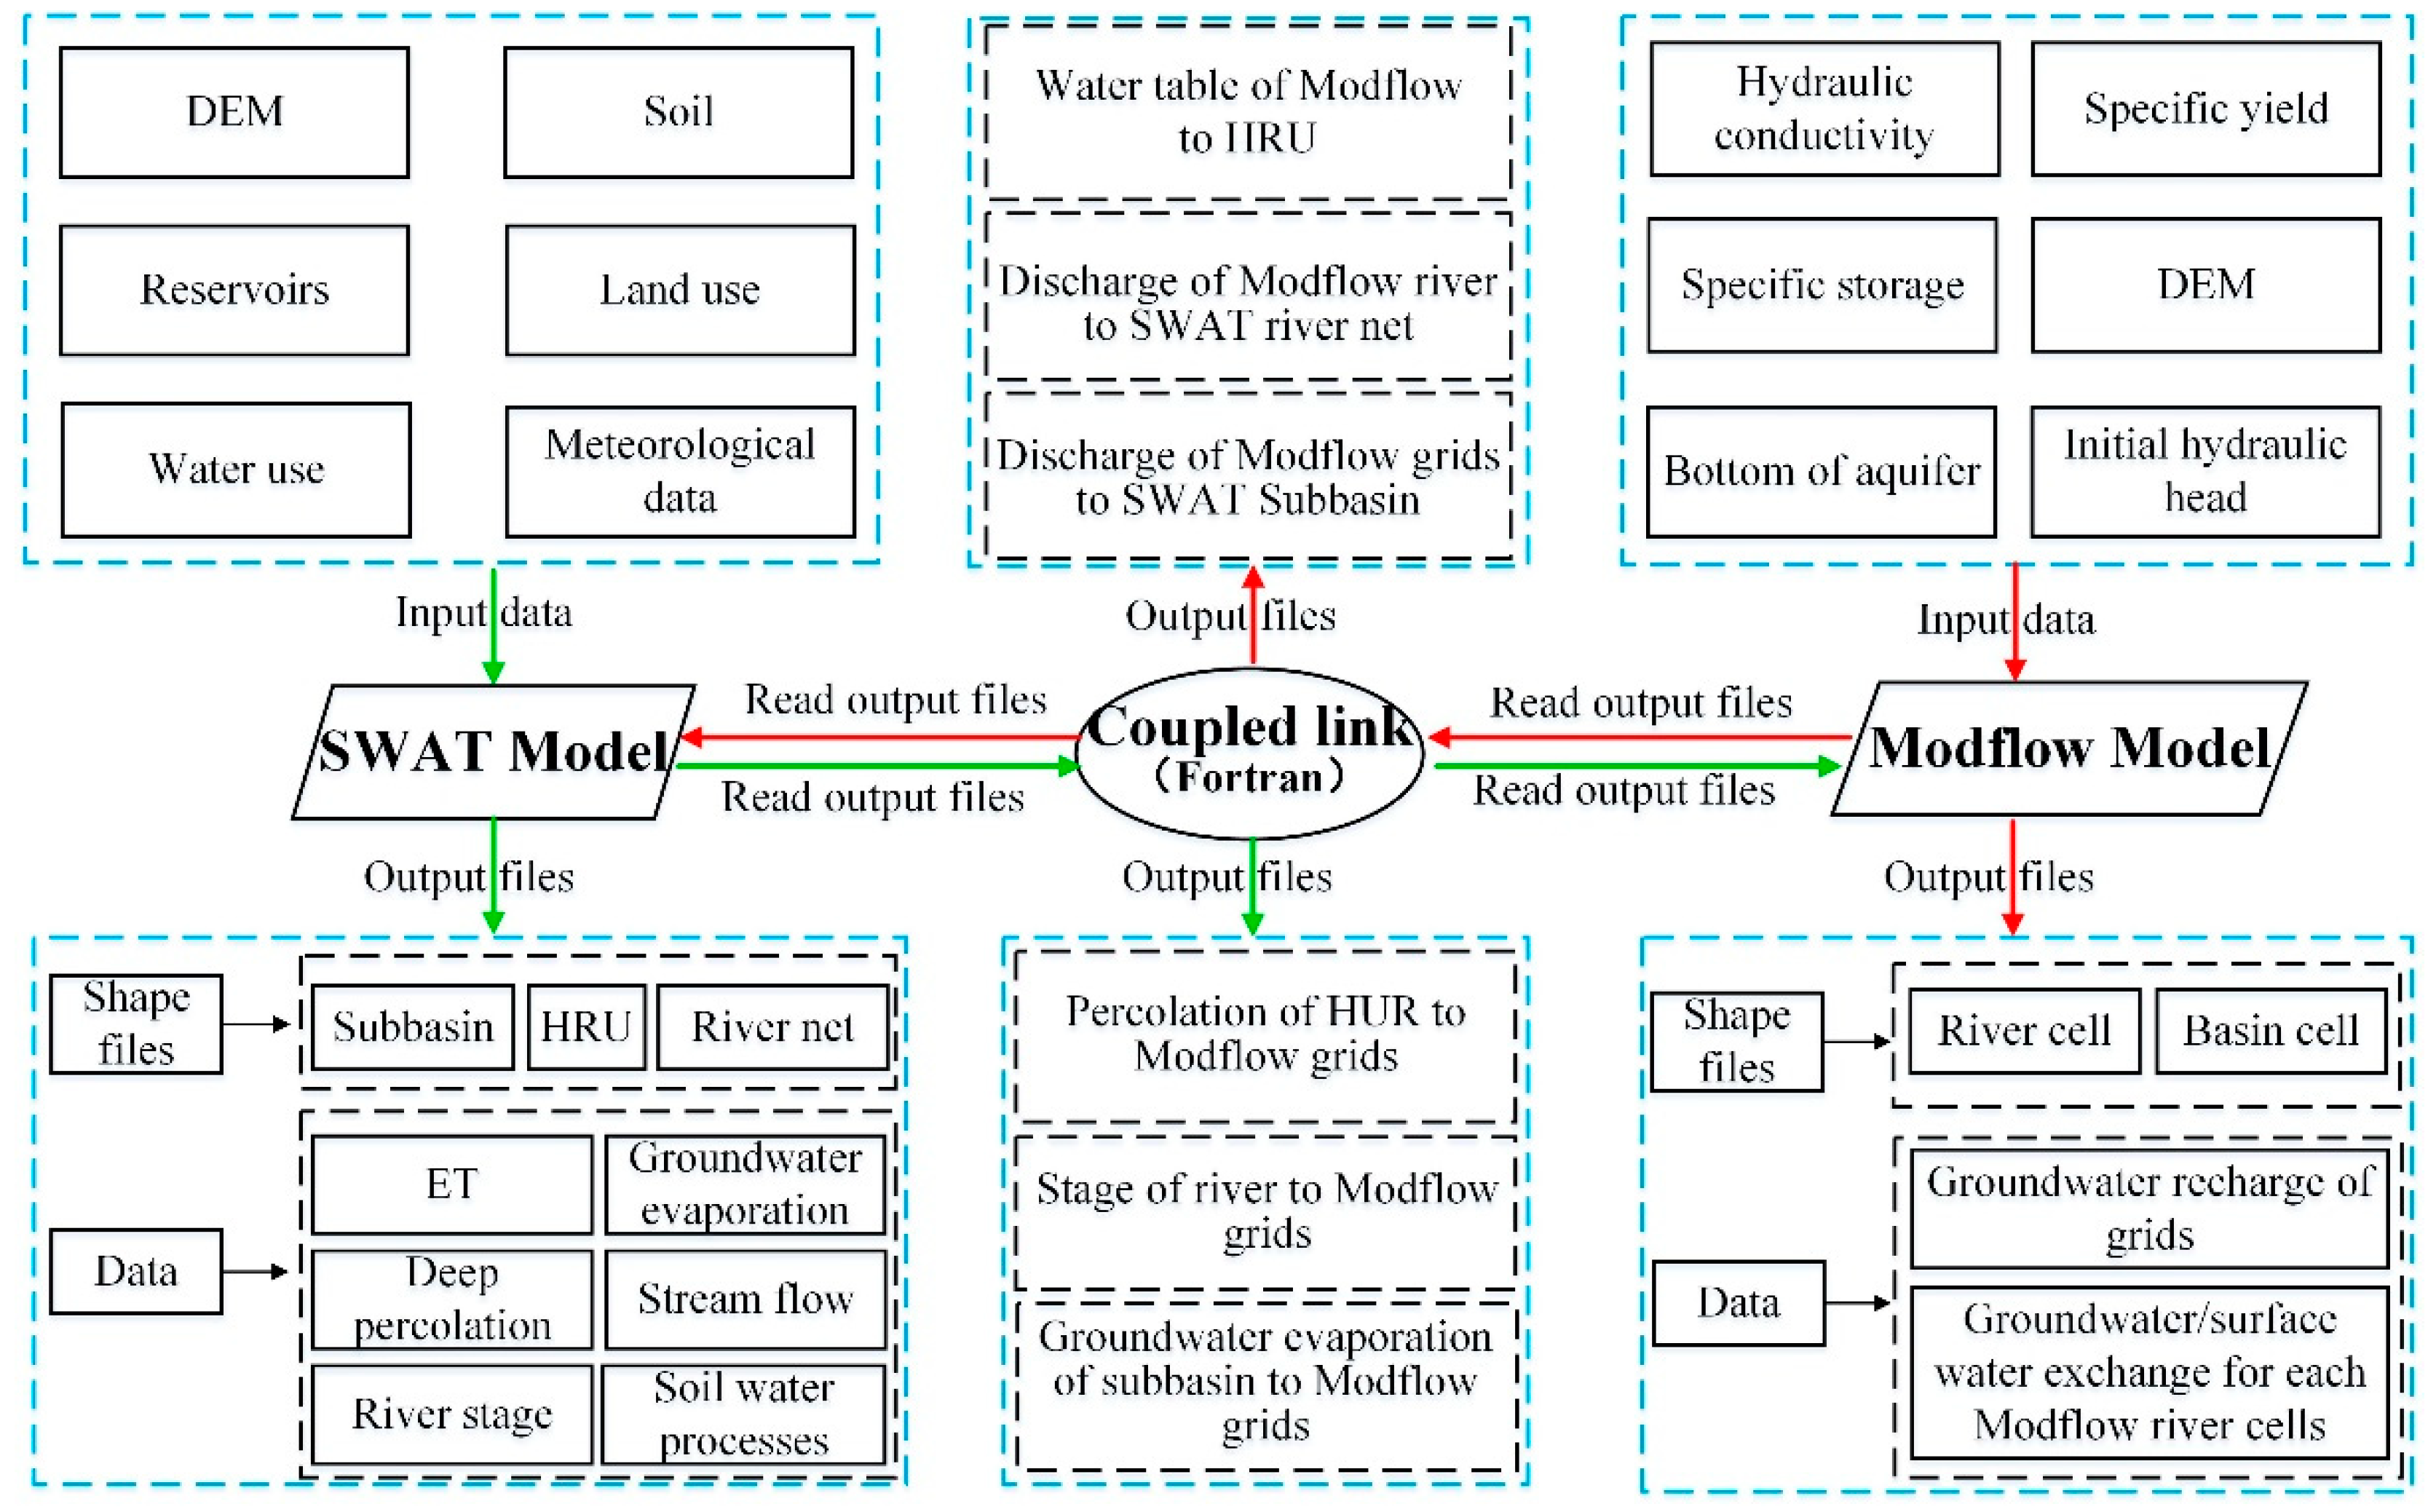
The difficulty in coupling the SWAT model with the Modflow model is how to achieve the correspondence between hydrological response units (HRUs) of SWAT and Modflow grid Cells. Because of the HRUs of SWAT lacks spatial location information, it is necessary to divide HRUs into individual Disaggregated HRUs (DHRUs) with specific geographical location. These DHRUs are then mapped to the Modflow grid to pass variables between SWAT and MODFLOW. In addition, the Modflow river grid is also calculated so that the groundwater discharge calculated by Modflow is returned to the corresponding sub-basin. Figure 2 shows the spatial correspondence between the SWAT HRUs and the Modflow grid cells. The four colors on the picture represent an HRU, respectively. The corresponding relationship between cells and HRUs is shown below the picture. Through this spatial connection, the coupling of SWAT and Modflow is realized. In addition, the variable transfer and output process of the SWAT-Modflow model is summarized, as shown in Figure 3. Detailed descriptions of the steps used in coupling SWAT-Modflow can be found in several publications [34,35,36,37,38].
2.4. The Method of Calibration and Validation in Model
The calibration and validation of surface parameters are performed by the Sequential Uncertainty Fitting Ver. 2 (SUFI2) [47] which is one of the program interfaces with SWAT, in the Package SWAT Calibration Uncertainty Programs (SWAT-CUP). Therefore, the calibration and validation of aquifer parameters are performed by Predictor-Corrector method [48].
2.5. Evaluation of Model Results
3. Results
3.1. Calibration and Validation of Model
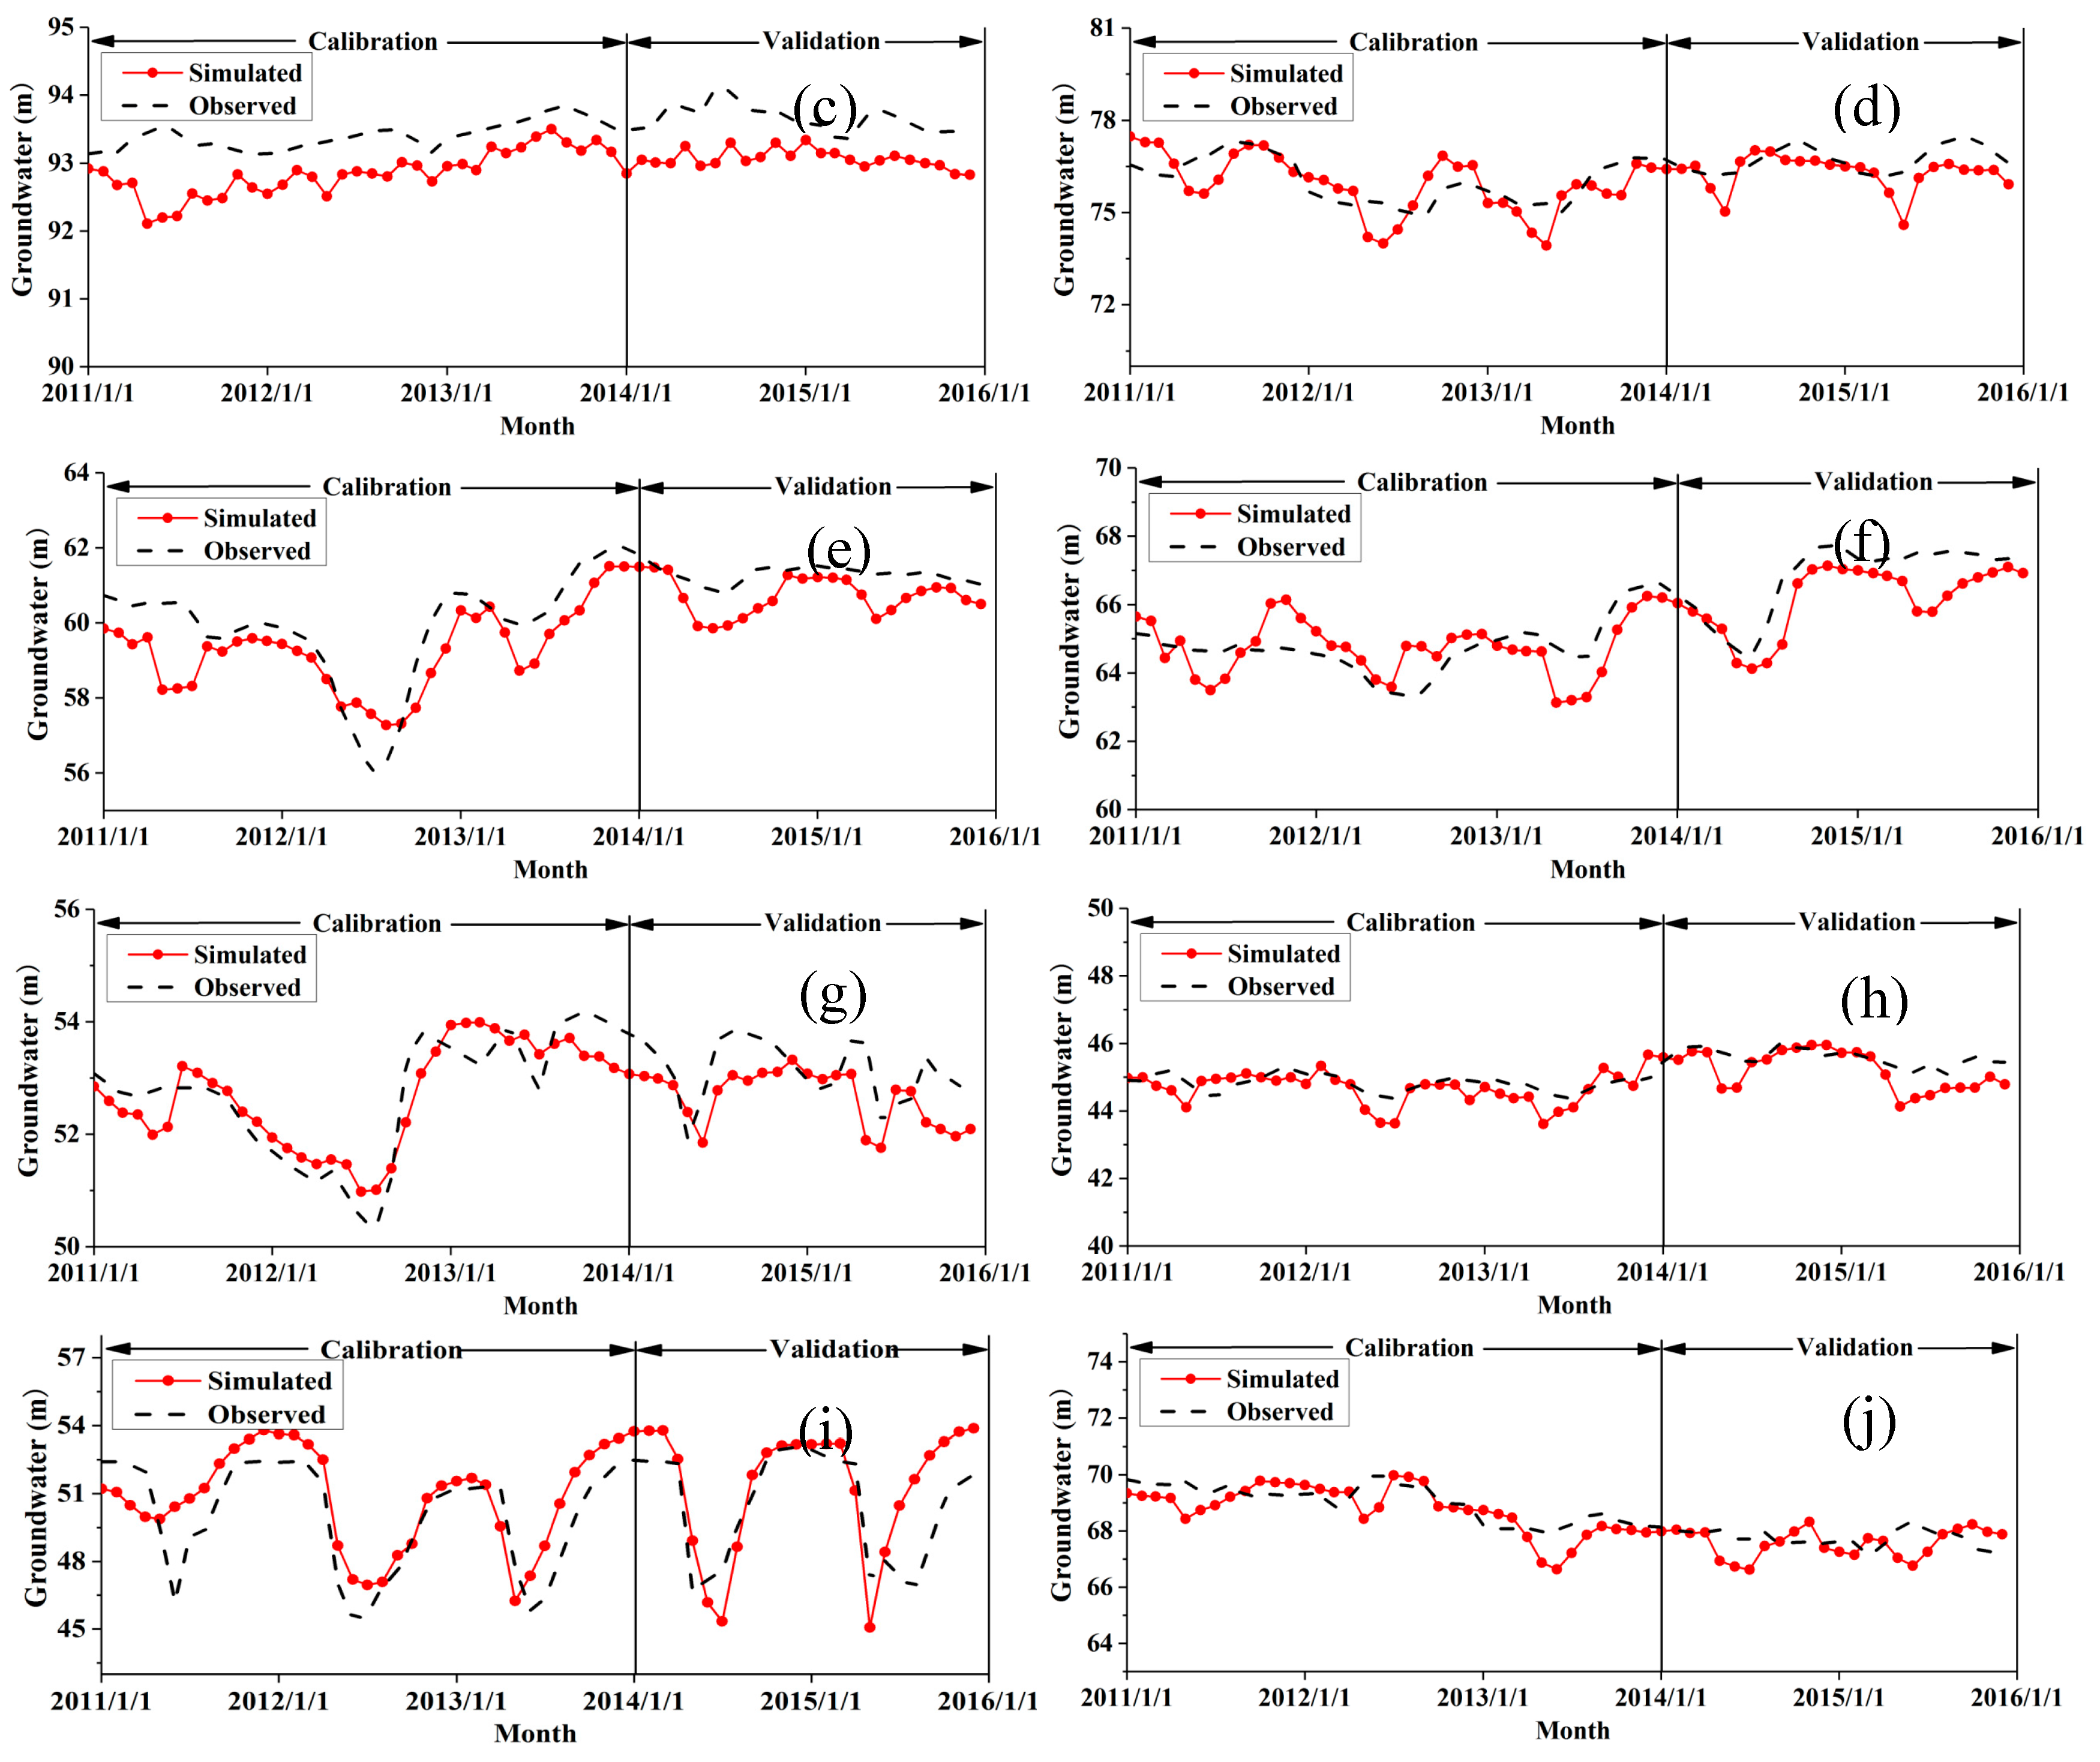
This study used data from 2008 to 2010 for the mode warm-up, data from 2011 to 2013 for the model calibration, and data from 2014 to 2015 for the model validation. Because there was a large number of model parameters, it was not possible to calibrate each parameter. Therefore, we calibrated only those that have great influence on the hydrological process of the basin based on the previous research. The model parameters were calibrated based on the observed data from four hydrological stations and 50 monitoring wells, and they were validated with data from these four hydrological stations but only 10 monitoring wells due to the lack of monitoring data from 2014 to 2015 (Figure 4 and Figure 5).
After adjusting parameters repeatedly, the evaluated results of streamflow and groundwater level in the calibrated and validated period can meet the accuracy requirements of the model simulation (Table 3). In addition, the calculated and measured values cannot be exactly the same. However, the trend of dynamic change of them is consistent. Therefore, the simulation results of the SWAT-Modflow are better, and this model can be used to estimate trends of water resources in the Naoli River Basin under future climate change scenarios.
3.2. Future Climate Change
In this study, the daily temperature and precipitation from 2021 to 2050 were selected as future climate scenarios. The study period of 2021–2050 was divided into two periods: 2021–2035 (shot-term) and 2036–2050 (long-term).
3.2.1. The Change of Precipitation
There is a difference in the annual precipitation over time in different climate scenarios in the Naoli River Basin. In the RCP4.5 scenario, the annual precipitation increases first and then decreases. The increasing trend in 2021–2035 is 31.9 mm/10a, and the decreasing trend in 2036–2050 is −18.8 mm/10a. Moreover, the fluctuation of precipitation is relatively stable under RCP4.5 scenario. There is not much difference in precipitation between short-term (2021–2035) and long-term (2036–2050) (Figure 6). By contrary, the annual precipitation shows a trend of decreasing first and then increasing in the RCP8.5 scenario. The decreasing trend of precipitation is −93 mm/10a in 2021–2035, and the increasing trend is 5.5 mm/10a in 2036–2050. In the short term (2021–2035), precipitation decreases significantly, which may be accompanied by drought. In the long term (2036–2050), precipitation will increase dramatically in 2038, and then it will increase slowly (Figure 6).
3.2.2. The Change of Temperature
There is also a variation in the temperature over time in different climate scenarios in the Naoli River Basin. The annual average maximum temperature increases first and then decreases under the RCP 4.5 scenario, with an increasing trend of 0.03 C/10a in 2021–2035 and a decreasing trend of −0.3 C/10a in 2036–2050. There is a continuous increasing trend under the RCP 8.5 scenario, with a trend of 0.6 C/10a in 2021–2035 and 0.7 C/10a in 2036–2050, respectively. The increasing trend is more apparent with time (Figure 7a). The variation trend of annual average minimum temperature is roughly the same as that of maximum temperature in different climate scenarios. In the RCP4.5 scenario, the annual average minimum temperature shows a increasing trend of 0.3°C/10a in 2021–2035 and decreasing trend −0.1 °C/10a in 2036–2050. In the RCP 8.5 scenario, the annual average minimum temperature also shows a continuous increasing trend of 0.3 C/10a in 2021–2035 and 0.7 C/10a in 2036–2050, respectively (Figure 7b).
3.3. Response of Water Resources for Climate Change
3.3.1. Streamflow under Future Climate Change Scenarios
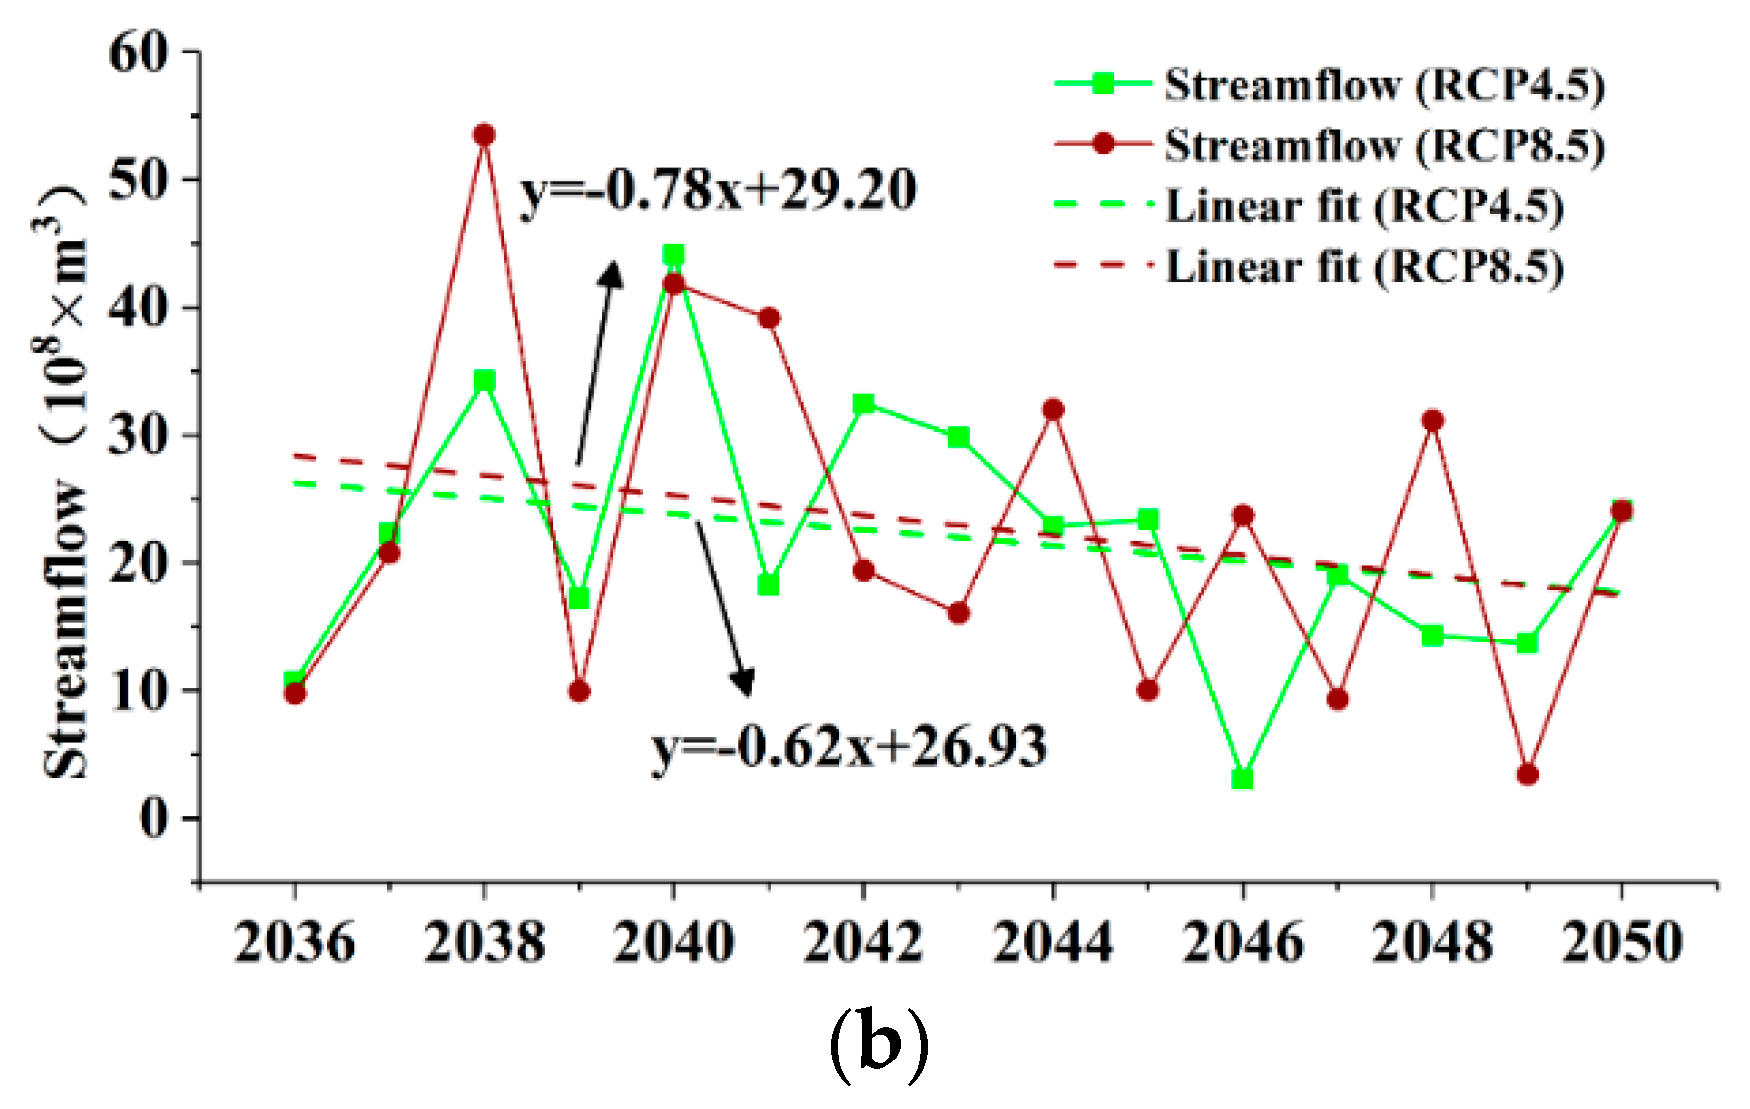
In the RCP4.5 scenario, the average streamflow is 20.78 × 10⁸ m3 in 2021–2035 in the Naoli River Basin. However, there will be a large interannual variation in the streamflow. In 2027, there will be a minimum annual streamflow of 3.36 × 10⁸ m3. In 2028, there will be a maximum annual streamflow of 37.12 × 10⁸ m3 (Figure 8a). The average streamflow is 22.00 × 10⁸ m3 from 2036 to 2050, which is the least of 3.10 × 10⁸ m3 in 2046, and the highest of 44.17 × 10⁸ m3 in 2040 (Figure 8b). Under RCP 8.5 scenario, the average annual streamflow is 16.35 × 10⁸ m3 in 2021–2035, which is the least of 3.18 × 10⁸ m3 in 2028, and the highest of 49.57 × 10⁸ m3 in 2021 (Figure 8a). The average annual streamflow is 22.95 × 10⁸ m3 in 2021–2035, which is the least of 3.43 × 10⁸ m3 in 2049, and the highest of 53.54 × 10⁸ m3 in 2038 (Figure 8b).
According to the results of previous research, the average streamflow is 23.51 × 10⁸ m3 for many years in the Naoli River Basin. Compared with present streamflow, under the RCP4.5 scenario, the streamflow decreases by 2.73 × 10⁸ m3 in 2021–2035 and 1.51 × 10⁸ m3 in 2036-2050, respectively; under the RCP8.5 scenario, the streamflow decreases by 8.16 × 10⁸ m3 in 2021–2035 and 0.56 × 10⁸ m3 in 2036–2050, respectively (Table 6).
3.3.2. Groundwater Recharge under Future Climate Change
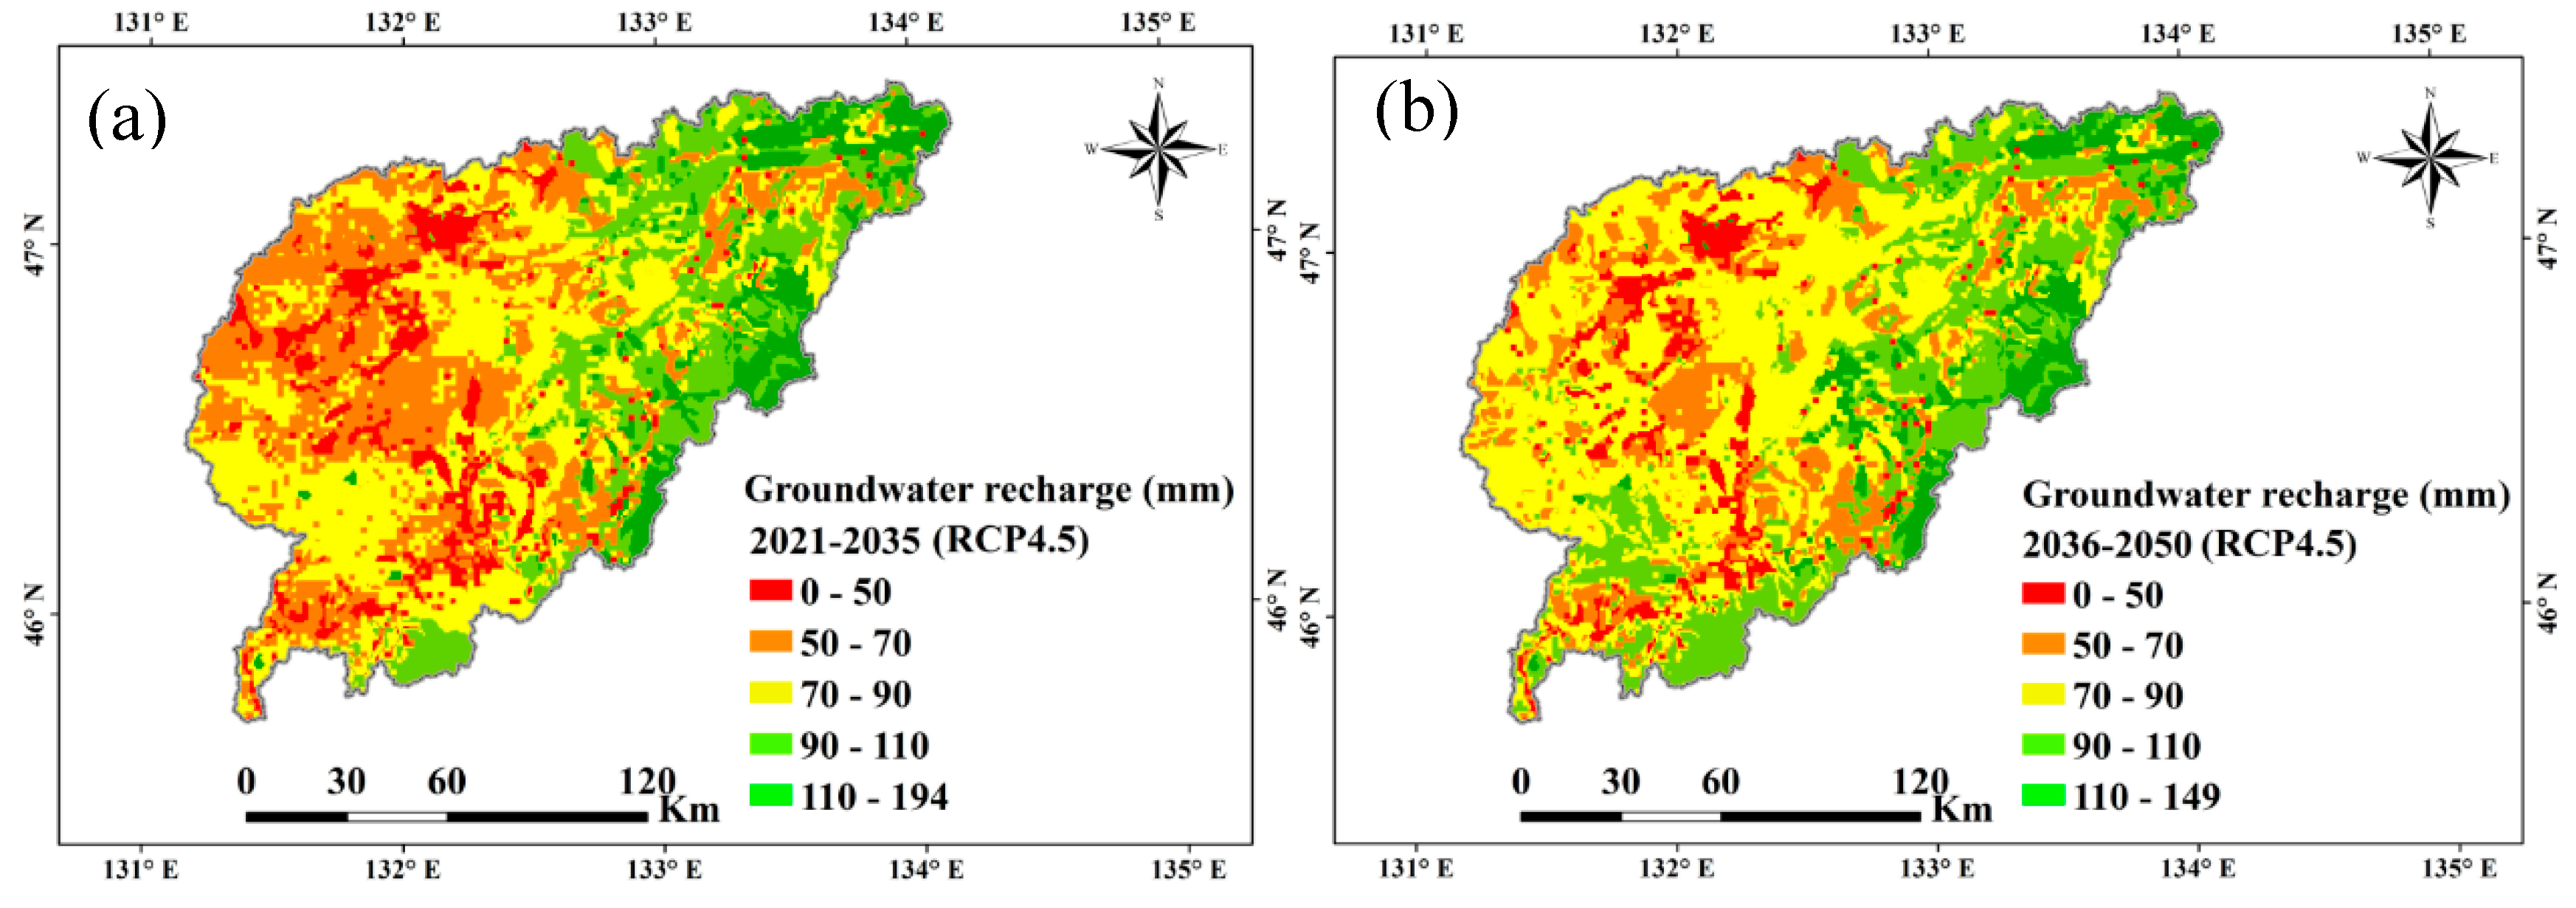
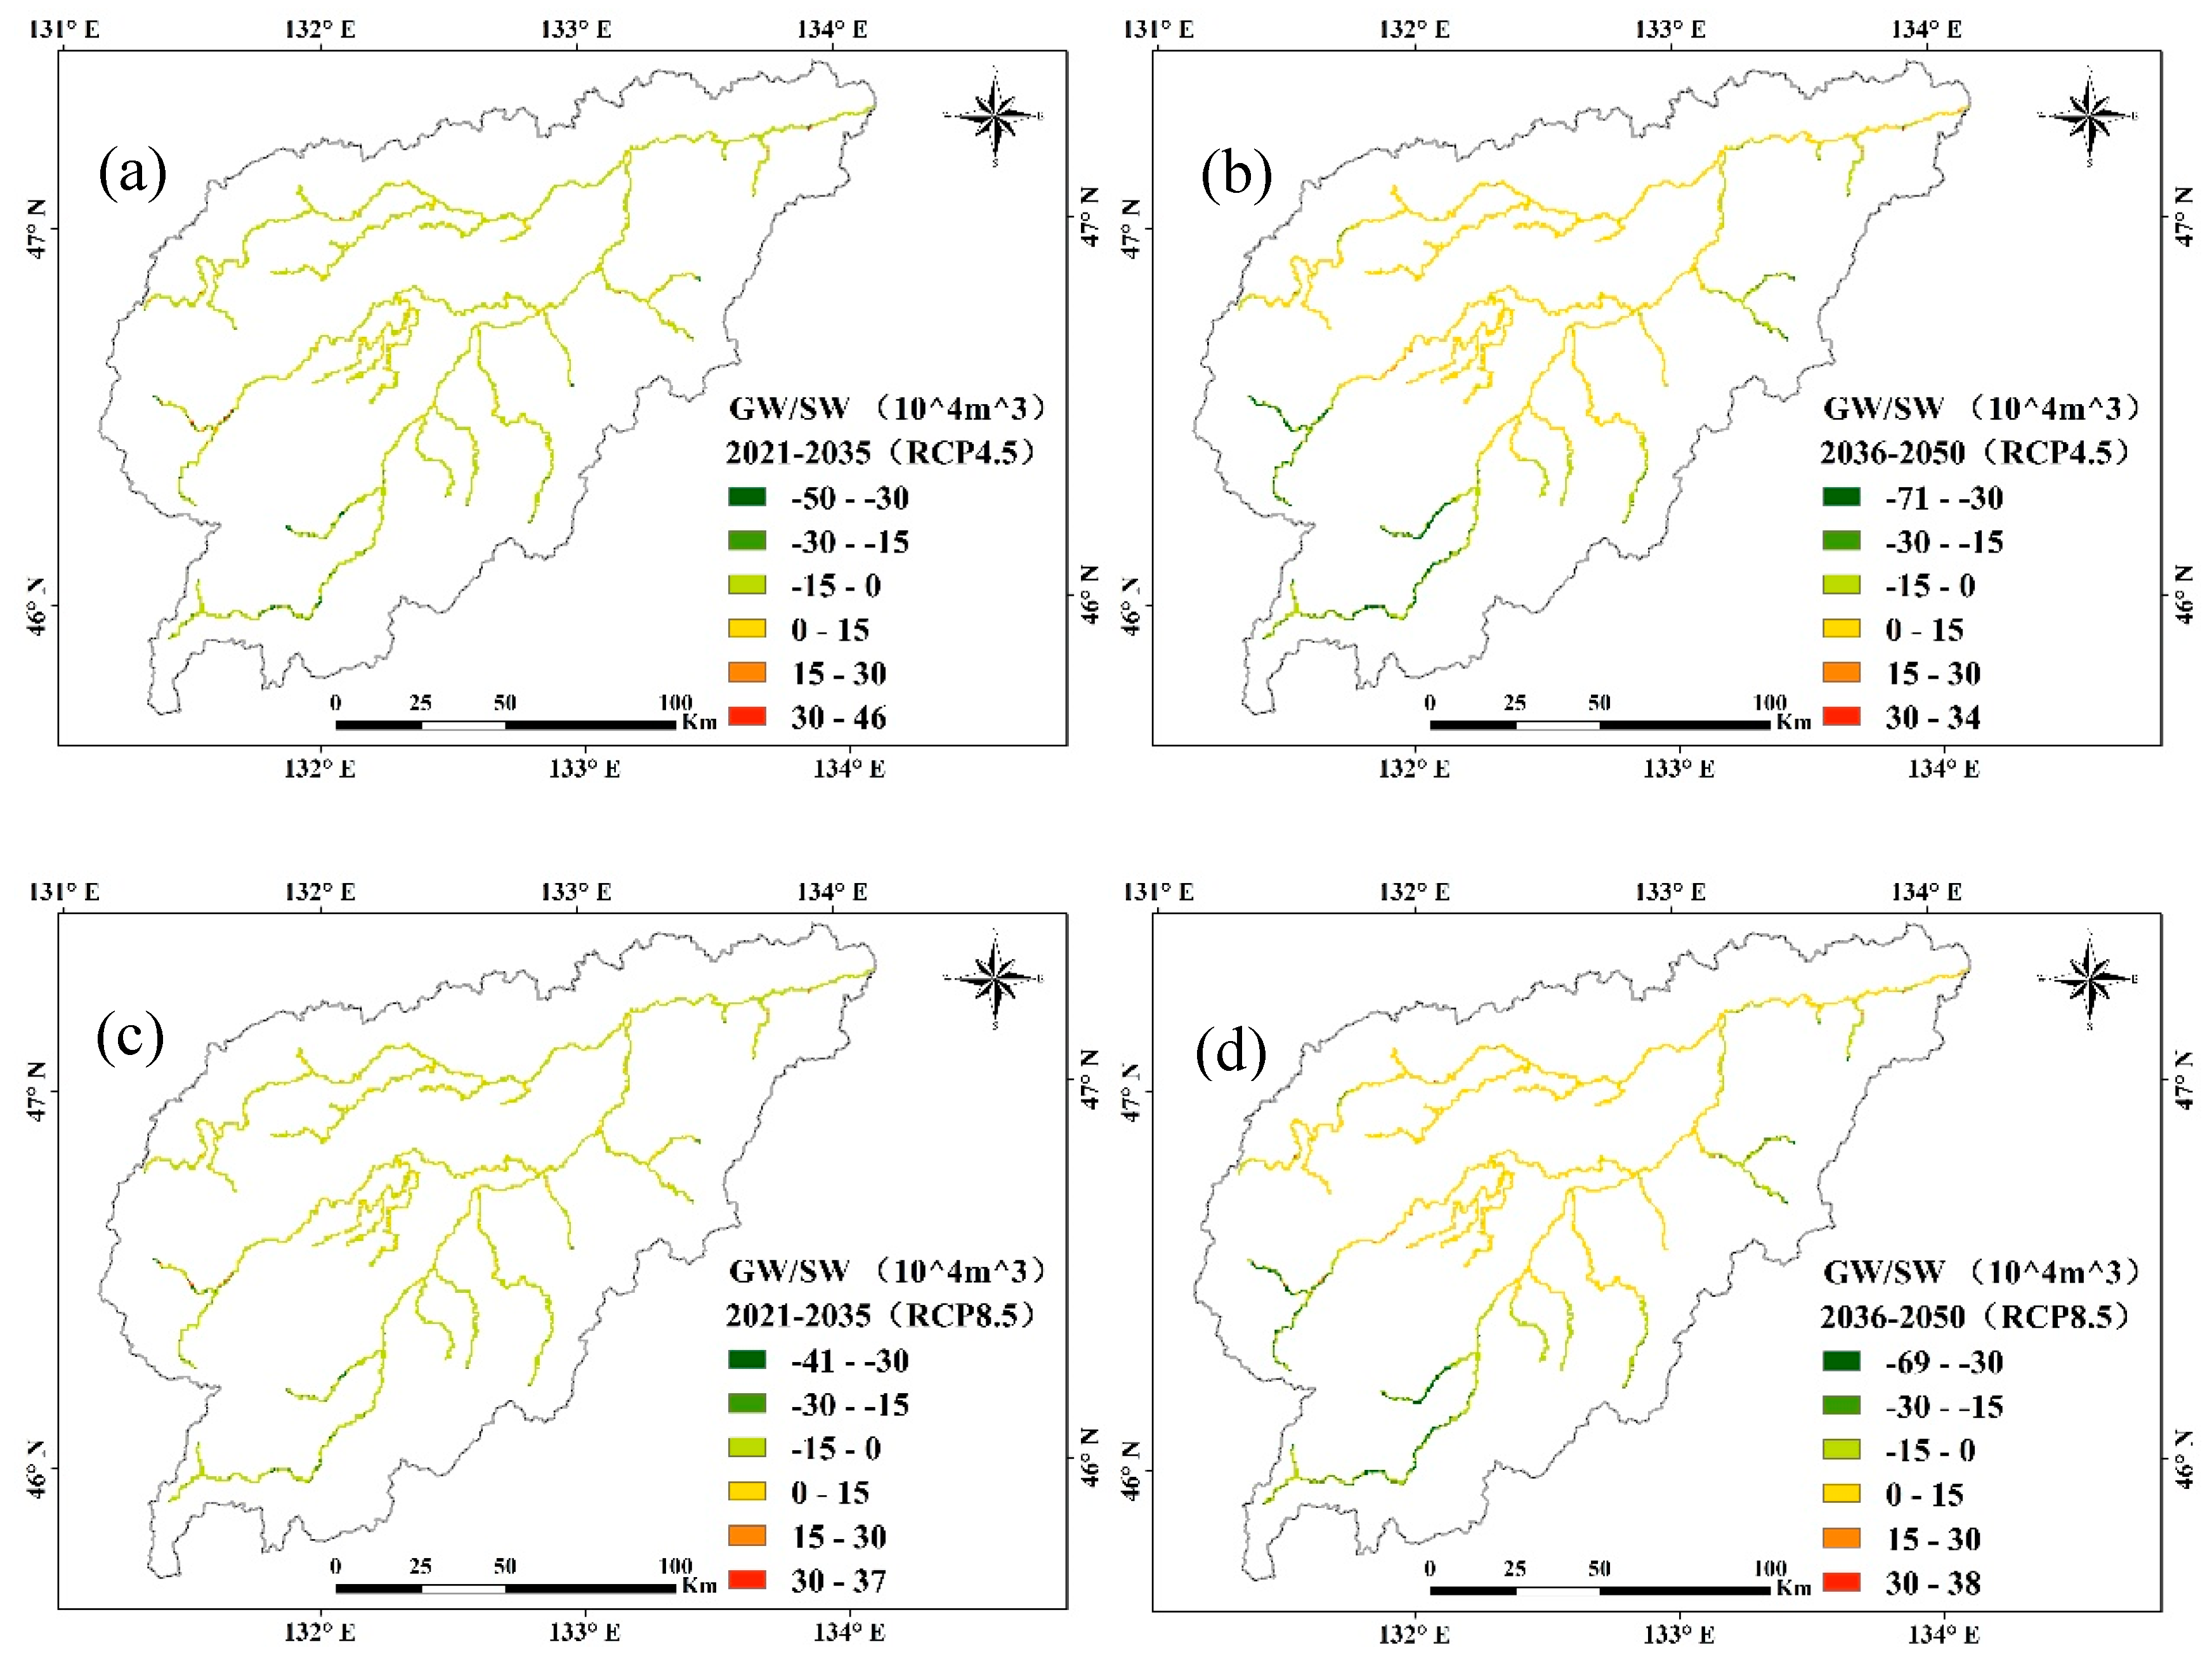
Under RCP 4.5 scenario, the multi-annual average groundwater recharge in space is 69.8 mm in 2021–2035 (Figure 9a) and 73.5 mm in 2036–2050 (Figure 9b), respectively. While under the RCP 8.5 scenario, the annual groundwater recharge in space is 53.5 mm in 2021–2035 (Figure 9c) and 76.1 mm in 2036–2050 (Figure 9d), respectively. Under different scenarios, the distribution characteristics of groundwater recharge are quite different in space in the future, but the recharge of downstream is generally more than that of the upstream.
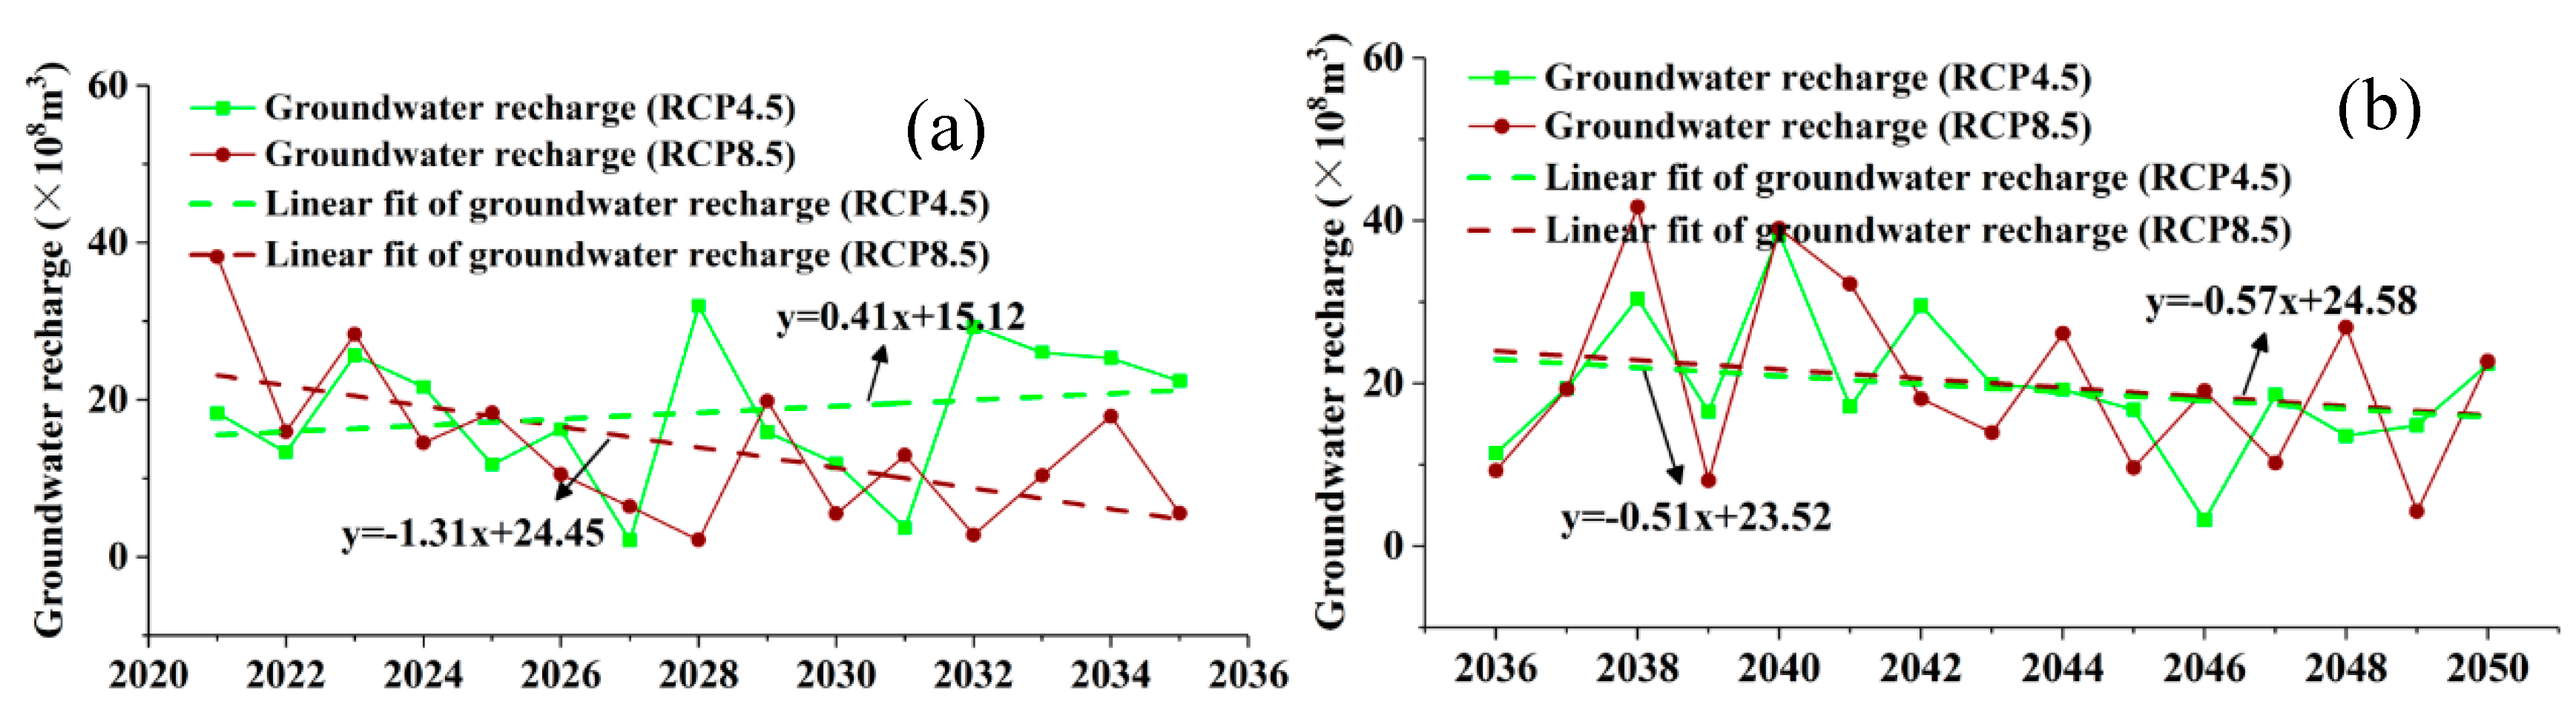
Under different climate scenarios, the different trends were shown about the annual groundwater recharge in the future in the Naoli River Basin. In RCP 4.5 scenario, the annual average groundwater recharge is 18.38 × 10⁸ m3 in 2021–2035, and increases with the trend of 0.41 × 10⁸ m3/year (Figure 10a). Moreover, there will also be a large variation to the recharge. The maximum and minimum value are 31.98 × 10⁸ m3 in 2028 and 2.11 × 10⁸ m3 in 2027, respectively. In 2036–2050, the average groundwater recharge is 19.42 × 10⁸ m3, which decreases with the trend of −0.51 × 10⁸ m3/year (Figure 10b). The maximum and minimum value are 38.33 × 10⁸ m3 in 2040 and 3.18 × 10⁸ m3 in 2046, respectively.
In RCP 8.5 scenario, the annual groundwater recharge is 13.97 × 10⁸ m3 in 2021–2035, with a maximum and minimum value of 38.24 × 10⁸ m3 in 2021 and 2.15 × 10⁸ m3 in 2028, respectively. During this period, the recharge decreases significantly with the trend of −1.31 × 10⁸ m3/year (Figure 10a). In 2036–2050, the groundwater recharge is 20.05 × 10⁸ m3, with a maximum and minimum value of 41.68 × 10⁸ m3 in 2038 and 4.25 × 10⁸ m3 in 2049, respectively. Moreover, the recharge has also a downward trend of −0.57 × 10⁸ m3/year (Figure 10b).
Compared with the * mean value for current multi-years, the groundwater recharge will decrease by −1.79 × 10⁸ m3 in 2021−2035 and −0.75 × 10⁸ m3 in 2036–2050 in the RCP 4.5 scenario, respectively. Meanwhile, the recharge will decrease by −0.62 × 10⁸ m3 in 2021–2035 and−0.12 × 10⁸ m3 in 2036–2050 in the RCP 8.5 scenario, respectively (Table 7).
3.3.3. Interaction of GW-SW under Future Climate Change
The interaction relationship between groundwater and surface water in the Naoli River Basin can be divided into three categories in space: groundwater recharging river water throughout a year, river recharging groundwater throughout a year, and mutual recharge between groundwater and river water in a year. The three categories mainly exist in the upstream, downstream and middle reaches of the river, respectively (Figure 11).
In addition, according to the prediction results of the model, the amount of river water recharging groundwater is more than that of groundwater recharging river in the entire basin under the two different climate scenarios. At the same time, the amount of groundwater recharge to river water in 2036–2050 is more than that of in 2021–2035. It is worth noting that the amount of groundwater recharge by river water is also increasing under future climate scenarios. Detailed quantitative results are shown in Table 8.
4. Discussion
4.1. Vulnerability of Water Security Under Climate Change
The Naoli River Basin in the Sanjiang Plain is one of China’s largest grain production bases as well as one of the largest inland freshwater wetland regions. Therefore, the river basin plays an important role in ensuring security of grain production and the wetland ecology. The hydrological processes of the basin have been changed significantly as a result of climate change, especially the increasing frequency of extreme climate, which poses an additional threat to water security [50,51], such as streamflow decrease, groundwater level decline, and shrinking of wetlands area. In this study, according to our predictions, the water resources in the Naoli River Basin would experience drastic interannual fluctuations, and extremely wet and dry conditions would occur frequently in the future. In the RCP4.5 scenario, the largest annual streamflow will be almost 14 times that of the lowest, while the value is 18 times for the groundwater recharge. In the RCP8.5 scenario, the interannual fluctuations will be more severe. The difference will be 17 times for the streamflow and 19 times for the groundwater recharge, respectively (Figure 8 and Figure 10). One fundamental concern is the impact of this severe fluctuation on water supply [11]. On the water supply side, renewable water resources will be difficult to guarantee [52,53]. As one of a large inland freshwater wetland basin, the wetlands are facing severe degradation problems. Wu et al. [54] showed that the area ratio of wetland has decreased from 45.8% in 1954 to 9.8% in 2010. The shortage of water resources is an important reason for its degradation. However, the area ratio of cultivated has increased from 8.2% to 58.0%. Meanwhile, the area of paddy field account for 31% of the total farmland area. In order to irrigate farmland, a large amount of freshwater resource is needed in the basin every year. Therefore, there is a very severe conflict on water use between wetlands and agriculture [55]. Previous studies have reported a reduction in streamflow [42] and a decline in groundwater levels [56,57] as a result of climate change and human activities. However, previous studies focused only on surface water or groundwater from a single point of view, lacking the explanation of groundwater-surface water interaction. Based on our studies, the conflict between supply and demand on water resources will be expanded by climate change in the future. Some effective measures must be taken to protect the wetlands and ensure the food security of the High-latitude watershed.
4.2. Some Adaptive Strategies for Water Resources Management
4.2.1. Strengthening Agricultural Water Saving and Optimizing Land Use Structure
As the largest water user, agriculture accounts for almost 85% of the water consumption per year [58,59]. On average, 31.65 × 10⁸ m3 of water resources are consumed in the Naoli River Basin by agricultural irrigation every year, which is almost equal to the total available water resources in the basin [60]. This leads to the excessive consumption of water resources with a series of ecological and environmental problems such as rapid decline of groundwater level and shrinkage of wetland area. Generally, there are two reasons for this result. On the one hand, the water consumption of paddy field is 6375 m3/ha, which is much higher than that of Israel’s 5500 m3/ha, because the irrigation method is still in the traditional flooding irrigation; on the other hand, the agricultural area is too large in the basin, accounting for more than 85% of the plain area, and the paddy field accounts for 30.88% of the total farmland, and is too concentrated. Therefore, it is necessary to reduce the agricultural water consumption in the basin from the perspectives of strengthening agricultural water saving and optimizing land use structure, respectively. In terms of agricultural water saving, it will be feasible to the Naoli River Basin or other regions in China, to promote the new technology and mode of saving water for irrigation and yield-increasing production, such as trickle or sprinkler irrigation, to develop an intelligent decision-making system and platform for efficient water use in irrigation districts, to implement comprehensively automation, digitalization, informatization and intelligent management of irrigation water in paddy fields, to boost the reform of agricultural water price and water right system and take the lead in piloting to achieve strict quota management, to achieve strict quota management and metering charges replacing the current method of calculating water charges according to the area of paddy field. In short, it will be an effective way that the market-oriented economic and policy means to regulate the efficient utilization of water resources [61]. In the aspect of optimizing land use structure, that the planting area, spatial pattern and thresholds of rice needs be identified in the Naoli River Basin based on the carrying capacity of water resources and ecological environment. Meanwhile, according to ecological protection objectives and service functions to restore and protect the wetlands, the red line for wetlands protection is strictly observed. Doing so, it can optimize the spatial structure of paddy fields and wetlands, determine the reasonable ratio in space between paddy and wetlands, improve the water supply capacity, and hence maintain regional water resources security. Achieving these will give full play to the hydrological storage function of wetlands, increase the availability of water resources, mitigate flood disasters, actively respond to climate change, and realize the harmony of “human-water-wetland” in the basin. Maybe, it will be one of important means to solve water problems under climate change by making full use of the natural attributes of this basin [62].
4.2.2. Optimized Utilization of Multi-Water Resources
Optimized utilization of multi-water sources can provide long-term solutions for improving efficiency of water use [63]. In fact, groundwater is the main source of water supply in the Naoli River Basin. Both the total amount of groundwater exploitation and level should be taken as the control target with optimizing the layout and quantity for groundwater. At the same time, a comprehensive utilization model of water resources should be scientifically adopted, which is “conjunctive water use by the way of between the upstream and downstream of river, between groundwater and surface water, and between in and outside the basin for water resources”. This approach maybe also an effective measure to cope with the drought and floods under climate change. In addition, from the perspective of regional agricultural irrigation, the way, the combination of well and canal, drainage and storage, can increase the utilization of surface water, reduce the exploitation of groundwater, and optimize the spatial and temporal distribution of water resources. For example, it is suggested that the existing well-irrigation area along rivers should be gradually replaced with surface water irrigation, while groundwater irrigation with total amount control should be implemented in the hinterland of the basin. From the perspective of the whole basin, the wetland can be replenished by flood and agricultural return flow according to the law of water demand in wetland, so as to alleviate the shortage of water in wetland.
4.2.3. Strengthening the Interaction of Policy And Science
To reduce and even reverse the trend of depletion on water resources, policies and practices that guide water resources and land management towards more sustainable practices are critically needed. Generally, overexploitation of water resources is associated with the lack of the interface between scientific understandings and reasonable policies for the water resources management [64]. In other words, science is needed, policy is needed, and the two is needed to tightly intertwine and play out in practice in synergistic ways by us. Some of management policies to water resources have been formulated in many countries based on management needs and scientific research, such as European Water Framework Directive [65], the Water Law in Israel [66], and Groundwater tax in Netherland [67]. The policymakers in China have also made a series of policies to protect water resources, such as Water Law and Strictest Water Resource Management Regulation [68,69]. Although, these policies have made a prominent contribution to water resources management, the global water cycle is undergoing profound changes as temperatures rise, with increased intensity and frequency of extreme weather, and flood and drought disasters occurring frequently. The problem of water resources remains an obstacle to the development of the global economy, and it is therefore difficult for fixed policies to adapt to changing environment. As shown in Figure 12, the science-policy interface is a social process that links scientists and policymakers to develop policies in order to enrich decision-making [70]. While the importance of the science-policy interface is increasingly recognized the nuances of this interface as it relates to water resources are rarely examined. Therefore, it is necessary to scientifically understand the response processes and mechanisms of the water resources for climate change and human activities, and then formulate an effective policy for sustainable water resources management. In addition to what has been mentioned above, the interaction should also be strengthened between monitoring and mechanism research on science, between national and regional government, respectively. Finally, interaction between science and policy with water security as the core should be used as the link to ensure ecological and economic security.
4.3. Feasibility of Predicting Future Water Resources by Hydrological Model and Climate Change Scenarios
There are some uncertainties in the application of hydrological model and climate scenarios to estimate the amount of water resources in future. Due to the complex climatic conditions, the characteristics of the underlay surface and aquifers, the complicated mutual feeding of between terrestrial hydrological processes and atmospheric circulation, as well as the limitations of hydrological models, it is not possible to completely simulate the water cycle process of watersheds [5,71]. In addition, a large number of parameters and basic data need to be input into the model for meeting the requirements of model construction. It is ineluctable to ignore the influence of some secondary parameters. Therefore, there will be some uncertainty in forecasting the process of water cycle under different climatic scenarios. Although there are many uncertainties, we try our best to overcome these difficulties. Therefore, the internationally recognized hydrological model, SWAT-Modflow, was applied in this study, which not only considers the hydrological processes of surface water and groundwater, but also emphasizes the interaction between groundwater and surface water is emphasized.
The future climate data are projected based on the influence of human activities [5]. Clearly, it is also uncertain in the future global population, greenhouse gas emissions, and energy use. Therefore, there will be great uncertainty in future climate scenario data. However, the Global Downscale Daily Dataset (NEX-GDDP) released by Beijing Normal University–Earth System Model (BNU-ESM) was selected as the data of future climate change scenario in this study. The model itself consists of four separate components simulating the atmosphere (CAM3.5), ocean (MOM4p1), land (CoLM) and sea ice (CICE4.1), and one coupler component (CPL6.0) connecting these four components. The Lund–Potsdam–Jena (LPJ) dynamic vegetation model (DVM) and the idealized ocean biogeochemical module (iBGC) are included in the CoLM and MOM4pl, respectively [47]. According to the comparison of previous studies [46], BNU-ESM is more accurate in simulating the interannual variability of precipitation. The results in this paper show that the future precipitation and temperature of the basin are more than that of the simulation period. The variation of precipitation directly affects the change of water resources, and the temperature affects the change of water resources by affecting the evaporation of the Naoli River basin, which shows that the increase of precipitation is likely to increase the impact of temperature on the water resources of the basin under the future climate scenario [72,73]. Therefore, the impact of future temperature on the water resources will be more pronounced. In summary, the accuracy of future climate scenario data will play a decisive role in the prediction of water resources. Some similar results were also shown by other studies in the Naoli River Basin [40].
5. Conclusions
This study analyzed the characteristics of climate change and the response of water resources to climate change in one of China’s high-latitude river basins. Based on the findings, the following conclusions can be drawn:
- (1)
- In China’s high-latitude Naoli River Basin, fluctuating changes in precipitation are found. Under the RCP4.5 scenario, annual precipitation in the river basin increases first (31.9 mm/10a in 2021–2035) and then decreases (−18.8 mm/10a in 2036–2050). Under the RCP8.5 scenario, however, annual precipitation shows a decreasing trend first (−93 mm/10a) and then an increasing trend (5.5 mm/10a). There is also a variation in the temperature over time in the two different climate scenarios. The annual average maximum and minimum temperature increases first (0.03 °C /10a and 0.3 °C/10a in 2021–2035) and then decreases (−0.3 °C/10a and −0.1 °C/10a in 2036–2050) under RCP 4.5 scenario, respectively. There is a continuous increasing trend for annual average maximum and minimum temperature under RCP 8.5 scenario, with a trend of 0.6 °C/10a and 0.3 °C/10a in 2021–2035 and 0.7 °C/10a and 0.7 °C/10a in 2036–2050, respectively.
- (2)
- Based on the predicted results, there will be a decreasing trend to the water resources in the Naoli River Basin in future. Compared with the present condition, streamflow of the river decreases by 2.12 × 10⁸ m3 and 4.36 × 10⁸ m3 in 2021–2050 under the RCP4.5 and RCP8.5 scenarios, respectively. Concurrently, groundwater recharge in the river basin decreases by 1.27 × 10⁸ m3 and 3.16 × 10⁸ m3 in 2021–2050 under the two scenarios, respectively.
- (3)
- The worst impact of climate change on the water resources in the high-latitude river basin is that extremely wet and dry condition will occur frequently in the future. The largest annual streamflow is almost 14 times and 17 times that of the smallest one, while the different value is 18 times and 19 times for the groundwater recharge under the RCP4.5 and RCP8.5 scenario, respectively. The water use conflict will be expanded by climate change, so some effective measures must be taken, such as strengthening agricultural water saving and optimizing land use structure, optimizing use for multi-water resources, and promoting the interaction between water policy and scientific research.
Author Contributions
P.Q. and Y.J.X. conceived the idea of the study and wrote the manuscript; P.Q. and Z.K.X. carried out data collection and analysis; G.Z. supervised the research project and contributed to oversight of the data collection; M.W. contributed valuable analysis and manuscript review; all authors approved the final manuscript.
Funding
Research was supported by National Key Research Project (No. Y7A1023001 and NO. Y7A1021001) and the National Natural Science Foundation of China (41371108) and the Featured Institute Project, the Northeast Institute of Geography and Agroecology of the Chinese Academy of Sciences (Project number: NO. Y6H2064001), During the preparation of the manuscript, Y. Jun Xu received funding support from a U.S. Department of Agriculture Hatch Fund project (project number: LAB94459).
Acknowledgments
We thank CMADS and BNU-ESM for making modeling data available for this study. Sincere thanks also go to four anonymous reviewers for their valuable comments and suggestions.
Conflicts of Interest
The authors declare no conflict of interest.
References
- Walther, G.R.; Post, E.; Convey, P.; Menzel, A.; Parmesan, C.; Beebee, T.J.C.; Fromentin, J.M.; Hoegh-Guldberg, O.; Bairlein, F. Ecological responses to recent climate change. Nature 2002, 416, 389–395. [Google Scholar] [CrossRef]
- Taylor, K.E.; Stouffer, R.J.; Meehl, G.A. An overview of CMIP5 and the experiment design. Bull. Am. Meteorol. Soc. 2012, 93, 485–498. [Google Scholar] [CrossRef]
- Parmesan, C.; Yohe, G. A globally coherent fingerprint of climate change impacts across natural systems. Nature 2003, 421, 37–42. [Google Scholar] [CrossRef]
- Thomas, C.D.; Cameron, A.; Green, R.E.; Bakkenes, M.; Beaumont, L.J.; Collingham, Y.C.; Erasmus, B.F.N.; de Siqueira, M.F.; Grainger, A.; Hannah, L.; et al. Extinction risk from climate change. Nature 2004, 427, 145–148. [Google Scholar] [CrossRef]
- IPCC. Climate Change 2014: Synthesis Report. In Contribution of Working Groups I, II and III to the Fifth Assessment Report of the Intergovernmental Panel on Climate Change; Pachauri, R.K., Meyer, L.A., Eds.; IPCC: Geneva, Switzerland, 2015; p. 151. [Google Scholar]
- Arnell, N.W. Climate change and global water resources. Global Environ. Change 1999, 9, S31–S49. [Google Scholar] [CrossRef]
- Bolch, T.; Kulkarni, A.; Kaab, A.; Huggel, C.; Paul, F.; Cogley, J.G.; Frey, H.; Kargel, J.S.; Fujita, K.; Scheel, M.; et al. The State and Fate of Himalayan Glaciers. Science 2012, 336, 310–314. [Google Scholar] [CrossRef] [Green Version]
- Pandey, V.P.; Dhaubanjar, S.; Bharati, L.; Thapa, B.R. Hydrological response of Chamelia watershed in Mahakali Basin to climate change. Sci. Total Environ. 2019, 650, 365–383. [Google Scholar] [CrossRef]
- Kundzewicz, Z.W.; Mata, L.J.; Arnell, N.W.; Doll, P.; Jimenez, B.; Miller, K.; Oki, T.; Sen, Z.; Shiklomanov, I. The implications of projected climate change for freshwater resources and their management. Hydrolog. Sci. J. 2008, 53, 3–10. [Google Scholar] [CrossRef]
- Gosling, S.N.; Arnell, N.W. A global assessment of the impact of climate change on water scarcity. Clim. Change 2016, 134, 371–385. [Google Scholar] [CrossRef]
- Vorosmarty, C.J.; Green, P.; Salisbury, J.; Lammers, R.B. Global water resources: Vulnerability from climate change and population growth. Science 2000, 289, 284–288. [Google Scholar] [CrossRef]
- Gorguner, M.; Kavvas, M.L.; Ishida, K. Assessing the impacts of future climate change on the hydroclimatology of the Gediz Basin in Turkey by using dynamically downscaled CMIP5 projections. Sci. Total Environ. 2019, 648, 481–499. [Google Scholar] [CrossRef]
- Barron, O.; Silberstein, R.; Ali, R.; Donohue, R.; McFarlane, D.J.; Davies, P.; Hodgson, G.; Smart, N.; Donn, M. Climate change effects on water-dependent ecosystems in south-western Australia. J. Hydrol. 2012, 434, 95–109. [Google Scholar] [CrossRef]
- Zaveri, E.; Grogan, D.S.; Fisher-Vanden, K.; Frolking, S.; Lammers, R.B.; Wrenn, D.H.; Prusevich, A.; Nicholas, R.E. Invisible water, visible impact: groundwater use and Indian agriculture under climate change. Environ. Res. Lett. 2016, 11, 13–27. [Google Scholar] [CrossRef]
- Asoka, A.; Gleeson, T.; Wada, Y.; Mishra, V. Relative contribution of monsoon precipitation and pumping to changes in groundwater storage in India. Nat. Geosci. 2017, 10, 109–120. [Google Scholar] [CrossRef]
- Li, F.; Zhang, G.; Xu, Y.J. Spatiotemporal variability of climate and streamflow in the Songhua River Basin, northeast China. J. Hydrol. 2014, 514, 53–64. [Google Scholar] [CrossRef]
- Armandine Les Landes, A.; Aquilina, L.; De Ridder, J.; Longuevergne, L.; Pagé, C.; Goderniaux, P. Investigating the respective impacts of groundwater exploitation and climate change on wetland extension over 150 years. J. Hydrol. 2014, 509, 367–378. [Google Scholar] [CrossRef] [Green Version]
- Taylor, R.G.; Scanlon, B.; Döll, P.; Rodell, M.; Van Beek, R.; Wada, Y.; Longuevergne, L.; Leblanc, M.; Famiglietti, J.S.; Edmunds, M. Ground water and climate change. Nat. Clim. 2013, 3, 322–329. [Google Scholar] [CrossRef]
- Condon, L.E.; Gangopadhyay, S.; Pruitt, T. Climate change and non-stationary flood risk for the upper Truckee River basin. Hydrol. Earth. Syst. Sci. 2015, 19, 159–175. [Google Scholar] [CrossRef]
- Barnett, T.P.; Adam, J.C.; Lettenmaier, D.P. Potential impacts of a warming climate on water availability in snow-dominated regions. Nature 2005, 438, 303–309. [Google Scholar] [CrossRef]
- Immerzeel, W.W.; Pellicciotti, F.; Bierkens, M.F.P. Rising river flows throughout the twenty-first century in two Himalayan glacierized watersheds. Nat. Geosci. 2013, 6, 742–745. [Google Scholar] [CrossRef]
- Kundzewicz, Z.W.; Krysanova, V.; Benestad, R.E.; Hov, O.; Piniewski, M.; Otto, I.M. Uncertainty in climate change impacts on water resources. Environ. Sci. Policy 2018, 79, 1–8. [Google Scholar] [CrossRef]
- Okkonen, J.; Jyrkama, M.; Klove, B. A conceptual approach for assessing the impact of climate change on groundwater and related surface waters in cold regions (Finland). Hydrogeol. J. 2010, 18, 429–439. [Google Scholar] [CrossRef]
- Saha, G.C.; Li, J.; Thring, R.W.; Hirshfield, F.; Paul, S.S. Temporal Dynamics of Groundwater-Surface Water Interaction under the Effects of Climate Change: a case study in the Kiskatinaw River Watershed, Canada. J. Hydrol. 2017, 551, 440–452. [Google Scholar] [CrossRef]
- Scibek, J.; Allen, D.M.; Cannon, A.J.; Whitfield, P.H. Groundwater-surface water interaction under scenarios of climate change using a high-resolution transient groundwater model. J. Hydrol. 2007, 333, 165–181. [Google Scholar] [CrossRef]
- Bastola, S.; Murphy, C.; Sweeney, J. The role of hydrological modelling uncertainties in climate change impact assessments of Irish river catchments. Adv. Water Resour. 2011, 34, 562–576. [Google Scholar] [CrossRef]
- Jobson, H.; Emrbjsh, A.W. Modifications to the Diffusion Analogy Surface-water Flow Model (DAFLOW) for Coupling to the Modular Finite-Difference Groundwater, Flow Model(MODFIX); U.S. Geology Survey: Reston, VI, USA, 1999.
- Vanderkwaak, J.E.; Loague, K. Hydrologic-Response simulations for the R-5 catchment with a comprehensive physics-based model. Water Resour. Res. 2001, 37, 999–1013. [Google Scholar] [CrossRef]
- Steven, L.M.; Niswonger, R.G. GSFLOW—Coupled Ground-Water and Surface-Water Flow Model Based on the Integration of the Precipitation-Runoff Modeling System (PRMS) and the Modular Ground-Water Flow Model (MODFLOW-2005) United States Geological Survey Commonwealth of Virginia. 2008. Available online: https://pubs.usgs.gov/tm/tm6d1/ (accessed on 2 December 2016).
- Thompson, J.R.; Sorenson, H.R.; Gavin, H.; Refsgaard, A. Application of the coupled MIKE SHE/MIKE 11 modelling system to a lowland wet grassland in southeast England. J. Hydrol. 2004, 293, 151–179. [Google Scholar] [CrossRef]
- Panday, S.; Huyakorn, P.S. A fully coupled physically-based spatially-distributed model for evaluating surface/subsurface flow. Adv. Water Resour. 2004, 27, 361–382. [Google Scholar] [CrossRef]
- Ajami, H.; McCabe, M.F.; Evans, J.P.; Stisen, S. Assessing the impact of model spin-up on surface water-groundwater interactions using an integrated hydrologic model. Adv. Water Resour. 2014, 50, 2636–2656. [Google Scholar] [CrossRef] [Green Version]
- Therrien, R.; McLaren, R.G.; Sudicky, E.A.; Panday, S.M. HydroGeoSphere: A Three-Dimensional Numerical Model Describing Fully-Integrated Subsurface and Surface Flow and Solute Transport; University of Waterloo: Waterloo, Belgium, 2009. [Google Scholar]
- Sophocleous, M.; Perkins, S.P. Methodology and application of combined watershed and ground-water models in Kansas. J. Hydrol. 2000, 236, 185–201. [Google Scholar] [CrossRef]
- Kim, N.W.; Chung, I.M.; Won, Y.S.; Arnold, J.G. Development and application of the integrated SWAT–MODFLOW model. J. Hydrol. 2008, 356, 1–16. [Google Scholar] [CrossRef]
- Chung, I.-M.; Kim, N.-W.; Lee, J.; Sophocleous, M. Assessing distributed groundwater recharge rate using integrated surface water-groundwater modelling: Application to Mihocheon watershed, South Korea. Hydrogeol. J. 2010, 18, 1253–1264. [Google Scholar] [CrossRef]
- Guzman, J.A.; Moriasi, D.N.; Gowda, P.H.; Steiner, J.L.; Starks, P.J.; Arnold, J.G.; Srinivasan, R. A model integration framework for linking SWAT and MODFLOW. Environ. Modell. Softw. 2015, 73, 103–116. [Google Scholar] [CrossRef]
- Bailey, R.T.; Wible, T.C.; Arabi, M.; Records, R.M.; Ditty, J. Assessing regional-scale spatio-temporal patterns of groundwater–surface water interactions using a coupled SWAT-MODFLOW model. Hydrol. Process. 2016, 30, 4420–4433. [Google Scholar] [CrossRef]
- Qi, P.; Zhang, G.; Xu, Y.J.; Wu, Y.; Gao, Z. Spatiotemporal changes of reference evapotranspiration in the highest-latitude region of China. Water 2017, 9, 493. [Google Scholar] [CrossRef]
- Yun-long, Y.; Xian-guo, L.; Lei, W.; Hong-xian, Y. A quantitative analysis of climate impacts on runoff in Naoli River. Adv. Nat. Appl. Sci. 2010, 21, 765–770. [Google Scholar]
- Liu, G.H.; Luan, Z.Q.; Yan, B.X. Analysis on the spatiotemporal distribution of precipitation in the Naoli River of the Sanjiang plain during the past 50 years. J. Arid Land Res. Environ. 2013, 27, 131–136. [Google Scholar]
- Song, X.L.; Lu, X.G.; Liu, Z.M.; Sun, Y.H. Runoff change of Naoli River in Northeast China in 1955–2009 and its influencing factors. Chin. Geogr. Sci. 2012, 22, 144–153. [Google Scholar] [CrossRef]
- Wu, C. Analysis Groundwater Resources Volume of Naoli River Basin. Syst. Sci. Compr. Stud. Agric. 2011, 4, 385–389. [Google Scholar]
- Meng, X.-Y.; Wang, H.; Cai, S.-Y.; Zhang, X.-S.; Leng, G.-Y.; Lei, X.-H.; Shi, C.-X.; Liu, S.-Y.; Shang, Y. The China Meteorological Assimilation Driving Datasets for the SWAT Model (CMADS) Application in China: A Case Study in Heihe River Basin. 2017. Available online: http://www.cmads.org/ (accessed on 9 December 2016).[Green Version]
- Yang, X.; Yang, W.; Zhang, F.; Chu, Y.; Wang, Y.; Yi, X.; Zhang, B.; Guo, H.; Sun, Y. Investigation and Assessment of Groundwater Resources Potential and Eco-Environment Geology in Sanjiang Plain; Geological Publishing House: Beijing, China, 2008. [Google Scholar]
- Ji, D.; Wang, L.; Feng, J.; Wu, Q.; Cheng, H.; Zhang, Q.; Yang, J.; Dong, W.; Dai, Y.; Gong, D.; et al. Description and basic evaluation of Beijing Normal University Earth System Model (BNU-ESM) version 1. Geosci. Model Dev. 2014, 7, 2039–2064. [Google Scholar] [CrossRef] [Green Version]
- Abbaspour, K.C.; Johnson, C.A.; Genuchten, M.T.V. Estimating Uncertain Flow and Transport Parameters Using A Sequential Uncertainty Fitting Procedure. Vadose Zone J. 2004, 3, 1340–1352. [Google Scholar] [CrossRef]
- Lin, Y.F.; Anderson, M.P. A Digital Procedure for Ground Water Recharge and Discharge Pattern Recognition and Rate Estimation. Groundwater 2003, 41, 306–315. [Google Scholar] [CrossRef]
- Moriasi, D.N.; Gitau, M.W.; Pai, N.; Daggupati, P. Hydrologic and water quality models: Performance measures and evaluation criteria. Trans. ASABE 2015, 58, 1763–1785. [Google Scholar]
- Milly, P.C.D.; Dunne, K.A.; Vecchia, A.V. Global pattern of trends in streamflow and water availability in a changing climate. Nature 2005, 438, 347–350. [Google Scholar] [CrossRef]
- Alcamo, J.; Florke, M.; Marker, M. Future long-term changes in global water resources driven by socio-economic and climatic changes. Hydrolog. Sci. J. 2007, 52, 247–275. [Google Scholar] [CrossRef]
- Schewe, J.; Heinke, J.; Gerten, D.; Haddeland, I.; Arnell, N.W.; Clark, D.B.; Dankers, R.; Eisner, S.; Fekete, B.M.; Colon-Gonzalez, F.J.; et al. Multimodel assessment of water scarcity under climate change. Proc. Natl. Acad. Sci. USA 2014, 111, 3245–3250. [Google Scholar] [CrossRef]
- Nilawar, A.P.; Waikar, M.L. Impacts of climate change on streamflow and sediment concentration under RCP 4.5 and 8.5: A case study in Purna river basin, India. Sci. Total Environ. 2019, 650, 2685–2696. [Google Scholar] [CrossRef]
- Dan, W.; Wei, H.; Zhang, S.; Kun, B.; Bao, X.; Yi, W.; Yue, L. Processes and prediction of land use/land cover changes (LUCC) driven by farm construction: the case of Naoli River Basin in Sanjiang Plain. Environ. Earth Sci. 2015, 73, 4841–4851. [Google Scholar] [CrossRef]
- Zou, Y.; Duan, X.; Xue, Z.; E, M.; Sun, M.; Lu, X.; Jiang, M.; Yu, X. Water use conflict between wetland and agriculture. J. Environ. Manag. 2018, 224, 140–146. [Google Scholar] [CrossRef]
- Lu, W.; Li, P.; Wang, F.; Guo, L. Three-Dimensional Numerical Simulation of Groundwater in Naolihe Watershed. J. Jilin Univ. Earth Sci. Ed. 2007, 3, 541–545. [Google Scholar]
- Qi, P.; Zhang, G.; Xu, Y.; Wang, L.; Ding, C.; Cheng, C. Assessing the Influence of Precipitation on Shallow Groundwater Table Response Using a Combination of Singular Value Decomposition and Cross-Wavelet Approaches. Water 2018, 10, 598. [Google Scholar] [CrossRef]
- Jury, W.A.; Vaux, H.J. The Emerging Global Water Crisis: Managing Scarcity and Conflict Between Water Users. Adv. Agron. 2007, 95, 1–76. [Google Scholar]
- Siebert, S.; Burke, J.; Faures, J.M.; Frenken, K.; Hoogeveen, J.; Döll, P.; Portmann, F.T.J.H. Groundwater use for irrigation—A global inventory. Hydrol. Earth Syst. Sci. 2010, 7, 3977–4021. [Google Scholar] [CrossRef]
- Qi, P. Optimized Allocation of Water Resources Based on Conjunctive Regulation of Groundwater and Surface Water in the Naoli River Basin, Northeast China; University of the Chinese Academy of Sciences: Changchun, China, 2018. [Google Scholar]
- Famiglietti, J.S. The global groundwater crisis. Nat. Clim. 2014, 4, 945–948. [Google Scholar] [CrossRef]
- WWAP. The United Nations World Water Development Report 2018: Nature-based Solutions for Water; WWAP: Paris, France, 2018. [Google Scholar]
- Singh, A. Simulation-optimization modeling for conjunctive water use management. Agric. Water Manag. 2014, 141, 23–29. [Google Scholar] [CrossRef]
- Mulligan, K.B.; Brown, C.; Yang, Y.C.E.; Ahlfeld, D.P. Assessing groundwater policy with coupled economic-groundwater hydrologic modeling. Adv. Water Resour. 2014, 50, 2257–2275. [Google Scholar] [CrossRef]
- Hering, D.; Borja, A.; Carstensen, J.; Carvalho, L.; Elliott, M.; Feld, C.K.; Heiskanen, A.-S.; Johnson, R.K.; Moe, J.; Pont, D.; et al. The European Water Framework Directive at the age of 10: A critical review of the achievements with recommendations for the future. Sci. Total Environ. 2010, 408, 4007–4019. [Google Scholar] [CrossRef] [Green Version]
- Furman, A.; Abbo, H. Groundwater Management in Israel. In Water Policy in Israel. Global Issues in Water Policy; Becker, N., Ed.; Springer: Dordrecht, The Netherlands, 2013; volume 4, Available online: https://0-link-springer-com.brum.beds.ac.uk/chapter/10.1007/978-94-007-5911-4_8 (accessed on 9 December 2016).
- Hellegers, P.; Ierland, E.V. Policy Instruments for Groundwater Management in the Netherlands. Environ. Res. Econ. 2003, 26, 163–172. [Google Scholar] [CrossRef]
- Jiang, Y. China’s water security: Current status, emerging challenges and future prospects. Environ. Sci. Policy 2015, 54, 106–125. [Google Scholar] [CrossRef]
- The State Council. Available online: http://www.gov.cn/zwgk/2012-02/16/content_2067664.htm (accessed on 12 February 2012).
- Hove, S.V.D. A rationale for science–policy interfaces. Futures 2007, 39, 807–826. [Google Scholar] [CrossRef]
- Leta, O.T.; Nossent, J.; Velez, C.; Shrestha, N.K.; van Griensven, A.; Bauwens, W. Assessment of the different sources of uncertainty in a SWAT model of the River Senne (Belgium). Environ. Modell. Softw. 2015, 68, 129–146. [Google Scholar] [CrossRef]
- Tong, S.T.Y.; Sun, Y.; Ranatunga, T.; He, J.; Yang, Y.J. Predicting plausible impacts of sets of climate and land use change scenarios on water resources. Appl. Geog. 2012, 32, 477–489. [Google Scholar] [CrossRef]
- Zhang, L.; Nan, Z.T.; Xu, Y.; Li, S. Hydrological Impacts of Land Use Change and Climate Variability in the Headwater Region of the Heihe River Basin, Northwest China. PLoS ONE 2016, 11, 25. [Google Scholar] [CrossRef] [PubMed]
Figure 1.
Geographical locations of the observation wells and precipitation gauges used to study the Naoli River basin, Northeast China.
Figure 1.
Geographical locations of the observation wells and precipitation gauges used to study the Naoli River basin, Northeast China.

Figure 2.
The sketch diagram of relationship between SWAT HRUs and Modflow Cells.

Figure 3.
The basic principle of coupling the SWAT and Modflow models.

Figure 4.
Comparison of observed and simulated streamflow during the calibration (2011–2013) and validation (2014–2015) periods at four gauge stations: (a) Baoqing station, (b) Baoan station, (c) Hongqiling Station, and (d) Caizuizi Station.
Figure 4.
Comparison of observed and simulated streamflow during the calibration (2011–2013) and validation (2014–2015) periods at four gauge stations: (a) Baoqing station, (b) Baoan station, (c) Hongqiling Station, and (d) Caizuizi Station.

Figure 5.
Comparison between simulated and observed monthly groundwater level during the calibration and validation periods for 10 wells: (a) Jixian, (b) Shuangyashan, (c) 597 Farm, (d) Baoqing Farm, (e) 852 Farm, (f) 853 Farm, (g) Hongqiling, (h) Qixing, (i) Daxing, and (j) Shengli.
Figure 5.
Comparison between simulated and observed monthly groundwater level during the calibration and validation periods for 10 wells: (a) Jixian, (b) Shuangyashan, (c) 597 Farm, (d) Baoqing Farm, (e) 852 Farm, (f) 853 Farm, (g) Hongqiling, (h) Qixing, (i) Daxing, and (j) Shengli.


Figure 6.
The variation trend of annual precipitation during 2021–2050 for scenarios of RCP4.5 and RCP8.5.
Figure 6.
The variation trend of annual precipitation during 2021–2050 for scenarios of RCP4.5 and RCP8.5.

Figure 7.
Trends of maximum and minimum temperature during 2021–2050 for the RCP4.5 and RCP8.5 scenarios: (a) annual average maximum temperature, (b) annual average minimum temperature.
Figure 7.
Trends of maximum and minimum temperature during 2021–2050 for the RCP4.5 and RCP8.5 scenarios: (a) annual average maximum temperature, (b) annual average minimum temperature.

Figure 8.
The streamflow during 2021–2050 for scenarios of RCP4.5 and RCP8.5 (a) 2021–2035, (b) 2036–2050.
Figure 8.
The streamflow during 2021–2050 for scenarios of RCP4.5 and RCP8.5 (a) 2021–2035, (b) 2036–2050.


Figure 9.
Spatial distribution of groundwater recharge during 2021–2050 for scenarios of RCP4.5 and RCP8.5: (a) 2021–2035, RCP4.5 (b) 2036–2050, RCP4.5 (c) 2021–2035, RCP8.5 (d) 2036–2050, RCP8.5.
Figure 9.
Spatial distribution of groundwater recharge during 2021–2050 for scenarios of RCP4.5 and RCP8.5: (a) 2021–2035, RCP4.5 (b) 2036–2050, RCP4.5 (c) 2021–2035, RCP8.5 (d) 2036–2050, RCP8.5.


Figure 10.
The groundwater recharge during 2021–2050 for scenarios of RCP4.5 and RCP8.5 (a) 2021–2035 (b) 2036–2050.
Figure 10.
The groundwater recharge during 2021–2050 for scenarios of RCP4.5 and RCP8.5 (a) 2021–2035 (b) 2036–2050.

Figure 11.
Groundwater—surface water interactions in space during 2021–2050 under the RCP4.5 and RCP8.5 scenarios: (a) 2021–2035, RCP4.5 (b) 2036–2050, RCP4.5 (c) 2021–2035, RCP8.5 (d) 2036–2050, RCP8.5.
Figure 11.
Groundwater—surface water interactions in space during 2021–2050 under the RCP4.5 and RCP8.5 scenarios: (a) 2021–2035, RCP4.5 (b) 2036–2050, RCP4.5 (c) 2021–2035, RCP8.5 (d) 2036–2050, RCP8.5.

Figure 12.
The interaction between science and policy with water security as the core.


Table 1.
The data and their spatial resolution applied in the model.
| Data | Units | Data Sources | Resolution | Purpose |
|---|---|---|---|---|
| DEM | m | Geospatial data cloud | 30 × 30 | SWAT |
| Land use | m | Landsat 8 | 30 × 30 | SWAT |
| Soil types | m | China Soil Map Based Harmonized World Soil Database | 1:100 × 104 | SWAT |
| Meteorological data | ° | China Meteorological Assimilation Driving Datasets | 1/3 | SWAT |
| Future climate scenario data | ° | NEX-GDDP (RCP4.5 and RCP8.5) | 1/4 | SWAT-Modflow |
| Streamflow | m3/s | Hydrology Bureau in Heilongjiang Province | Month | SWAT |
| Reservoirs | − | Local hydrology Bureau | − | SWAT |
| Water use | − | Ditto | − | SWAT |
| Hydraulic conductivity | m/d | Investigation and Assessment of Groundwater Resources Potential and Eco-Environment Geology in Sanjiang Plain (Yang et al., 2008) | 1:25 × 104 | Modflow |
| Specific yield | − | Ditto | 1:25 × 104 | Modflow |
| Elevation of bottom | m | Ditto | 1:25 × 104 | Modflow |
| Storage specific | 1/m | Ditto | 1:25 × 104 | Modflow |
| Groundwater level | m | Local hydrology Bureau | Month | Modflow |
Table 2.
The criteria for evaluating the performance of the models.
| Measure | Bad | Good | Better | Very Good |
|---|---|---|---|---|
| R2 | [0, 0.65) | [0.65, 0.75) | [0.75, 0.85) | [0.85, 1) |
| NSE | (-∞, 0.5] | (0.5, 0.7] | (0.7, 0.8] | (0.8, 1] |
| RE | [25, +∞) | [15, 25) | [10, 15) | (-∞, 0) |
Table 3.
The evaluation for simulation results of monthly streamflow and groundwater level during calibration and validation periods.
Table 3.
The evaluation for simulation results of monthly streamflow and groundwater level during calibration and validation periods.
| Hydrological Station | Calibration (2011–2013) | Validation (2014–2015) | ||||
|---|---|---|---|---|---|---|
| ENS | R2 | RE | ENS | R2 | RE | |
| Baoqing | 0.76 | 0.89 | 20.99 | 0.68 | 0.85 | 0.91 |
| Baoan | 0.74 | 0.85 | −3.24 | 0.72 | 0.81 | −9.63 |
| Hongqiling | 0.81 | 0.91 | 12.06 | 0.67 | 0.85 | 55.18 |
| Caizuizi | 0.72 | 0.92 | −11.11 | 0.68 | 0.80 | 5.75 |
| Wells | ||||||
| Jixian | 0.73 | 0.81 | −4.93 | 0.71 | 0.75 | −8.33 |
| Shuangyashan | 0.53 | 0.57 | −1.57 | 0.56 | 0.61 | −17.52 |
| 597 Farm | 0.33 | 0.37 | 12.36 | 0.30 | 0.32 | 10.06 |
| Baoqing | 0.66 | 0.71 | −2.19 | 0.63 | 0.69 | 2.69 |
| 852 Farm | 0.65 | 0.76 | −9.69 | 0.61 | 0.62 | −10.69 |
| 853 Farm | 0.55 | 0.66 | −10.25 | 0.51 | 0.78 | −9.26 |
| Hongqiling | 0.79 | 0.87 | −0.01 | 0.65 | 0.67 | −0.43 |
| Hongqi | 0.46 | 0.52 | 0.32 | 0.42 | 0.53 | 1.37 |
| Daxing | 0.58 | 0.83 | 9.74 | 0.32 | 0.79 | 12.18 |
| Shengli | 0.51 | 0.58 | 2.79 | 0.43 | 0.51 | 3.27 |
Table 4.
The calibrated parameters of SWAT model.
| Parameter | Description | Initial Range | Final Parameters | |||
|---|---|---|---|---|---|---|
| Baoqing | Baoan | Hongqiling | Caizuizi | |||
| Surface runoff | ||||||
| TLAPS | Temperature lapse rate | [−10, 10] | −1.25 | −6.11 | 2.97 | 0.72 |
| CN2 | SCS runoff curve number | [25, 98] | 56 | 70.72 | 86 | 58.85 |
| BIOMIX | Biological mixing efficiency | [0, 1] | 0.13 | 1.30 | 0.60 | 0.53 |
| ESCO | Soil evaporation compensation factor | [0, 1] | 0.72 | 0.26 | 0.32 | 0.85 |
| EPCO | Plant uptake compensation factor | [0, 1] | 0.46 | 0.89 | 0.59 | 0.40 |
| CANMX | Maximum canopy storage | [0, 100] | 69.00 | 21.20 | 50 | 30.20 |
| Soil | ||||||
| SOL_AWC | Available water capacity of the soil layer | [0, 1] | 0.58 | 0.11 | 0.33 | 0.08 |
| SOL_K | Saturated hydraulic conductivity | [0, 2000] | 306.00 | 310.9 | 190 | 275 |
| Groundwater | ||||||
| ALPHA_BF | Baseflow alpha factor (days) | [0, 1] | 0.19 | 0.04 | 0.51 | 0.11 |
| GW_DELAY | Groundwater delay (days) | [0, 500] | 25.60 | 36.61 | 189.05 | 39.23 |
| GWQMN | Treshold depth of water in the shallow aquifer required for return flow to occur (mm) | [0, 5000] | 2333 | 2880 | 2281 | 3179 |
| REVAPMN | Threshold depth of water in the shallow aquifer for “revap” to occur (mm) | [0, 500] | 67 | 173.7 | 207 | 232 |
| RCHRG_DP | Deep aquifer percolation fraction | [0, 1] | 0.54 | 0.87 | 0.26 | 0.08 |
| GW_REVAP | Groundwater “revap” coefficient | [0.02, 0.2] | 0.09 | 0.09 | 0.14 | 0.03 |
| Channel flow | ||||||
| CH_K2 | Effective hydraulic conductivity in main channel alluvium | [0, 500] | 218 | 169.1 | 256 | 245 |
| CH_N2 | Manning’s “n” value for the main channel | [0, 0.3] | 0.2 | 0.28 | 0.15 | 0.14 |
Table 5.
The calibrated hydrogeology parameters.
| Parameter | K (m/d) | Sy | Ss (1/m) | |||
|---|---|---|---|---|---|---|
| Initial Value | Final Value | Initial Value | Final Value | Initial Value | Final Value | |
| Ⅰ | 35 | 31 | 0.25 | 0.26 | 0.000032 | 0.000035 |
| Ⅱ | 22 | 20 | 0.21 | 0.22 | 0.000016 | 0.000015 |
| Ⅲ | 11 | 10 | 0.11 | 0.12 | 0.000011 | 0.000012 |
| Ⅳ | 8 | 8 | 0.08 | 0.07 | 0.000008 | 0.000008 |
Table 6.
Predicted future streamflow under the RCP4.5 and RCP8.5 climate change scenarios in comparison with the mean value from current multi-years (108 m3).
Table 6.
Predicted future streamflow under the RCP4.5 and RCP8.5 climate change scenarios in comparison with the mean value from current multi-years (108 m3).
| Period | Streamflow | Variation | |
|---|---|---|---|
| Mean value for current multi-years | 23.51 | — | |
| RCP4.5 | 2021–2035 | 20.78 | −2.73 |
| 2036–2050 | 22.00 | −1.51 | |
| RCP8.5 | 2021–2035 | 15.35 | −8.16 |
| 2036–2050 | 22.95 | −0.56 | |
Table 7.
The variation of groundwater recharge under RCP4.5 and RCP8.5 compared with the * mean value for current multi-years (108 m3).
Table 7.
The variation of groundwater recharge under RCP4.5 and RCP8.5 compared with the * mean value for current multi-years (108 m3).
| Period (Year) | Groundwater Recharge | Variation | |
|---|---|---|---|
| Mean value for current multi-years* | 20.17 | — | |
| RCP4.5 | 2021–2035 | 18.38 | −1.79 |
| 2036–2050 | 19.42 | −0.75 | |
| RCP8.5 | 2021–2035 | 13.97 | −6.20 |
| 2036–2050 | 20.05 | −0.12 | |
Table 8.
The interaction between groundwater and surface water during 2021–2050 under the RCP4.5 and RCP8.5 climate change scenarios.
Table 8.
The interaction between groundwater and surface water during 2021–2050 under the RCP4.5 and RCP8.5 climate change scenarios.
| Period (Year) | Groundwater Recharge River Water (104m3) | River Water Recharge Groundwater (104m3) | Interaction between Groundwater and River Water (104m3) | |
|---|---|---|---|---|
| RCP4.5 | 2021–2035 | 2246.95 | 10528.08 | 8281.13 |
| 2036–2050 | 8610.94 | 11719.23 | 3108.29 | |
| RCP8.5 | 2021–2035 | 2180.72 | 6566.13 | 4385.41 |
| 2036–2050 | 8098.68 | 11301.91 | 3203.23 | |
© 2019 by the authors. Licensee MDPI, Basel, Switzerland. This article is an open access article distributed under the terms and conditions of the Creative Commons Attribution (CC BY) license (http://creativecommons.org/licenses/by/4.0/).
Share and Cite
MDPI and ACS Style
Qi, P.; Zhang, G.; Xu, Y.J.; Xia, Z.; Wang, M. Response of Water Resources to Future Climate Change in a High-Latitude River Basin. Sustainability 2019, 11, 5619. https://0-doi-org.brum.beds.ac.uk/10.3390/su11205619
AMA Style
Qi P, Zhang G, Xu YJ, Xia Z, Wang M. Response of Water Resources to Future Climate Change in a High-Latitude River Basin. Sustainability. 2019; 11(20):5619. https://0-doi-org.brum.beds.ac.uk/10.3390/su11205619
Chicago/Turabian StyleQi, Peng, Guangxin Zhang, Yi Jun Xu, Zhikun Xia, and Ming Wang. 2019. "Response of Water Resources to Future Climate Change in a High-Latitude River Basin" Sustainability 11, no. 20: 5619. https://0-doi-org.brum.beds.ac.uk/10.3390/su11205619
Note that from the first issue of 2016, this journal uses article numbers instead of page numbers. See further details here.