The Influencing Factors of a Polycentric Employment System on Jobs-Housing Matching—A Case Study of Hangzhou, China


1
College of Architecture and Urban Planning, Tongji University, Shanghai 200092, China
2
Key Laboratory of Ecology and Energy-Saving Study of Dense Habitat, Ministry of Education, Tongji University, Shanghai 200092, China
*
Author to whom correspondence should be addressed.
Sustainability 2019, 11(20), 5752; https://0-doi-org.brum.beds.ac.uk/10.3390/su11205752
Submission received: 11 September 2019
/
Revised: 15 October 2019
/
Accepted: 15 October 2019
/
Published: 17 October 2019
(This article belongs to the Collection Sustainable Built Environment)
Abstract
:This paper discusses the relationship between the polycentric spatial structure and jobs-housing matching and its influencing factors in the urbanized area of Hangzhou City in China. First, 42 employment centers are identified while using the method of the threshold value of employment density and employment to residence ratio based on the places of employment and residence that were identified from cellphone signaling data. This study found that Hangzhou have remarkable features of a polycentric system. Second, we use the jobs-housing matching rate index to measure the jobs-housing matching characteristics of employment centers. We found that the polycentric structure does not guarantee jobs-housing matching of all centers, although nearly half of the employment centers had good jobs-housing matching and 14.29% do not achieve jobs-housing matching, which indicates the uncertainty of “co-location hypothesis” in China. Employment centers of different levels, industry types, and locations also display certain regularity in their jobs-housing matching level. Third, by using correlation analysis and stepwise multiple regression analysis, we found that, besides the polycentric factor, the spatial and industrial factors also exert a certain effect on jobs-housing matching, reasonable control of the employment center size, employment to resident ratio, and industrial diversity are the determinants that affect the jobs-housing matching level.
1. Introduction
Since the late 1980s, the ideas of ‘employment subcenters’ and ‘polycentricity’, as represented by retail corridors, high-tech industrial clusters, high-density office space, etc. as shown by Giuliano et al. [1], have appeared in large cities in North America, such as Los Angeles [2,3,4], San Francisco [5], Chicago [6], Atlanta [7], and Montreal [8]. Empirical studies have found that Europe and Asia reflect similar trends to those in the Netherlands [9], Italy [10], France [11], Turkey [12], Australia [13], China [14], and others. McMillen [15] (p. 225) defined an employment subcenter as “a concentration of firms large enough to have significant effects on the overall spatial distribution of population, employment, and land prices”, and a polycentric city as “a metropolitan area with a strong central business district and large subcenters”. The polycentric city has become a common phenomenon in post-industrial megacities; in fact, the policy makers regarded polycentricity as an important planning tool to integrate space economic development, enhance urban competitiveness, social cohesion, and environmental sustainability, such as the EU Cohesion Policy since 1999. However, polycentricity as phenomenon and as a planning tool are two different meanings, it is not clear why there is a consequential relationship between the two, but several studies have concluded that it is difficult to identify empirical evidence to support the positive claims made in policy makers asked [16].
Jobs-housing matching is an extension of the jobs-housing balance concept. Jobs-housing balance refers to “the distribution of employment relative to the distribution of workers within a given geographic area” [3]. Cervero believed that the employment-population distribution uniformity (jobs-housing ratio) only indicates the potential for jobs-housing balance; the real jobs-housing balance is found through jobs-housing matching, which indicates that workers live locally, and Cervero thus put forward the number of local employed residents, local workers, and self-containment indexes to measure jobs-housing matching [17]. Jobs-housing matching must indicate matches between the skill levels of local residents and local job opportunities, as well as between the earnings of workers and the cost of local housing. Urban and regional planning scholars tend to believe that the jobs-housing mismatch is a key factor that explains urban congestion and increased commuting time, and have recommended that the government adopt policies to improve the relationship between employment and housing in job centers and increase the mobility of polycentric cities. However, the hypothesis that the evolution of a polycentric spatial structure in large cities could provide more employment opportunities and achieve better spatial matching has not been sufficiently supported by empirical research.
On the one hand, it is believed that the polycentric spatial structure is advantageous towards jobs-housing matching and it enhances commuting efficiency. These scholars support the ‘co-location’ hypothesis, which asserts that, in polycentric cities, communities with balanced employment and housing are likely to develop around employment centers and that a large number of jobs-housing balanced employment centers, integrated in polycentric cities, help the whole metropolitan area to achieve a better jobs-housing matching [18]. Gordon et al. [18] found that living in a high-density US city center between 1980 and 1985 would increase the commuting time by 25–30%; moreover, the study asserted that polycentric employment would help rational residents and workers to escape congestion by changing the location of their homes or their jobs and that this type of adjustment is easier to make in large, dispersed metropolitan areas with alternative employment subcenters and a wide variety of residential neighborhoods. In addition, evidence supporting this view has been demonstrated in Turkey [12] and China [14]. On the other hand, some scholars believe that polycentric decentralization will lead to jobs-housing mismatches and a longer commuting time for employees [5,9,11,13,19]. First, cities experience the decentralization of population and employment at the same time, and the jobs-housing mismatch comes from the difference in the ratio and location of population and employment decentralization; this effect has been demonstrated in San Francisco, USA [5]; Paris, Lyon, and Marseille, France [9]; the Randstad, the Netherlands [11]; and, Sydney, Australia [13]. Second, the urban sprawl of jobs-housing mismatch might be due to the high concentration of work in CBDs, as, despite the dispersed population, suburban commuters mainly commute to and from the city center; this view has been proven in Birmingham and Tuscaloosa, USA [19].
However, many scholars believe that spatial structural factors (monocentric and polycentric) between residences and employment cannot be the only reason for jobs-housing matching. Many studies have shown that built environment factors, industrial factors, social economic factors and historical and cultural system factors will also affect the matching relationship. For example, some scholars have found that the spatial structural factors, such as the size of employment center [7], distance to the CBD [7,20,21], distance to sub-center [20], polycentricity indicator [22]; built environment factors, such as ratio of employment to residents [20], jobs or destination (subway, expressway, etc.) accessibility [20,21], employment/population density [7,21,22,23], land-use mix [21,23]; industrial factors such as employment center industry types [24,25]; social economic factors such as housing price [5], income level [26], personal and family characteristics [7,9,17,27], etc., are significantly correlated with jobs-housing matching. For instance, Sultana [7] adopted correlation analysis in the Atlanta area and showed that the larger the employment center is, the longer the commuting time is, and that the farther the distance from the CBD, the longer the commuting time. Travisi and Camagni [23] found that the collective cost of commuting decreases in areas with high density and mixed land use. Lee et al. [25] found that the retail industry has the shortest commuting time, followed by the service industry, mainly because employment in retail and consumer service industries is mainly concentrated in local areas. Cervero [17] argued that facts, such as fiscal and inclusionary zoning, growth moratoria, worker earnings/housing cost mismatches, two wage-earner households, and job turnover, leads to the jobs-housing mismatch in the United States.
In the 1980s, the market economic reform of urban land in China led to a substantial difference in land prices between urban centers and suburbs, which stimulated the suburbanization of housing and the decentralization of employment. Since the 21st century, China’s large cities have increasingly shown the characteristics of polycentric urban structure. Some scholars believe that the transition from the traditional compact, monocentric city structure to the polycentric city structure is conducive in the matching of jobs and housing [14,28]. Zhao et al. [28] believed that China’s planning policy promotes the construction of affordable housing near the employment center, which thereby reduces the commuting distance. Zhao et al. [14] found that in China’s Beijing, workers who lived in planned suburban sub-center tend to commute shorter distances to central urban area than other sprawling development suburban areas. Nonetheless, some scholars have voiced opinions that the polycentric structure may not guarantee jobs-housing matching [29], and that the political and economic system, policy, industrial development, suburbanization process, and socioeconomic attributes are also important influencing factors [30,31]. Hu et al. [29] found that, in inner-city Beijing, the commuting time of traditional and emerging centers is longer than that of non-central areas; in the inner ring suburbs, the commuting time to emerging centers is shorter than that of traditional centers; and, in the outer ring suburbs, emerging centers have the longest commutes, while traditional centers have the shortest commutes. Wang and Chai [30] argued that China’s unit system (socialist welfare housing system) provides housing options for low- and middle-income families and single employees near urban centers. Lin et al. [31] found that the impact of polycentric centers on commuting was due to the degree of suburbanization in different economic sectors and it was related to individual socio-economic characteristics, such as income and education level.
There is no clear answer regarding whether polycentric employment in Chinese cities is conducive to jobs-housing matching, but it has become a common planning strategy for taking the polycentric employment system as a means to optimize the jobs-housing spatial relationship in megacities. In the past 40 years’ reform and opening up, Hangzhou had moved from the "West Lake Era" to the “Qiantang River Era”, and the urban structure has begun to develop from monocentric to polycentric. This transform makes Hangzhou a good case study, with rapid urban growth and changes in jobs-housing relationships; this study analyzes the effectiveness of the polycentric spatial structure by commuting connections and focuses on whether polycentric employment can achieve better jobs-housing matching as compared to monocentric development in Chinses big cities, which can provide a comparison between eastern and western studies from the perspective of built environment, economic structure, institutional, and other forces.
2. Research Data, Approach and Methodology
2.1. Research Site
Hangzhou is the capital of Zhejiang Province and it is one of the central cities in the Yangtze River Delta. In 2017, it had 10 districts, two counties, and one county-level city under its jurisdiction. This study takes the urbanized area in 10 districts (3703.31 square kilometers) as the research area. The research area is divided into 1575 traffic analysis zones (TAZ), the average unit area of which is 2.35 square kilometers, with a minimum of 0.12 square kilometers, and a maximum of 87.52 square kilometers.
2.2. Research Data
2.2.1. Cellphone Signaling Data
The study uses cellphone signaling data from China Mobile Communications Corporation for twenty working days in four consecutive weeks of April 2017 in Hangzhou. Cellphone signaling data are the location information of cellphone users during mobile commuting network activities, when the cellphone user starts up, shut down, calls, is called, sends and receives messages, switches base station, or mobile switching center; the cellphone periodically updates the location, anonymous cellphone identification number, base station number, and timestamp, which are saved in the signaling dataset.
2.2.2. Economic Census Data
The cellphone signaling data cannot identify the type of work that a user does. Thus, the economic census data contains the industry classification of the employed population. Matching the employment center that was identified by the cellphone signaling data with the economic census data allows for the industry type of the employment center to be identified. In China, the third national economic census data, conducted in 2013, has 19 industrial categories, except for agriculture, forestry, animal husbandry, fishery, and construction; the categories are grouped into six main industry types (Respectively, for advanced producer services (including finance, real estate, rental and business services), high-tech services (including information transmission, software and information technology services, scientific and technical services), public services(including education, health and social work, culture, sports and entertainment, public management, social security and social organizations), life services (including resident services, repair and other services, hydraulic engineering, environment and public facilities management), commercial logistics(including wholesale and retail, transportation, warehousing and postal services, accommodation and catering industry), and manufacturing).
2.2.3. Urban Land-Use Datasets
Urban land use status datasets come from the local planning authority of Hangzhou, including land-use type, subway stations, high speed and urban expressways, scenic spots, and other information. Urban land-use is classified into eight categories: residential land, public management and public service, commercial service facilities, industry, logistics and warehousing, transportation facilities, public facilities, and green land.
2.3. Research Methodology
2.3.1. Identifying Commuting Population
Zhou et al. [32] identified the residence and workplace of cellphone users from cellphone location data in Shenzhen. This study adopted a similar method, but with certain differences. First, the data are based on the cellphone location data collected on 20 working days in a month. Second, cellphone user’s place of residence and work was identified based on their phone’s location during sleep time (12 PM to 5 AM) and working time (9 AM to 5 PM), while using a continuous stay in the same location of not less than the threshold (two hours) and the base station with repeating recognition rate of 60% in the same location. In Hangzhou, a total of 7.5287 million and 4.6284 million users’ place of residence and work were identified, respectively, based on the city's permanent population of 9.188 million at the end of 2016 and the employed population of 5.8990 million in the Third Economic Census; the recognition rate of the city’s residents and employed population reached 79% and 78.46%, respectively. Finally, users who live and work in different base stations are identified as the commuting population; in the 1575 TAZ units, the commuting population totaled 1.9706 million, which accounted for 88.44% of the city’s commuting population and 96.22% of the 10 districts.
2.3.2. Identifying Employment Centers
In empirical research, there are many ways to identify employment centers, including the employment density and total employment threshold method [1,3,33], the employment/residence ratio and total employment threshold method [2,8], the peak employment density and residual method [6,15], the commuter flow method [10,11], etc.
The most commonly used method is that proposed by Giuliano and Small [3], which identifies an employment center as a set of contiguous zones, each with a certain minimum employment density, which together have a certain minimum total employment. However, it is difficult to determine that threshold. Giuliano and Small [3] determined the employment density D threshold as 10 jobs per acre (2470 jobs/km2) and the total employment threshold E as 10000 jobs; however, this method will bias the center towards the older and high-intensity areas, so some residential areas with high employment outflow will be identified as employment centers [2]. Forstall and Green [2] adopted the employment to residence ratio (E/R)>1 to identify employment centers, which can identify the net inflow of suburban employment centers with moderate employment density, such as airports, ports, and modern industries. We combine the methods of Giuliano and Small [3] and Forstall and Green [2], as Chinese cities have high-density employment centers in the old parts of the city coexisting with the net inflow medium-density employment centers in the suburb. When we use the D, E/R, E threshold method, adopting the average D threshold that was used by Muniz et al. [33], we set the E/R threshold value at greater than 1 and the E threshold more than 0.4 percent of total employment. We found that the employment centers in the old part of the city can be well identified, but it is difficult for suburban employment centers to meet the average D threshold that is necessary for identification. In the end, we adopted Coffey and Shearmur’s [8] method, taking Hangzhou’s Outer Ring Road as the boundary and using a combination of Equations (1)–(3) to identify the employment centers inside the ring:
E/R ≥ 1
Et ≥ 0.4%E
A combination of Equations (1) and (5) or a combination of Equations (2), (4), and (5) is adopted to identify the employment centers outside the ring:
Et ≥ 0.25%E
Dtaz is the employment density of TAZ, is the average employment density of all units, E/R is the ratio of employment to working residence, Et is the total employment population of adjacent unit (using queen’s law), E is the total employment population, and . is the average employment density of urban area outside the Outer Ring Road.
2.3.3. Methodology to Measure Jobs-Housing Matching
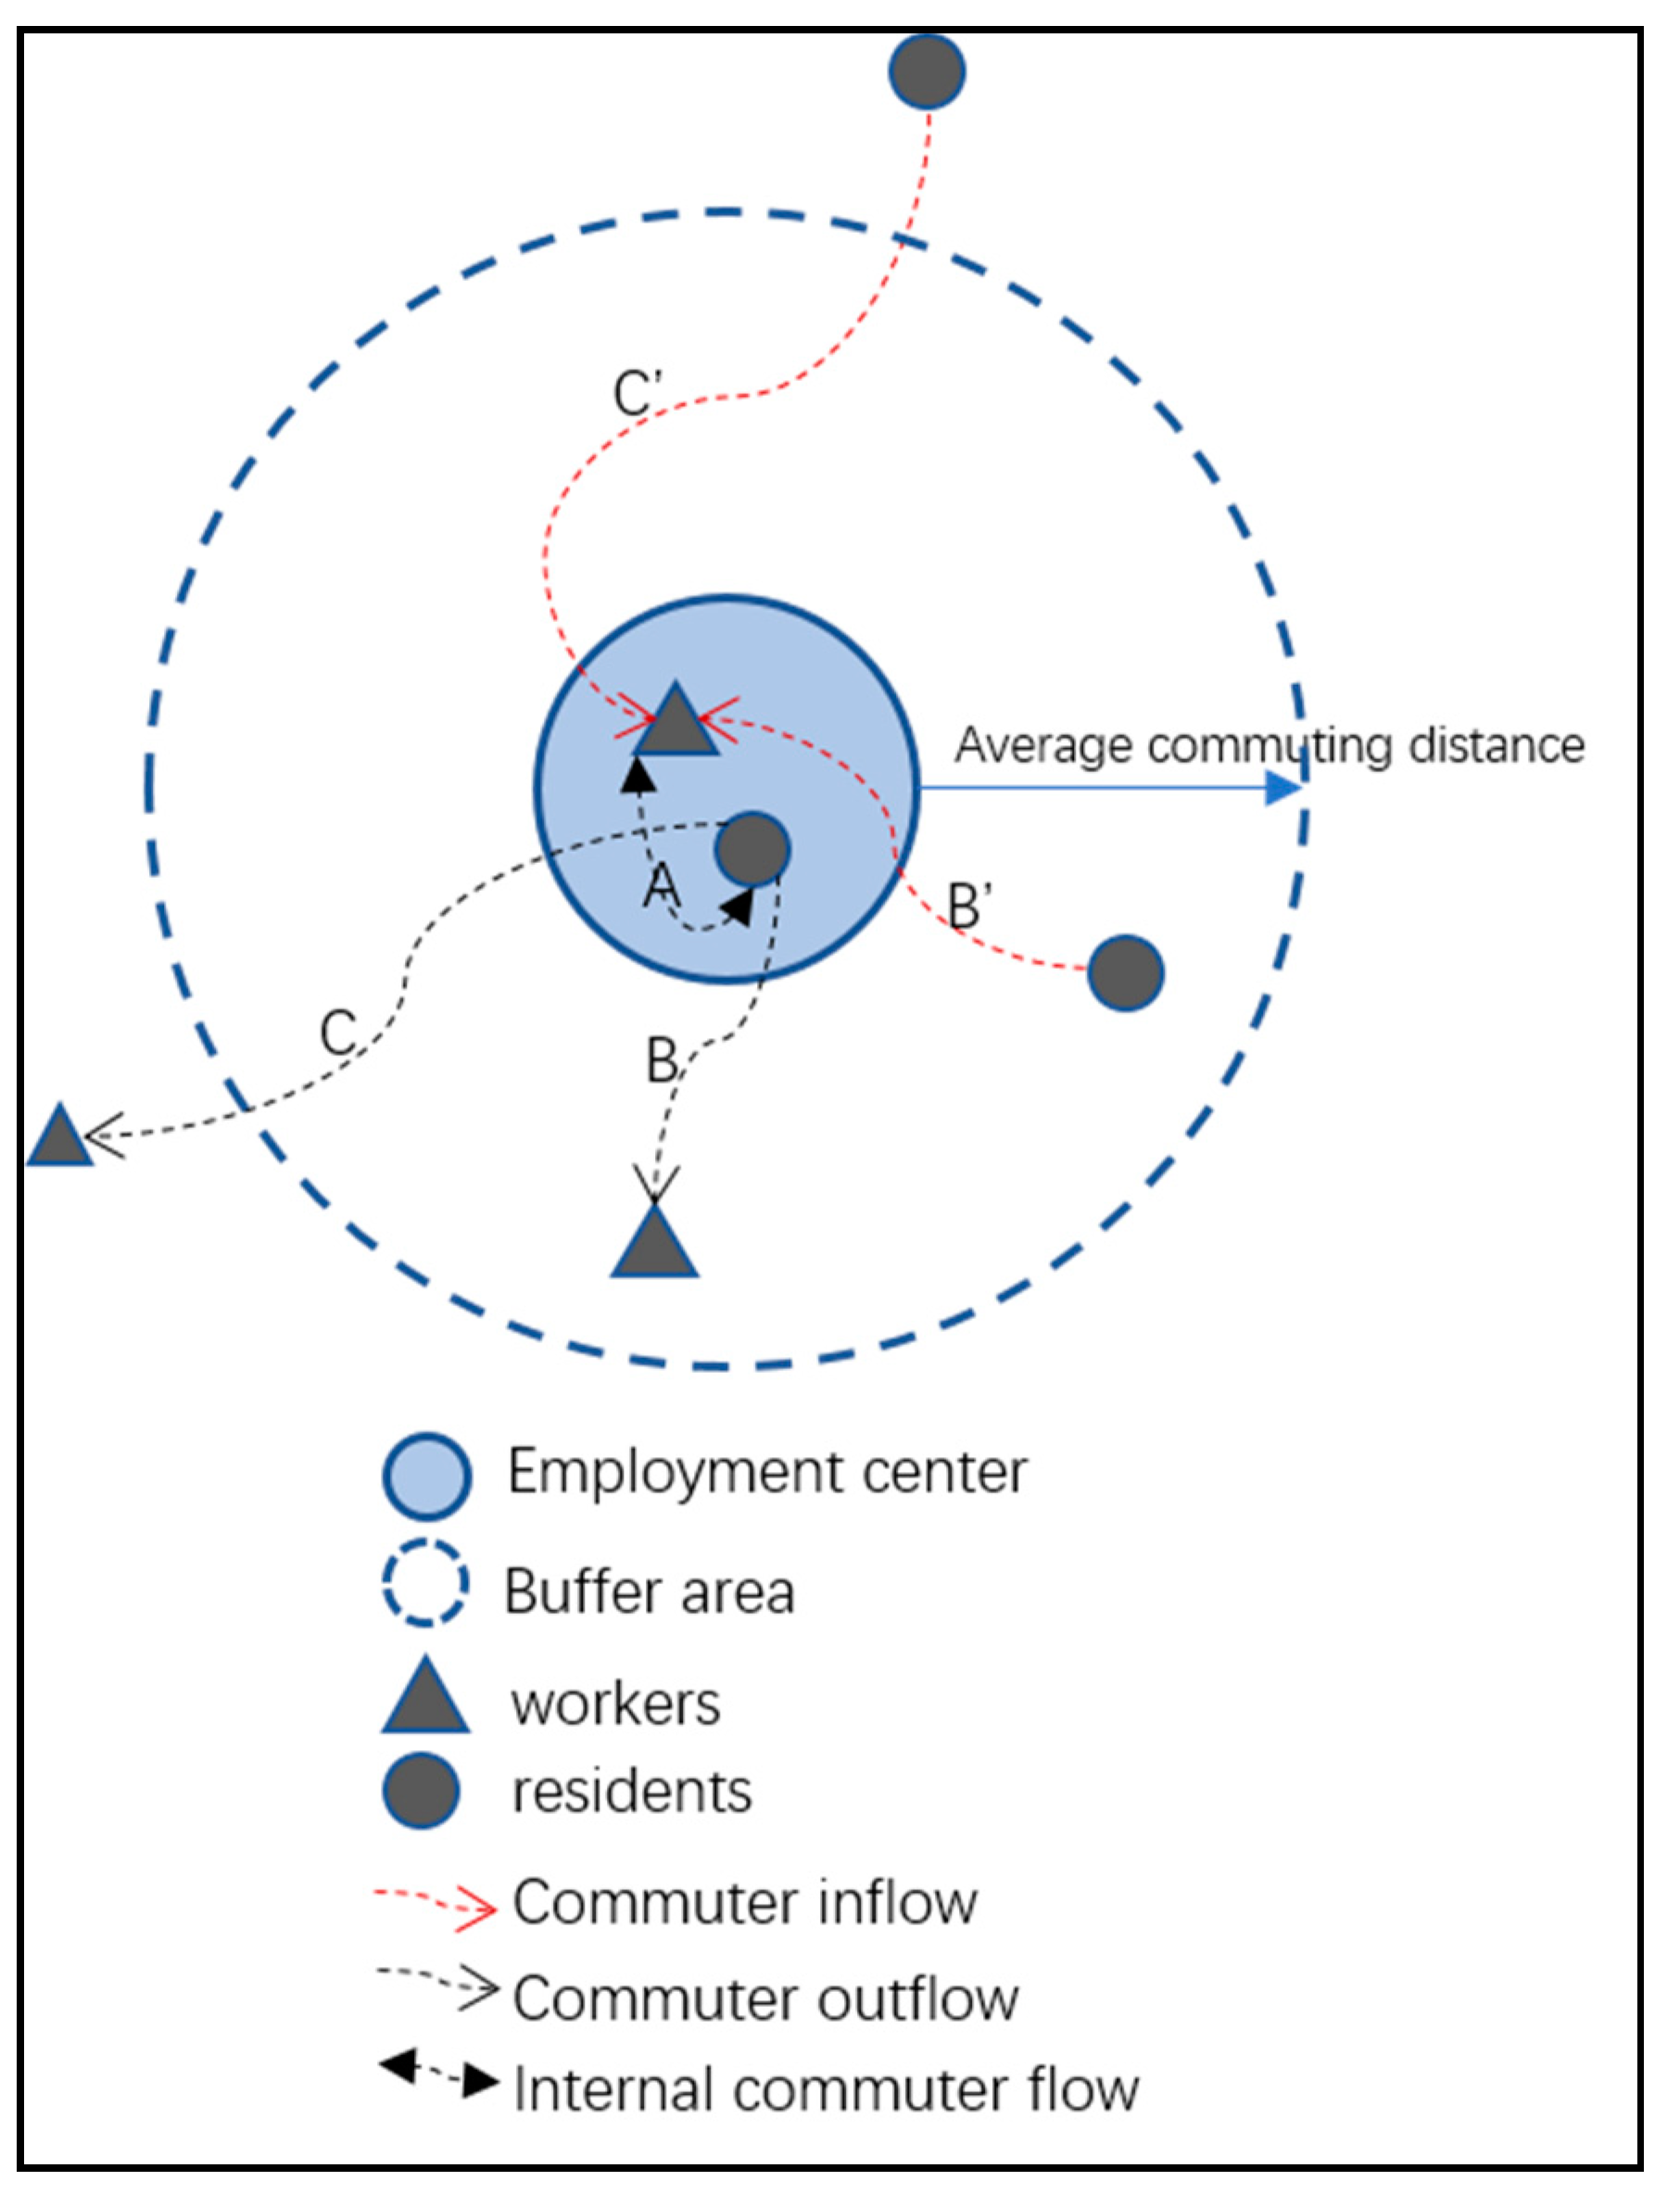
According to the co-location hypothesis, a better jobs-housing balance can be achieved by the mutual local adjustment between jobs and housing [18], but most indicators that empirical studies used cannot specifically measure how balanced the resident workers have access to jobs within ‘reasonable’ travel distance or time, such as self-containment indexes [17], commuting distance, and commuting time. For example, the study of Schwanen et al. [27] shows that workers in polycentric cities with decentralized commuting and exchange commuting spend more time commuting to and from work than those in monocentric and cross-commuting polycentric cities. Therefore, different types of polycentric urban systems lead to insignificant differences in commuting distance, and thus commuting distance cannot fully reflect the jobs-housing matching of employment centers. Therefore, based on the users’ residence and workplace data of base station locations that were identified from cellphone signaling data, this study constructs a jobs-housing matching index from the perspective of commuter connection. Ewing [34] believes that a jobs-housing matched community must achieve a certain internal commuting rate within a reasonable commuting range, and Peng [35] believed that the average or median of the actual commuting distance should be regarded as a reasonable commuting distance. Therefore, we take the commuting rate within the average commuting radius of employment centers as an index of which to judge jobs-housing matching, as shown in Figure 1. Drawing a buffer zone that is based on the average commuting distance along the employment center boundary, the residential jobs-housing matching index is (A+B)/(A+B+C), and the workers’ jobs-housing index is (A+B’)/(A+B’+C’). If the jobs-housing matching index exceeds a certain threshold value (such as the average value of all the centers), then the center is considered as reflecting jobs-housing matching; otherwise, it is a jobs-housing mismatch.
3. Results
3.1. Employment Center and Jobs-Housing Matching Characteristics
3.1.1. Employment Center Identification and Characteristics
In Hangzhou, 42 employment centers were identified; 9.81 percent of the total area contained 45.40 percent of the employed residents. The employment centers are ranked according to the size of the employment population. We find that there is a rank size in functional organization, which implies a hierarchy of functions, and the number of centers by size gives an ordinary least squares estimation of:
In (rank) = 14.563 − 1.2112In (employment)
The adjusted R2 of the equation is 0.897, which is similar to the research results of Giuliano and Small [3] and Giuliano and Redfearn [1] and it indicates an obvious hierarchical feature between employment centers. Subsequently, we divided the employment centers into different types according to employment population and density. The specific standards for this division are as follows:
Main center: The total employment population is more than 60,000, the average employment density is more than 4000 persons/km2, and employment density of at least one-unit is more than 10,000 persons/km2. Three main centers were identified.
Sub-center: The total employment population is more than 20,000, the average employment density is more than 2000 persons/km2, and employment density of at least one-unit is more than 4000 persons/km2. Eleven sub-centers were identified.
Decentralized center: In addition to the above two types, twenty-eight decentralized centers were identified.
A location quotient (LQ) is adopted for analyzing the functional characteristics of employment centers. Location entropy is also referred to as the production concentration index or specialization rate, and the formula to derive it is as follows:
where is the location entropy of i industry in j center of Hangzhou, is the employment population of i industry in j center, is the employment population of all industries in j center, is the employment population of i industry in Hangzhou, and q is the employment population of all industries in Hangzhou.
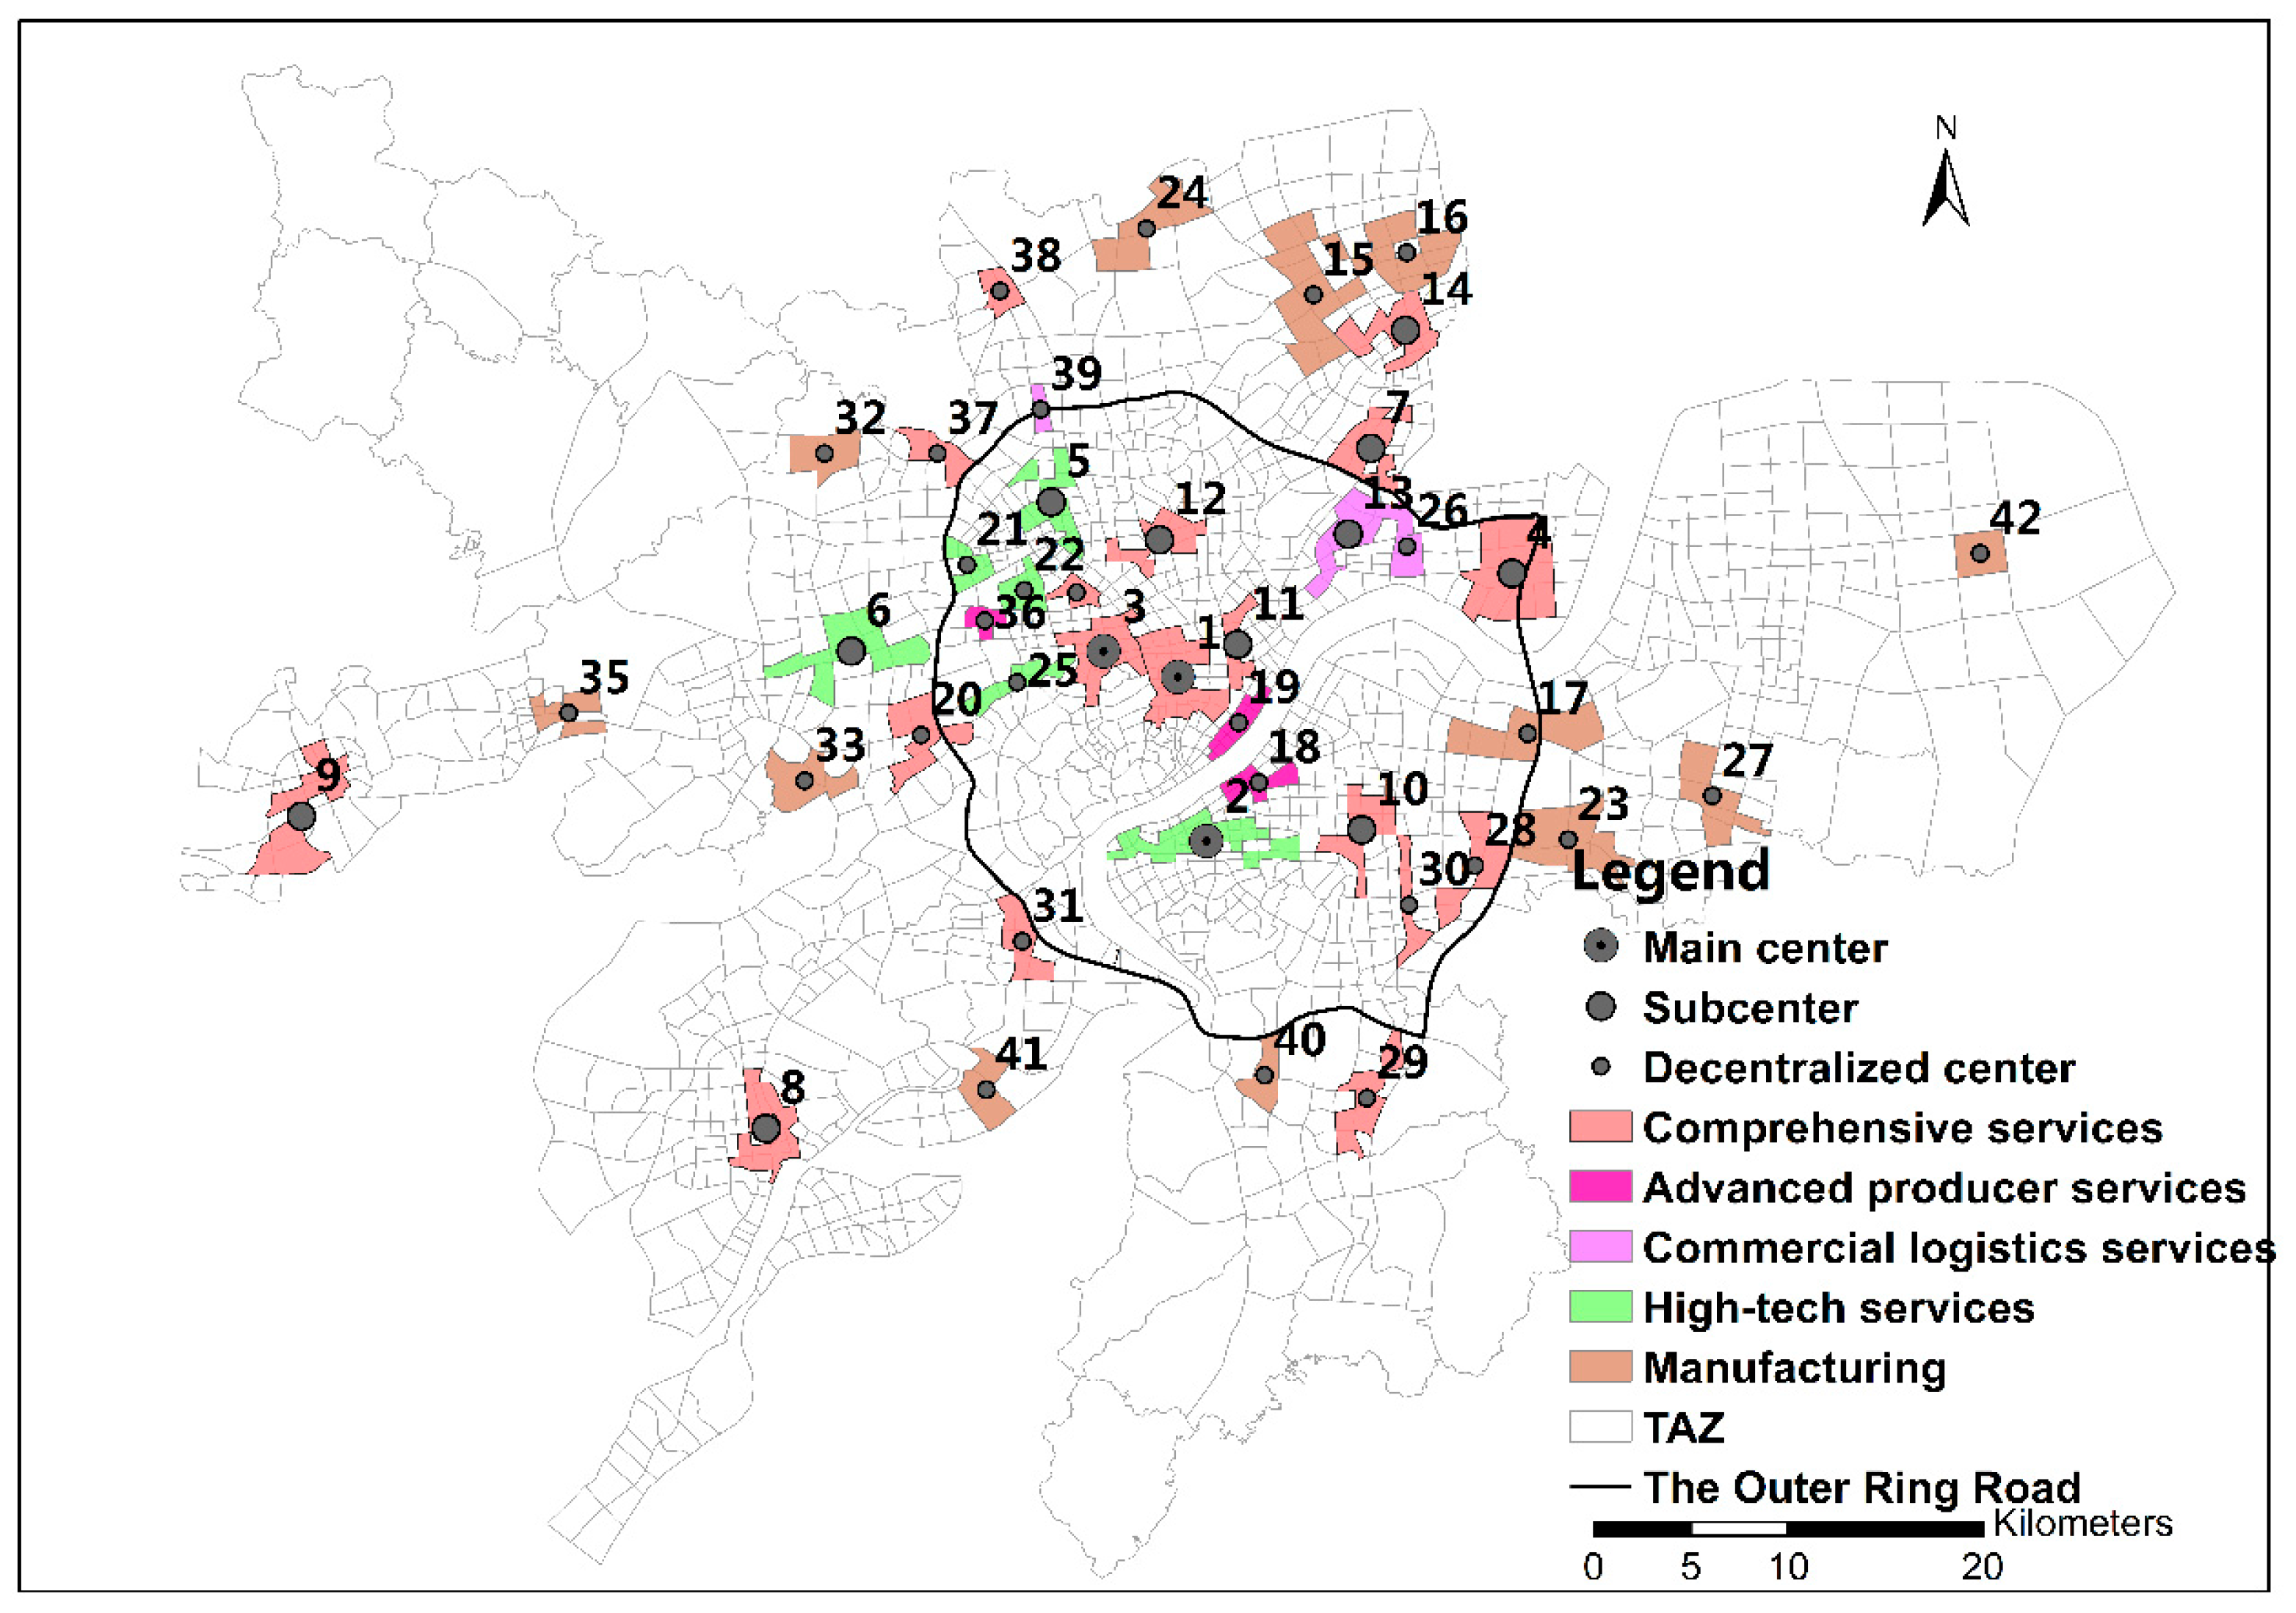
LQ is an important indicator of industrial agglomeration, if the LQ of a certain industry in an employment center is greater than 1, the center is considered to be specialized in the industry, it gives an approach for analyzing which sectors have the greatest propensity to agglomerate in employment centers. Anas et al. [36] believed that urban structure change that is associated with qualitative and/or quantitative changes in agglomeration economic functions, the decentralization of high-order service activities, offices, industries, etc., away from central city lead to the change of metropolitan structure, and there are two aspects of the change, which are ‘scatteration’ and ‘polycentricity’, the former is the process that employment is dispersed generally across the metropolitan area that the role of agglomeration economies is in decline, whereas the latter, including one or more professional economic nodes other than the CBD [37]. According to the LQ of various industries in the Hangzhou employment center (Appendix A Table A1), the employment centers form certain professional economic nodes—for example, the high-tech LQ in the Future Science and Technology City (FTC) is 5.9 and the advanced producer service LQ in Qianjiang New Town(NT) is 2.6—which have significant multi-center agglomeration economic characteristics, the result shows that Hangzhou is more inclined to polycentric spatial structure. Subsequently, the functions of employment centers are classified based on the LQ of various industries; among these, the comprehensive services employment center has an LQ of public services or life services greater than 1 and it has at least two types of professional industry agglomeration; the advanced producer services, commercial logistics services, high-tech services, and manufacturing employment centers are those in which the LQ of each industry is significantly greater than 1. As seen from Figure 2, most employment centers in Hangzhou are comprehensive services and manufacturing centers. Moreover, the trend of manufacturing suburbanization agglomeration is stronger than that of comprehensive services; most advanced producer services, commercial logistics, and high-tech employment centers are located inside the Outer Ring Road, while only a small number reflect the trend of suburbanization agglomeration. This finding is different from the suburban economic agglomeration of North America, where consumer services, manufacturing, and back-end office centers reflect developed suburbanization trends [37]. However, other functions are not significant, except for the obvious suburbanization of manufacturing in Hangzhou; the traditional urban center still has strong economic agglomeration capacity, attracting high-end consumption, services, business, and office functions.
3.1.2. Jobs-Housing Matching Features of Employment Centers
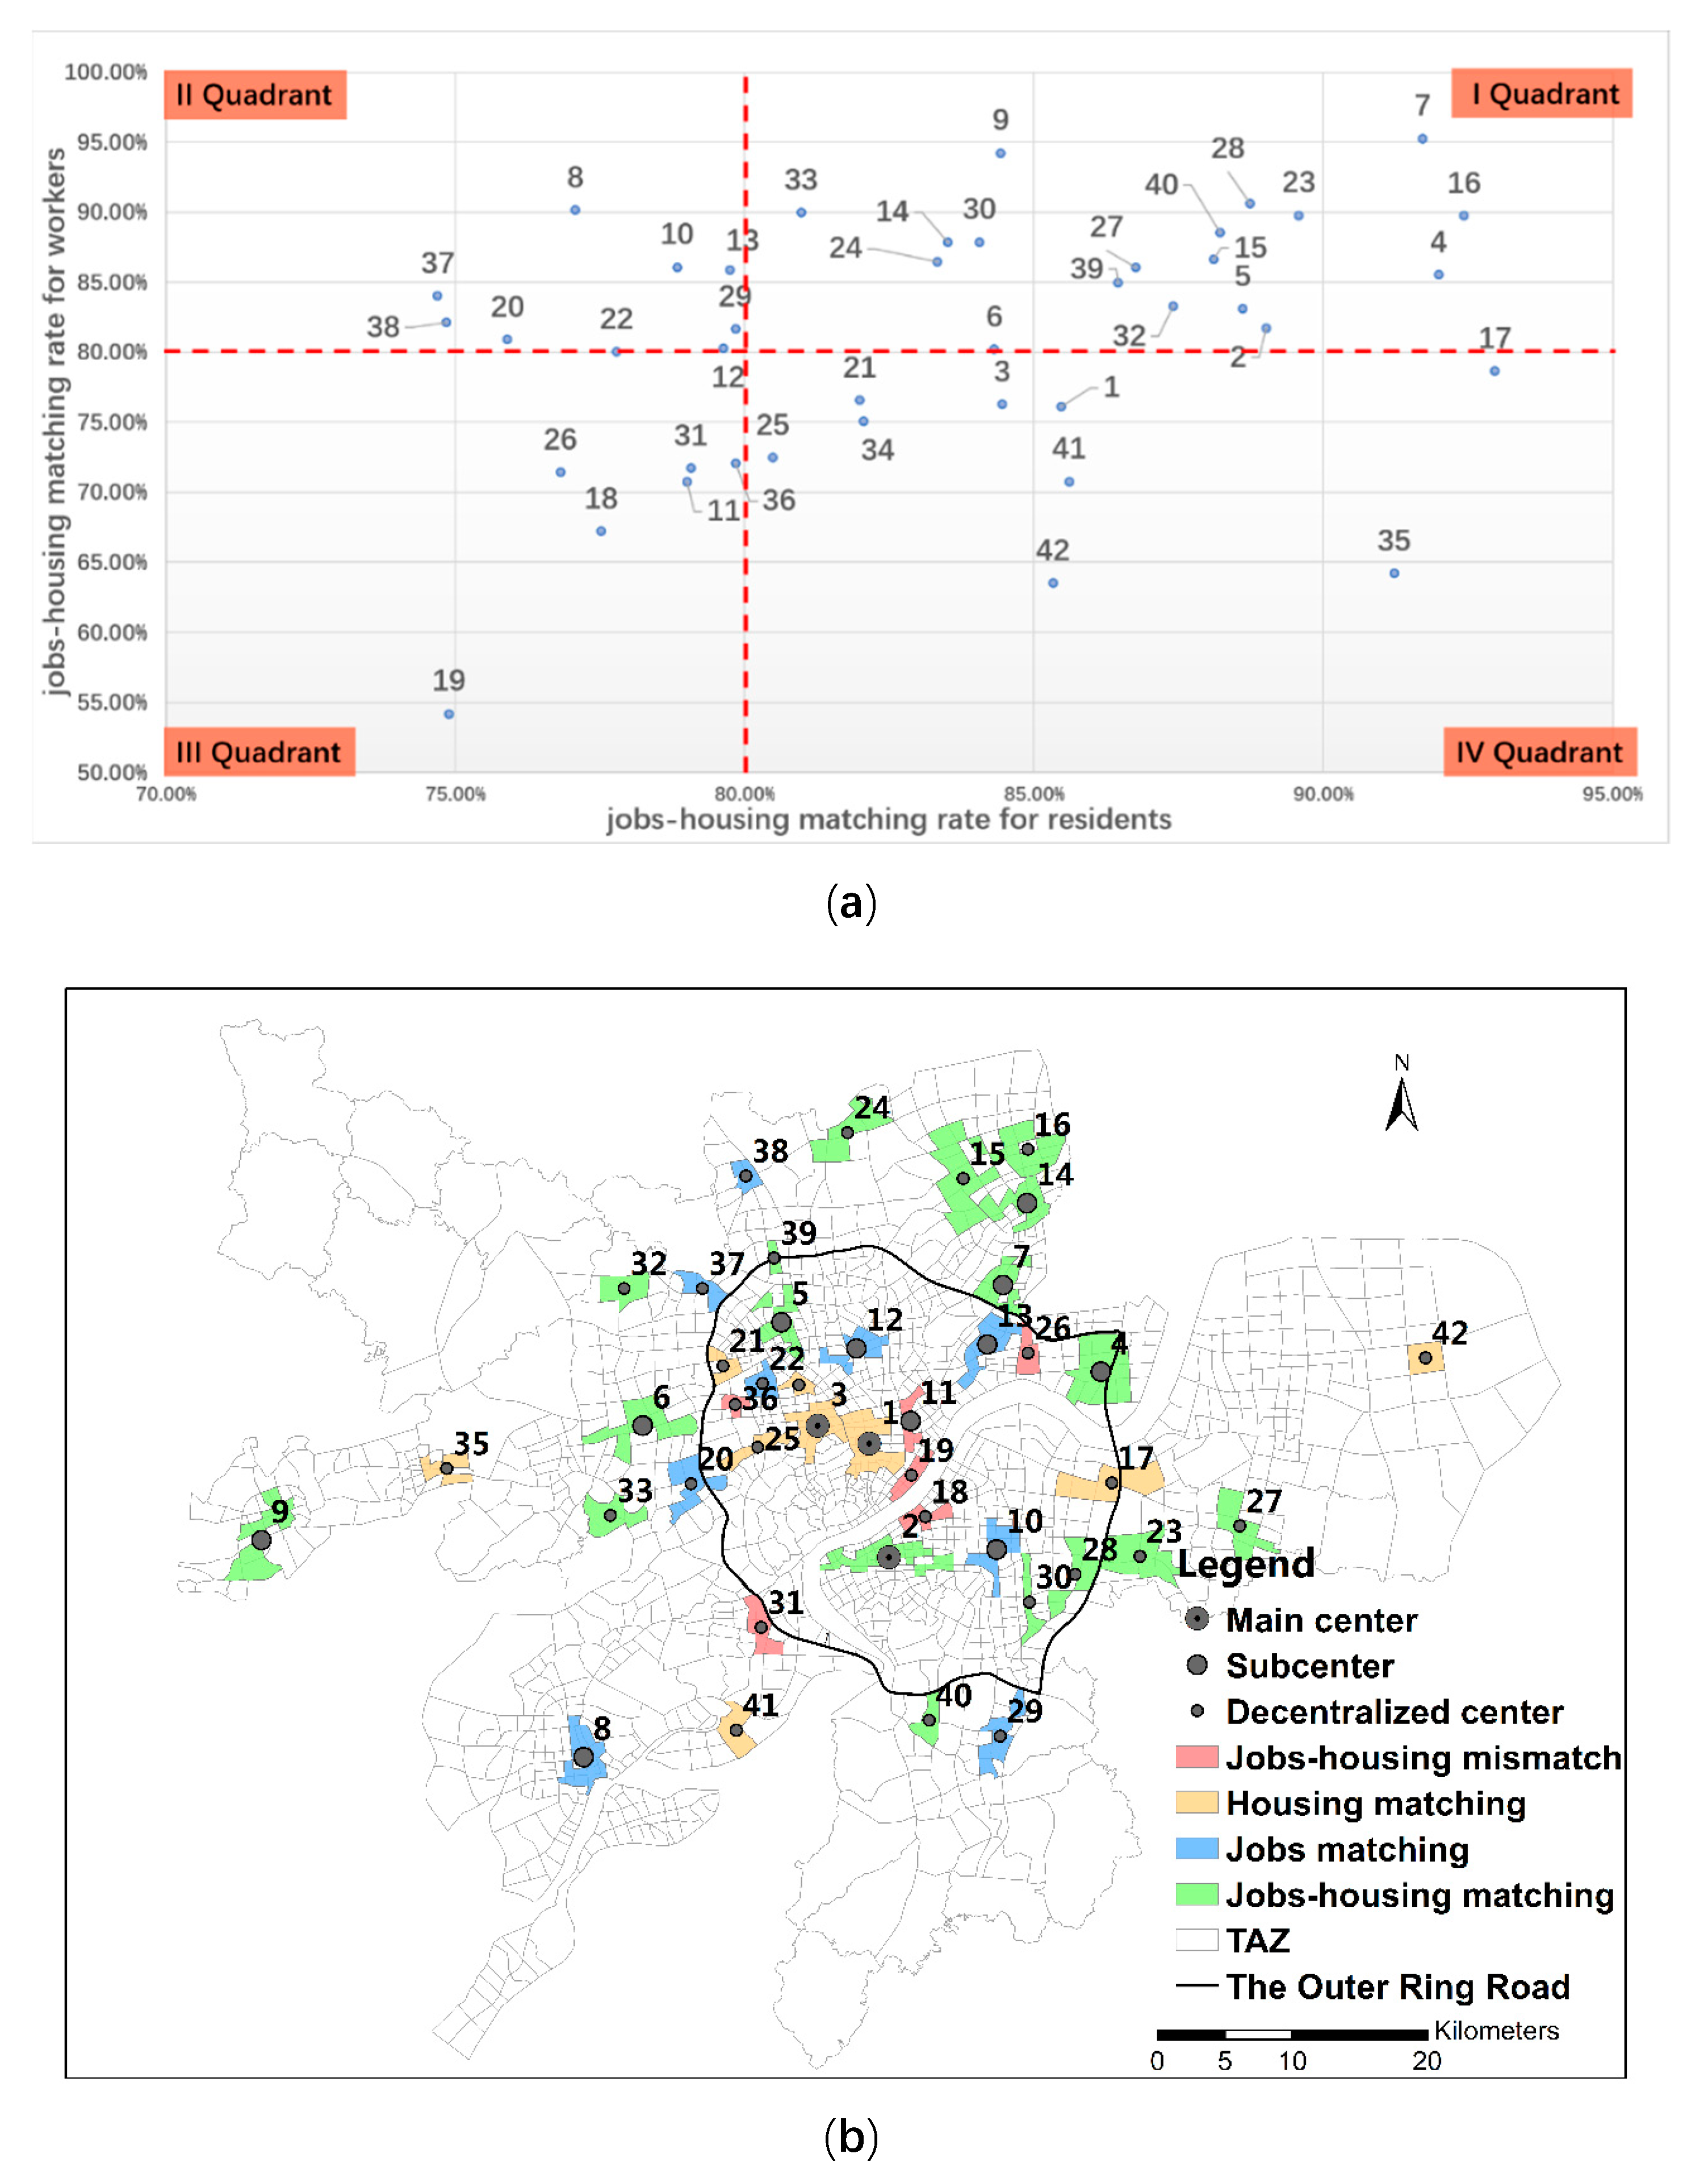
Figure 3a shows that the jobs-housing matching rate for all employment centers is above 50%, which indicates that more than 50% of workers and residents in all employment centers commute within the average commuting radius. Among them, the lowest jobs-housing matching rate for residents is 74.7%, whereas the lowest jobs-housing matching rate for workers is 54.19%; thus, the jobs-housing matching rate of residents is better than that of the workers. Taking the average jobs-housing matching rate for workers and residents as the standard criteria with which to divide jobs-housing matching, as shown in Figure 3a, the data are divided into four quadrants with the abscissa 0.8 and the ordinate 0.8 as the standard criteria. Each quadrant represents different kinds of jobs-housing matching: the I quadrant for centers where both employment and residence match, eighteen in total, accounting for 45%; the II quadrant for centers with employment matching, but, residence mismatch, nine in total; the III quadrant for centers where both employment and residence mismatch, six in total; the IV quadrant for centers with residence matching, but, employment mismatch, nine in total. As demonstrated, 45% of employment centers have good jobs-housing matching and 64.29% of employment centers have either housing or jobs matching. This result indicates that those centers in Hangzhou have formed residential- and employment-balanced communities, which essentially confirms the "co-location hypothesis”. However, 14.29% of employment centers still have both employment and residence mismatching, which means that the polycentric structure does not guarantee the jobs-housing matching of all centers.
Figure 3b shows that most jobs-housing matching centers are located outside the Outer Ring Road, while centers with residential mismatching, employment mismatching, and both residential and employment mismatching are mostly inside the Outer Ring Road. Table 1 also shows that the average jobs-housing matching rate of residents and workers inside the Outer Ring Road is lower than that outside the Outer Ring Road, which indicates that the development of polycentric structure in the suburbs of Hangzhou is conducive to alleviating the jobs-housing mismatch in central urban areas. Table 1 shows that the classification level of employment centers has a certain impact on the jobs-housing matching rate: as the classification level of the center decreases, the residents’ jobs-housing matching rate also decreases, as the workers tend to live in medium sized centers, and the centers with strong or weak employment attraction are not conducive to the workers’ choosing residence nearby. In addition, the employment center’s industry type is also an important factor that affects the jobs-housing matching rate: the advanced producer services center has the worst jobs-housing matching rate for both residents and workers, the comprehensive services center has the best workers’ jobs-housing matching rate, and the manufacturing center has the best residents’ jobs-housing matching rate. These results indicate that it is more difficult for workers/residents to live near advanced producer services centers. Nonetheless, there are some centers with similar functions, but different jobs-housing matching rates, such as the manufacturing centers Center 16 as compared to Center 42, Center 6 compared to Center 21, which reflect opposite jobs-housing matching characteristics, which indicates that the factors affecting employment centers’ jobs-housing matching rates are complex and non-single factors offer the best explanation.
3.2. The Spatial and Industrial Influencing Factors on Employment Centers’ Jobs-Housing Matching
3.2.1. Correlation Analysis: The Relationship between Jobs-Housing Matching Rate and Spatial and Industrial Factors
The spatial factors are divided into polycentric structural factors, built environment factors, and natural environment factors: the structural factors include the size of employment centers, distance from CBD; the built environment factors includes resident/employment population density, employment to resident ratio, land-use mixing, subway accessibility, freeway intersections accessibility; and, the natural environment factors includes large natural barriers. Industrial factors include industrial agglomeration, diversification, and specialization factors. Table 2 shows all factors.
Correlation analysis (Table 3) shows that the spatial factors exert certain effects on the jobs-housing matching rate. First, the larger the employment center is, the higher the workers’ and residents’ jobs-housing matching rates, as smaller centers may not achieve the minimum scale of economy, which leads to a lack of facilities, as residents have to travel farther to find work, and the workers are reluctant to live in these small centers, as there are fewer housing options. Second, the centers with higher employment population density and E/R will have a lower workers’ jobs-housing matching rate, centers with abundant job attract workers living outside the center, which leads to a shortage of housing; however, employment population density and E/R have no significant impact on residents’ jobs-housing matching rate. Third, the closer to the CBD the center is, the higher the workers’ and residents’ jobs-housing matching rate, and the farther the center is from natural barriers, the lower the workers’ and residents’ jobs-housing matching rate, which indicates that the closer the employment center is to the downtown area, the more likely it is that people will work and live nearby, whereas natural barriers reduce the accessibility of employment centers for residents and workers. Subway accessibility only has a negative effect on workers, the subway lengthens employees’ commuting distance, which allows them to live in more distant areas. In addition, residential population density, land-use mix, and accessibility of freeway intersections exert no significant impact on either workers’ or residents’ jobs-housing matching rate, which indicates that these factors are not necessarily conducive to the proximity of work and residence.
Table 3 also shows that industrial factors exert a certain effect on the jobs-housing matching rate. The higher the LQ of the advanced producer services is, the lower the workers’ jobs-housing matching rate, whereas manufacturing demonstrates the opposite result; the higher the LQ of advanced producer services, public services, life services, commercial logistics, and manufacturing is, the lower the residents’ jobs-housing matching rate. These results indicate that employment centers with different functions lead to different jobs-housing matching rate, except for high-tech industries, the degree of industrial agglomeration has a more significant impact on residents than workers, so that residents in higher single-industry agglomeration centers do not tend to find jobs nearby. In contrast, it is difficult for workers in centers with a higher agglomeration of advanced producer services to live near their workplace, and workers in centers with a higher agglomeration of manufacturing are more likely to live near their workplace. Other types of industries exert no significant impact. The level of industrial diversification has no influence on workers, but it has a significant negative influence on residents, which indicates that employment centers with various industrial types are not conducive to residents living nearby. The level of industry specialization has a significant negative influence on workers and residents, which indicates that employment centers with a single industry type reduce the proximity of living and working spaces.
3.2.2. Regression Analysis: Determinant Factors on Jobs-Housing Matching Rate in Employment Centers
A stepwise regression model was used to determine the influence of each variable on the dependent variable and to control the influence of other variables and the comprehensive influence of all independent variables. The dependent variables are the workers’ and residents’ jobs-housing matching rates, respectively, and the independent variables are the spatial and industrial factors that have significant correlation with the dependent variables. This study does not consider social economic attributes variables, including housing characteristics, family characteristics, job attributes, and so on, as the main purpose of this study is to discover to what extent spatial and industrial factors affect jobs-housing matching.
The stepwise multiple regression model carries out multiple linear tests on independent variables; if there is multiple linearity between independent variables, it will be eliminated. Three models were built for stepwise multiple regression analysis of spatial, industrial, and combination factors. As shown by the adjusted R squared in Table 4 and Table 5, the spatial factors have a more significant impact on jobs-housing matching than industrial factors, and with the combination of the two factors, the model’s degree of fit is better, which indicates that the factors that affect employment centers’ jobs-housing matching rates are complex; and, the combination of multiple factors can better explain the proximity of working and residential spaces.
As shown in Table 4, model 1 confirms the positive correlation between the size of the employment center and the workers’ jobs-housing matching rate, and the E/R and subway accessibility have negative correlations. Model 2 confirms the negative correlation between the level of industrial specialization and the workers’ jobs-housing matching rate. Model 3 considered the factors of model 1 and model 2, and it improved explanatory powers with the R-squares to 53.3%, the size of employment, E/R, and industrial specialization are consistently significant in all model specifications: as expected, the distance of workers from their place of residence becomes further as the size of employment centers decreases, as controlling for the other variables, the area of employment center increases 1 unit, the workers’ jobs-housing matching is expected to rise by 0.286 unit; the higher the E/R, workers are more likely to travel father from their place of residence, as controlling for the other variables, the E/R increases 1 unit, the workers’ jobs-housing matching rate will be reduced by 0.421 unit; the more specialized the employment center is, the more difficult it is for workers to choose a suitable place to live near the place of residence, which indicates that the heterogeneity of employment opportunities is more important in explaining the workers’ housing selection decision, as controlling for the other variables, the industrial specialization index increases 1 unit, the workers’ jobs-housing matching rate will be reduced by 0.379 units. However, there are some factors that had significant influence in the correlation analysis but were not included in these models, such as the employment density, distance from CBD, natural barriers, and industrial agglomeration factors, which indicates that they are not determinant factors of workers’ jobs-housing matching.
As shown in Table 5, model 4 confirms the positive correlation between employment center size, natural barriers, and the residents’ jobs-housing matching rate. Model 5 confirms the negative correlation between employment centers’ level of industrial diversification and the residents’ jobs-housing matching rate. Model 6, which considers the factors of model 4 and model 5, and improving explanatory powers with the R-squares to 55.8% and the size of employment center, natural barriers and industrial diversification factors are consistently significant in all model specifications: as expected, the distance of residents from their workplace becomes father as the size of employment centers decreases, as controlling for the other variables, the area of employment center increases 1 unit, the residents’ jobs-housing matching is expected to rise by 0.455 unit; the father the employment center from the natural barriers, the easier for the residents are likely to work nearby, as controlling for the other variables, distance between employment center and natural barriers increases 1 unit, the residents’ jobs-housing matching rate will increase by 0.302 unit; the higher the level of industrial diversification is, the more difficult it is for residents to choose a suitable place to live near the workplace, as controlling for the other variables, the industrial diversification index increases by 1 unit, the residents’ jobs-housing matching rate will be reduced by 0.390 units. However, there are some factors that had significant influence in the correlation analysis were not included in these models, such as distance from CBD, industrial agglomeration factors, and industrial specialization factors, which indicated that they are not determinant factors of residents’ jobs-housing matching.
4. Conclusions
This study examines the effect of sustainable urban spatial structure on jobs-housing matching from three aspects. Firstly, cellphone signaling data were used to empirically test the spatial structure characteristics of Hangzhou, which identified 42 employment centers with obvious rank-size rules, indicating that Hangzhou has significant characteristics of a polycentric structure. Additionally, from the LQ analysis of employment centers, the study showed that Hangzhou has significant characteristics of polycentric economic agglomeration: most of the employment centers’ functions are comprehensive services and manufacturing, and the suburban agglomeration is different from most of North America; the Hangzhou traditional city center still has strong economic agglomeration capacity, while the latter is opposite.
Secondly, the study uses cellphone signaling data to analyze the jobs-housing matching characteristics of polycentric Hangzhou; it found that nearly half of the employment centers have a good matching performance, which essentially confirms the "co-location hypothesis", which showed that a polycentric urban structure can make residence and workplace locate nearby. However, there are 14.29% of employment centers that do not achieve jobs-housing matching, which indicates that the polycentric structure does not guarantee jobs-housing matching of all the employment centers in Hangzhou, "co-location hypothesis" failed in some employment centers. Additionally, we found that different level, location, and function of employment centers may explain why some employment centers do not fit the "co-location hypothesis", that is, the central rank decreased the residents’ jobs-housing matching rate declined, workers tend to concentrate in medium sized centers, and the suburb employment centers have good jobs-housing matching than the central urban centers, which confirms the results of Zhao et al. [14] in Beijing; the advanced producer services agglomeration employment centers tend to have the worst jobs-housing matching rate, while workers in comprehensive services centers and residents in manufacturing centers tend to have the best jobs-housing matching rate.
Finally, besides being characteristic of the polycentric structure that influences the jobs-housing matching of Hangzhou, the study paid attention on the particular built environment and industrial agglomeration factors as important influences. The correlation and regression analysis results showed that the polycentric development is conducive to workers’ and residents’ jobs-housing matching, the larger the employment center is, and the farther the distance from the CBD is, the better the jobs-housing matching is, which is opposite from Sultana [7], as found in Atlanta. The correlation analysis of built environment factors showed that the employment population density, E/R, and subway accessibility have negative impact on workers’ jobs-housing matching rate, and,, in the regression analysis, only the E/R entered the determinants, which means the higher, the E/R the worse the workers’ jobs-housing matching, which is similar to Sultana [7] found in Atlanta. Otherwise, we found that the land-use mixing has no influence on workers’ jobs-housing matching, which is opposite from the result of Travisi and Camagni [23]. Additionally, the study found that the built environment has no influence on residents’ jobs-housing matching, while, besides high-tech services, other industrial factors have a strong effect on residents’ jobs-housing matching, which means that industrial factors can affect the residents’ employment choice more than the built environment. The correlation analysis of industrial factors showed that, besides advanced producer services and manufacturing, other industrial agglomeration factors have little effect on workers’ jobs-housing matching rate, and the regression analysis showed that only the industrial specialization factor is the determinant of workers’ jobs-housing matching, which indicates that the heterogeneity of employment opportunities is more important in explaining the workers’ housing selection decision.
The case study of Hangzhou showed that, after 40 years of rapid urban development, the urban spatial structure is becoming polycentric instead of monocentric, and this transformation is conducive to the jobs-housing matching, which is in line with the "co-location hypothesis". Therefore, the polycentric development policy is beneficial to the sustainable development of Hangzhou in the future. The analysis of built environment factors showed that land use and infrastructure accessibility have little effect on jobs-housing matching, while density and construction intensity (E/R) have great influence, which provides a guiding direction for land use policy, which might focus on balanced, integrated, and diversified development of employment centers. The analysis of industrial factors showed that the employment center with a strong specialization economy is not conducive to the jobs-housing matching, while the diversified employment center is beneficial. Therefore, emphasis should be placed on the comprehensive development of employment centers, and the introduction of related supporting industries, so as to promote the diversification of job opportunities when formulating industrial policies, in addition to emphasizing the role of professional agglomeration economy in forming polycentric structure.
This study found that there are many differences between Chinese cities and Western cities, especially American cities, in terms of polycentric development and jobs-housing matching characteristics. These differences may be caused by the institutional systems between China and the West. The urban development of the western cities is dominated by the free market economy, the co-location hypothesis that people can make ‘rational’ choices of workplace and place of residence according to market rules. Although, since the 1980s, China has experienced housing market reforms, its government-led “up-down” planning behavior still has a greater impact on urban development. For example, urban internal renewal policies have forced some inner city residents to be relocated in the suburbs, and the suburban new industrial space policy has formed some isolated industrial zones, which affected the jobs-housing relationships. Therefore, the Hangzhou case study uses the Western urban research method to reflect the current spatial structure of China's cities and provide strategic guidance for the future development of sustainable urban spatial structure for China.
This study concludes that the influencing factors of the polycentric employment system failed to achieve a good jobs-housing matching in the case of Hangzhou. However, this finding does not mean that the above factors are the key determinants of employment centers’ jobs-housing matching rate. Empirical studies have shown that, in many cases, housing cost, wage level, and family and individual socio-economic attributes, are also important factors that affect workers’ choice of living place in employment areas. However, such factors are not considered in this study, so the research model needs to be further improved in the future.
Author Contributions
J.Z., the leading author, initially conceived and designed the research. She performed data analysis and original draft preparation under the supervision of the corresponding author. X.N., a corresponding author, developed the original idea of this study and provided suggestions for the overall analysis. C.S., provided the original data and done the data curation. All authors contributed to manuscript preparation and discussed the results.
Funding
This research was funded by National Natural Science Foundation of China, grant number 51778432 and 51878457.
Acknowledgments
Parts of this work were presented at the 16th International Conference on Computers in Urban Planning and Urban Management (CUPUM) held at Wuhan University, Wuhan, China,2019.
Conflicts of Interest
The authors declare no conflict of interest.
Appendix A

Table A1.
Industrial agglomeration level of employment centers.
| Employment Centers | Industrial LQ(Greater than 1) |
|---|---|
| Main center | |
| 1 CBD | advanced producer services (LQ:2.22), public services (LQ:1.6), commercial logistics (LQ:1.53), high-tech services (LQ:1.01) |
| 2 Binjiang high-tech | high-tech services (LQ:3.75), manufacturing (LQ:1.15) |
| 3 Huanglong | high-tech services (LQ:2.61), advanced producer services (LQ:1.81), public services (LQ:1.47), commercial logistics (LQ:1.24) |
| Sub-center | |
| 4 Xiasha | manufacturing (LQ:1.52), public services (LQ:1.37) |
| 5 Liangzhu high-tech | high-tech services (LQ:1.5), commercial logistics (LQ:1.4), manufacturing (LQ:1.06) |
| 6 Future Tech-City(FTC) | high-tech services (LQ:5.90) |
| 7 Qiaosi | manufacturing (LQ:1.73), public services (LQ:1.39) |
| 8 Fuyang | life services (LQ:2.08), public services (LQ:1.8), advanced producer services (LQ:1.04) |
| 9 Linan | public services (LQ:2.08), life services (LQ:1.6) |
| 10 Jiangnan | commercial logistics (LQ:1.54), public services (LQ:1.18) |
| 11 East Railway Station(ERS) | life services (LQ:2.45), commercial logistics (LQ:2.25), public services (LQ:1.23) |
| 12 Xintiandi | commercial logistics (LQ:1.98), public services (LQ:1.38), life services (LQ:1.12), high-tech services (LQ:1.11) |
| 13 Jiubao | commercial logistics (LQ:1.48), manufacturing (LQ:1.21), high-tech services (LQ:1.14) |
| 14 Linping | public services (LQ:2.52), advanced producer services (LQ:1.86) |
| Decentralized center | |
| 15 Qianjiang economic development zone(EDZ) | Manufacturing (LQ:1.92) |
| 16 Yuhang EDZ | Manufacturing (LQ:2.06) |
| 17 Xiaoshan EDZ | Manufacturing (LQ:2.35) |
| 18 Binjiang | advanced producer services (LQ:2.49), high-tech services (LQ:1.50), commercial logistics (LQ:1.66) |
| 19 Qianjiang new town(NT) | advanced producer services (LQ:2.63), commercial logistics (LQ:1.75), public services (LQ:1.12) |
| 20 Zhejiang technology university(ZTU) | manufacturing (LQ:1.19), high-tech services (LQ:1.08), public services (LQ:1.06), advanced producer services (LQ:1.01) |
| 21 Western soft park(WSP) | high-tech services (LQ:2.48), manufacturing (LQ:1.30) |
| 22 Zhejiang university(ZU) | high-tech services (LQ:2.54), advanced producer services (LQ:2.05), commercial logistics (1.75) |
| 23 Yaqian | manufacturing (LQ:2.11) |
| 24 Tangqi | manufacturing (LQ:1.82) |
| 25 Xixi science and technology park(STP) | high-tech services (LQ:4.66), life services (LQ:2.45), advanced producer services (LQ:1.58) |
| 26 Jiuqiao | commercial logistics (LQ:2.75), advanced producer services (LQ:1.33) |
| 27 Guali | manufacturing (LQ:1.99) |
| 28 Xinjie technology and industry park(TIP) | manufacturing (LQ:1.86), life services (LQ:1.12) |
| 29 Linpu | manufacturing (LQ:1.74), life services (LQ:1.62) |
| 30 South railway station(SRS) | life services (LQ:3.97), commercial logistics (LQ:1.54) |
| 31 Zhuantang | public services (LQ:1.87), life services (LQ:1.68), high-tech services (LQ:1.44) |
| 32 Pinyao | manufacturing (LQ:2.12) |
| 33 Xianlin | manufacturing (LQ:1.99) |
| 34 Dayuecheng | commercial logistics (LQ:2.20), high-tech services (LQ:1.58), life services (LQ:1.21), advanced producer services (LQ:1.05) |
| 35 Qinshanhu STP | manufacturing (LQ:2.48) |
| 36 Jiangcun | advanced producer services (LQ:2.23), high-tech services (LQ:1.41), public services(LQ:1.21) |
| 37 Liangzhu | manufacturing (LQ:1.64), life services (LQ:1.20) |
| 38 Renhe | public services (LQ:1.79), manufacturing (LQ:1.40), life services (LQ:.03), advanced producer services (LQ:1.03) |
| 39 Liangzhu market | commercial logistics (LQ:2.82), advanced producer services (LQ:1.56) |
| 40 Yiqiao | manufacturing (LQ:2.14) |
| 41 Dongzhou | manufacturing (LQ:2.45) |
| 42 Linjiang | manufacturing (LQ:1.75) |
References
- Giuliano, G.; Redfearn, C.; Agarwal, A.; Li, C.; Zhuang, D. Employment concentrations in Los Angeles, 1980–2000. Environ. Plan. A 2007, 39, 2935–2957. [Google Scholar] [CrossRef]
- Forstall, R.L.; Greene, R.P. Defining job concentrations: The Los Angeles case. Urban Geogr. 1997, 18, 705–739. [Google Scholar] [CrossRef]
- Giuliano, G.; Small, K.A. Subcenters in the Los Angeles region. Reg. Sci. Urban Econ. 1991, 21, 163–182. [Google Scholar] [CrossRef] [Green Version]
- Gordon, P.; Richardson, H.W. Employment decentralization in US metropolitan areas: Is Los Angeles an outlier or the norm? Environ. Plan. A 1996, 28, 1727–1743. [Google Scholar] [CrossRef]
- Cervero, R.; Wu, K.L. Polycentrism, commuting, and residential location in the San Francisco bay area. Environ. Plan. A 1997, 29, 865–886. [Google Scholar] [CrossRef]
- McDonald, J.F.; Pather, P.J. Suburban employment centres: The case of Chicago. Urban Stud. 1994, 31, 201–218. [Google Scholar] [CrossRef]
- Sultana, S. Some effects of employment centers on commuting times in the Atlanta metropolitan area. Southeast. Geogr. 2000, 40, 225–233. [Google Scholar] [CrossRef]
- Shearmur, R.; Coffey, W.; Dube, C.; Barbonne, R. Intrametropolitan employment structure: Polycentricity, scatteration, dispersal and chaos in Toronto, Montreal and Vancouver, 1996–2001. Urban Stud. 2007, 44, 1713–1738. [Google Scholar] [CrossRef]
- Schwanen, T.; Dieleman, F.M.; Dijst, M. Car use in Netherlands daily urban systems: Does polycentrism result in lower commute times? Urban Geogr. 2003, 24, 410–430. [Google Scholar] [CrossRef]
- Veneri, P. Urban polycentricity and the costs of commuting: Evidence from Italian metropolitan areas. Growth Chang. 2010, 41, 403–429. [Google Scholar] [CrossRef]
- Aguilera, A. Growth in commuting distances in French Polycentric Metropolitan Areas: Paris, Lyon and Marseille. Urban Stud. 2005, 42, 1537–1547. [Google Scholar] [CrossRef]
- Alpkokin, P.; Cheung, C.; Black, J.; Hayashi, Y. Dynamics of clustered employment growth and its impacts on commuting patterns in rapidly developing cities. Transp. Res. Part A Policy Pr. 2008, 42, 427–444. [Google Scholar] [CrossRef]
- Parolin, B. Employment centres and the journey to work in Sydney: 1981–2001. In Proceedings of the 2nd State of Australian Cities Conference, Brisbane, Australia, 30 November–2 December 2005; pp. 1–15. [Google Scholar]
- Zhao, P.; Lu, B.; Roo, G.D. The impact of urban growth on commuting patterns in a restructuring city: Evidence from Beijing. Pap. Reg. Sci. 2011, 90, 735–754. [Google Scholar] [CrossRef]
- McMillen, D.P. Employment densities, dpatial autocorrelation, and subcenters in large metropolitan areas. J. Reg. Sci. 2004, 44, 225–244. [Google Scholar] [CrossRef]
- Rauhut, D. Polycentricity—one concept or many? Eur. Plan. Stud. 2017, 25, 332–348. [Google Scholar] [CrossRef]
- Cervero, R. Jobs-housing balancing and regional mobility. J. Am. Plan. Assoc. 1989, 55, 136–150. [Google Scholar] [CrossRef]
- Gordon, P.; Richardson, H.W.; Jun, M.J. The commuting paradox evidence from the top twenty. J. Am. Plan. Assoc. 1991, 57, 416–420. [Google Scholar] [CrossRef]
- Sultana, S.; Weber, J. Journey-to-work patterns in the age of sprawl: Evidence from two midsize southern metropolitan areas. Prof. Geogr. 2007, 59, 193–208. [Google Scholar] [CrossRef]
- Wang, F.H. Modeling commuting patterns in Chicago, in a GIS environment: A job accessibility perspective. Prof. Geogr. 2000, 52, 120–133. [Google Scholar] [CrossRef]
- Ewing, R.; Cervero, R. Travel and the built environment: A meta-analysis. J. Am. Plan. Assoc. 2010, 76, 265–294. [Google Scholar] [CrossRef]
- Yang, J.; French, S.; Holt, J.; Zhang, X. Measuring the structure of U.S. metropolitan areas, 1970–2000 spatial statistical metrics and an application to commuting behavior. J. Am. Plan. Assoc. 2012, 78, 197–209. [Google Scholar] [CrossRef]
- Travisi, C.M.; Camagni, R. Sustainability of urban sprawl: Environmental-economic indicators for the analysis of mobility impact in Italy. SSRN Electron. J. 2015. [Google Scholar] [CrossRef]
- Crane, R.; Chatman, D.G. Traffic and sprawl: Evidence from U.S. commuting, 1985 to 1997. Plan. Mark. 2003, 6, 14–22. [Google Scholar]
- Lee, S.; Seo, J.G.; Webster, C. The decentralising metropolis: Economic diversity and commuting in the US suburbs. Urban Stud. 2006, 43, 2525–2549. [Google Scholar] [CrossRef]
- Hu, L.; Giuliano, G. Beyond the inner city new form of spatial mismatch. Transp. Res. Rec. 2011, 2242, 98–105. [Google Scholar] [CrossRef]
- Schwanen, T.; Dieleman, F.M.; Dijst, M. Travel behavior in Dutch monocentric and polycentric urban systems. J. Transp. Geogr. 2001, 9, 173–186. [Google Scholar] [CrossRef]
- Zhao, P.; Lu, B.; Roo, G.D. Impact of the jobs–housing balance on urban commuting in Beijing in the transformation era. J. Transp. Geogr. 2011, 19, 59–69. [Google Scholar] [CrossRef]
- Hu, L.; Sun, T.; Wang, L. Evolving urban spatial structure and commuting patterns: A case study of Beijing, China. Transp. Res. Part D Transp. Environ. 2018, 59, 11–22. [Google Scholar] [CrossRef]
- Wang, D.; Chai, Y. The jobs–housing relationship and commuting in Beijing, China: The legacy of Danwei. J. Transp. Geogr. 2009, 17, 30–38. [Google Scholar] [CrossRef]
- Lin, D.; Allan, A.; Cui, J. Sub-centres, socio-economic characteristics and commuting: A case study and its implications. Int. J. Urban Sci. 2017, 21, 147–171. [Google Scholar] [CrossRef]
- Zhou, J.X.; Yeh, A.G.; Li, W.; Yue, Y. A commuting spectrum analysis of the jobs–housing balance and self-containment of employment with mobile phone location big data. Environ. Plan. B Urban Anal. City Sci. 2018, 45, 434–451. [Google Scholar] [CrossRef]
- Muñiz, I.; Garcia-López, M.A.; Galindo, A. The effect of employment subcenters on population density in Barcelona. Urban Stud. 2008, 45, 627–649. [Google Scholar] [CrossRef]
- Ewing, R. Best Development Practices: Doing the Right Thing and Making Money at the Same Time; American Planning Association: Chicago, IL, USA, 1996. [Google Scholar]
- Peng, Z.R. The jobs-housing balance and urban commuting. Urban Stud. 1997, 34, 1215–1235. [Google Scholar] [CrossRef]
- Anas, A.; Arnott, R.; Small, K.A. Urban spatial structure. J. Econ. Lit. 1998, 36, 1426–1464. [Google Scholar]
- Coffey, W.J.; Shearmur, R.G. Agglomeration and dispersion of high-order service employment in the Montreal metropolitan region, 1981–96. Urban Stud. 2002, 39, 359–378. [Google Scholar] [CrossRef]
Figure 1.
The jobs-housing matching index calculation rules for employment centers based on commuting flow.
Figure 1.
The jobs-housing matching index calculation rules for employment centers based on commuting flow.

Figure 2.
Employment center characteristics (for center names see Table A1 of Appendix A).
Figure 2.
Employment center characteristics (for center names see Table A1 of Appendix A).

Figure 3.
(a) Jobs-housing matching quadrant distribution; and, (b) Jobs-housing matching distribution feature
Figure 3.
(a) Jobs-housing matching quadrant distribution; and, (b) Jobs-housing matching distribution feature

Table 1.
Jobs-housing matching characteristics of employment centers in Hangzhou.
| Employment Center Classification | Residents’ Average Jobs-Housing Matching Rate | Workers’ Average Jobs-Housing Matching Rate | |
|---|---|---|---|
| Level | Main center Sub-center Decentralized center | 86.31% 83.45% 83.15% | 78.04% 84.50% 79.48% |
| Function | Comprehensive services Advanced producer services Commercial logistics services High-tech services Manufacturing | 81.39% 77.42% 81.01% 83.70% 87.66% | 82.42% 64.51% 80.75% 79.02% 81.47% |
| Location | Inside the Outer Ring Road Outside the Outer Ring Road | 82.70% 84.13% | 77.60% 83.27% |
Table 2.
Variable description.
| Variable Name | Variable Expression | Variable Description |
|---|---|---|
| The size of employment centers | Area of employment center(km2) | |
| Resident population density | Residential population identified by cellphone/employment center area (person/km2) | |
| Employment population density | Employment population identified by cellphone/employment center area (person/km2) | |
| Employment to resident ratio | E/R | Employment population/residential population |
| Land use mix | ENT= , represents 4 types of land-use in the employment center buffer zone, including resident, public administration and public service, commercial service and industry. represents the area proportion of land-use type . | |
| Distance from CBD | The logarithm of the distance between the employment center and the CBD | |
| Subway accessibility | Area within 1km of subway station/employment center buffer zone area | |
| Freeway intersection accessibility | Distance from the employment center to the nearest freeway intersection (m) | |
| Large natural barriers | Distance between employment center and large natural barriers (m) | |
| Industry agglomeration index | LQ of advanced producer services | |
| LQ of high-tech services | ||
| LQ of public services | ||
| LQ of life services | ||
| LQ of commercial logistics | ||
| LQ of manufacturing | ||
| Industrial diversification index | EI =, represents the employment proportion of 6 types of industry in employment center | |
| HHI = , represents the employment population of industry j in center I, represents the total employment population of 6 types of industry in center i. | ||
| Industrial specialization index | Spei | Spei ==, is the j industrial location entropy of I center, j includes 15 industries divided from 6 main industry categories |
Table 3.
Pearson correlation analysis of variables and dependent variables.
| Variables | Pearson Correlation Coefficients | |
|---|---|---|
| Workers’ Jobs-Housing Matching Rate (p Value) | Residents’ Jobs-Housing Matching Rate (p Value) | |
| (0.004) | (0.000) | |
| 0.189 (0.229) | −204 (0.194) | |
| (0.045) | −178 (0.261) | |
| E/R | (0.000) | 0.095 (0.549) |
| 0.105 (0.508) | −213 (0.175) | |
| (0.004) | (0.020) | |
| (0.044) | −0.223 (0.157) | |
| −117 (0.460) | −105 (0.506) | |
| (0.046) | (0.007) | |
| (0.003) | (0.000) | |
| −218 (0.166) | −127 (0.423) | |
| −149 (0.345) | (0.028) | |
| −058 (0.716) | (0.020) | |
| (0.062) | (0.008) | |
| (0.028) | (0.000) | |
| −026 (0.871) | (0.000) | |
| −048 (0.763) | (0.000) | |
| Spei | (0.000) | (0.019) |
| N | 42 | 42 |
Note: ***, **, * indicate correlation significance levels of 0.01, 0.05, and 0.1, respectively (double-tailed).
Table 4.
Multiple regression analysis of workers’ jobs-housing matching rate.
| Variables | Model 1 | Model 2 | Model 3 | |||
|---|---|---|---|---|---|---|
| B (p Value) | Beta | B (p Value) | Beta | B (p Value) | Beta | |
| Constant | (0.000) | (0.000) | (0.000) | |||
(0.009) | 0.327 | (0.015) | 0.286 | |||
| E/R | (0.000) | −0.498 | (0.001) | −0.421 | ||
(0.022) | −0.277 | |||||
| Spei | (0.000) | −0.537 | (0.002) | −0.379 | ||
| Ajusted R2 | 0.472 | 0.271 | 0.533 | |||
| Sample size | 42 | 42 | 42 | |||
Note: **, * represent 1% and 5% significance levels, respectively.
Table 5.
Multiple regression analysis of residents’ jobs-housing matching rate.
| Variables | Model 4 | Model 5 | Model 6 | |||
|---|---|---|---|---|---|---|
| B (p Value) | Beta | B (p Value) | Beta | B (p Value) | Beta | |
| Constant | (0.000) | (0.000) | (0.000) | |||
(0.000) | 0.536 | (0.000) | 0.455 | |||
(0.000) | 0.452 | (0.012) | 0.302 | |||
(0.000) | -0.575 | (0.002) | -0.390 | |||
| Spei | ||||||
| Ajusted R2 | 0.440 | 0.314 | 0.558 | |||
| Sample size | 42 | 42 | 42 | |||
Note: **, * represent 1% and 5% significance levels, respectively.
© 2019 by the authors. Licensee MDPI, Basel, Switzerland. This article is an open access article distributed under the terms and conditions of the Creative Commons Attribution (CC BY) license (http://creativecommons.org/licenses/by/4.0/).
Share and Cite
MDPI and ACS Style
Zhu, J.; Niu, X.; Shi, C. The Influencing Factors of a Polycentric Employment System on Jobs-Housing Matching—A Case Study of Hangzhou, China. Sustainability 2019, 11, 5752. https://0-doi-org.brum.beds.ac.uk/10.3390/su11205752
AMA Style
Zhu J, Niu X, Shi C. The Influencing Factors of a Polycentric Employment System on Jobs-Housing Matching—A Case Study of Hangzhou, China. Sustainability. 2019; 11(20):5752. https://0-doi-org.brum.beds.ac.uk/10.3390/su11205752
Chicago/Turabian StyleZhu, Juan, Xinyi Niu, and Cheng Shi. 2019. "The Influencing Factors of a Polycentric Employment System on Jobs-Housing Matching—A Case Study of Hangzhou, China" Sustainability 11, no. 20: 5752. https://0-doi-org.brum.beds.ac.uk/10.3390/su11205752
Note that from the first issue of 2016, this journal uses article numbers instead of page numbers. See further details here.