Financial Support and University Performance in Korean Universities: A Panel Data Approach

1
Department of Social Welfare, Won-Kwang Health Science University, Iksan, Jeollabuk 54538, Korea
2
Department of General Affairs, Korea National University of Welfare, Pyeongtaek, Gyeonggi 17738, Korea
*
Author to whom correspondence should be addressed.
Sustainability 2019, 11(20), 5871; https://0-doi-org.brum.beds.ac.uk/10.3390/su11205871
Submission received: 30 August 2019
/
Revised: 9 October 2019
/
Accepted: 18 October 2019
/
Published: 22 October 2019
Abstract
:This study analyzes the relationship between governmental financial support and university performance to determine whether the former enhances the latter or if universities enhance performance to attain government financial support. The types of financial support to universities considered in this study include those from central and local governments. University performance is defined in terms of the job-finding rates of students, number of publications in South Korean academic journals per full-time faculty member, and number of publications in SCI journals per full-time faculty member. This study uses financial support data of 148 universities from 2009 to 2017. To investigate the relationship between university financial support and performance, we use panel Granger causality testing and panel vector auto-regressive modeling. The results show that both central and local governmental financial support have an endogenous association with students’ job-finding rates. However, local governmental financial support and research performance show a reverse causality association.
1. Introduction
The prevalence of the view that higher education competitiveness is a major determinant of national competitiveness has led to diverse efforts toward strengthening university competitiveness [1]. In South Korea (henceforth, Korea), governmental financial support for universities was implemented in the early 1990s with the aim of improving their qualitative excellence, and funding was increased around 2010. While there has been continued expansion of governmental financial support for universities, their demand for this type of support is on the rise [2]. This is because Korea’s financial support is lower than the average for the Organisation of Economic Co-operation and Development (OECD) countries [3]. Korea stands out as spending the largest percentage of GDP on tertiary educational institutions, but this is partly driven by having the highest share of private expenditure [3]. To increase governmental financial support, it is thus necessary to analyze the effects of such financial support.
Traditionally, governmental support for universities has been justified as producing a public good [4]. A government invests in higher education to help enhance productivity and economic growth, and contribute to social development. To attain these goals, more financial support should be offered to universities that perform as expected [5], where performance management is the guide for decision making for both the government and universities [6]. Performance management and indicators allow the government to analyze the effects of financial support and the results can be used for budget allocations [7]. These mechanisms are also used by universities to monitor performance and apply and maintain their main strategies [4]. In short, an analysis of governmental financial support for universities is crucial for assessing the soundness, efficiency, and sustainability of governmental financial management, as well as for ensuring accountability on the part of universities [5]. In this context, this study analyzes the relationship between governmental financial support and university performance, that is, whether financial support leads to university performance or universities increase performance to receive financial support.
Whether financial support influences university performance is analyzed based on the educational production function (EPF). This perspective posits that investment in education will result in a certain performance [8,9]; therefore, it is related to assessing whether university financial support attains its main objective. The conceptual framework of the EPF assumes that financial support is causally prior to university performance [10]. Meanwhile, higher education is often endogenous [9] in that better performing universities may receive more financial support [11]. Universities may thus enhance their performance to receive financial support. However, the so-called strategic manipulation and goal displacement may occur in this process [12].
Until now, numerous studies have analyzed the effect of funding on university performance using the basic notion of causality [8,13,14,15,16]. This study investigates the relationship between financial support and university performance and analyzes whether the relationship shows endogeneity.
To analyze the relationship between financial support and university performance, this study employs the Granger causality test and panel vector auto-regressive (PVAR) model. Using this method, we determine whether financial investment leads to university performance or university performance leads to financial investment. Furthermore, we examine whether these two factors interact or are unrelated. This analysis provides meaningful implications regarding whether financial support for universities should be expanded or reduced and identifies the aspects that must be considered in providing financial support. We anticipate this analysis will promote the understanding of the mechanism through which governmental financial support is provided, as well as provide a better understanding of the realities and practices of financial management for universities. This study will thus aid the consideration of an adequate direction for governmental financial support and suggest meaningful ways to strengthen the effectiveness and efficiency of financial support initiatives for universities.
This paper is structured as follows. Section 2 reviews the related literature and Section 3 introduces Korea’s financial support policy. Section 4 and Section 5 discuss the theoretical framework and describe the data, respectively. The estimation results are presented in Section 6, while Section 7 concludes the paper.
2. Literature Review
As financial support for universities has increased, the literature has shown a growing interest in university performance. Specifically, numerous studies have estimated the effect of financial support on university performance. For example, Shin [16] uses panel data from 1997 to 2007 to analyze how performance-based financial support affects the performance of U.S. universities. Using the graduation rate and research performance as dependent variables, the study finds that financial support did not have a substantial effect on performance. These results are attributed to insufficient authority being conferred to the leader of the institution that received the performance-based funding, as well as the heavy intervention and control over work processes. Sanford and Hunter [15] analyze the relationship between performance-based funding policies and retention and six-year graduation rates in four-year higher education institutions in the U.S. They find no substantial differences in re-enrollment and graduation rates between the schools that had adopted the performance-based formula and those that had not. Insufficient levels of financial support were pointed out as causing the ineffectiveness of performance-based funding. That is, the amount of financial support was not large enough to incentivize schools to improve performance.
Dundar and Lewis [10] examine the determinants of research productivity in higher education. Using data from the National Research Council, they address research productivity in biological sciences, physical sciences and mathematics, and social and behavioral sciences. To identify the determinants of research productivity, they use explanatory variables such as program size, concentration and percentage of faculty publishing, percentage of full faculty, institutional library expenditure, ratio of graduate students to faculty, percentage of faculty with research support, and percentage of graduate students who hold research assistant positions, with the number of average research publications of each departmental cluster at the institution as the dependent variable. Using polynomial regression, they find that academic research productivity is closely associated with faculty size but at a diminishing rate. They also show that private universities have higher research productivity.
While these studies focus on the effects of financial investment in universities, another research stream analyzes the efficacy of university financial support. Such studies estimate university efficiency using data envelopment analysis (DEA). For example, Johnes and Johnes [17] analyze research funding and performance in the U.K. using DEA. Specifically, they investigate the technical efficiency of economics departments. Considering that research performance indicators in universities are diverse, they use variables such as papers or letters published in academic journals or articles in professional journals. Using these variables, they calculate DEA efficiency scores and suggest DEA can help develop meaningful indicators of university performance. Tochkov et al. [18] estimate the relative technical and cost efficiency of Bulgarian universities and explore the correlation between public funding and efficiency levels. To estimate technical efficiency using a DEA model, the authors analyze teaching, research, and comprehensive efficiency using academic staff, floor area, library items, and research funds as input variables. Output variables are unemployment, starting salary, publications, citation indexes, and so on. Specifically, the study examines the correlation between estimated efficiency levels and the corresponding amount of government subsidies, identifying the determinants of efficiency and government subsidies using censored regression analysis. The regression results indicate that private higher education institutions exhibit significantly higher efficiency than public ones.
These studies are important because they investigate a wide range of factors affecting university performance or productivity. However, they assume the basic notion of causality, considering financial support and institutional characteristics as causally preceding university performance. We conversely assume the possibility of recursive effects or interactive relationships between financial support and university performance. For example, Toutkoushian et al. [19] find that research productivity can be a significant determinant of reputation and prestige, which leads to acquiring more resources. Bolli and Somogyi [11] analyze the impact of private and public third-party funds on the productivity of Swiss university departments and public research institutions using input variables such as full-time academic staff, full-time administrative staff, budget per employee, public third-party funds, and private third-party funds. As the dependent variable, they use scientific publications, number of master’s degrees, and information technology transfers, among others. They identify endogeneity between input and output variables, then use instrumental variables to solve the problem by exploiting variance within universities to account for unobserved heterogeneity. Their study is important in addressing the problem of endogeneity between funding and university productivity.
While studies on the efficacy of university financial support and university performance exist, as well as those that analyze the impact of financial investments in universities, most studies use unidirectional causality. However, it is also necessary to examine the issues of recursive effects and bi-directional causality between financial support and university performance.
This study thus analyzes the causal relationship between financial support and university performance. Its main objectives are to examine whether university financial support affects performance, university performance affects university financial support, university financial support and university performance interact, or whether there is no interaction between university financial support and university performance. To analyze how these two variables are related, we first examine Korea’s policy of financial support.
3. Higher Education and Financial Support in Korea
3.1. Higher Education in Korea
Higher education institutions in Korea have experienced a specular expansion over past several decades [20]. In 1945, there were only 2382 students enrolled in 19 universities. In 2018, the enrollment increased to more than 2,769,522 students in 340 universities [21]. Among these 340 universities, 290 universities are private. In addition, around 70% of high-school graduates advance to higher education [2]. After this period of massification of higher education, Korean universities face an unprecedented situation: they find themselves within an environment characterized by a decline in school-age population. Relative to the 2013 levels, the school-age population saw a 11.3% decrease in 2018 [22]. This decline is expected to accelerate. The commissioner of statistics forecasted that the 610,000 students in 2018 will diminish to 460,000 by 2030. This decrease will translate into a financial burden to universities, whose finances depend significantly on tuition. Securing financing has thus emerged as a major goal for universities, and the securing of alternative sources of financing that could replace tuition has become a major factor for the survival and sustainability of universities. While universities are making efforts to diversify their sources of financing amid these changes, the reality is that it is difficult to create new sources of revenue. As part of their efforts to diversify their financial structures, universities have come to concentrate all of their efforts on applying for government support programs. However, the Ministry of Education (MOE) has direct control over higher education institutions [23]. The government regulates the student entrance quota and tuition fee rate. MOE’s financial support programs select participants on the basis of a formula. Here, performance is measured by the extent to which an university meets its student body quotas and complies with tuition freeze policy. These indicators are also used to determine the amount of financial support to universities.
3.2. Financial Support in Korea
Governmental financial support for universities began in earnest during the early 1990s. Because the amount of governmental national financial support was not substantial prior to the 1990s, it was not provided in a systematic and consistent manner [24]. In 1994, financial support for universities began to increase, shifting away from a system of indiscriminate distribution to one in which support was provided differentially via an evaluation system. However, the financial support offered during this period was predominantly general. In 2004, a selective system of financial support based on “choice and focus” was introduced [25]. Later, 2008 witnessed not only a large increase in the amount of university financial support, but also another shift in the financial support system. “Formula-based funding” and “block grant” systems were introduced in the selection process for recipients, along with the determination of the amount of financial support, while financial aid for professors, researchers, and students were expanded [26]. In particular, the Educational Capacity Enhancement Project (ECEP), which began in 2008, aimed to strengthen the overall educational capacities of universities through continuous management of educational conditions and performance indicators. As opposed to previous university financial aid programs, where universities submitted project plans for review before decisions were made, the ECEP adopted a formula-based funding method and selected the recipients of financial aid at the school level in accordance with predetermined financial support indicators. Additional programs include the research-focused funding program, Brain Korea 21, and the industry–university cooperation program, Leaders in Industry–University Cooperation (LINC) [27]. Project details are listed in Table 1.
In addition to MOE’s financial support programs, other ministries of the central and local governments provide financial support (Table 2).
This is because ministries other than MOE are currently implementing a wide range of financial support programs according to their needs [28].
4. Hypotheses and Variables
4.1. Hypotheses
A substantial number of educational policies are created under the assumption that educational performance can be strengthened by improving the educational conditions in schools. Traditionally, the performance of educational investment has been measured using the EPF approach [8,9]. This approach regards the phenomenon of education as a relationship between input and output, expressing the technological relationship between the given input factors and the maximum attainable amount of output as a mathematical function.
Specifically, the EPF expresses the production relationship between the input factors (production factors) and final output as a functional relationship. Public education may also be regarded as a production activity, as authorities in charge of education policy input human resources, such as faculty, and physical resources, such as school buildings and facilities, to produce educational goods. Educational goods encompass the basic knowledge, occupational skills, creativity, attitudes, and other attributes that are created through educational activities. However, if we only assume the existence of faculty (L), which are the input factors that produce educational goods (Q) through their labor, school buildings and facilities as capital (K), and supplementary educational materials as resources (M), the EPF may be expressed as follows:
Q = f (L, K, M).
Educational goods have a long production period and give rise to diverse outputs. Furthermore, while students are the consumers of educational goods, they may also be characterized as producers. These imply that financial investment in education does not occur in a direct or short-term manner but is nonetheless an indispensable factor for providing education.
Studies using the EPF approach have found that financial support is effective for strengthening performance. For instance, using a model of predicted graduation rates, Porter [29] analyzes the relationship between institutional expenditure on higher education and graduation rates and find evidence of a significantly positive relationship. Rushton and Meltzer [30] analyze the determinants of research capacity by setting university financial capacity, university reputation, number of faculty, and quality of faculty as the independent variables and the research capacity of universities as the dependent variable and show that financial capacity has a positive effect. Based on these results, we posit the following hypothesis.
Hypothesis 1.
The financial support provided to universities positively influences university performance.
As opposed to the view that investment in education (i.e., financial support) leads to performance, resource dependency theory suggests that universities pursue performance to induce financial support. This is founded on the fact that no organization can fully procure all the resources it requires [31]. As a result, organizations cannot remain operational unless they procure resources from within their environments; otherwise, they become unable to function in accordance with the tasks that they had planned. This theory posits that, to prevent such eventualities, organizations will be sensitive to environmental factors that might affect their survival and will strive to secure conditions whereby they can procure the required resources or capacities from those who have them [32].
Korean universities find themselves in an environment characterized by a decline in the school-age population and the freezing of tuition rates. The school-age population saw a −11.3% change in 2018 relative to 2013 levels [23]. The decline in student entrance quotas and freezing of tuition have resulted in a financial burden to universities, whose finances significantly depend on tuition. Securing financing has emerged as a major issue for universities, and sources of financing other than tuition have become a major factor for their survival and sustainability. While universities are making an effort to diversify their sources of financing amid such environmental changes, it is difficult to create new sources of revenue.
On the other hand, universities make use of their economic characteristics, that is, their joint production characteristics, as well as the complexity of their production technology. According to this view, universities use their finances to achieve the performance required to receive financial support from the government. In this regard, school funds serve the function of “priming the pump” of efforts to obtain financial support, while university performance serves as a “fulcrum of the lever,” which is used to elicit financial support. Consequently, we consider the following hypothesis.
Hypothesis 2.
University performance influences financial support.
4.2. Variables
Higher education is represented by multiproduct institutions with heterogeneous inputs and multiple principals [7]. University education performance is diverse in nature, and measurement of performance thus presents difficulties. This is because, as evidenced by Bowen [33], the qualitative aspects of university performance (e.g., quality of education, quality of research output, and reputation) are intangible.
Performance indicators must be in line with financial support to measure the success of government policies [4] and university missions and also improve productivity. It is thus necessary to derive performance indicators that consider universities as providers of education, research, and services, and can be used for the criteria and objectives of financial support.
For university education, performance indicators such as retention rates [34], graduation rates [35,36], and employment rates [9,37] were used. However, in Korea, the greater part of financial support is distributed based on job-finding rates (Table 3). Thus, this study uses job-finding rates to measure educational performance.
Research performance indicators are also complex and difficult to define. For example, Phillimore [38] describes research indicators in the context of research output, impact, quality, and utility. Considering that performance indicators should be closely related to the activities and outcomes of universities and used both scholarly [10,13,14] and practically (Brain Korea 21 plus), this study considers the number of academic articles published in the Korea Citation Index (KCI) and SCI/SCUPP journals, drawing on publicly disclosed data reported on the “Higher Education in Korea” website (http://www.academyinfo.go.kr/intro/intro0300/intro.do). Specific variables for research are listed in Table 4.
5. Data and Research Methodology
5.1. Data
The subjects used to examine the relationship between university financial support and performance are four-year universities. The analysis period is from 2009 to 2017 and the panel data (i.e., strongly balanced panel) cover 148 universities. The distribution of universities includes 36 national and 112 private universities (Table 5).
The mean value of the amount of financial support from the central government was 24,671,382,000 KRW and the mean value of the amount of financial support from local governments 1,392,741,000 KRW (Table 6).
The descriptive statistics of the performance variables indicate that the average job-finding rate was 64.25% and the average number of publications per full-time faculty member in KCI and SCI-equivalent journals were 0.623 and 0.238, respectively (Table 7).
5.2. Methodology
As previously mentioned, this study employs Granger causality to analyze how university financial support and performance are related. Before performing the Granger causality test, it is necessary to test data stationarity. To do this, we consider unit root tests such as Levin–Lin–Chu (LLC), Im–Pesaran–Shin (IS), and Fisher-type tests, which are stationarity tests with alternative null hypotheses that all panels contain unit roots [39].
To decide which is the causal variable and which is the outcome variable in the regression and other econometric analyses, it is general practice to regard causality as being predetermined, based on economic theory. This raises the issue of clearly specifying functional relationships when causes and outcomes are unclear. The Granger causality test is one method that can be used to tackle this issue by employing distributed-lag models. In this study, we analyze the causal relationship between the amount of university financial support, , and university performance, , as follows:
These two equations are first estimated as they are, for suitable lag length, and re-estimated under constraints in (2). Then, the F statistic is used to test their adequacy.
As we conduct the Granger test using panel data, we employ the method presented by Dumitrescu and Hurlin [40]. For this purpose, we specify the model to be analyzed in the following form:
where the and are the individual observations of two stationary variables and is the lag order.
The procedure for determining the existence of causality is testing for significant effects of the past values of x on the present value of y. The null hypothesis is defined as:
After the panel Granger causality test, this study tests nonlinear Granger causality. While linear tests of Granger causality provide causal relations between financial support and performance, another method for causality detection is needed. After linear and nonlinear causality test, we analyze the relationship between financial investment and university performance using the PVAR model, which adds a cross-sectional dimension to the VAR model. As a result, the individual heterogeneity that cannot be observed in the VAR model can be considered. PVAR is useful for analyzing variables that are interrelated and complex. We utilize the general method of moments (GMM), which means the PVAR model does not require any special assumptions or data restrictions. We estimate the relationship between financial support and university performance using the following equations:
where implies group heterogeneity and . and are time heterogeneity. In a model that includes the past values of dependent variables as explanatory variables, we cannot obtain an unbiased estimator if is the parameter to be directly estimated. Using a transformation method, we can eliminate , but each equation would still include past values of endogenous variables, meaning we must use instrumental variables. However, it is not easy to identify instrumental variables. Arellano and Bover [41] provide a solution that eliminates the group heterogeneity of . This is a forward mean difference, called the Helmert process, which makes it possible to eliminate . Additionally, as Helmert transformed variables are independent from the past values of endogenous variables, we can estimate instrumental variables. The Helmert transformation can be written as follows:
6. Results
6.1. Results of Panel Data Unit Root Test
LLC, IPS, and Fisher unit root tests were performed to verify data stationarity. At the variable level, all variables were stationary, except under IPS, which indicates that the central and local governmental financial support variables have unit roots. We solve the unit root problem by performing log transformations of two of the variables (Table 8).
6.2. Results of Panel Granger Causality Test
Table 9 summarizes the results of the panel Granger causality test and nonlinear Granger causality test conducted on universities. Regarding the panel Granger causality test, central governmental financial support Granger-caused job finding rates and the number of publications in SCI-equivalent journals per full-time faculty member. Additionally, local governmental financial support was found to Granger-cause job-finding rates, which were found to Granger-cause central and local governmental financial support. Finally, the number of publications in SCI-equivalent journals Granger-caused local governmental financial support. However, the nonlinear Granger causality test shows different results from the panel Granger causality test in that the job-finding rate relates to central and local funding and publication in SCI journals.
Analyzing the causal relationship between financial support and performance in the panel Granger causality test, we find that job-finding rates behave well with the financial support variable (bidirectional), but there is no interaction between central financial funding and the number of publications in KCI journals. In addition, at the local level, only the research variables influence the local governmental financial variable (Table 10). Analyzing the nonlinear relationship shows that performance variables do not Granger-cause the financial variables.
6.3. Results of PVAR Analysis
Panel Granger-causality testing is not sufficient to determine the interaction between the variables of a system. Therefore, we next examine the relationship between financial support and university performance using PVAR analysis. Based on the panel Granger-causality test results, we distinguish the endogenous variables from the exogenous ones. Using this information, we first use the exogenous variables in the PVAR model. Selection of the correct model is essential for PVAR, as having lags that are too short can fail to capture the system’s dynamics, while lags that are too long cause a loss in degrees of freedom. Based on the three model selection criteria of Andrews and Lu [42], the smallest order of MBIC, MAIC, and MQIC was preferred. Using these criteria, we fitted the order of the PVAR model.
First, the previous year’s financial support from the central government shows a significant influence on the job-finding rates. However, the reverse relationship is not significant Relating central governmental financial support and job-finding rates, we can assume that the educational production function is relevant in the PVAR model. We may find different results for the relationship between local financial support and job-finding rates because both previous year’s variables are significant for the observed year’s variables (Table 11).
Increasing central funding increases the number of publications in SCI journals, while publications in SCI journals also increase central funding. This implies the two variables interact. However, we cannot find significant relationships between the previous year’s local financial support and the number of publications in KCI and SCI journals, while the previous year’s performance only influences local financial support. Based on these results, we can conclude that universities enhance their performance to attain local government financial support.
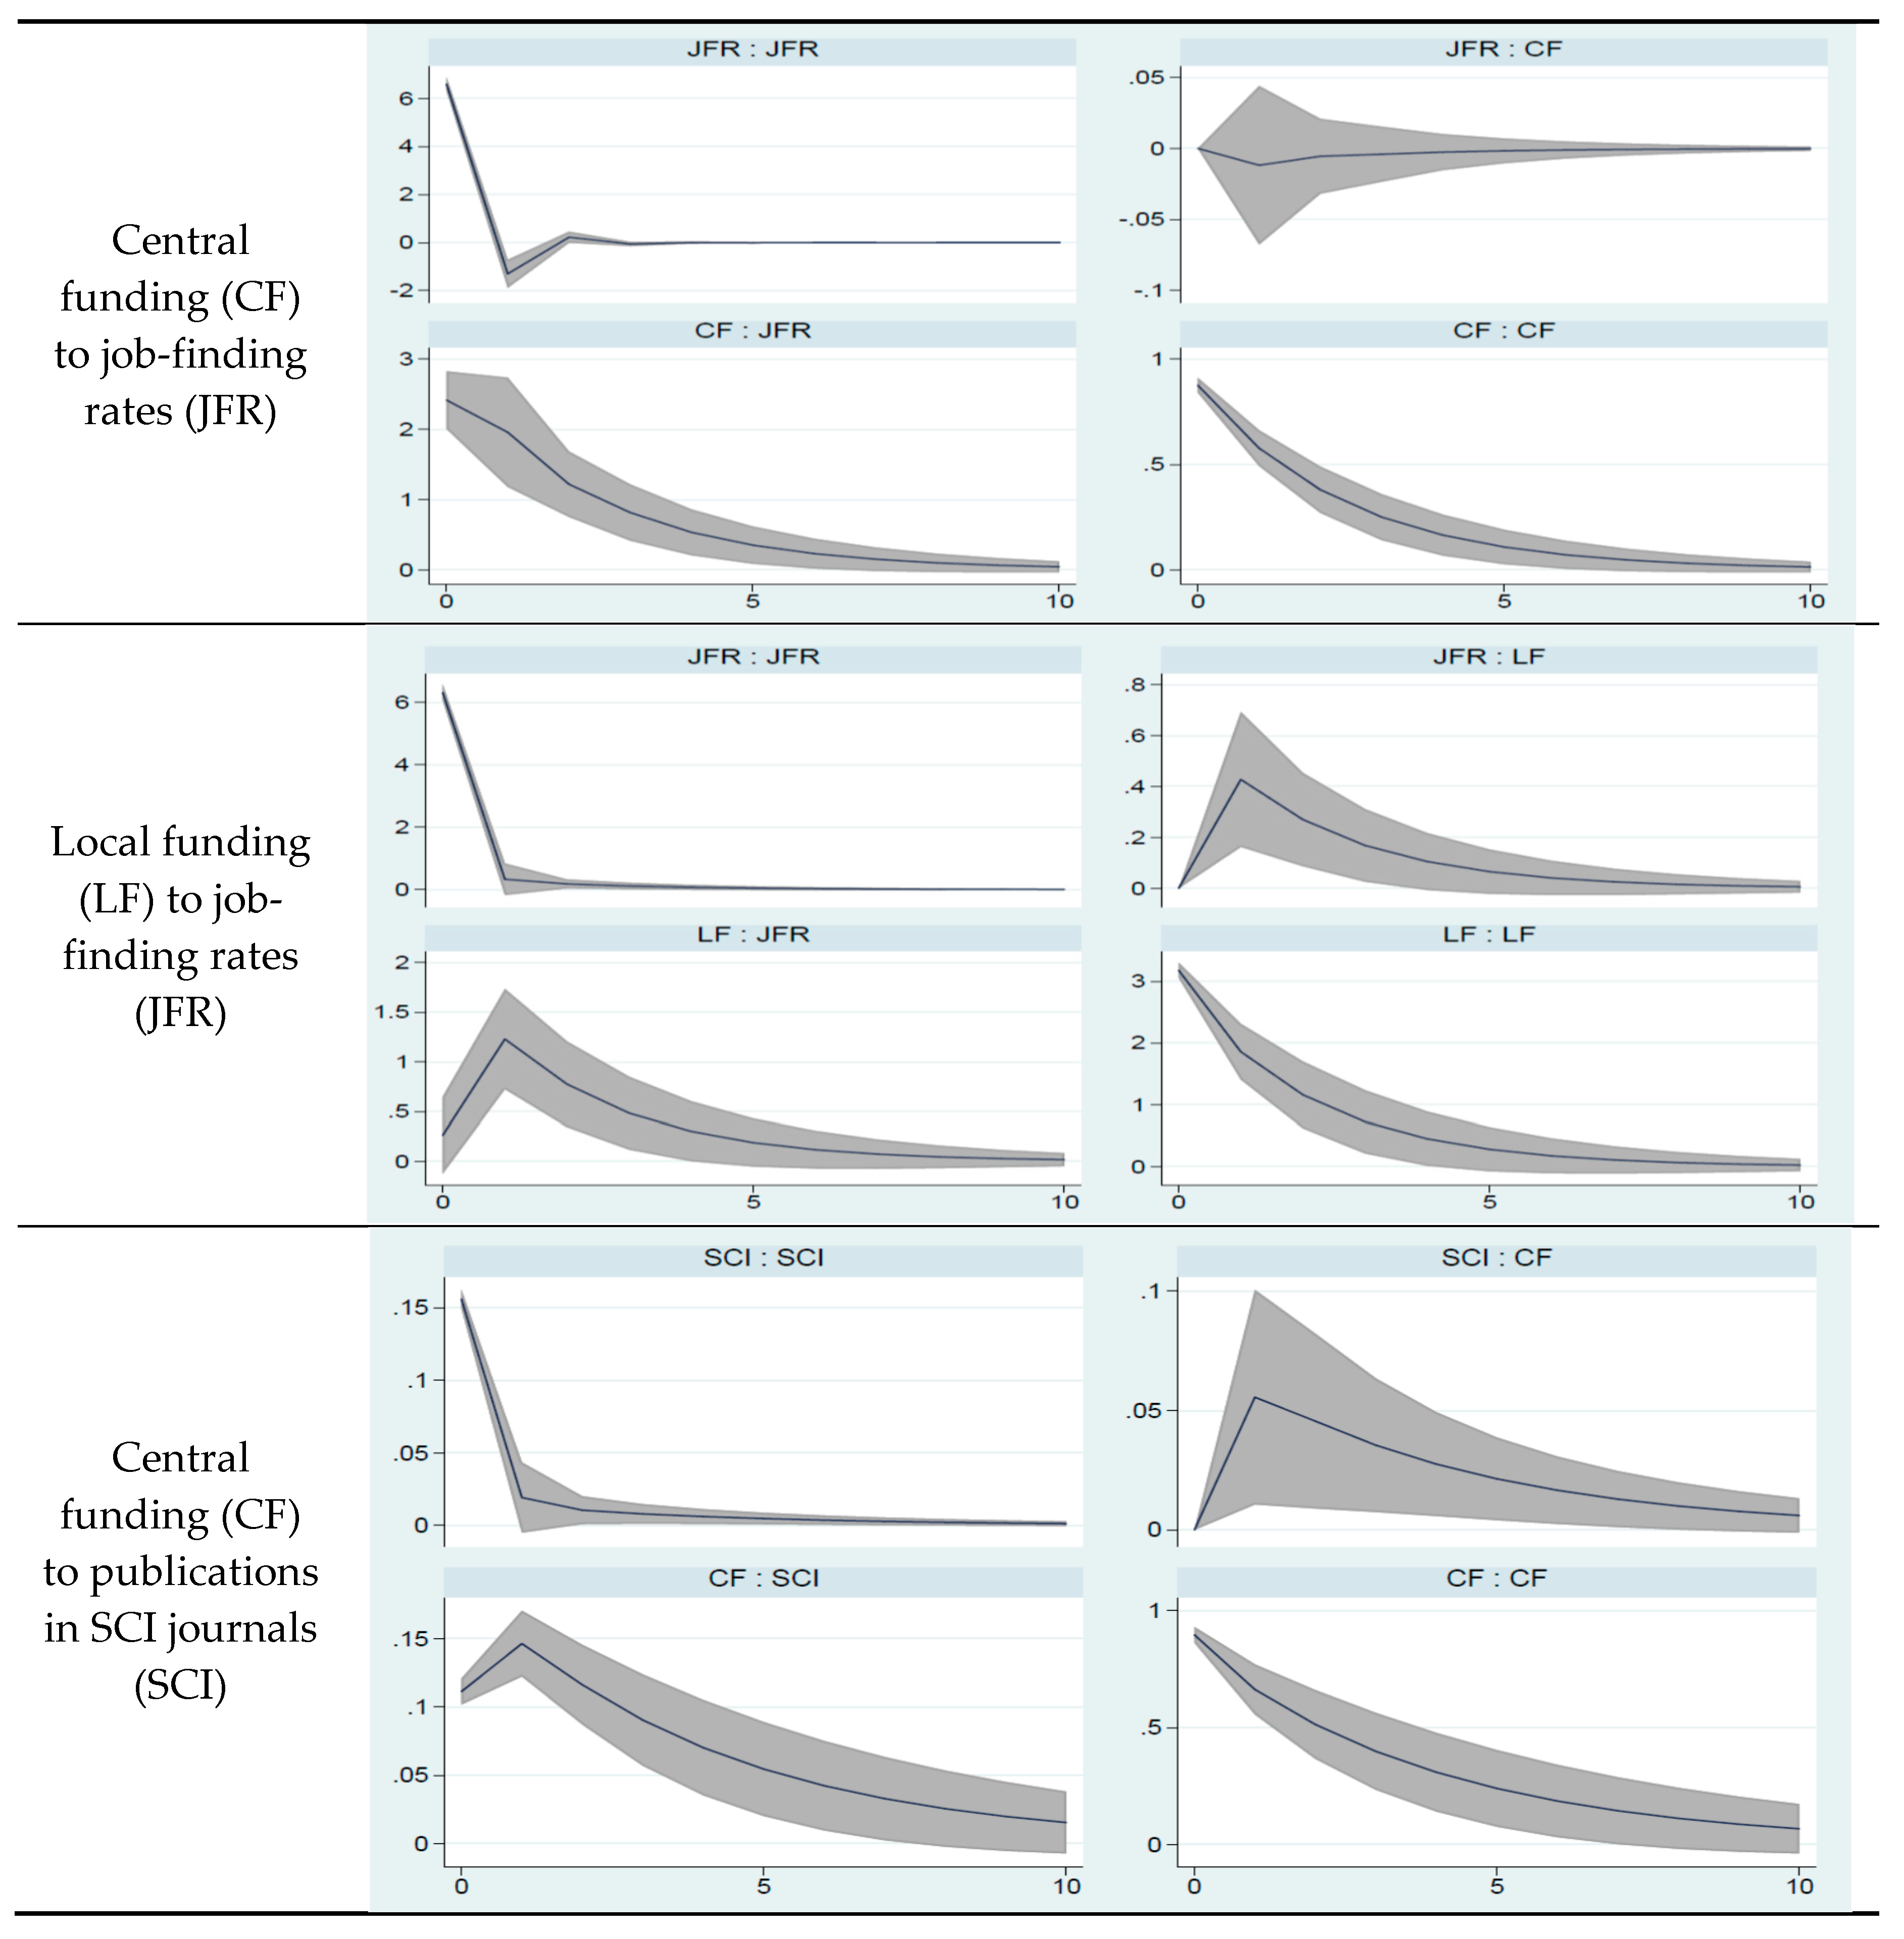
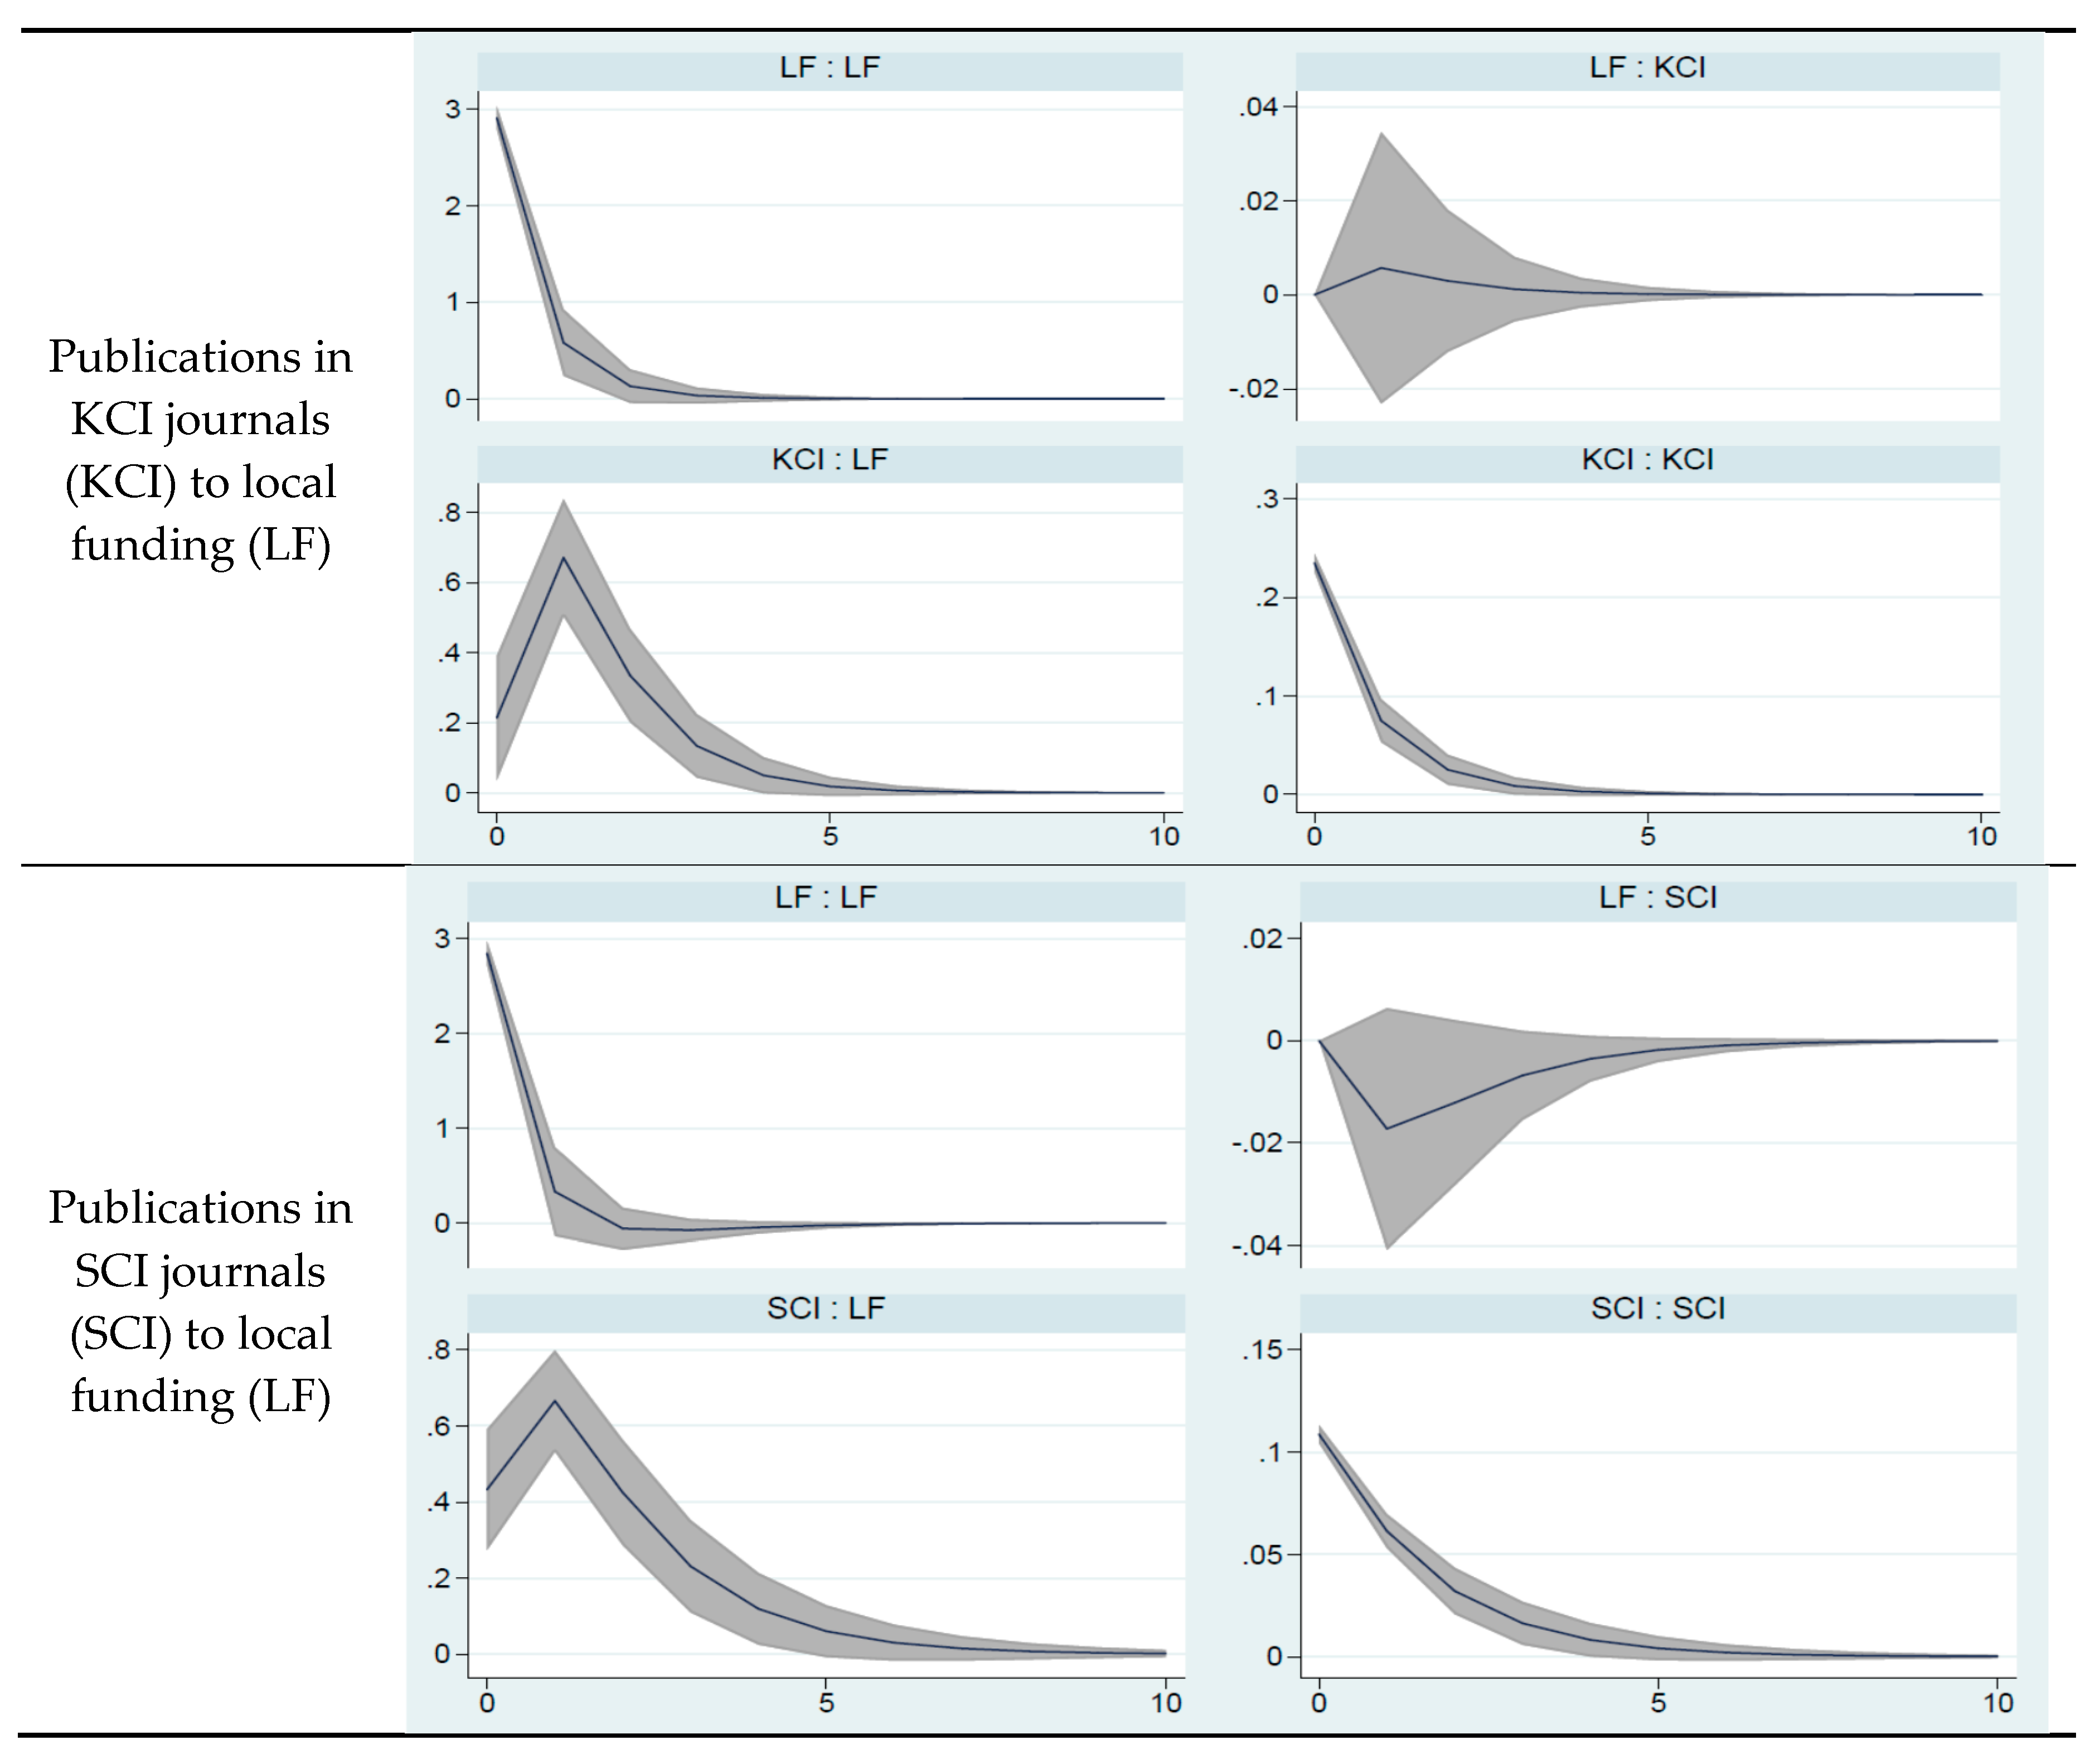
Using the forecast error variance decomposition (FEVD) estimates, we analyze the response of one variable to an impulse in another variable in the system. Impulse response graphs depict the current and future responses of a given variable. In Figure 1, we can see that as much as 40% of the variation in job-finding rates can be explained by central financial support. However, job-finding rates explain only a small part of the variation in central financial support. In terms of local governmental financial support for job finding rates, only 1.5% of the latter can be explained by local governmental financial support. This value is small compared to the magnitude of the relationship with central governmental support and implies that central governmental support is more effective than local governmental support for changing job-finding rates. In terms of the relationship between job-finding rates and financial support, central governmental financial support responds both positively and negatively to job-finding rates; however, local governmental financial support shows a positive response to job-finding rates.
The impulse response function (IRF) of job-finding rates to central financial support shows different directions early on. This means that even improving its job-finding rates is no guarantee that a university will receive central financial support at the same rate as its peers.
In terms of the relationship between central governmental financial support and publications in SCI journals, a positive impact on central governmental financial support leads to an increased number of publications in SCI journals but explains only 1.5% of the variation. The explanation of the variation in the reverse relationship is 1%. From the IRF plot of research performance with local financial support, positive shocks in research lead to increased local financial support but the reverse relationships show different responses.
6.4. Implications
This study differs from previous studies in the following aspects. First, it analyzes the bidirectional relationship between government funding and university performance. Previously, most previous studies have analyzed the impact of funding on university performance [9,11,15,16,17] based on unidirectional causality. However, this study investigates these relationships based on both unidirectional and reverse causality. In terms of reverse causality, universities tend to maximize revenue through government funding, especially during periods of financial constraint.
Second, this study finds different results when estimating the impact of financial support on university performance. Previous studies observe that government performance-based accountability does not result in a noticeable increase in institutional performance [15,16]. For example, Sanford and Hunter [15] find that performance funding is not related to changes in performance measures such as retention and graduation rates, and doubling the monetary incentive associated with retention and six-year graduation rates was not associated with increases in retention rates. They also suggest that these results may be due to funding that is insufficient to incentivize changes in institutional behavior. In this study, we find that, for all universities, central and local governmental financial support interact with job-finding rates. That is, while financial support to universities leads to increases in performance, universities also attempt to increase performance to secure financing. This result indicates endogeneity may exist in the relationship between government funding and university performance. In an econometric model, if there are endogenous variables, the estimated coefficients may not be the best linear unbiased estimates. Previous studies, excluding Bolli and Somogyi [11], fail to fully consider these problems, which is why our results may differ. This study empirically determines that some variables have reverse causality, some variables interact, and some variables have no relationship. In future studies analyzing the impact of performance on financial support, it is recommended that these problems be systematically considered.
Finally, in the context of Korea, this study is important for analyzing and understanding the effects of governmental financial support on performance. As previously mentioned in the Granger causality test results, we found that governmental funding interacts with the job-finding rates. However, central governmental financial support and the number of publications in KCI journals per full-time faculty member did not show any interaction. In terms of local financing, we can assume that universities attempt to increase research performance to obtain financial support, because local governmental financial support did not have any significant effect on research performance.
There may be several plausible explanations for why job-finding rates interact with governmental funding, while research performance shows only a reverse relationship with local governmental funding. First, the relationship between funding and job-finding rates may be due to the number of projects undertaken, as there are many projects related to job-finding. However, in terms of research indicators, only a few projects exist, such as BK21 plus. Second, projects for job-finding rates employ performance-based systems, while there is no systematic performance-based system for university research performance, especially at the local government level. We can thus assume that the lack of a performance-based system may be the main cause of this reverse causality. There are disputes regarding performance-based research funding systems. For instance, Hicks [5] notes that a performance-based research funding system (PRFS) creates powerful incentives and performance-based reward structures, with a focus on excellence. A PRFS may reduce the risk of adverse selection and moral hazard problems in the distribution of resources. However, Butler [43] indicates that a PRFS may favor quantity over quality. Van Raan [44] raises technical and methodological problems in the application of publication and citation data, which is important in PRFS. Such complex and multi-faceted issues were not the main concern of our research. Rather, this is an important preliminary study to provide the background for discussing such issues.
7. Conclusions
The view that competitiveness in higher education is a major determinant of national competitiveness has led to diverse efforts for strengthening university competitiveness, and financial support for universities may be understood within this context. Korea has also seen steady growth in the scale of financial support for universities. By funding universities, the government seeks to promote their restructuring and strengthen their competitiveness. Given the shrinking school-age population and tuition freezes, universities increasingly seek to secure governmental funding. In other words, governmental financial support has become a crucial means for universities to gain prestige and resources. Given the increasing scale of financial support for universities, there is the need to enhance the efficiency of support programs and strengthen university accountability. This may be done via empirical and experiential analyses.
This study empirically analyzed the relationship between university financial support and performance. As theoretical frameworks, we employed the EPF and resource dependency theory. We divided university financial support into central and local governmental support and measured university performance in terms of job-finding rates, number of publications in KCI journals per full-time faculty member, and number of publications in SCI-equivalent journals per full-time faculty member. We conducted Granger causality tests and used the PVAR approach to examine how these two factors relate. The Granger causality test results show that both central and local governmental financial support have endogenous associations with the job-finding rates. However, central governmental financial support shows no interaction with the number of publications in KCI journals per full-time faculty member. Further, local governmental financial support and research performance indicators show a reverse causality association.
Consequently, it is necessary to analyze the reasons for reverse causality and the lack of interaction. No observable improvement in university performance despite the receipt of financial support—the case of no interaction—would indicate that there may be issues regarding the process of selecting universities for financial support, inefficiencies in resource distribution, and issues in financial management. Further investigation is thus needed to understand these phenomena. However, this study enhances the understanding of the environment and realities faced by Korean universities, deriving significant implications for how universities respond to such circumstances. Furthermore, it also presents useful implications for the characteristics and issues of financial support programs.
Nonetheless, there are several limitations to this study. First, for central governmental financial support, we were unable to separately analyze MOE programs and programs by other ministries, although the latter have a substantial share. Thus, examining these separately may yield a different set of results. Second, regarding causality testing, this study employs panel and nonlinear Granger causality testing, using the panel Granger causality results in variables selection such as PVAR and IRF. Even though the linear tests of Granger causality have been explored empirically and provide significant results, we are limited in fully considering the nonlinear causality. A further investigation using nonlinear Granger causality tests, such as using the STAR model, is needed to explore the relationship between financial support and university performance. Finally, this research analyzed the results of the Granger causality test at the university level without considering the characteristics of the various universities due to the research scope and space limitations. It is thus plausible to assume that universities may behave differently in their pursuit of government financial support and in attainment of performance according to their size, type (public or private), and so on. In addition, further research is needed to compare the Korean system with that in other countries as to identify similarities and differences.
Author Contributions
Conceptualization: Y.-H.L. and H.-K.K. Formal analysis: Y.-H.L. and H.-K.K. Methodology: Y.-H.L. Writing—original draft: Y.-H.L. Writing—review & editing: Y.-H.L. and H.-K.K.
Funding
This research is funded by Won-kwang Health Science University [Grant number: 2016045].
Conflicts of Interest
The authors declare no conflict of interest.
References
- Schweke, W. Smart Money: Education and Economic Development; Economic Policy Institute: Washington, DC, USA, 2004. [Google Scholar]
- Kim, M.H. Expansion of Higher Education Finance; Korea Council for University Education: Seoul, Korea, 2017. [Google Scholar]
- OECD. Education at A Glance 2017: OECD Indicators; OECD Publishing: Paris, France, 2017. [Google Scholar]
- Guthrie, J.; Neumann, R. Economic and non-financial performance indicator in universities. Public Manag. Rev. 2007, 9, 231–252. [Google Scholar] [CrossRef]
- Hicks, D. Performance-based university research funding system. Res. Policy 2012, 41, 251–261. [Google Scholar] [CrossRef]
- Fereydoon, A. Qualitative indicators for the evaluation of universities performance. Procedia Soc. Behav. 2010, 2, 5408–5411. [Google Scholar]
- Pugh, G.; Coates, G.; Adnett, N. Performance indicators and widening participation in UK higher education. High. Educ. Q. 2005, 59, 19–39. [Google Scholar] [CrossRef]
- Abbot, M.; Doucouliagos, H. Research output of Australian universities. Educ. Econ. 2004, 12, 251–265. [Google Scholar] [CrossRef]
- Belfield, C.R.; Fielding, A. Measuring the relationship between resources and outcomes in higher education in the UK. Econ. Educ. Rev. 1999, 20, 589–602. [Google Scholar] [CrossRef]
- Dundar, H.; Lewis, D.R. Determinants of research productivity in higher education. Res. High. Educ 1998, 39, 607–631. [Google Scholar] [CrossRef]
- Bolli, T.; Somogyi, F. Do competitively acquired funds induce universities to increase productivity? Res. Policy 2010, 40, 136–147. [Google Scholar] [CrossRef]
- Taylor, J. The impact of performance indicator on the work of university academic: Evidence from Australian universities. High. Educ. Q. 2001, 55, 42–61. [Google Scholar] [CrossRef]
- Baird, L. Publication productivity in doctoral research department: Interdisciplinary and intradisciplinary factors. Res. High. Educ. 1991, 32, 303–318. [Google Scholar] [CrossRef]
- Porter, S.R.; Toutkoushian, R.K. Institutional research productivity and the connection to average student quality and overall reputation. Econ. Educ. Rev. 2006, 25, 605–617. [Google Scholar] [CrossRef]
- Sanford, T.; Hunter, J.M. Impact of performance funding on retention and graduation rates. Educ. Policy Anal. Arch. 2011, 19, 1–26. [Google Scholar] [CrossRef]
- Shin, J.C. Impact of performance-based accountability on institutional performance in US. higher education. High. Educ. 2010, 60, 47–68. [Google Scholar] [CrossRef]
- Johnes, J.; Johnes, J. Research funding and performance in U.K. university departments of economics: A frontier analysis. Econ. Educ. Rev. 1995, 14, 301–314. [Google Scholar] [CrossRef]
- Tochkov, K.; Ninovski, N.; Tochkov, K. University efficiency and public funding for higher education in Bulgaria. Post Communist Econ. 2012, 24, 517–534. [Google Scholar] [CrossRef]
- Toutkoushian, R.K.; Dundar, H.; Becker, W.E. The National Research Council graduate program ratings: What are they measuring? Rev. High. Educ. 1998, 21, 427–443. [Google Scholar]
- Kim, S.W.; Lee, J.H. Changing facets of Korean higher education: Market competition and the role of the state. High. Educ. 2006, 52, 557–587. [Google Scholar] [CrossRef]
- Korean Educational Development Institute (KEDI). The Yearbook of Educational Statistics in Korea; Korean Educational Development Institute: Seoul, Korea, 2018. [Google Scholar]
- Park, M.G. The Current Status of Private University Financial Administration and Measures for Improvement; National Audit Policy Source Book: Seoul, Korea, 2018. [Google Scholar]
- Terri, K. Higher education reforms in South Korea: Public-private problems in internationalizing and incorporating universities. Policy Future Educ. 2008, 6, 558–568. [Google Scholar]
- Song, G.C. Issues concerning government subsidies of universities and measures for improvement. Identifying ways to improve efficiency of university financial management and securing stable financial sources. In Proceedings of the KOSEFE’s 27th Winter Academic Conference, Seoul, Korea, 1–19 February 2000. [Google Scholar]
- Ministry of Education & Human Resources Development. A Plan to Strengthen University Competitiveness to Advance the Era of the 20,000 Dollar Income; Ministry of Education & Human Resources Development: Seoul, Korea, 2003.
- Ministry of Education, Science and Technology. Basic Plan for the Cultivation of Outstanding Talent and the Strengthening of University Educational Capacities; Ministry of Education, Science and Technology: Seoul, Korea, 2008.
- Ministry of Education. Plan to Reorganize University Financial Support Programs; Ministry of Education: Seoul, Korea, 2018.
- Kim, H.H. A study on relationships between government funding and finance structure of universities in Korea. Korean J. Educ. Adm. 2014, 32, 297–326. [Google Scholar]
- Porter, S.R. The robustness of the graduation rate performance indicator used in the U.S. News and World Report college rankings. In Proceedings of the 2nd AIR-CASE Conference, Washington, DC, USA, 29–30 March 1999. [Google Scholar]
- Rushton, J.P.; Meltzer, S. Research productivity, university revenue and scholarly impact of 169 British, Canadian and United State universities. Scientometrics 1981, 3, 275–303. [Google Scholar] [CrossRef]
- Pfeffer, J.; Salancik, G. The External Control of Organizations: A Resource Dependence Perspective; Harper & Row: New York, NY, USA, 1978. [Google Scholar]
- Kraats, M.; Zajac, E. How organizational resources affect strategic change and performance in turbulent environments: Theory and evidence. Organ. Sci. 2001, 12, 632–657. [Google Scholar] [CrossRef]
- Bowen, H.R. The Costs of Higher Education; Jossey-Bass: San Francisco, CA, USA, 1980. [Google Scholar]
- Astin, A.W.; Oseguera, L. Degree Attainment Rates at American College and University: Effects of Race, Gender, and Institutional Type; revised ed.; University of California, Higher Education Research Institute: Low Angeles, CA, USA, 1996. [Google Scholar]
- Archibald, R.B.; Feldman, D.H. Graduation rates and accountability. Res. High. Educ. 2008, 49, 101–106. [Google Scholar] [CrossRef]
- Goenner, C.F.; Snaith, S.M. Accounting for model uncertainty in the predication of university graduation rate. Res. High. Educ. 2004, 45, 25–41. [Google Scholar] [CrossRef]
- Bratti, M.; McKnight, A.; Naylor, R.; Smith, J. Higher education outcomes, graduate employment and university performance indicators. J. R. Stat. Soc. 2004, 167, 475–496. [Google Scholar] [CrossRef]
- Phillimore, A.J. University research performance indicators in practice: The university grants committee′s evaluation of British universities, 1985–1986. Res. Policy 1988, 18, 255–271. [Google Scholar] [CrossRef]
- Luciano, L.; Sylvain, W. Testing for Granger Causality in Panel Data; IRENE working paper 17-03; Institute of Economic Research, University of Neuchatel: Neuchatel, Switzerland, 2017. [Google Scholar]
- Dumitrescu, E.I.; Hurlin, C. Testing for Granger non-causality in heterogeneous panels. Econ. Model. 2012, 29, 1450–1460. [Google Scholar] [CrossRef] [Green Version]
- Arellano, M.; Bover, O. Another look at the instrumental variable estimation of error component model. J. Econom. 1995, 68, 29–51. [Google Scholar] [CrossRef]
- Andrews, W.K.; Lu, B. Consistent model and moment selection procedures for GMM estimation with application to dynamic panel data models. J. Econom. 2001, 101, 123–164. [Google Scholar] [CrossRef]
- Butler, L. Modifying publication practices in response to funding formulas. Res. Eval. 2003, 12, 39–46. [Google Scholar] [CrossRef]
- Van Raan, A.F.J. Fatal attraction: Conceptual and methodological problems in the ranking of universities by bibliometric measures. Scientometrics 2005, 62, 133–143. [Google Scholar] [CrossRef]
Figure 1.
Results of the impulse response function (IRF) on financial support and performance according to funding.
Figure 1.
Results of the impulse response function (IRF) on financial support and performance according to funding.


Table 1.
Financial support projects of the Korean Ministry of Education.
| Objective | 2001 | 2007 | 2012 | 2016 |
|---|---|---|---|---|
| Research-focused | Brain Korea 21, BK 21 (185.1 bn KRW/438 teams) | 1st Stage BK (281 bn KRW/569 teams) | 2nd Stage BK (203.1 bn KRW/500 teams) | ▪ BK21 Plus (272.5 bn KRW/545 teams) |
| Specialization | ▪ University for Creative Korea, CK (63 bn KRW/33 universities) | ▪ Capital Metropolitan Area NURI (60 bn KRW/30 universities) | ▪ Capital Metropolitan Area Educational Capacity Enhancement (57 bn KRW/35 universities) | ▪ Capital Metropolitan Area CK (54.2 bn KRW/79 teams) |
| ▪ Regional University NURI (259.4 bn KRW/131 teams) | ▪ Regional University Educational Capacity Enhancement (124.1 bn KRW/62 universities) | ▪ Provincial University CK (192.5 bn KRW/258 teams) | ||
| ▪ Advancement of College Education, ACE. (60 bn KRW/25 universities) | ▪ ACE (59.4 bn KRW/32 universities) | |||
| ▪ Program for Industrial Needs Matched Education, PRIME (201.2 bn KRW/21 universities) | ||||
| ▪ CORE (60 bn KRW/ 19 universities) | ||||
| ▪ Life-long Education Colleges (30 bn KRW/9 universities | ||||
| ▪ We-Up (5 bn KRW/10 universities) | ||||
| ▪ Specialized College of Korea, SCK (80 bn KRW/90 universities) | ▪ Technical College (168 bn KRW/100 universities) | ▪ Technical College (234 bn KRW/70 universities) | ▪ SCK (297.2 bn KRW/83 universities) | |
| Industry–university cooperation | ▪ Universities focused on Academia-Industry Cooperation (30 bn KRW/23 universities) | ▪ Leaders in Industry University Cooperation, LINC (180 bn KRW/81 universities) | ▪ LINC (224 bn KRW/57 universities) ▪ LINC Technical Colleges (19.5 bn KRW/30 universities) |
Source: Ministry of Education [27].
Table 2.
Estimated financial investments in higher education, 2013–2017 (units: Million KRW, %).
| Year | Ministry of Education | Other Ministries | Local Governments | Total |
|---|---|---|---|---|
| 2013 | 76,272 (66.4%) | 35,294 (30.7%) | 3267 (2.9%) | 114,833 (100%) |
| 2014 | 86,370 (67.9%) | 37,325 (29.4%) | 3447 (2.7%) | 127,052 (100%) |
| 2015 | 96,446 (69.2%) | 39,283 (28.2%) | 3637 (2.6%) | 139,366 (100%) |
| 2016 | 107,307 (70.3%) | 41,444 (27.2%) | 3837 (2.5%) | 152,587 (100%) |
| 2017 | 120,180 (71.5%) | 43,726 (26.0%) | 4048 (2.4%) | 167,951 (100%) |
Table 3.
Volume, scale, objectives, and indicators of Ministry of Education (MOE) financial support programs in 2017 (units: 100 million KRW, universities).
Table 3.
Volume, scale, objectives, and indicators of Ministry of Education (MOE) financial support programs in 2017 (units: 100 million KRW, universities).
| Program Designation | Objectives | Indicators |
|---|---|---|
| ▪ Brain Korea 21 plus | Cultivation of world-class graduate schools and researchers | Job-finding and current career status of graduate students |
| ▪ University for Creative Korea | Specialization based on the demands of local communities | Rate of job-finding in specialized fields |
| ▪ Local university CK | ||
| ▪ Advancement of College Education | Expansion of the Advancement of College Education Model | Job-finding rates among graduates |
| ▪ PRIME | Reorganization of academic departments based on mid to long-term human resource supply and demand prospects | Current status and support for the establishment of employment / startup support infrastructure |
| ▪ Initiative for College of Humanities’ Research and Education (CORE) | Promoting humanities and cultivating innovative convergent talent that meets societal demand | Job-finding rates among humanities graduates |
| ▪ SCK | Specialization of strengths enjoyed by technical colleges | Job-finding rates |
Table 4.
Independent/dependent variables.
| Variable Name | Variable Description | Source | |
|---|---|---|---|
| Financial Variables | Amount of financial support from central government (central funding) | MOE financial support + central government financial support | Higher Education in Korea |
| Amount of financial support from local governments (local funding) | |||
| Performance Variables | Job-finding rates (JFR) | persons employed in jobs included in the health insurance database, persons employed overseas, agricultural workers, persons in individual creative activities, single-person entrepreneurs, freelancers]/[no. of graduates − (no. of school enrollments + military service + unemployable + foreign students in Korea + persons employed in jobs waivered for health insurance enrollment) *100 | |
| No. of publications in KCI journals, per full-time faculty member (KCI) | (Journals registered with the National Research Foundation (including journals with pending registration)) + other academic journals published in Korea/number of full-time faculty members | ||
| No. of publications in SCI-equivalents journals, per full-time faculty member (SCI) | (SCI-equivalent / SCOPUS academic journals + other general academic journals published internationally)/number of full-time faculty members | ||
Table 5.
Types of universities (unit: No. of universities, %).
| National/Public | Private | Total |
|---|---|---|
| 36 (24.3) | 112 (75.6) | 148 (100) |
Table 6.
Descriptive statistics of financial support (unit: 1000 KRW).
| Variables | Mean | Std. dev. | Min. | Max. |
|---|---|---|---|---|
| Central funding | 24,671,382 | 47,899,701 | 0 | 534,727,831 |
| Local funding | 1,392,741 | 1,059,629 | 0 | 19,376,509 |
Table 7.
Descriptive statistics of university performance (units: %, no. of articles).
| Variables | Mean | Std. dev. | Min. | Max. |
|---|---|---|---|---|
| JFR | 64.25 | 9.36 | 23.1 | 100 |
| KCI | 0.6234 | 0.311 | 0 | 2.7931 |
| SCI | 0.238 | 0.2633 | 0 | 2.0969 |
Table 8.
Results of unit root tests.
| Label Variables | LLC | IPS | Fisher |
| Central funding | −5.4234 *** | 4.5822 | −4.4449 *** |
| Local funding | −12.462 *** | 1.7701 | 9.2439 *** |
| JFR | −46.0412 *** | −10.6483 *** | 15.8985 *** |
| KCI | 7.2371 *** | −13.5119 *** | 4.0912 *** |
| SCI | 7.7334 *** | −4.4591 *** | 9.0102 *** |
| Log Variables | LLC | IPS | Fisher |
| Central funding | −12.2741 *** | −2.2705 *** | 22.0708 *** |
| Local funding | −50.9501 *** | −7.3102 *** | 38.5468 *** |
| JFR | −46.0412 *** | −10.6483 *** | 15.8985 *** |
| KCI | 7.2371 *** | −13.5119 *** | 4.0912 *** |
| SCI | 7.7334 *** | −4.4591 *** | 9.0102 *** |
*** p < 0.01, ** p < 0.05, * p < 0.1.
Table 9.
Results of panel Granger causality tests and nonlinear Granger causality test on financial support and performance.
Table 9.
Results of panel Granger causality tests and nonlinear Granger causality test on financial support and performance.
| Dependent Variables | Central Funding | Local Funding | JFR | KCI | SCI | |
|---|---|---|---|---|---|---|
| Explanatory variable | Central funding | 1 | 4.887 *** (0.4630) | 5.9183 *** (1.9867 ***) | 0.018 (0.023) | 5.7544 *** (1.722 ***) |
| Local funding | 4.0471 *** (0.504) | 1 | 16.2093 *** (2.2414 ***) | −0.9641 (0.3126) | 0.9524 (0.3126) | |
| JFR | 5.3945 *** (0.0319) | 6.0566 *** (0.062) | 1 | −2.7652 (−0.045) | −2.5132 ** (−0.788) | |
| KCI | −0.7632 (0.440) | −0.7399 ** (0.6045) | −2.4909 (1.1411) | 1 | 7.8923 *** (8.215 ***) | |
| SCI | 1.1816 (0.6499) | 2.8985 *** (−0.030) | −0.0764 (−0.002) | 3.2297 *** (3.018 ***) | 1 |
Dumitrescu and Hurlin panel Granger causality test results. ( ) nonlinear Granger causality test results with lag parameter 1.*** p < 0.01, ** p < 0.05, * p < 0.1.
Table 10.
Summary of panel Granger causality tests and nonlinear Granger causality test on financial support and performance.
Table 10.
Summary of panel Granger causality tests and nonlinear Granger causality test on financial support and performance.
| Financial Variables | Direction | Performance Variables | ||
|---|---|---|---|---|
| Panel Granger causality | Central funding | → | ← | JFR |
| KCI | ||||
| → | SCI | |||
| Local funding | → | ← | JFR | |
| ← | KCI | |||
| ← | SCI | |||
| Nonlinear Granger causality | Central funding | → | JFR | |
| KCI | ||||
| → | SCI | |||
| Local funding | → | JFR | ||
| KCI | ||||
| SCI | ||||
Table 11.
Results of panel vector auto-regressive (PVAR) on financial support and performance relations.
Table 11.
Results of panel vector auto-regressive (PVAR) on financial support and performance relations.
| Dependent Variables | Explanatory Variables | |
|---|---|---|
| Central funding and JFR | Observed year’s central funding | Previous year’s central funding |
| L1. 0.664100 *** | ||
| Previous year’s JFR | ||
| L1. −0.001791 | ||
| Observed year’s JFR | Previous year’s central funding | |
| L1. 2.78008 *** | ||
| Previous year’s JFR | ||
| L1. −0.196888 *** | ||
| Local funding and JFR | Observed year’s local funding | Previous year’s local funding |
| L1. 0.578897 *** | ||
| Previous year’s JFR | ||
| L1. 0.067796 *** | ||
| Observed year’s JFR | Previous year’s local funding | |
| L1. 0.382489 *** | ||
| Previous year’s JFR | ||
| L1. 0.052127 | ||
| Central funding and SCI | Observed year’s central funding | Previous year’s central funding |
| L1. 0.695478 *** | ||
| Previous year’s SCI | ||
| L1. 0.356712 ** | ||
| Observed year’s SCI | Previous year’s central funding | |
| L1. 0.147912 *** | ||
| Previous year’s SCI | ||
| L1. 0.1239086 * | ||
| KCI and local funding | Observed year’s KCI | Previous year’s KCI |
| L1. 0.316494 *** | ||
| Previous year’s local funding | ||
| L1. 0.001967 | ||
| Observed year’s local funding | Previous year’s KCI | |
| L1. 2.6716 *** | ||
| Previous year’s local funding | ||
| L1. 0.199944 *** | ||
| SCI and local funding | Observed year’s SCI | Previous year’s SCI |
| L1. 0.58873 *** | ||
| Previous year’s local funding | ||
| L1. −0.006069 | ||
| Observed year’s local funding | Previous year’s SCI | |
| L1. 5.6590 *** | ||
| Previous year’s local funding | ||
| L1. 0.11622 ** |
*** p < 0.01, ** p < 0.05, * p < 0.1.
© 2019 by the authors. Licensee MDPI, Basel, Switzerland. This article is an open access article distributed under the terms and conditions of the Creative Commons Attribution (CC BY) license (http://creativecommons.org/licenses/by/4.0/).
Share and Cite
MDPI and ACS Style
Lee, Y.-H.; Kim, H.-K. Financial Support and University Performance in Korean Universities: A Panel Data Approach. Sustainability 2019, 11, 5871. https://0-doi-org.brum.beds.ac.uk/10.3390/su11205871
AMA Style
Lee Y-H, Kim H-K. Financial Support and University Performance in Korean Universities: A Panel Data Approach. Sustainability. 2019; 11(20):5871. https://0-doi-org.brum.beds.ac.uk/10.3390/su11205871
Chicago/Turabian StyleLee, Young-Hwan, and Hyung-Kee Kim. 2019. "Financial Support and University Performance in Korean Universities: A Panel Data Approach" Sustainability 11, no. 20: 5871. https://0-doi-org.brum.beds.ac.uk/10.3390/su11205871
Note that from the first issue of 2016, this journal uses article numbers instead of page numbers. See further details here.