Article

Effects of Land-Use Practices on Woody Plant Cover Dynamics in Sahelian Agrosystems in Burkina Faso since the 1970s–1980s Droughts

by
Wendpouiré Arnaud Zida
1,2,*,
Babou André Bationo
1 and
Jean-Philippe Waaub
3
1
Institut de l’Environnement et de Recherches Agricoles (INERA), DEF, Ouagadougou 04 BP 8645 04, Burkina Faso
2
Institut des Sciences de l’environnement, Université du Québec à Montréal, 201 Avenue du Président-Kennedy, Montréal, QC H2X 3Y7, Canada
3
Département de Géographie, Université du Québec à Montréal, GEIGER, GERAD, CP 8888 succ. Centre-Ville, Montréal, QC H3C 3P8, Canada
*
Author to whom correspondence should be addressed.
Sustainability 2019, 11(21), 5908; https://0-doi-org.brum.beds.ac.uk/10.3390/su11215908
Submission received: 20 September 2019 / Revised: 18 October 2019 / Accepted: 19 October 2019 / Published: 24 October 2019
(This article belongs to the Special Issue Rural Sustainable Environmental Management)

Abstract

:
The 1970s–1980s droughts in the Sahel caused a significant degradation of land and plant cover. To cope with this situation, populations have developed several biophysical and social adaptation practices. Many of these are agroforestry practices and contribute to the maintenance of agrosystems. Unfortunately, they remain insufficiently documented and their contributions to the resilience of agrosystems insufficiently evaluated. Many authors widely link the regreening in the Sahel after droughts to the resumption of rainfall. This study examines the contribution of agroforestry practices to the improvement of woody plant cover in the North of Burkina Faso after the 1970s–1980s droughts. The examination of practices is carried out by integrating the rainfall, soil, and geomorphology variables. Landsat images are used to detect changes in woody plant cover: increasing, decreasing, and no-change in the Enhanced Vegetation Index. In addition, 230 field observations, coupled with interviews conducted on the different categories of change, have allowed to characterize the biophysical environment and identify land-use practices. The results show a variability of vegetation index explained to 9% (R2 = 0.09) by rainfall. However, Chi-Squared independence tests show a strong dependence between changes in woody plant cover and geomorphology (p = 0.0018 *), land use, land cover (p = 0.0001 *), and land-use practices (p = 0.0001 *). Our results show that rainfall alone is not enough to explain the dynamics of agrosystems’ woody plant cover. Agricultural and social practices related to the dynamics of farmer perceptions play a key role.

1. Introduction

The 1970s–1980s droughts were particularly stressful socioeconomically and environmentally in the Sahel region of West Africa [1,2,3]. The drastic decrease in rainfall over several successive years has led to a fall in primary production and triggered serious food crises [1]. The northern region of Burkina Faso was the most affected with a migration of Isohyets from the north to the south [4]. The most notable environmental consequences have been land degradation and loss of biodiversity [2,3]. In response to the negative effects of climatic hazards and the increasing degradation of natural resources, rural communities have developed, from the 1980s, with the support of civil society organizations and state services, several biophysical and/or social adaptation practices [5,6,7,8]. Many of these are indigenous or imported agroforestry practices and contribute to the maintenance of agrosystems [5,6,7]. They promote woody plant regeneration and create a favourable environment for their development. Land-use practices based on water conservation/soils protection and restoration (SWC/SPR) and agroforestry are widely developed and contribute to improving soil quality and increasing the number of trees [5,6,7]. Synthesis studies about cases of woody regeneration stimulated by these practices have been reported in the subregion: in the central plateau of Burkina Faso; in the regions of Tillabéri, Tahoua, Maradi, and Zinder in Niger; in the Dogon plateau in Mali; in the Niayes, the Peanut Basin, and the Sine Saloum in Senegal [5,6]. Unfortunately, these practices remain insufficiently documented, and their contributions to the resilience of agrosystems are insufficiently evaluated.
Since the end of the 1990s, several remote sensing diachronic studies have supported a remarkable improvement of plant cover in the Sahel region of West Africa [9,10,11,12]. This improvement would be the result of the recovery of precipitation after the 1970s–1980s droughts [9,12]. However, the non-uniform distribution of vegetation over the entire area and the diversity of anthropogenic adaptation practices developed in the Sahel [13] suggest that recovery in rainfall is not the only factor in this improvement. Other biophysical and anthropogenic factors should also be considered [5,7,10,14].
Although evoked, the role of land-use practices in the regreening and the evolution of the floristic diversity of Sahelian agrosystems has not been the subject of deep investigations on a large scale. The purpose of this study is to examine the contribution of agroforestry practices to the improvement of woody plant cover in the Northern Region of Burkina Faso after the 1970s–1980s droughts. The review of practices covers both anthropogenic variables such as land use, land cover and land-use practices. It also integrates climatic (rainfall) and environmental (soil and geomorphology) variables that can influence the dynamics of woody plant cover.

2. Methodology

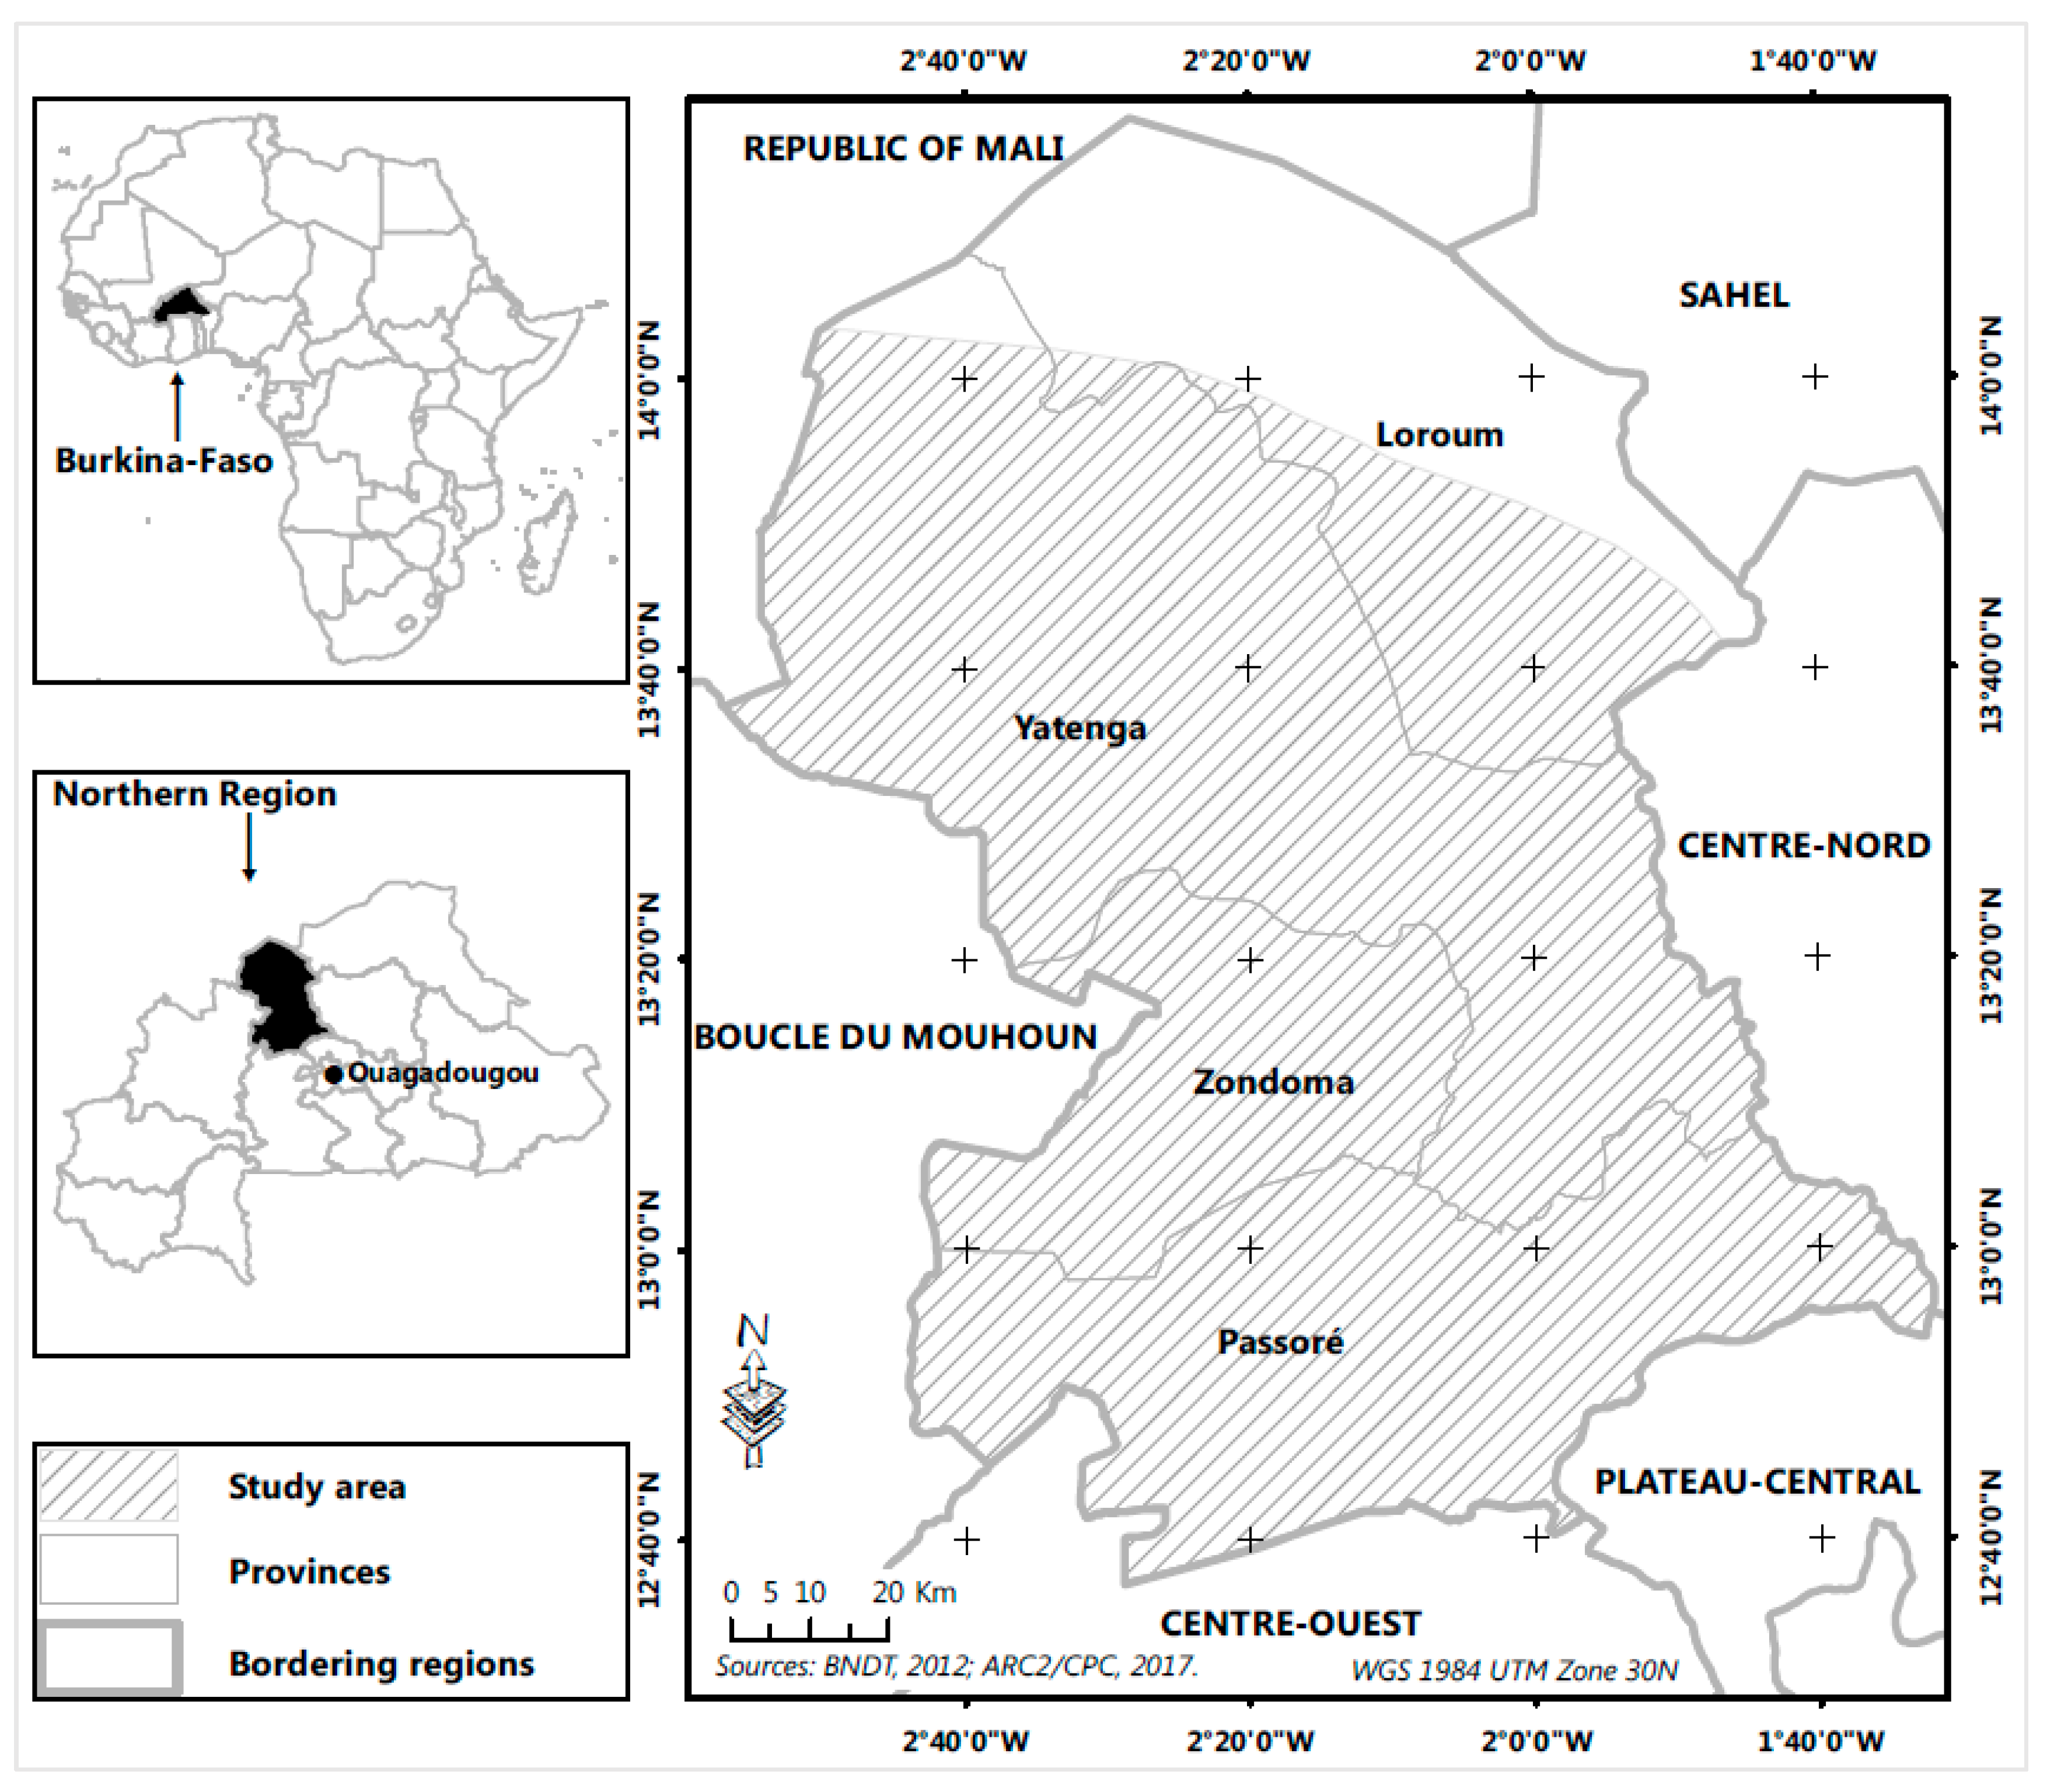
2.1. Location of the Study Area

The study was carried out in Burkina-Faso, a West African country with predominantly Sahelian climatic conditions. The country is defined according to the average annual rainfall in three main climatic zones: the Sahelian climatic zone in the north (300–600 mm/year), the Sudanian climatic zone in the south (900–1200 mm/year), and the Sudano–Sahelian climatic zone in the centre (600–900 mm/year) [4]. The study area is located in the Sudano–Sahelian climatic zone of the Northern Region of the country (Figure 1). It is located between latitudes 12°38′ and 14°02′ N and longitudes 1°33′ and 2°55′ W, and covers an area of 13,950 km2. It includes the administrative provinces of Loroum, Passoré, Yatenga, and Zondoma.

2.2. Evolution of Woody Plant Cover

The sampling sites for field observation use in this study were based on an analysis of woody plant cover change. For this, the first part of the study was to highlight by remote sensing the different categories of woody plant cover change: increase, decrease, and no-change of vegetation index (VI). The vegetation is monitored by using a series of satellite images from 1986, 1999, and 2015 of 30 m spatial resolution from Landsat 5 TM, Landsat 7 ETM+, and Landsat 8 OLI/TIRS sensors [15]. The images of the beginning of dry season (October, November) are uploaded to discriminate grasses and crops. This period marks the end of the vegetative stage of herbaceous plants and crops and a persistence of the vegetative stage in almost all Sahelian wood plants [16,17]. The images were subjected to atmospheric and terrain correction using ATCOR Ground Reflectance algorithms of PCI Geomatica 2017.
The variation of Enhanced Vegetation Index (EVI) is used as proxy for woody plant cover change. It derives from the Normalized Difference Vegetation Index (NDVI) but uses the wavelength in blue, a correction factor for ground reflectance and aerosol diffusions to reduce atmospheric effects and signals emitted by the soil below the vegetation [18,19]. This improves the accuracy of comparisons of multi-date images taken at different times under different soil and atmosphere conditions [18,19].
E V I = G   ×   ( ρ n i r ρ r ) ( ρ n i r + C 1   ×   ρ r C 2   ×   ρ b + L )
  • ρ n i r : pixel values of the near-infrared band
  • ρ r : pixel values of the red band
  • ρ b : pixel values of the blue band
  • G   : gain factor, G = 2.5
  • L: ground reflectance correction factor, L = 0.5
  • C 1   et   C 2 : correction coefficients of the aerosol diffusions, C1 = 6, C2 = 7.5.
As the purpose of this section of the study is focused on the monitoring of the woody plant cover change, the negative values of the vegetation index coming from potentially non-vegetated pixels (wetlands and water) are excluded by being reduced to zero (approximately like bare soils) [20,21]. This is important to avoid overestimating of the increase or decrease of plant cover on water surfaces at the time “n” passed in bare soils or other vegetation types at the time “n + 1” and vice versa. The method of detecting change by differentiation of vegetation index between two dates by using pixel-over-pixel comparison is used [22,23]. The different categories of change in woody plant cover between two dates: increase, decrease, and no-change of the vegetation index; highlighted were subjected to overlay analysis in order to establish the sequence of change of the woody plant cover. This is necessary to take into account in the sampling, areas where the increase, decrease, and no-change of vegetation index started in 1986 and continued until 2015 (1986–2015) and those for which it started in 1999 (1999–2015). Figure 2 highlights the different categories and sequences of woody plant cover change obtained by image analysis and use for sampling.

2.3. Sampling

The mapping of the categories and sequences of woody plant cover change was used to define the number of field observation sites. For each category and sequence of woody plant cover change, the number of observation sites (Table 1) was calculated using the normal approximation of the binomial distribution using the proportion method [24].
n = U 1 / 2 2 × p ( 1 p ) e 2
where:
  • n = the number of observation sites;
  • p   = the proportion of the considered site;
  • e   = the margin of error resulting from the estimation of any other parameter calculated from the observations, a value of 8% is considered;
  • U 1 α / 2 = the value defined by the normal law according to the desired confidence level, a 95% confidence level value for a value of U 1 α / 2   = 1.96 is considered.
The spatial distribution of the observation sites was made by a random selection on a set of systematic grid points (400 m × 400 m) covering the entire study area. A number of sites corresponding to the number defined in Table 1 were assigned to each category and sequence of change.
On the observation sites, seventy-two (72) farmers, met on their farms, were interviewed about the land-use practices they are using.

2.4. Data

The data used in this study come from the databases described below, as well as field observations and semi-directional interviews. They relate to climatic (rainfall), environmental (soil and geomorphology), and anthropogenic (land use, land cover and land-use practices) variables.

2.4.1. Rainfall

Rainfall data for 1950–2015 from five (5) stations of the National Meteorological Agency of Burkina Faso distributed homogeneously over the entire study area were used to monitor the evolution of rainfall [25]. Estimation of the spatial distribution of daily precipitation produced by “Africa Rainfall Climatology” version 2 (ARC2) on a grid of 0.1° × 0.1° [26] were used to analyze the relationship between spatial variation of vegetation index and rainfall on the temporal scale of the study (1986–2015).

2.4.2. Soils

Soil data were obtained from the soil map of Burkina Faso at the scale of 1:500,000 [27]. Five classes of soils are represented on the observation sites: Ferruginous soils, Sodic soils, Hydromorphic soils, poorly evolved soils, and Lithosols.

2.4.3. Geomorphology

The data on the geomorphology of the area were obtained by direct observation of the local relief configuration. Three forms of relief are described: shallows (deep terrain), plateau (flat terrain), and mound (relatively higher terrain in the immediate environment).

2.4.4. Land Use and Land Cover

Land-use and land-cover data were obtained by direct observation and semidirectional interviews with populations in the field. Nine (9) classes of land use and land cover are described: agroforestry park, conserved area (classified or protected forest, community forest), riparian forest, shrub savannah, wooded savannah, steppe, bare land, water surface, and habitation.

2.4.5. Land-Use Practices

Land-use practices that are favourable or unfavourable to the regeneration of woody species were identified and described by direct observation and semi-directional interviews with populations in the field. The practices with high potential for woody plant regeneration cover soils and water conservation/soils protection and restoration (SWC/SPR) and agroforestry practices, developed in the Sahel region [8,13,28,29,30]. Land-use practices that may affect the establishment and development of woody plant include: agricultural expansion, bush fire, pasture, urban development, gold panning, and wood harvesting.

2.5. Data Analysis

The evolution of rainfall in the study area is shown by calculating the standardized precipitation index according to the approach developed by [31], using rainfall data from the Ouahigouya, Yako, Téma-Bokin, Thiou, Séguenéga, and Gourcy meteorological stations from 1950 to 2015.
S P I i = P R i P ¯ R σ R
where:
  • S P I i is the regional precipitation index for a year i ;
  • P R i is the regional precipitation average of the year i ;
  • P ¯ R is the inter-annual average of the regional precipitation;
  • σ R is the standard deviation of regional precipitation P ¯ R .
The relationship between woody plant cover change and rainfall is highlighted by regression analysis between spatial variation in vegetation index and the average rainfall over the period 1986–2015 [32]. The vegetation index data is resampled to match the spatial resolution of rainfall data by using the nearest neighbour’s method [33]. The relationship between the categories of woody plant cover change (increase, decrease, and no-change of the vegetation index) and environmental, anthropogenic variables is verified by the Chi-Squared test (χ2) [32]. Modalities of soil, land use and land cover, and land-use practices variables are grouped to have expected values of at least 5 in cell of the contingency table. The Ferruginous soils, Sodic soils and Hydromorphic soils of the soil variable, poorly represented, are grouped under the name “other soils.” The bare land, habitation, and water surface of the land-use and land-cover variables are grouped under the name of “no-vegetation,” while conserved area, riparian forest, savannah, and steppe are grouped under the name of “natural vegetation.” The modalities of the land-use practices variable are grouped into three classes: Planting/Anr (planting, assisted natural regeneration and fallow), SWC/SPR (animal parking in the farm, earth bund, grass strip, half-moon, mulching, organic amendment, stones dyke barrier, stone row, vegetated earth bund, vegetated stone row, woody strip, and zaï), and tree-threatening practices (agricultural expansion, bush fire, pasture, urban development, gold panning, and wood harvesting). The first two groups are practices with high potential for woody plant regeneration or agroforestry practices. A correspondence analysis is performed with the dependent variables to bring out the modalities of the environmental and anthropogenic variables characteristic of each category of woody plant cover change.

3. Results

3.1. Evolution of Rainfall in the Study Area

The standardized precipitation index shows that the study area suffered from the droughts of the 1970s–1980s (Figure 3). The wet years of the 1950s, which continued into the early 1960s, quickly gave way to a long period of dry years (1970s–1980s), characterized by a succession of negative rainfall anomalies. A slight recovery of rainfall is observed from the 1990s. This recovery, however, does not show a clear trend and is characterized by an alternation of positive and negative rainfall anomalies until 2005, when a regularity of rainy years seems to settle down (Figure 3).

3.2. Environmental Characteristics of Observed Sites

The observed sites are based on five (5) soil classes dominated by the poorly evolved soils (Table 2). The latter accounts for 55% of sites located where vegetation index increased, 62% of sites where vegetation index decreased, and 56% of sites where vegetation index remained no-change.
The geomorphological characteristics of the observed sites shows a predominance of the plateaus which shelter 53% of sites where vegetation index increased, 53% of sites where vegetation index decreased, and 70% of sites where vegetation index remained no-change. However, a rather remarkable number (45%) of sites where vegetation index decreased is observed on mounds (Table 2).

3.3. Landscape Characteristics of Observed Sites

On a landscape level, nine land-use and land-cover classes are observed on all sites (Table 3). The distribution of classes by category of woody plant cover change shows that agroforestry park (55%) and shrub savannah (26%) dominate sites with increasing vegetation index. On sites with decreasing vegetation index, the most represented classes are bare land (51%) and agroforestry park (26%), while bare land (44%), water surface (19%), and habitation area (15%) dominate on sites with no-change vegetation index.

3.4. Land-Use Practices

Field observations and interviews reveal fifteen (15) practices with high potential for woody plant regeneration and six (6) practices with high risk for woody plant deterioration. The description and role in the regeneration or deterioration of the woody plant cover of all practices has been documented in the literature and from our experience, and is presented in Appendix A.
The highest frequencies of practices with high potential for woody plant regeneration are observed in areas with increasing vegetation index (Figure 4). Assisted natural regeneration and zaï are the most commonly observed practices.
Practices with high potential for woody plant regeneration are generally combined (Table 4). Thirty-nine (39) combinations of practices were observed, of which thirty-eight (38) were observed on 47% of sites where vegetation index increased.
Plantations and Anr on one side, and zaï, grass strip, and stones row on the other side, are the most involved practices in combinations. Figure 5 shows the number of times the practice has been observed in combination with other practices as a percentage of the number of observations made in each category of woody plant cover change. Practices with high potential for woody plant regeneration are particularly implemented in agroforestry park with frequencies of 95% and 68%, respectively, for Planting/Anr and SWC/SPR practice groups (Figure 6).
Practices with high risk for woody plant degradation are best illustrated in areas with decreasing or no-changed vegetation index (Figure 7). Wood harvesting, pasture, and urban development are the commonly observed practices. They are most observed in natural vegetation and no-vegetation areas (Figure 6).

3.5. Relationship Between Woody Plant Cover Change and Rainfall

The linear regression analysis between the change in the vegetation index and the annual rainfall mean recorded between 1986 and 2015 shows that the percentage of variability in vegetation index explained by rainfall is low (Figure 8). The coefficient of determination of the linear regression model R2 = 0.09 with a degree of overall significance p < 0, 0001 * associated to the model. In other words, 91% of the variability in the vegetation index is explained by other factors. This fully justifies exploring the other factors.

3.6. Relationship Between Woody Plant Cover Change and Environmental/Anthropogenic Variables

The Chi-Squared independence tests between the categories of woody plant cover change and the environmental and anthropogenic variables show that the evolution of the woody plant cover strongly depends on factors such as the geomorphology of the area (p = 0.0018 *), land use and land cover (p < 0.0001 *), and land-use practices (p < 0.0001 *) (Table 5). Anthropogenic variables are best correlated with changes in woody plant cover with the lowest probability values. The dependence between the categories of woody plant cover change and soil classes, on the other hand, is not proven to go well beyond the limit of p = 0.05 (Table 5).

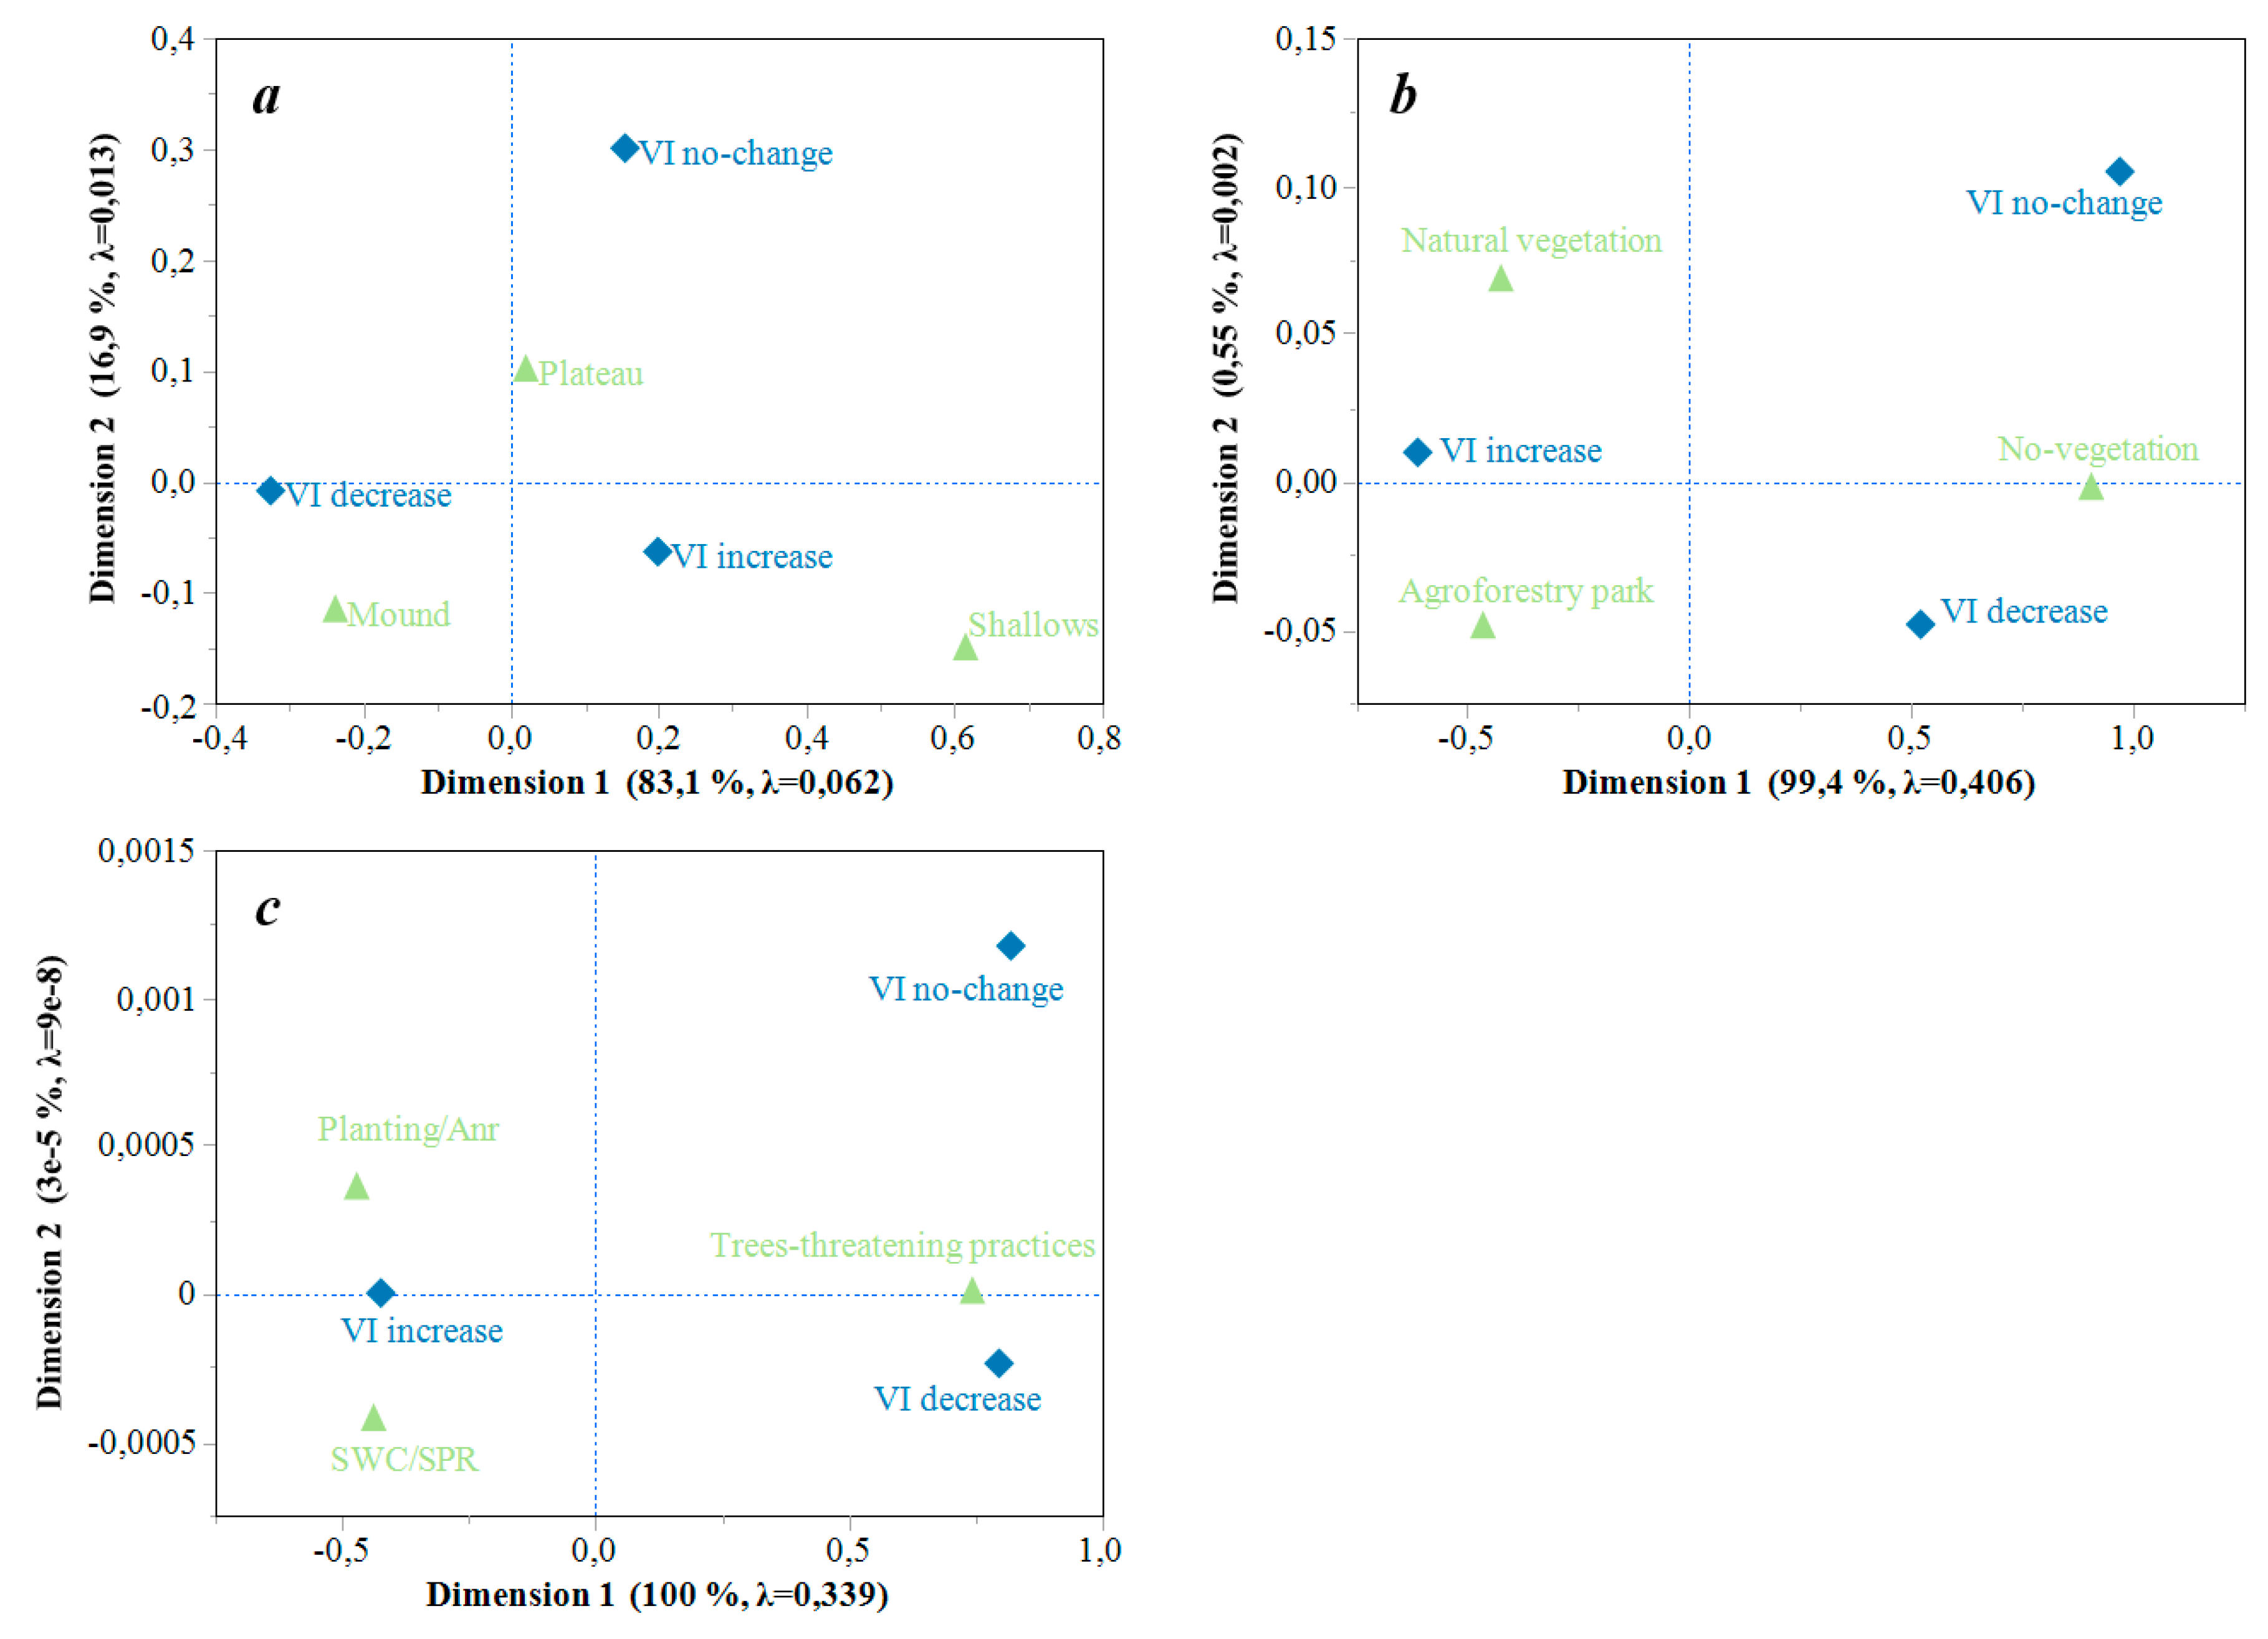
3.6.1. Woody Plant Cover Change and Geomorphology

The difference in the independence of the correspondence analysis is explained at 83% by dimension 1 of the graph, which contrasts the sites in decrease of vegetation index with those in increase and no-change of vegetation index (Figure 9a). Dimension 2, which explains 17% of the difference in the independence, contrasts sites with an increase of vegetation index with those with vegetation index no-change. The distribution of the modalities of the two variables shows that the decrease in the vegetation index is observed preferentially on the mounds while the shallows are the places of preference for vegetation index increase (Figure 9a).

3.6.2. Woody Plant Cover Change and Land Use, Land Cover

The Correspondence analysis shows that the sites with increasing vegetation index are opposed to those with decreasing and no-changed vegetation index by dimension 1, which explains 99% of total inertia (Figure 9b). The distribution of the modalities of the two variables shows that the increase in the vegetation index is more attached to agroforestry park but also to natural vegetation (steppes, savannah, riparian forest, or conserved area) (Figure 9b). The decrease and no-change of the vegetation index, on the other hand, is preferably observed on no-vegetation areas (habitation area, bare land, and water surface) (Figure 9b).

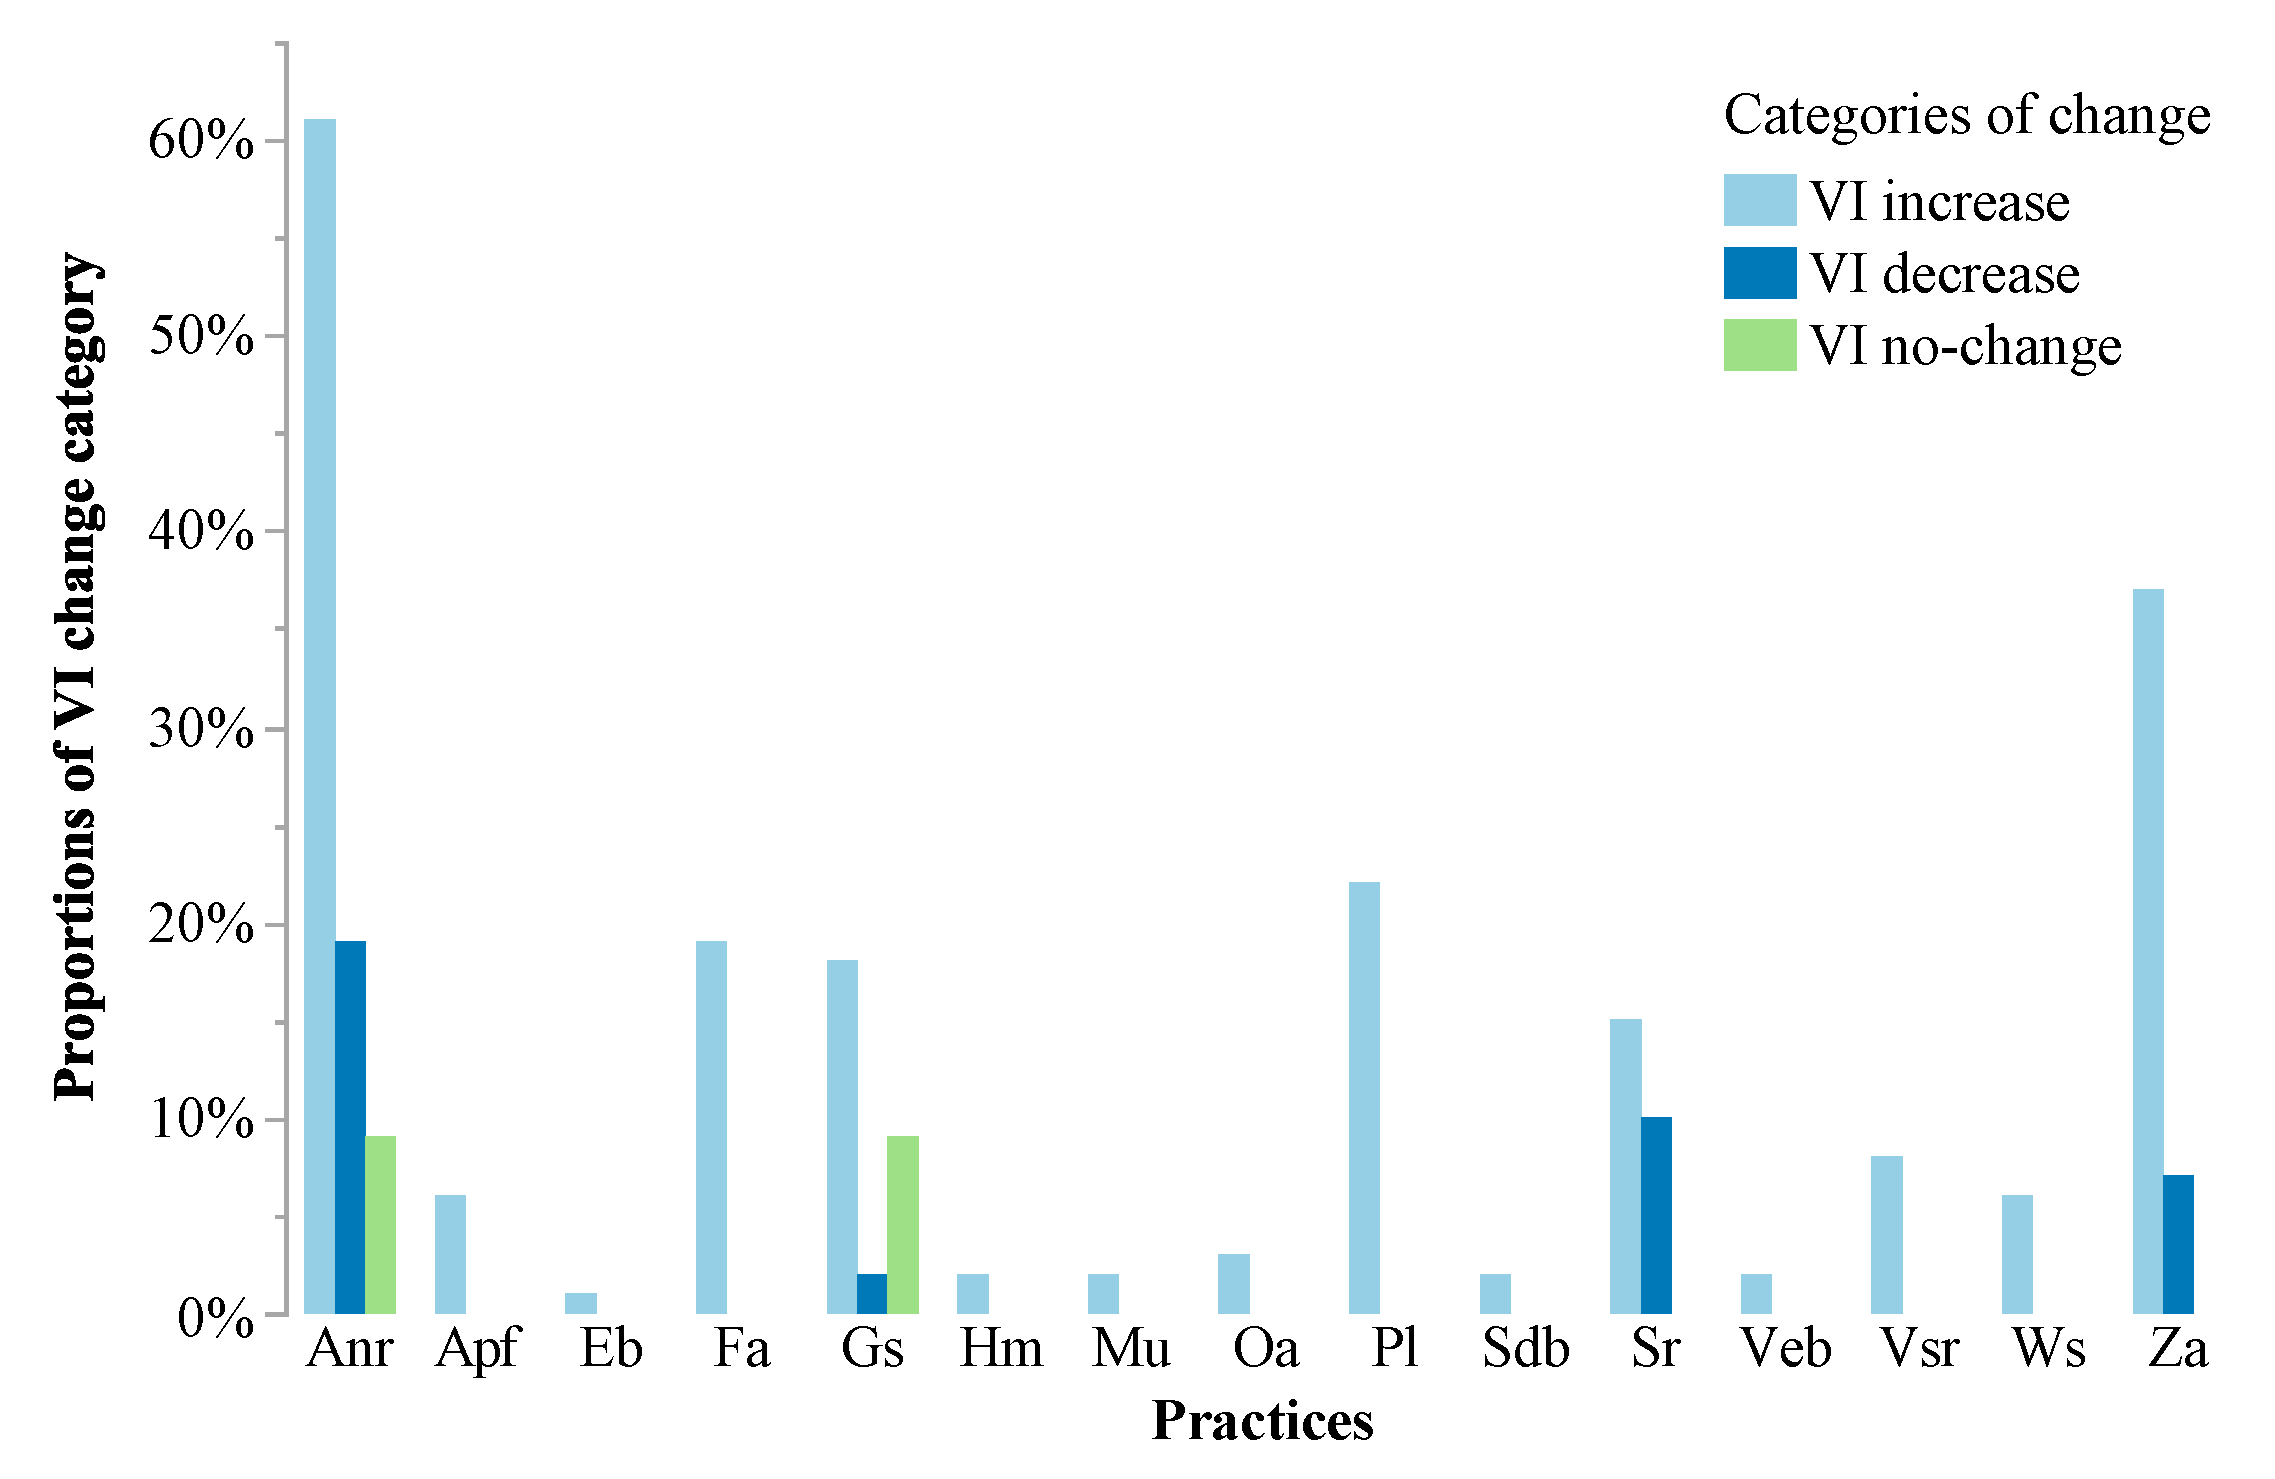
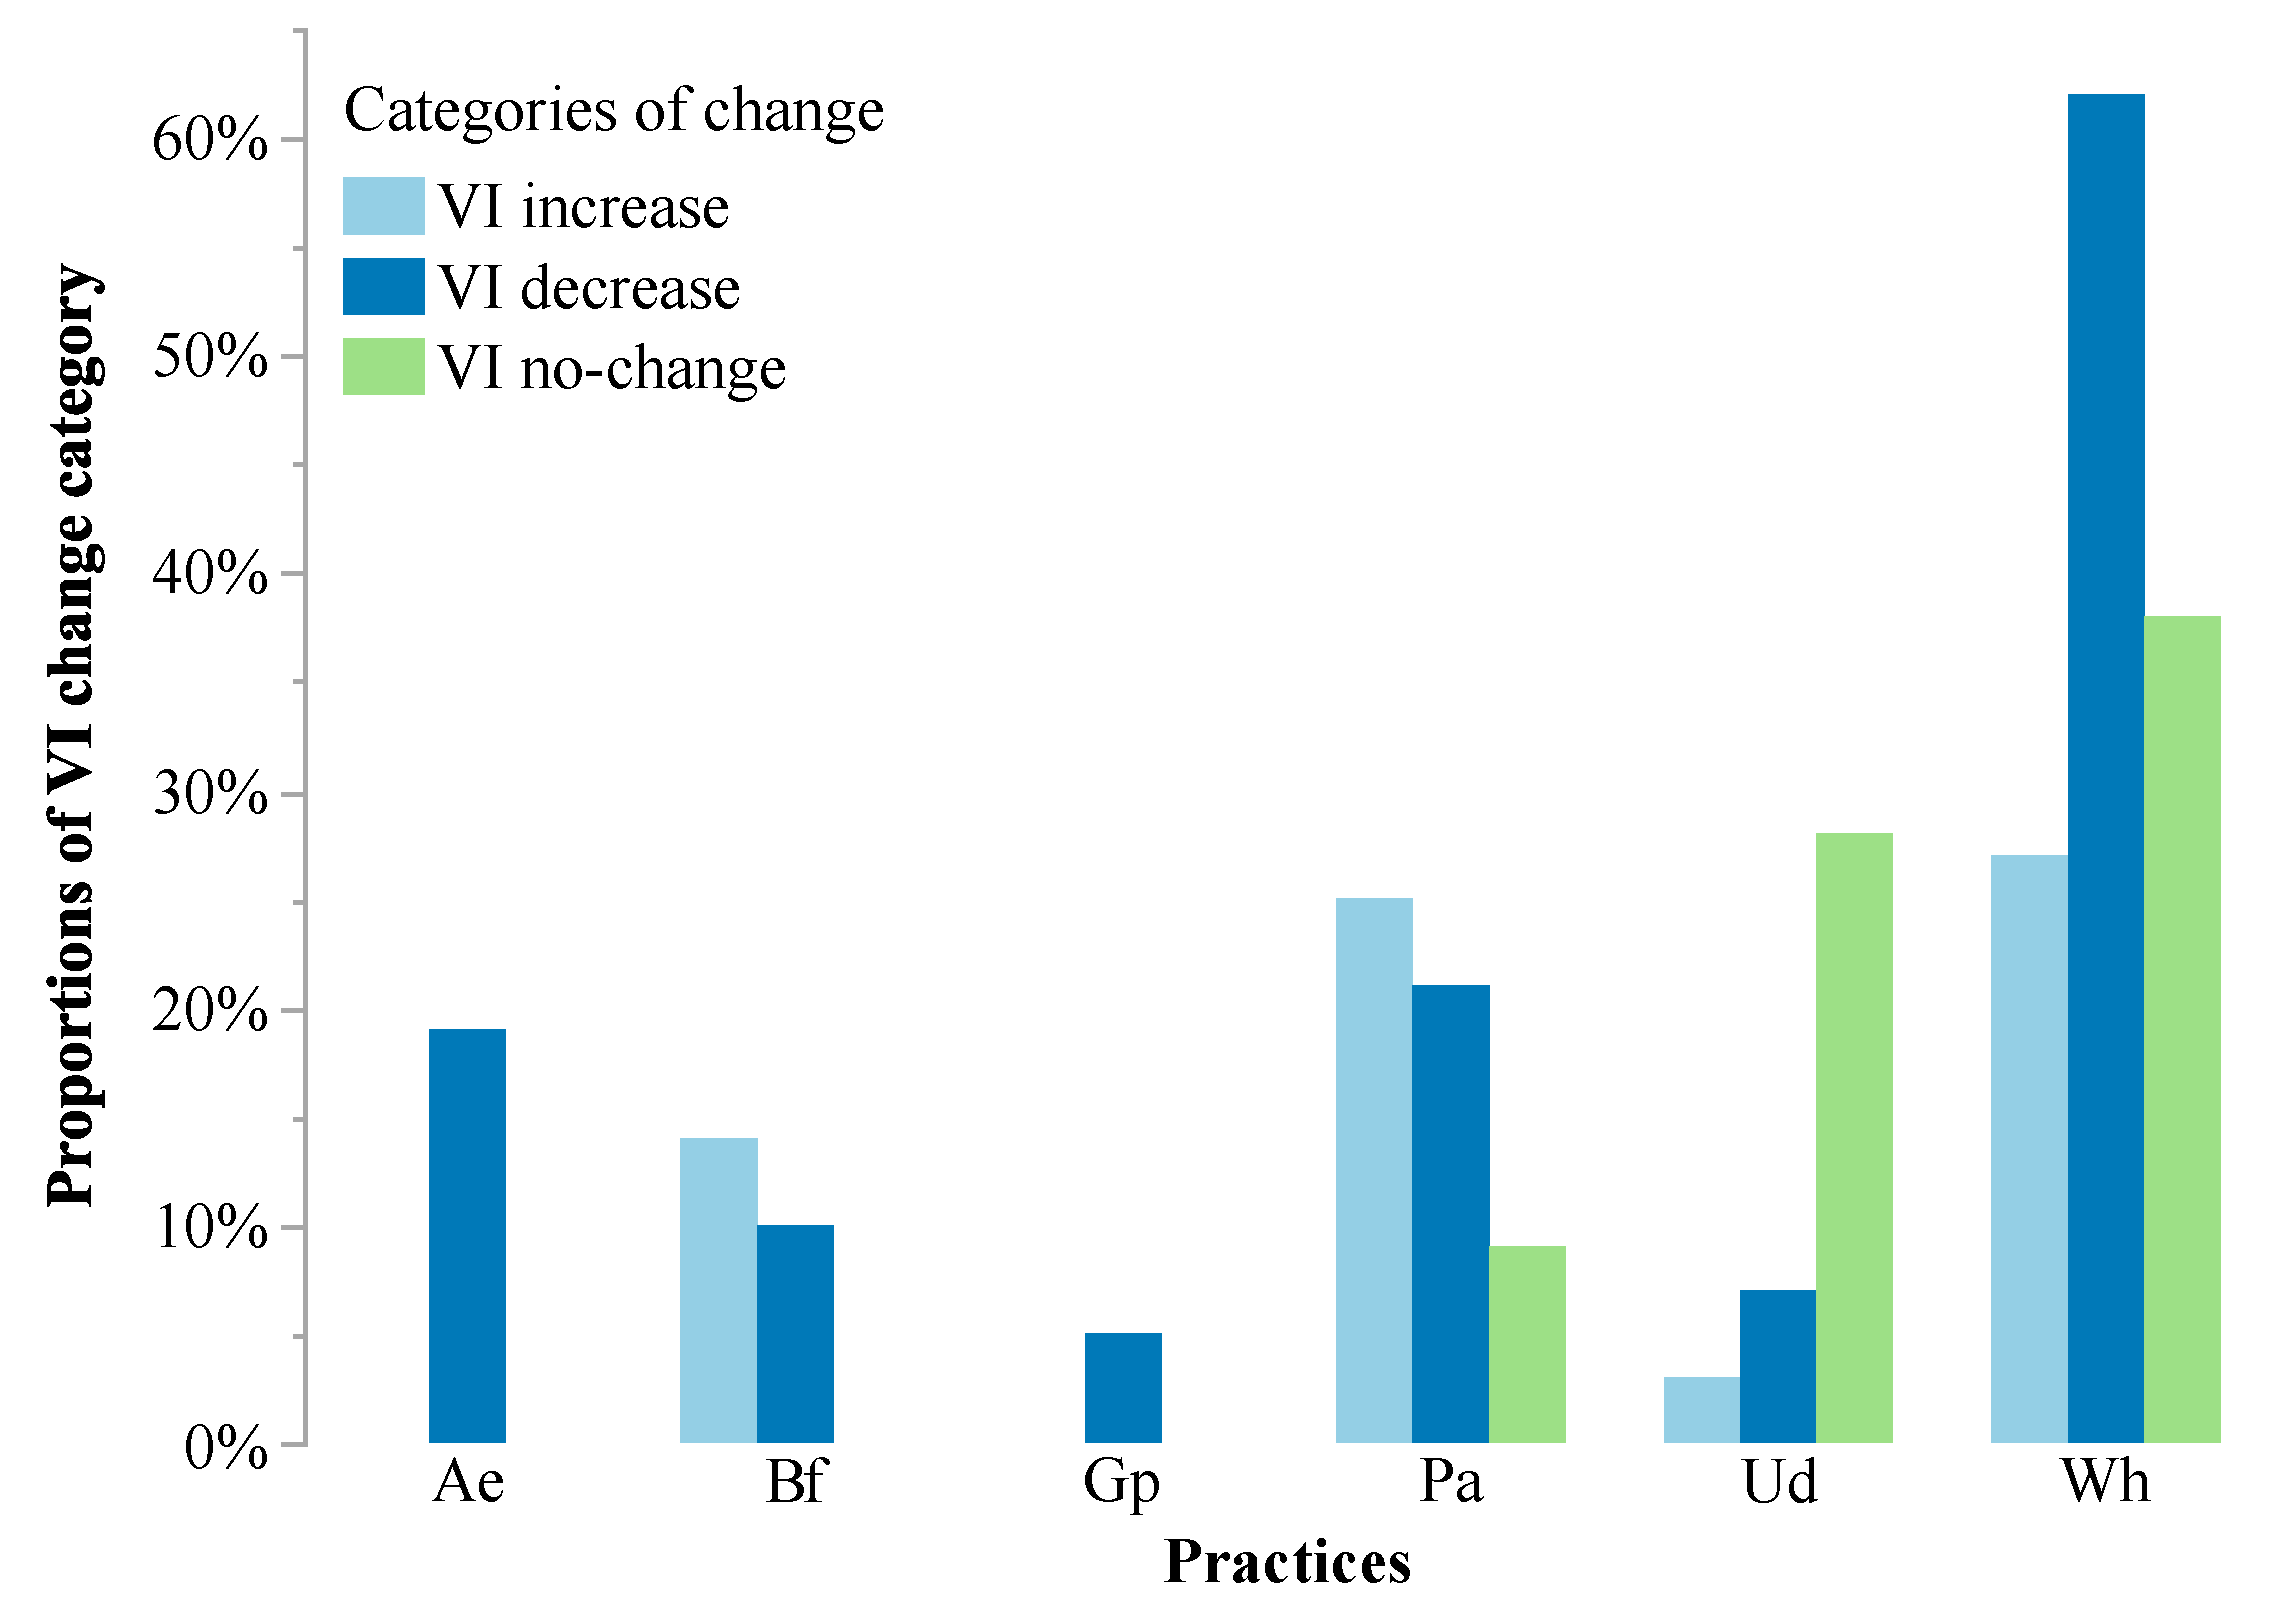
3.6.3. Woody Plant Cover Change and Land-Use Practices

The sites in increase of vegetation index are opposed to those in decrease and no-change of the vegetation index by dimension 1 of the graph of correspondence analysis, which explains the quasi-totality of the total inertia observed (Figure 9c). The sites in increase of vegetation index are characterized by the SWC/SPR and Plantation/Anr practice groups (Figure 9c), dominated by the practices of zai, stones row, grass strips on one side, and planting and assisted natural regeneration on the other (Figure 4). Otherwise, practices with high potential for wood degradation characterize sites with decreasing and no-changed vegetation index (Figure 9c).

4. Discussion

The results of this study show a strong dependence between changes in woody plant cover and variables such as the geomorphology of the area, land use and land cover, and land-use practices, in order of increasing importance.
The decrease of woody plant cover is observed preferentially on the mounds, while the shallows are the preferred areas of improvement of woody plant cover. This emergence of vegetation at the bottom of the slope at the expense of heights is widely observed in many landscapes [36,37]. Lateral drainage and accumulation of sediment, nutrients, and water at the bottom of slopes are favourable to plant germination, survival, and development [38,39].
The improvement of woody plant cover in agroforestry parks is facilitated by the forestry potential of agricultural practices (SWC/SPR) largely developed in the Sahel after the 1970s–1980s droughts to cope with climatic and environmental constraints [5,6,7]. The improvement of woody plant cover can also be explained by the growing awareness of the socioeconomic and ecological roles of ligneous plants in adaptation to climate change (diversification of income sources, food, energy, crafts, soil fertility, spirituality, climate regulation, etc.) [17,40]. In addition, the scarcity of forest reserves with forest products (woody and not) [41] has led people to plant and/or maintain woody trees on their farms. Trees on farm are therefore increasingly included in the family patrimony on which the farmer exercises a right of ownership. Woody species such as Piliostigma reticulatum and Guiera senegalensis, once marginalized, are valued and help to protect and restore soil fertility on farms [28].
Land use and land cover, and land-use practices are anthropogenic variables that fall under land management forms and are interrelated [42]. They reflect the human will and reveal the important role of man in the evolution of the ecological trajectory of ecosystems [43,44]. In many situations, man is perceived as a factor of degradation because of the pressures he exerts on natural resources [45,46]. However, despite an increase in the population of the study area [47], the area is experiencing an improvement in woody plant cover since the end of the 1970s–1980s droughts. This trend observed in this part of the Sahelian area, composed mainly of agropastoralists, testifies to the strong resilience and adaptability of the populations [13]. The human, socioeconomic and environmental damage of the 1970s–1980s droughts [1,2,3] have quickly forced people to improve their production and natural resources management of systems [5,10,48]. The agricultural practices described above, which have a high potential for woody plant regeneration, have been developed and characterize the areas in improvement of woody plant cover. Although practices that compromise the establishment and development of trees are also observed in these areas (improving woody plant cover), they are not important enough to lead to degradation. Conversely, in areas with decreasing woody plant cover, practices with high potential for woody plant regeneration are sometimes observed but are not important enough to prevent degradation. As in any socioecological system, the dynamics of the area operates according to the state of the system in the direction of the dominant variables (uncontrolled natural phenomena and management decisions) [49,50].
The lack of correlation between changes in woody plant cover and rainfall observed in this study is also observed elsewhere [51,52]. Similar results were observed in the Sudano–Sahelian area in Mali by [51], which show a lack of a clear trend of recovery of rainfall with, however, a strong increase in the vegetation index between 1982 and 2006. The same observation is made for a large part of Senegal which, between 1982 and 2007, records a significant regreening with, however, a nonsignificant increase in rainfall [52]. These results suggest that above a minimum rainfall threshold, agrosylvopastoral and socioecological practices further determine woody plant regeneration. Water availability remains one of the determining factors in the development of plants in the Sahel [3,11]. A deterioration in floristic diversity was observed in the Sahel after the 1970s–1980s drought compared to the predrought situation [11,53]. Plants are therefore not insensitive to the resumption of rainfall, but once a minimum threshold is reached, its effect is eclipsed by that of land use and management practices. The improvement of plant cover on natural vegetation more prone to degradation actions is, moreover, to be attributed to the pedoclimatic conditions mainly. This confirms the results and observations of other authors [54,55,56].
Although the dependence between changes in woody plant cover in agrosystems and the pedoclimatic factors is not statistically significant, they are crucial in the dynamics of flora and vegetation [54,55]. The soil serves as a support, a reservoir of water, and provides the mineral elements necessary for plant growth [57]. Ref [58] has concluded in his work that soil types are mainly responsible for the recovery of vegetation in the African Sahel. The dominance of a single soil class (Poorly evolved soils) in the study area could justify the independence between soils and change in woody plant cover observed.

5. Conclusions

In agrosystems, rainfall alone is not sufficient to explain the dynamics of woody plant cover. Agricultural and social practices related to the dynamics of farmer perceptions play a key role. These practices can be more decisive than rainfall in the establishment and development of woody plants. This highlights the central role of man in the fight against desertification and land degradation. Practices with high potential for woody plant regeneration are commonly observed throughout the study area, even in areas of decreased woody plant cover. However, on the latter, harmful practices to tree development are more important and lead to degradation. Containing these harmful practices could stimulate the woody plant regeneration of these areas on which the practices with high potential of woody plant regeneration are already implemented. It is therefore important, in order to optimise actions to combat deforestation and land degradation, that the factors likely to influence the adoption of the land-use practices highlighted in this study be explored for a better understanding of the underlying causes of their adoptions. One hypothesis would be socioeconomic conditions. The cost of practices, the land status of farms (inheritance, donation, lending, and purchase of land), the level of poverty and education of farmers, seem to us to be rather important factors to take into account.

Author Contributions

Conceptualization, W.A.Z., B.A.B., and J.-P.W.; Data curation, W.A.Z.; Formal analysis, W.A.Z.; Funding acquisition, W.A.Z., B.A.B., and J.-P.W.; Investigation, W.A.Z.; Methodology, W.A.Z., B.A.B. and J.-P.W.; Project administration, W.A.Z., B.A.B., and J.-P.W.; Resources, W.A.Z., B.A.B. and J.-P.W.; Software, W.A.Z.; Supervision, W.A.Z., B.A.B., and J.-P.W.; Validation, W.A.Z., B.A.B., and J.-P.W.; Visualization, W.A.Z., B.A.B., and J.-P.W.; Writing—original draft, W.A.Z., B.A.B., and J.-P.W.; Writing—review & editing, W.A.Z., B.A.B., and J.-P.W.

Funding

This research was funded by Canadian Francophonie Scholarship Program (CFSP) and Conflict and Cooperation over Natural Resources in Developing Countries (CoCooN) Program of Dutch Cooperation.

Acknowledgments

We thank the Canadian Francophonie Scholarship Program (CFSP) and the Conflict and Cooperation over Natural Resources in Developing Countries (CoCooN) Program of Dutch Cooperation for their financial support. We would like also to thank Emmanuel Amoah Boakye, Michel Ouédraogo, and reviewers for their insightful comments and suggestions.

Conflicts of Interest

The authors declare no conflict of interest.

Appendix A. Description of Land-Use Practices Observed that Affect Tree Dynamics

Table A1. High potential practices for woody plant regeneration.
PracticesDescriptions Role in Trees Regeneration and Development
Assisted natural regenerationAssisted natural regeneration is to protect and maintain forest species growing naturally in farms or natural areas
-
Increases water infiltration, retains soil moisture through to pockets often made around trees
-
Improves tree nutrition through to the organic matter brought to the associated crops
-
Increases strength and survival of seedlings through mentoring, protection, and monitoring
Animal parking in the farmAnimal parking in the farm consists of nightly stocking of cattle, sheep, and goats on farm to improve the manure stock in dry season and fallow land intended for cultivation the following year in the rainy season
-
Manure brought is generally rich in forest seeds
-
Increases water infiltration, retains soil moisture through improved soil structure
-
Improves soil fertility and tree nutrition
Earth bundsEarth bunds are compacted earth structures in the form of low walls aligned along the contour lines generally
-
Slows water runoff and facilitates the trapping and germination of forest seed
-
Increases water infiltration and retains soil moisture
-
Facilitates accumulation of organic debris, and thus improves soil fertility and tree nutrition
FallowFallow-land consists of leaving land under agricultural holding for a longer or shorter period of time
-
Slows water runoff and facilitates trapping and germination of forest seed due to the high density of plants that constitute biological barriers
-
Increases water infiltration, and retains soil moisture due to the high density of plants that create a screen effect, reducing evaporation and improving soil structure through their root systems
-
Improves soil fertility due to decomposition of growing plant biomass and tree nutrition
Grass stripsGrass strips are biological barriers made up of herbaceous plants (Andropogon gayanus, Andropogon ascinodis, and Pennisetum pedicellatum generally), installed in farms following the contour lines generally
-
Slows water runoff and facilitates the trapping and germination of forest seed
-
Increases water infiltration and retains soil moisture
-
Facilitates accumulation of organic debris, and thus improves soil fertility and tree nutrition
Half-moonsHalf-moons are structures of compacted earth or stones in the shape of a semicircular with openings perpendicular to the direction of water flow and arranged in quincunxes; the earth inside the half-moons is enriched in organic manure
-
Manure brought is generally rich in forest seeds
-
Half-moons facilitate the trapping and germination of forest seeds carried by run-off water
-
Increases water infiltration, and retain soil moisture
-
Improves soil fertility and tree nutrition
ZaïZaï consists of digging pits of 0.7 to 1.2 m distance during the dry season, introducing organic manure and then waiting for the rains to disseminate the agricultural seeds in the middle of these pits
-
Manure brought is generally rich in forest seeds
-
Pits facilitate the trapping and germination of forest seeds carried by run-off water
-
Increases water infiltration, and retains soil moisture
-
Improves soil fertility and tree nutrition
MulchingMulching consists of covering the soil with a layer of grass (Loudetia togoensis generally) or with branches or crop residues (millet or sorghum) to ensure soil cover
-
Facilitates the trapping and germination of forest seeds carried by run-off water
-
Increases water infiltration, and retains soil moisture
-
Improves soil fertility due to the decomposition of plant debris and tree nutrition
Organic amendmentsOrganic amendments consist of the application of organic manure coming from cowsheds, composting, and household waste
-
Manure brought is generally rich in forest seeds
-
Increases water infiltration, retains soil moisture through improved soil structure
-
Improves soil fertility and tree nutrition
PlantingTree planting consists of planting seedlings on farms or sylvopastoral areas
-
Increases the number of standing trees available
Stone dyke barriersStone dyke barriers are mechanical structures composed of stones placed upstream of a gully head to stop the gully erosion and allow a lowland farming
-
Slows water runoff and facilitates the trapping and germination of forest seed
-
Increases water infiltration and retains soil moisture
-
Facilitates accumulation of organic debris, and thus improves soil fertility and tree nutrition
Stones rowStones rows are mechanical structures composed of stones aligned along contour lines generally
-
Slows water runoff and facilitates the trapping and germination of forest seed
-
Increases water infiltration and retains soil moisture
-
Facilitates accumulation of organic debris, and thus improves soil fertility and tree nutrition
Vegetated earth bundsVegetated earth bunds are compacted earth structures in the form of low walls aligned along the contour lines generally and associated with woody or grassy strips
-
Slows water runoff and facilitates the trapping and germination of forest seed
-
Increases water infiltration and retains soil moisture
-
Facilitates accumulation of organic debris, and thus improves soil fertility and tree nutrition
Vegetated Stones rowVegetated stones rows are mechanical structures composed of stones aligned along contour lines generally and associated with woody or grassy strips
-
Slows water runoff and facilitates the trapping and germination of forest seed
-
Increases water infiltration and retains soil moisture
-
Facilitates accumulation of organic debris, and thus improves soil fertility and tree nutrition
Woody stripsWoody strips are biological barriers consisting of trees and shrubs, installed in farms following the contours lines
-
Slows water runoff and facilitates the trapping and germination of forest seed
-
Increases water infiltration and retains soil moisture
-
Facilitates accumulation of organic debris, and thus improves soil fertility and tree nutrition
Table A2. High risk practices for woody plant decrease.
PracticesDescriptions Role in Trees Regression
Agricultural expansionAgricultural expansion consists of clearing a wooded area of trees to increase the cultivated area of an existing farm or to develop a new farm
-
Destroys plants (fires, cutting and uprooting of standing trees)
-
Destroys soils: reduced soil fertility due to loss of soil organic matter, exposure to runoff, erosion and leaching
-
Reduces soil water infiltration and water availability due to degradation of soil structure, loss of soil biomass and intense evaporation favoured by soil exposure
Bush firesBush fires are fires of natural (lightning) or human (intentional or unintentional) origin that spread over forested areas
-
Destroys plants
-
Destroys soils: reduced soil fertility due to loss of soil organic matter, exposure to runoff, erosion and leaching
-
Reduces soil water infiltration and availability due to degradation of soil structure, loss of soil biomass and intense evaporation favoured by soil exposure
Gold panningGold panning refers to the artisanal gold mining and research activities that sometimes occurs in wooded areas
-
Destroys plants (fires, cutting, and uprooting of standing trees)
-
Pollutes soils and intoxicates plants
-
Destroys soils: reduced soil fertility due to loss of soil organic matter, exposure to runoff, erosion and leaching
-
Reduces soil water infiltration and availability due to degradation of soil structure, loss of soil biomass and intense evaporation favoured by soil exposure
PasturePasture refers to the extensive breeding of sheep, goats, and cattle in sylvopastoral areas
-
Destroys plants
-
Could, when the carrying capacity of pastures is not exceeded, contribute to woody regeneration through the dissemination of seeds and the fertilization of rangelands
Urban developmentUrban development here refers to the expansion of cities at the expense of wooded areas
-
Destroys plants (cutting and uprooting of standing trees)
Wood harvestingWood harvesting refers to the exploitation of firewood for household consumption needs mainly
-
Destroys plants
-
Destroys soils: reduced soil fertility due to loss of soil organic matter, exposure to runoff, erosion and leaching
-
Reduces soil water infiltration and water availability due to degradation of soil structure, loss of soil biomass and intense evaporation favoured by soil exposure
[5,6,13,28,29,48].

References

  1. Bonnecase, V. Retour sur la famine au sahel du début des années 1970: La construction d’un savoir de crise. Polit. Afr. 2010, 119, 23–42. [Google Scholar] [CrossRef]
  2. Brandt, M.; Romankiewicz, C.; Spiekermann, R.; Samimi, C. Environmental change in time series–An interdisciplinary study in the Sahel of Mali and Senegal. J. Arid Environ. 2014, 105, 52–63. [Google Scholar] [CrossRef]
  3. Doso-Jnr, S. Land degradation and agriculture in the Sahel of Africa: Causes, impacts and recommendations. J. Agric. Sci. Appl. 2014, 3, 67–73. [Google Scholar] [CrossRef]
  4. Thiombiano, A.; Kampmann, D. Biodiversity Atlas of West Africa, Volume II: Burkina Faso; Druckerei Grammlich: Pliezhausen, Germany, 2010; p. 592. [Google Scholar]
  5. Reij, C.; Tappan, G.; Belemvire, A. Changing land management practices and vegetation on the Central Plateau of Burkina Faso (1968–2002). J. Arid Environ. 2005, 63, 642–659. [Google Scholar] [CrossRef]
  6. Botoni, E.; Reij, C. La Transformation Silencieuse de L’environnement et des Systèmes de Production au Sahel: Impacts des Investissements Publics et Privés Dans la Gestion des Ressources Naturelles; Centre for International Cooperation (CIS)/Comité permanent Inter-États de Lutte contre la Sécheresse dans le Sahel (CILSS): Ouagadougo, Burkina Faso, 2009; pp. 1–63. [Google Scholar]
  7. Reij, C.; Tappan, G.; Smale, M. Agroenvironmental Transformation in the Sahel: Another Kind of “Green Revolution”; IFPRI Discussion Paper 00914; International Food Policy and Research Institute: Washington, DC, USA, 2009. [Google Scholar]
  8. Zampaligré, N.; Fuchs, L.E. Determinants of Adoption of Multiple Climate-Smart Adaptation Practices in Sudano-Sahelian Pastoral and Agro-Pastoral Production Systems. Sustainability 2019, 11, 4831. [Google Scholar] [CrossRef]
  9. Anyamba, A.; Tucker, C.J. Analysis of Sahelian vegetation dynamics using NOAA-AVHRR NDVI data from 1981–2003. J. Arid Environ. 2005, 63, 596–614. [Google Scholar] [CrossRef]
  10. Olsson, L.; Eklundh, L.; Ardö, J. A recent greening of the Sahel-trends, patterns and potential causes. J. Arid Environ. 2005, 63, 556–566. [Google Scholar] [CrossRef]
  11. Epule, E.T.; Peng, C.; Lepage, L.; Chen, Z. The causes, effects and challenges of Sahelian droughts: A critical review. Reg. Environ. Chang. 2014, 14, 145–156. [Google Scholar] [CrossRef]
  12. Bamba, A.; Dieppois, B.; Konaré, A.; Pellarin, T.; Balogun, A.; Dessay, N.; Kamagaté, B.; Savané, I.; Diédhiou, A. Changes in Vegetation and Rainfall over West Africa during the Last Three Decades (1981-2010). Atmos. Clim. Sci. 2015, 5, 367–379. [Google Scholar] [CrossRef] [Green Version]
  13. Epule, T.E.; Ford, J.D.; Lwasa, S.; Lepage, L. Climate change adaptation in the Sahel. Environ. Sci. Policy 2017, 75, 121–137. [Google Scholar] [CrossRef]
  14. Herrmann, S.M.; Hutchinson, C.F. The changing contexts of the desertification debate. J. Arid Environ. 2005, 63, 538–555. [Google Scholar] [CrossRef]
  15. USGS. Satellite Image Data Source. 2017. Available online: https://glovis.usgs.gov/app (accessed on 17 April 2017).
  16. Hiernaux, P.; De-Leeuw, P.N.; Diarra, L. Modelling tillering of annual grasses as a function of plant density: Application to Sahelian rangelands productivity and dynamics. Agric. Syst. 1994, 46, 121–139. [Google Scholar] [CrossRef]
  17. Brandt, M.; Hiernaux, P.; Rasmussen, K.; Mbow, C.; Kergoat, L.; Tagesson, T.; Ibrahim, Y.Z.; Wélé, A.; Tucker, C.J.; Fensholt, R. Assessing woody vegetation trends in Sahelian drylands using MODIS based seasonal metrics. Remote Sens. Environ. 2016, 183, 215–225. [Google Scholar] [CrossRef] [Green Version]
  18. Huete, A. A soil-adjusted vegetation index (SAVI). Remote Sens. Environ. 1988, 25, 295–309. [Google Scholar] [CrossRef]
  19. Huete, A.; Didan, K.; Miura, T.; Rodriguez, E.; Gao, X.; Ferreira, L. Overview of the radiometric and biophysical performance of the MODIS vegetation indices. Remote Sens. Environ. 2002, 83, 195–213. [Google Scholar] [CrossRef]
  20. Jamali, S.; Seaquist, J.; Eklundh, L.; Ardö, J. Automated mapping of vegetation trends with polynomials using NDVI imagery over the Sahel. Remote Sens. Environ. 2014, 141, 79–89. [Google Scholar] [CrossRef]
  21. Yao, R.; Wang, L.; Huang, X.; Chen, X.; Liu, Z. Increased spatial heterogeneity in vegetation greenness due to vegetation greening in mainland China. Ecol. Indic. 2019, 99, 240–250. [Google Scholar] [CrossRef]
  22. Gandhi, G.M.; Parthiban, S.; Thummalu, N.; Christy, A. Ndvi: Vegetation Change Detection Using Remote Sensing and Gis-A Case Study of Vellore District. Procedia Comput. Sci. 2015, 57, 1199–1210. [Google Scholar] [CrossRef]
  23. Jamali, S.; Jönsson, P.; Eklundh, L.; Ardö, J.; Seaquist, J. Detecting changes in vegetation trends using time series segmentation. Remote Sens. Environ. 2015, 156, 182–195. [Google Scholar] [CrossRef]
  24. Dagnelie, P. Statistiques Théoriques et Appliquées. Tome 1: Statistique Descriptive et Bases de L’influence Statistique; De Boeck et Larcier: Paris, France; Brussells, Belgium, 1998. [Google Scholar]
  25. ANAM-BF. Données Pluviométriques; Agence Nationale de la Météorologie: Ouagadougou, Burkina-Faso, 2017. [Google Scholar]
  26. CPC. Africa Rainfall Climatology (ARC2) Version 2.0 Data. 2017. Available online: https://www.cpc.ncep.noaa.gov/ (accessed on 17 April 2017).
  27. ORSTOM. Carte Pédologique de Reconnaissance de la République de Haute-Volta, Échelle: 1:500,000; Centre ORSTOM de Dakar; Office de la Recherche Scientifique et Technique Outre-mer: Dakar, Sénégal, 1973. [Google Scholar]
  28. Bationo, B.A.; Kalinganire, A.; Bayala, J. Potentialités des Ligneux Dans La Pratique de L’agriculture de Conservation dans les Zones Arides et Semi-Arides de l’Afrique de l’Ouest: Aperçu de Quelques Systèmes Candidats; ICRAF Technical Manual N°17; World Agroforestry Centre: Nairobi, Kenya, 2012. [Google Scholar]
  29. Mbow, C.; Smith, P.; Skole, D.; Duguma, L.; Bustamante, M. Achieving mitigation and adaptation to climate change through sustainable agroforestry practices in Africa. Curr. Opin. Environ. Sustain. 2014, 6. [Google Scholar] [CrossRef]
  30. Nyamekye, C.; Thiel, M.; Schönbrodt-Stitt, S.; Zoungrana, B.; Amekudzi, L. Soil and Water Conservation in Burkina Faso, West Africa. Sustainability 2018, 10, 3182. [Google Scholar] [CrossRef]
  31. Ali, A.; Lebel, T.; Amani, A. Signification et usage de l’indice pluviométrique au Sahel. Sécheresse 2008, 19, 227–235. [Google Scholar] [CrossRef]
  32. Hair, J.F.J.; Black, W.C.; Babin, B.J.; Anderson, R.E. Multivariate Data Analysis; Pearson: London, UK, 2014; p. 734. [Google Scholar]
  33. Fensholt, R.; Sandholt, I.; Rasmussen, M.S. Evaluation of MODIS LAI, fAPAR and the relation between fAPAR and NDVI in a semi-arid environment using in situ measurements. Remote Sens. Environ. 2004, 91, 490–507. [Google Scholar] [CrossRef]
  34. CPCS. Classification des sols; Commission de Pédologie et de cartographie des sols: France, 1967; p. 87. Available online: http://horizon.documentation.ird.fr/exl-doc/pleins_textes/divers16-03/12186.pdf (accessed on 12 May 2019).
  35. Cardarelli, F. Materials Handbook; Springer: London, UK, 2008. [Google Scholar]
  36. Sherratt, J.A. Using wavelength and slope to infer the historical origin of semiarid vegetation bands. Proc. Natl. Acad. Sci. USA 2015, 112, 4202–4207. [Google Scholar] [CrossRef] [Green Version]
  37. Baartman, J.E.M.; Temme, A.J.A.M.; Saco, P.M. The effect of landform variation on vegetation patterning and related sediment dynamics. Earth Surf. Process. Landf. 2018, 43, 2121–2135. [Google Scholar] [CrossRef] [Green Version]
  38. Gerardin, V.; Ducruc, J.P. An objective approach to evaluating natural drainage of forest mineral soils for non-specialists. Vegetatio 1990, 87, 127–133. [Google Scholar] [CrossRef]
  39. Xu, M.; Dong, X.; Yang, X.; Chen, X.; Zhang, Q.; Liu, Q.; Wang, R.; Yao, M.; Davidson, T.; Jeppesen, E. Recent Sedimentation Rates of Shallow Lakes in the Middle and Lower Reaches of the Yangtze River: Patterns, Controlling Factors and Implications for Lake Management. Water 2017, 9, 617. [Google Scholar] [CrossRef]
  40. Sanou, L.; Savadogo, P.; Ezebilo, E.E.; Thiombiano, A. Drivers of farmers’ decisions to adopt agroforestry: Evidence from the Sudanian savanna zone, Burkina Faso. Renew. Agric. Food Syst. 2019, 34, 116–133. [Google Scholar] [CrossRef]
  41. FAO. Lignes Directrices Pour la Gestion Durable des Forêts en Zones Arides d’Afrique Subsaharienne; Document de travail sur les les Forêts et la Foresterie en zones arides No. 1; FAO: Rome, Italy, 2010. [Google Scholar]
  42. Breu, T.; Hurni, H.; Portner, B.; Schwilch, G.; Wolfgramm, B.; Messerli, P.; Herweg, K.G. Sustainable Land Management and Global Development: Factors Affecting Land Users’ Efforts to Adopt and Sustain the Productive Use of Natural Resources. In Research for sustainable Development: Foundations, Experiences, and Perspectives; Wiesmann, U.H.H., Ed.; Perspectives of the Swiss National Centre of Competence in Research (NCCR) North-South, University of Bern; Geographica Bernensia: Bern, Switzerland, 2011; pp. 427–449. [Google Scholar]
  43. Carter, N.H.; Viña, A.; Hull, V.; McConnell, W.J.; Axinn, W.; Ghimire, D.; Liu, J. Coupled human and natural systems approach to wildlife research and conservation. Ecol. Soc. 2014, 19. [Google Scholar] [CrossRef] [Green Version]
  44. Hull, V.; Tuanmu, M.-N.; Liu, J. Synthesis of human-nature feedbacks. Ecol. Soc. 2015, 20. [Google Scholar] [CrossRef] [Green Version]
  45. Ghazoul, J. Deforestation and Land Clearing. In Encyclopedia of Biodiversity, 2nd ed.; Levin, S.A., Ed.; Academic Press: Waltham, MA, USA, 2013; pp. 447–456. [Google Scholar]
  46. Shoko, C.; Dube, T.; Sibanda, M.; Gumindoga, W. In-depth analysis of the impacts of rural population growth on the natural environment: A GIS and remote sensing approach In-depth analysis of the impacts of rural population growth on the natural environment: A GIS and remote sensing approach. Trans. R. Soc. S. Afr. 2015, 70, 149–153. [Google Scholar] [CrossRef]
  47. INSD. Annuaire Statistique 2015; INSD: Ouagadougou, Burkina Faso, 2016. [Google Scholar]
  48. Reij, C.; Garrity, D. Scaling up farmer-managed natural regeneration in Africa to restore degraded landscapes. Biotropica 2016, 48, 834–843. [Google Scholar] [CrossRef]
  49. Petrosillo, I.; Aretano, R.; Zurlini, G. Socioecological Systems. Encycl. Ecol. 2015, 4, 419–425. [Google Scholar] [CrossRef]
  50. Elsawah, S.; Pierce, S.A.; Hamilton, S.H.; Van-Delden, H.; Haase, D.; Elmahdi, A.; Jakeman, A.J. An overview of the system dynamics process for integrated modelling of socio-ecological systems: Lessons on good modelling practice from five case studies. Environ. Model. Softw. 2017, 93, 127–145. [Google Scholar] [CrossRef]
  51. Bégué, A.; Vintrou, E.; Ruelland, D.; Claden, M.; Dessay, N. Can a 25-year trend in Soudano-Sahelian vegetation dynamics be interpreted in terms of land use change? A remote sensing approach. Glob. Environ. Chang. 2011, 21, 413–420. [Google Scholar] [CrossRef]
  52. Huber, S.; Fensholt, R.; Rasmussen, K. Water availability as the driver of vegetation dynamics in the African Sahel from 1982 to 2007. Glob. Planet Chang. 2011, 76, 186–195. [Google Scholar] [CrossRef]
  53. Gonzalez, P.; Tucker, C.J.; Sy, H. Tree density and species decline in the African Sahel attributable to climate. J. Arid Environ. 2012, 78, 55–64. [Google Scholar] [CrossRef] [Green Version]
  54. Borja, M.E.L. Climate Change and Forest Natural Regeneration in Mediterranean Mountain Areas. For. Res. 2014, 3, e108. [Google Scholar] [CrossRef]
  55. Bose, A.K.; Weiskittel, A.; Wagner, R.G.; Kuehne, C. Assessing the factors influencing natural regeneration patterns in the diverse, multi-cohort, and managed forests of Maine, USA. J. Veg. Sci. 2016, 27, 1140–1150. [Google Scholar] [CrossRef]
  56. Brandt, M.; Rasmussen, K.; Hiernaux, P.; Herrmann, S.; Tucker, C.J.; Tong, X.; Tian, F.; Mertz, O.; Kergoat, L.; Mbow, C.; et al. Reduction of tree cover in West African woodlands and promotion in semi-arid farmlands. Nat. Geosci. 2018, 11, 328–333. [Google Scholar] [CrossRef]
  57. Rovero, M. Nutrient Cycling Causes and Impacts of Desertification. Ref. Modul. Earth Syst. Environ. Sci. 2017. [Google Scholar] [CrossRef]
  58. Kusserow, H. Desertification, resilience, and re-greening in the African Sahel-a matter of the observation period? Earth Syst. Dyn. 2017, 8, 1141–1170. [Google Scholar] [CrossRef]
Figure 1. Location of the study area.
Sustainability 11 05908 g001
Figure 2. Categories and sequences of woody plant cover change.
Sustainability 11 05908 g002
Figure 3. Standardized Precipitation Index (SPI) for the study area, 1950–2015 period.
Sustainability 11 05908 g003
Figure 4. Frequencies of practices with high potential for woody plant regeneration by category of woody plant cover change. Anr: Assisted natural regeneration; Apf: Animal parking in the farm; Eb: Earth bund; Fa: Fallow; Gs: Grass strip; Hm: Half-moon; Mu: Mulching; Oa: Organic amendment; Pl: Planting; Sdb: Stones dyke barrier; Sr: Stones row; Veb: Vegetated earth bund; Vsr: Vegetated stones row; Ws: Woody strip; Za: Zaï.
Sustainability 11 05908 g004
Figure 5. Frequencies of practices participating in combinations based on the sample size of the VI change category.
Sustainability 11 05908 g005
Figure 6. Frequencies of the groups of practices observed in the different land-use, land-cover (LULC) categories. Planting/Anr: Assisted natural regeneration, Planting, Fallow; SWC/SPR: Animal parking in the field, Earth bunds, Grass strips, Half-moons, Mulching, Organic amendments, Stones dyke barrier, Stones row, Vegetated earth bunds, Vegetated Stones row, Woody strips, Zaï; Trees-threatening practices: Agricultural expansion, Bush fires, Gold panning, Pasture, Urban development, Wood harvesting; Natural vegetation: Savannah, Steppe, Riparian forest, Conserved area; No-vegetation: Bare land, Habitation, Water surface.
Sustainability 11 05908 g006
Figure 7. Frequencies of practices with high risk for woody plant deterioration by category of woody plant cover change. Ae: Agricultural expansion; Bf: Bush fires; Gp: Gold panning; Pa: Pasture; Ud: Urban development; Wh: Wood harvesting.
Sustainability 11 05908 g007
Figure 8. Relationship between spatial variation of vegetation index (VI) and the annual rainfall mean between 1986 and 2015.
Sustainability 11 05908 g008
Figure 9. Correspondence Analysis between: woody plant cover change and geomorphology (a); woody plant cover change and land use, land cover (b); woody plant cover change and land-use practices (c). Natural vegetation: Savannah, Steppe, Riparian forest, Conserved area; No-vegetation: Bare land, Habitation, Water surface; Planting/Anr: Assisted natural regeneration, Planting, Fallow; SWC/SPR: Animal parking in the field, Earth bunds, Grass strips, Half-moons, Mulching, Organic amendments, Stones dyke barrier, Stones row, Vegetated earth bunds, Vegetated Stones row, Woody strips, Zaï; Practices threatening trees: Agricultural expansion, Bush fires, Gold panning, Pasture, Urban development, Wood harvesting.
Sustainability 11 05908 g009
Table 1. Study sample by category of sequences of tree cover change.
Categories of Woody Plant Cover ChangeSequence of Changep1−p   U 1 / 2 2     e 2   nn Final
VI increase Since 19991.76%98.24%3.84160.006410118
Since 198676.38%23.62%3.84160.0064108
VI decreaseSince 199917.11%82.89%3.84160.00648585
Since 19860.08%99.92%3.84160.00640
VI no-changeSince 19994.55%95.45%3.84160.00642627
Since 19860.13%99.87%3.84160.00641
Total100%---230230
VI: Vegetation index.
Table 2. Environmental characteristics of observed sites by category of tree cover change.
Environmental VariablesCategories of Woody Plant Cover ChangeTotal
VI IncreaseVI DecreaseVI No-Change
Number%Number%Number%Number%
Soils
 Ferruginous soils119%1214%27%2511%
 Hydromorphic soils1714%89%519%3013%
 Lithosols2420%1012%519%3917%
 Poorly evolved soils6555%5362%1556%13358%
 Sodic soils11%22% 0%31%
Total118100%85100%27100%230100%
Geomorphology
 Mounds3530%3845%519%7834%
 Plateaus6253%4553%1970%12655%
 Shallows2118%22%311%2611%
Total118100%85100%27100%230100%
Ferruginous soils are characterized by an individualization of the sesquioxides of iron and manganese, which gives them a hue in the range of 7.5 YR and 10 YR, a massive structure of horizons A and B, a possible presence of indurated horizon in cuirass or carapace, a rapid decomposition of the organic matter, a poverty in mineral elements; Sodic soils are soils whose evolution is dominated by the presence of soluble salts (chlorides, sulphates, carbonates, bicarbonates of sodium, and/or magnesium) or by the presence of exchangeable sodium (and/or magnesium) with appearance of a massive, diffuse structure and a high compactness; Hydromorphic soils are soils whose characters are due to an evolution dominated by the effect of an excess of water because of a temporary or permanent waterlogging of part or all the profile; Poorly evolved soils are soils with AC profile characterized by a low mineral alteration and low organic matter content; Lithosols are soils with (A)C, (A)R, or R profile characterized by a mineral matter that remains in the raw state often mechanically fragmented with a virtual absence of organic matter [34,35].
Table 3. Landscape characteristics of observed sites by category of woody plant cover change.
Land Use, Land CoverCategories of Woody Plant Cover ChangeTotal
VI IncreaseVI DecreaseVI No-Change
Number%Number%Number%Number%
Agroforestry park6555%2226%27%8939%
Bare land33%4351%1244%5825%
Conserved area87%22% 0%104%
Habitation22%67%415%125%
Riparian forest22% 0%27%42%
Shrub savannah3126%67%27%3917%
Steppe54%67% 0%115%
Tree savannah11% 0% 0%10%
Water surfaces11% 0%519%63%
Total118100%85100%28104%230100%
Table 4. Description and frequency of combinations of high potential practices of tree regeneration observed.
Combinations No.PracticesNumber of Combinations Observed
VI IncreaseVI DecreaseVI No-Change
1AnrMuGsSrHmZa1
2AnrPlGsSrZa 1
3AnrPlGsVsrZa 2
4AnrPlWsVsrZa 1
5AnrApfPlSr 1
6AnrApfSrZa 1
7AnrApfVsrZa 1
8AnrFaPlZa 1
9AnrGsWsZa 1
10AnrPlGsSr 1
11AnrMuGsZa 1
12AnrPlGsZa 1
13AnrPlSrZa 2
14AnrPlVsrZa 1
15AnrSdbEbSr 1
16AnrSrHmZa 1
17AnrApfPl 2
18AnrApfSr 2
19AnrFaWs 1
20AnrFaZa 1
21AnrGsSr 1
22AnrGsVsr 1
23AnrGsWs 2
24AnrGsZa 3
25AnrOaGs 1
26AnrOaVeb 1
27AnrPlGs 1
28AnrPlOa 1
29AnrPlZa 3
30AnrSrZa 22
31AnrVebZa 1
32AnrVsrZa 3
33AnrGs 2 1
34AnrOa 1
35AnrPl 2
36AnrWs 2
37AnrZa 21
38FaGs 1
39FaSr 2
Total number of combinations5541
Frequency of the total number of samples47%5%4%
Anr: Assisted natural regeneration; Apf: Animal parking in the farm; Eb: Earth bunds; Fa: Fallow; Gs: Grass strips; Hm: Half-moons; Mu: Mulching; Oa: Organic amendments; Pl: Planting; Sdb: Stones dyke barrier; Sr: Stones row; Veb: Vegetated earth bunds; Vsr: Vegetated Stones row; Ws: Woody strips; Za: Zaï.
Table 5. Independence test between categories of woody plant cover change and environmental and anthropogenic variables.
Environmental and Anthropogenic VariablesPearson’s Chi-Squared Test (χ2) According to the Categories of Woody Plant Cover Change: VI Increase, VI Decrease, VI No-Change
Chi-SquareProb > ChiSq
Soils27040.6084
Geomorphology17,2190.0018 *
Land use, land cover93,837<0.0001 *
Land-use practices160,818<0.0001 *

