1. Introduction
The United Nations (2017) noted that population aging is a dynamic process by which the proportion of the elderly population is increasing in the total population. It is an inevitable trend in the population due to factors such as decreased fertility and increased life expectancy and migration when the social economy develops to a certain stage [
1]. For more than half a century, the number and proportion of the elderly population have been increasing all over the world, and this trend of an aging population structure affects both developed and developing countries. Since the implementation of the strict family planning policy in the late 1970s, China’s total population fertility rate has decreased rapidly, and the natural population growth and total population have been effectively controlled [
2,
3]. Simultaneously, the age structure has begun to transition from concentrating on adults to the elderly. In the year 2000, China became an aging society, with the proportion of the elderly population (65 years old and above) exceeding 7% for the first time. It took less than 40 years for China’s population age structure to make this change, while it took Western/developed countries half a century or more to complete. This rapid aging process will have a profound impact on the economic and social environment in China. The economic impact on consumption is mainly reflected in the effects of consumption and savings on capital formation, and the impact on production is reflected in labor supply and human capital accumulation [
4]. With regard to the social environment, population aging will have various effects on health care, the employment system, the pension insurance system, urban housing and transportation, and old-age service facilities [
5]. Furthermore, the regional development imbalance associated with population development factors and socioeconomic characteristics has become a major feature of China’s population aging. In view of this, studying the evolution of the spatial differences of China’s population aging and its driving factors is conducive to identifying the geographical characteristics of China’s population aging and provides a reference for narrowing regional differences, reducing unfavorable socioeconomic impacts and formulating reasonable population development strategies and policies.
With the development of industrialization, modernization, and urbanization after the Second World War, developed countries took the lead in completing the modern transformation of population reproduction from high birth and high death rates to low birth and low death rates. The population age structure also changed from young to old. Some scholars have begun to explore the health problems of the elderly and the prevention and treatment of diseases caused by aging from the perspective of biology and medicine [
6,
7,
8]. In the 1970s, geographers interested in aging broadened the understanding of the spatial issues of population aging due to advances in geography, and explored the spatial distribution of the elderly, the dynamic changes in the distribution over time [
9,
10,
11], and the problems urban living spaces create for the elderly [
12,
13,
14]. During this period, several scholars summarized the research on the geography of aging and the research directions that needed to be expanded [
15,
16,
17,
18]. In particular, Harper and Laws (1995) theoretically summarized the framework of positivism, empiricism, and humanistic epistemology that applied by geography to population aging and emphasized the mutually beneficial relationship between social theory in human geography and gerontology [
18]. Schwanen et al. (2012) and Skinner et al. (2015) spoke highly of their review, noting it as a milestone in the study of the geography of population aging [
19,
20].
Since the publication of Harper and Laws’s review, whether at the global, national, or urban–rural scale, the spatial imbalance of population aging at various spatial scales has increasingly interested policy makers and scholars. From a global perspective, relevant research has focused on the differences and the spatial temporal evolution of population aging according to aging rates and the elderly population size. Research has also considered aging trends, measured by the average annual growth rate of aging across continents, countries, and regions, and has predicted the development of future trends in major countries or regions around the world [
21,
22]. At the national level, the related research has focused on the spatial and temporal distribution of population aging within developed countries, with earlier and more severe aging in Europe, North America, Oceania, and Asia, in countries such as the UK, Italy, the USA, Canada, Australia, and Japan [
23,
24,
25,
26,
27,
28]. With regard to the study of aging in urban and rural areas, relevant scholars have mainly explored two microscopic directions, namely, the spatial distribution pattern of urban and rural elderly populations and the different types of aging communities formed by the impact of population aging on urban and rural residential space [
29,
30,
31,
32,
33]. In particular, scholars in the emerging field of geography in China began to explore the spatial issues of China’s aging population in the late 1990s. Although the related research started late, scholars inherited the research paradigms of developed countries for the exploration of the spatial and temporal distribution of the elderly population and the regional differences in population aging from different spatial scales, such as provinces, important economic regions, and metropolitan areas [
34,
35,
36,
37,
38,
39,
40,
41,
42].
Scholars of the geography of population aging also consider the factors affecting population aging and its spatial inequality. The trend of population aging is usually manifested by the contraction of the young group and the expansion of the elderly group in the total population, and the direct causes of these two situations are the lowered birth rate and extended life expectancy (or reduced death rate) [
27]. Therefore, most scholars believe that the reduction of birth rate and death rate or the extension of life expectancy during the demographic transition were the main drivers of the aging process and the spatial differences in the vast majority of developed countries around the world [
23,
27,
29,
41]. In addition, when both mortality and fertility drop to extremely low levels, population migration naturally becomes a key factor that has also received widespread attention. Large-scale international and domestic migration can promote the transformation of the age structure of a country or region, although international migration has little impact on population aging in most countries [
1,
41,
42]. Conversely, domestic migration, especially of young people seeking better education and employment opportunities by moving from areas with relatively backward social and economic strength, such as declining industrial bases and rural areas, to more active and growing capital cities or urban cores, is a particularly important factor contributing to the acceleration of population aging in the sending areas [
26,
29,
43,
44,
45].
Most of the above research is based on the spatial unit of the state (province) and city (metropolitan area) and even the community scale to explore the regional differences and spatial distribution of population aging. However, it is difficult to clearly describe the spatial characteristics of China’s population aging and the spatial differences in detail using the state or province as the spatial unit because of the large scale. Likewise, the use of the city or metropolitan area or the community scale as the spatial unit cannot reveal the macroscopic factors of the national pattern due to the limitations of the research unit. Moreover, previous studies have not effectively measured the spatial differences in population aging at multiple spatial scales. Therefore, this study takes the prefecture-level administrative unit between the provincial and county levels as the research object and applies a two-stage nested Theil decomposition to comprehensively consider and systematically decompose the spatial inequality of population aging at various levels in China, which more clearly reflects the spatial difference of China’s population aging and effectively overcomes the shortcomings of the above macro- and microscale. In addition, previous studies on the factors influencing population aging mostly proceeded from the three aspects of birth rate and mortality change during the demographic transition and population migration, ignoring the impact of socioeconomic and environmental factors. However, the demographic transition and population migration are closely related to socioeconomic factors such as economics, health care, education, and urbanization, as well as environmental factors [
46,
47]. Although individual scholars have used the traditional econometric method to examine the impact of economic and environmental factors on population aging [
38], they have neglected the spatial dependence and heterogeneity of population aging among regions, which cannot accurately reflect the impact of various factors on population aging.
Thus, based on the above research deficiencies, this paper examined the spatial differences and influencing factors of the population aging of 337 prefecture-level units in China. The structure of this paper is as follows: first, the two-stage nested Theil decomposition method was used to measure the differences in China’s population aging. Second, spatial statistical methods were used to further explore the evolution of the spatial distribution and spatial correlation pattern of China’s population aging. Third, considering spatial dependence and heterogeneity, spatial econometric models were used to empirically examine the impact of demographic, socioeconomic and natural environmental factors on population aging in China and its regions. Fourth, the necessary discussion on the empirical results was presented. Finally, the corresponding conclusions and targeted countermeasures were summarized.
3. Results
3.1. Spatial Inequality Analysis
Figure 2a,b shows the evolution of national overall inequality (
T) and its three components, including the between-region component (
TBR), between-province component (
TBP), and within-province component (
TWP), and their contributions to the national overall inequality. The magnitude and evolution of
Td from 2000 to 2010 reflect the growing inequality of population aging in China. Among the three components of overall national inequality,
TBR is always the smallest and decreased from 2000 to 2010, indicating that between-region inequality contributes least to the overall national inequality and that the gap in population aging between the four regions is shrinking over time. In contrast with
TBR,
TBP and
TWP constitute important components of overall national inequality and show an expanding trend, especially
TWP, which shows the most obvious expansion and eventually becomes the largest component. Thus, the spatial inequality of China’s population aging is sensitive to spatial scale, and inequality is mainly reflected on a more subtle spatial scale.
Furthermore, from the perspective of within-region inequality (
Ti) and its decomposition, including the between-province (
Tpi) and within-province (
Twi) components (
Figure 2c),
Ti,
Tpi, and
Twi can be found to exhibit
Te >
Tw >
Tn >
Tc,
Tpw >
Tpe >
Tpn >
Tpc, and
Twe >
Tww >
Twn >
Twc, indicating that the total within-region inequality and the respective components in eastern and western China are relatively large, while in northeast and central China, opposite results are obtained. In particular, the internal inequality in central China is at the lowest level among the four regions, regardless of whether the overall within-region inequality or the between-province and within-province inequality are considered. As time progresses, the inequality within regions, between provinces, and within provinces in northeast China has shrunk, but in the other three regions it has shown different degrees of expansion, which has eventually led to the polarization of the population aging in eastern, central, and western China. In addition, the contribution of each component to the overall within-region inequality (
Figure 2d) shows that only eastern China follows a trend consistent with that of the overall national inequality, and, therefore, the contribution of within-province inequality is greater than that of between-province inequality in this region. In contrast, the other three regions show the opposite trend, indicating that the spatial inequality of population aging within regions is mainly reflected at the provincial level.
3.2. Spatial Pattern Analysis
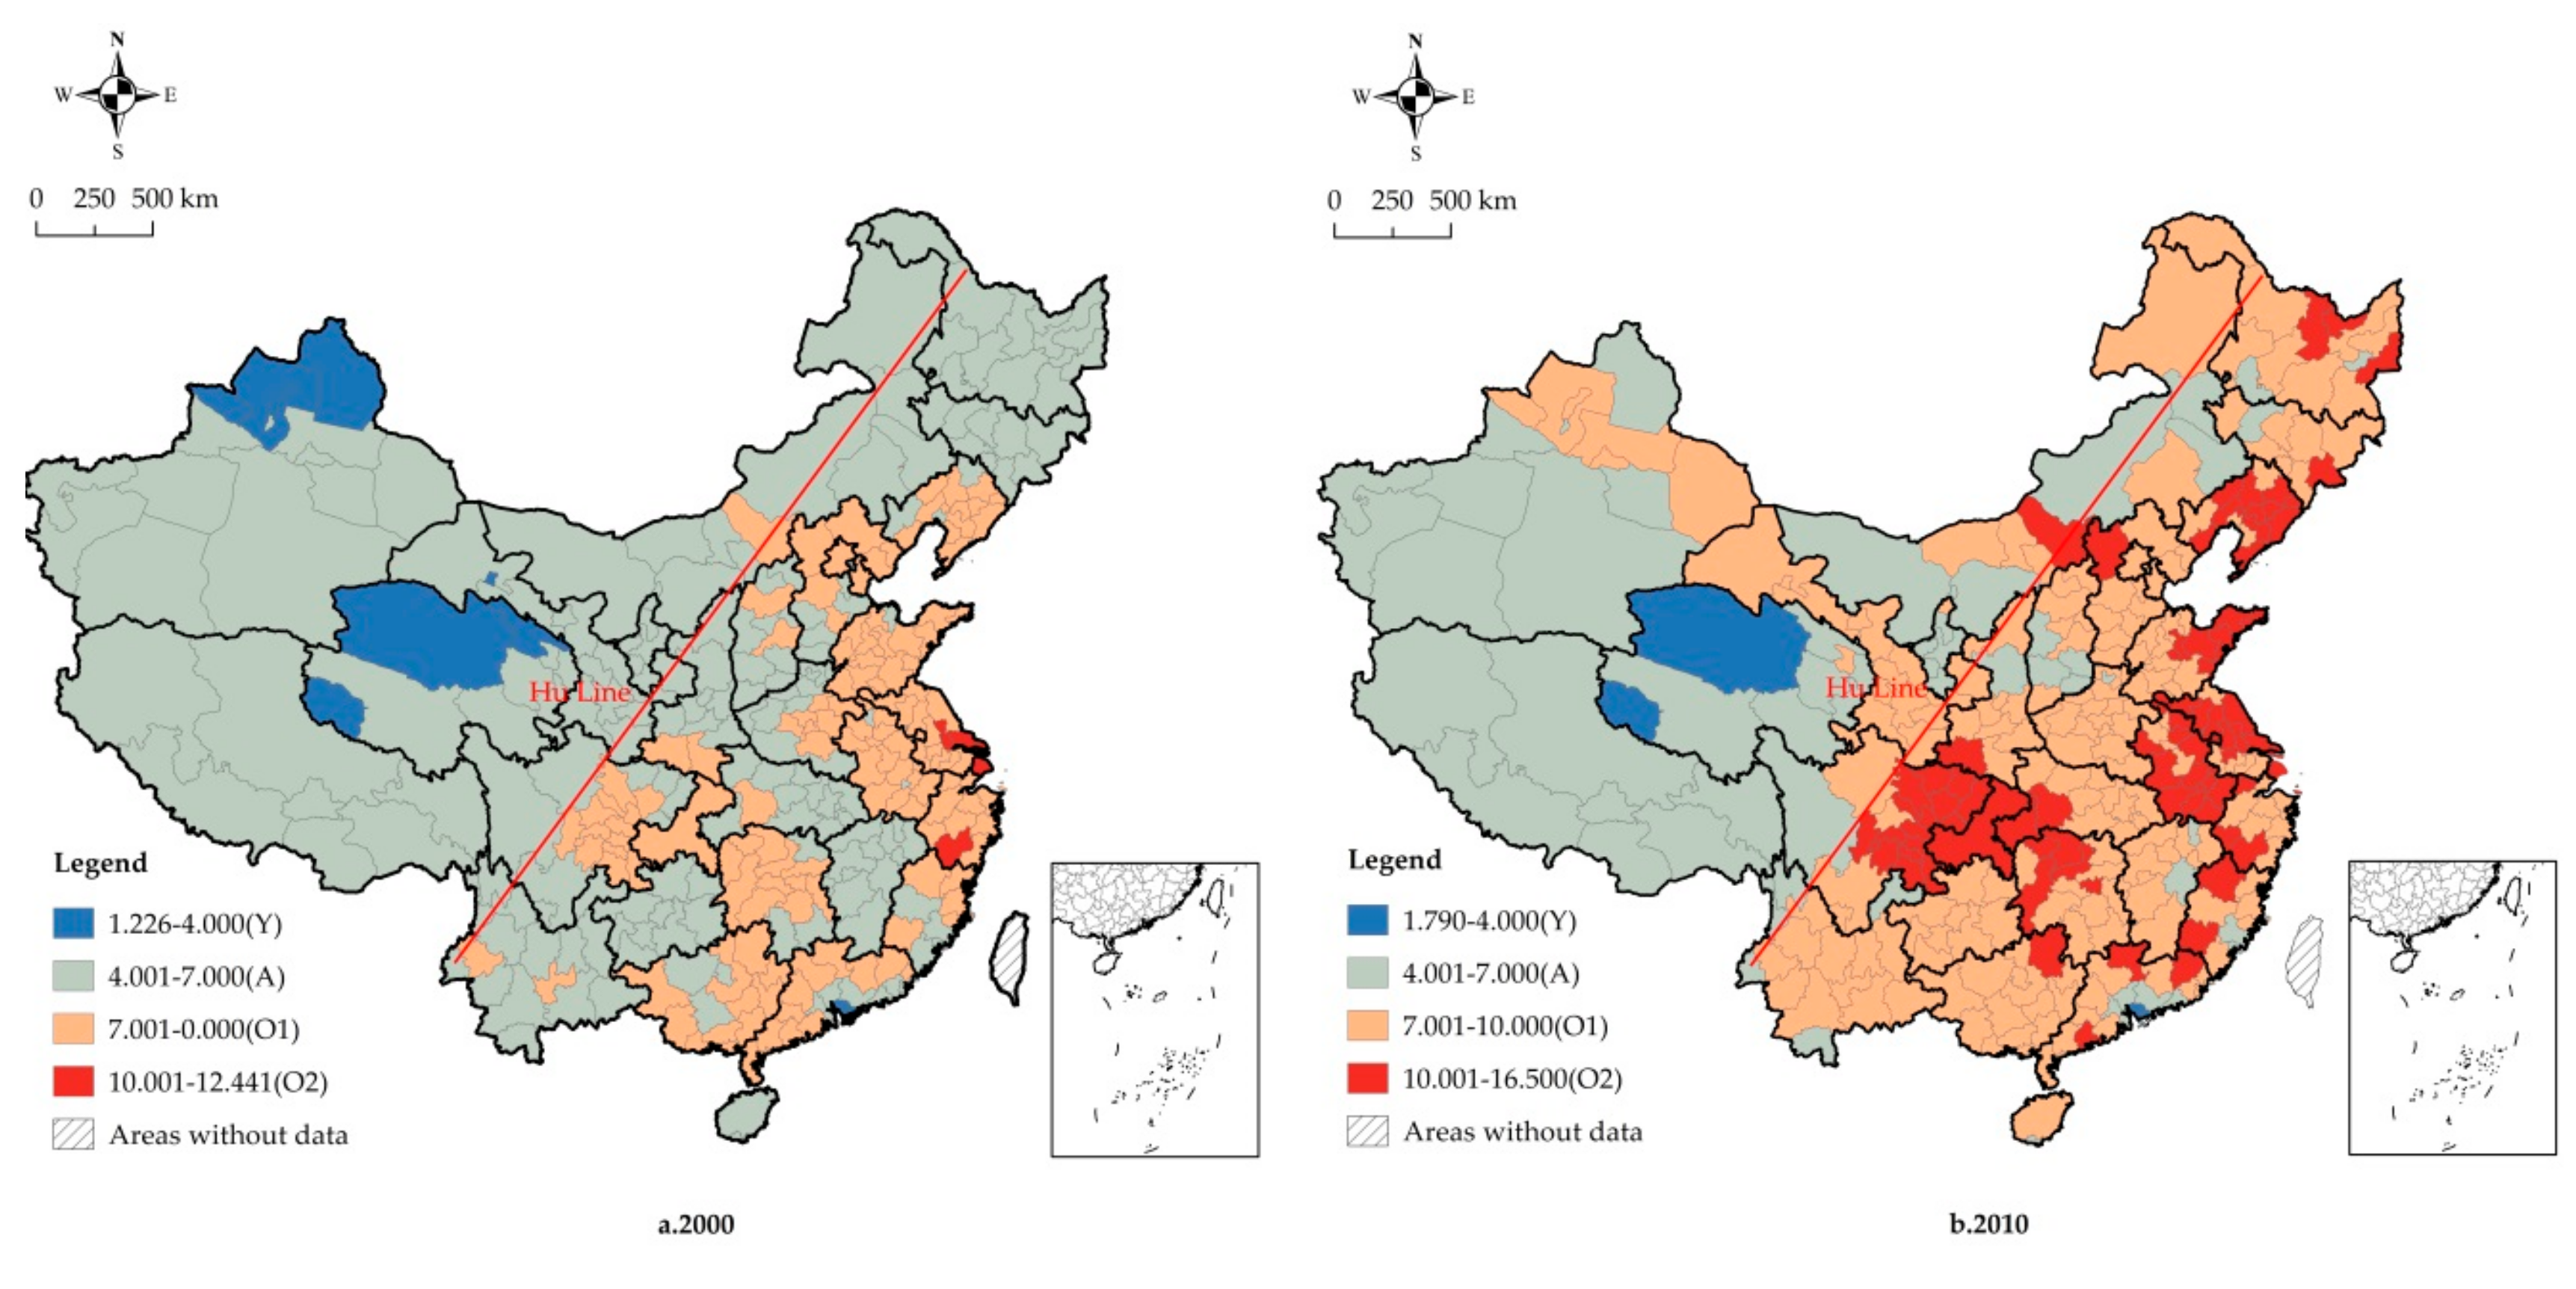
According to the United Nations, the age structure of a country or region is young when its aging population ratio is less than 4%; when the aging rate exceeds 7%, the country or region enters the aging stage [
67]. To more intuitively reflect the spatial distribution and evolution model of China’s population aging, this paper also draws on the division of population aging measurement criteria proposed by Xu et al. and divides the population age structure into six types. If the aging population ratio is below 4%, the area corresponds to young (Y); between 4% and 7%, the area is adult (A); between 7% and 10%, the area is early-aged (O
1); and above 10%, the area is late-aged (O
2) [
38]. Referring to this standard, a spatial distribution map of China’s population aging from 2000 (
Figure 3a) to 2010 (
Figure 3b) is drawn.
In 2000, the age structure of most prefecture-level units in China was dominated by the young and adult types, with an aging rate of less than 7%. Notably, the proportion of adult prefecture-level units was more than 55%, and these two types were widely distributed in central, western, and northeast China. The proportion of aged type with a population aging rate higher than 7% represented less than 43% and was mainly distributed in eastern China, parts of central China, and parts of southwest China. Specifically, the young type was mainly concentrated in northern Xinjiang, northern Qinghai, and the Pearl River Delta area in Guangdong Province. The adult type was widely distributed in provinces such as Gansu, southern Qinghai, southern Xinjiang, Ningxia, Inner Mongolia, central and northern Shaanxi, Tibet, western Sichuan, Guizhou, Yunnan, Southern Shanxi, western Henan, Hubei, southern Hunan, Jiangxi, Heilongjiang, and Jilin. In addition, there were a few adult-type prefecture-level units located in southern Hebei, southeastern coastal areas of Fujian, southeastern Guangdong, and Hainan. The aged type was mainly located in the eastern coastal provinces, except Hainan, and inland provinces, such as Anhui, eastern Henan, northern Hunan, Chengdu–Chongqing, southwestern Shaanxi, and most of Guangxi.
In 2010, a total of 277 prefecture-level units belonged to the aged type, accounting for more than 82% of all prefecture-level units, covering almost the entire southeast half of the Hu Line, including the whole of eastern China, central China, northeast China, and southwestern China except for Tibet and western Sichuan, and even spreading to provinces such as Gansu, Shaanxi, and northern Xinjiang in northwestern China. In contrast, the two types that have not yet entered the aging phase were reduced to 60 prefecture-level units, of which the young type represented only three prefecture-level units, Shenzhen and Dongguan in Guangdong Province and Haixi in Qinghai Province, and the adult type was distributed only in southern Xinjiang, eastern and western Inner Mongolia, southern Qinghai, Ningxia, Tibet, western Sichuan, border areas of Yunnan, southwestern Shanxi, and southeastern Guangdong. Compared with 2000, the population aging rate in different prefecture-level units had increased to varying degrees, and the age structure of the population had shifted to the type with a higher aging rate, mainly shown in the transition from the adult type to the aged type and the internal upgrading of the aged type. The former was mainly concentrated in northern Xinjiang, Gansu, northwestern Shaanxi, central and eastern Inner Mongolia, Yunnan, Guizhou, central Guangxi, and northeastern Sichuan in western China; northern Shanxi, western Henan, central and eastern Hubei, southern Hunan, and Jiangxi in central China; and Heilongjiang and Jilin in northeast China. The internal upgrading of the aged type is found mainly in a few provinces, such as Shandong Peninsula, northern Jiangsu, Anhui, northwestern Hunan, the Chengdu–Chongqing area, and Liaoning.
3.3. Spatial Correlation Pattern Analysis
The above spatial distribution pattern of population aging also indicates obvious spatial agglomeration characteristics of China’s population aging. Therefore, it is necessary to verify and measure this spatial agglomeration, demonstrating the distribution characteristics of different types of spatial clustering and outliers.
Table 1 reveals the statistics of the global Moran’s
I. The global Moran’s
I was significantly positive at the 1% confidence level in 2000 and 2010, indicating a strong, positive spatial correlation and a spatial distribution pattern of similar value aggregation of population aging in various prefecture-level units in China, rather than being regarded as an independent observation. Compared with 2000, the overall Moran’s
I in 2010 decreased from 0.639 to 0.623, which indicated that the spatial agglomeration of China’s aging population weakened at the prefecture level.
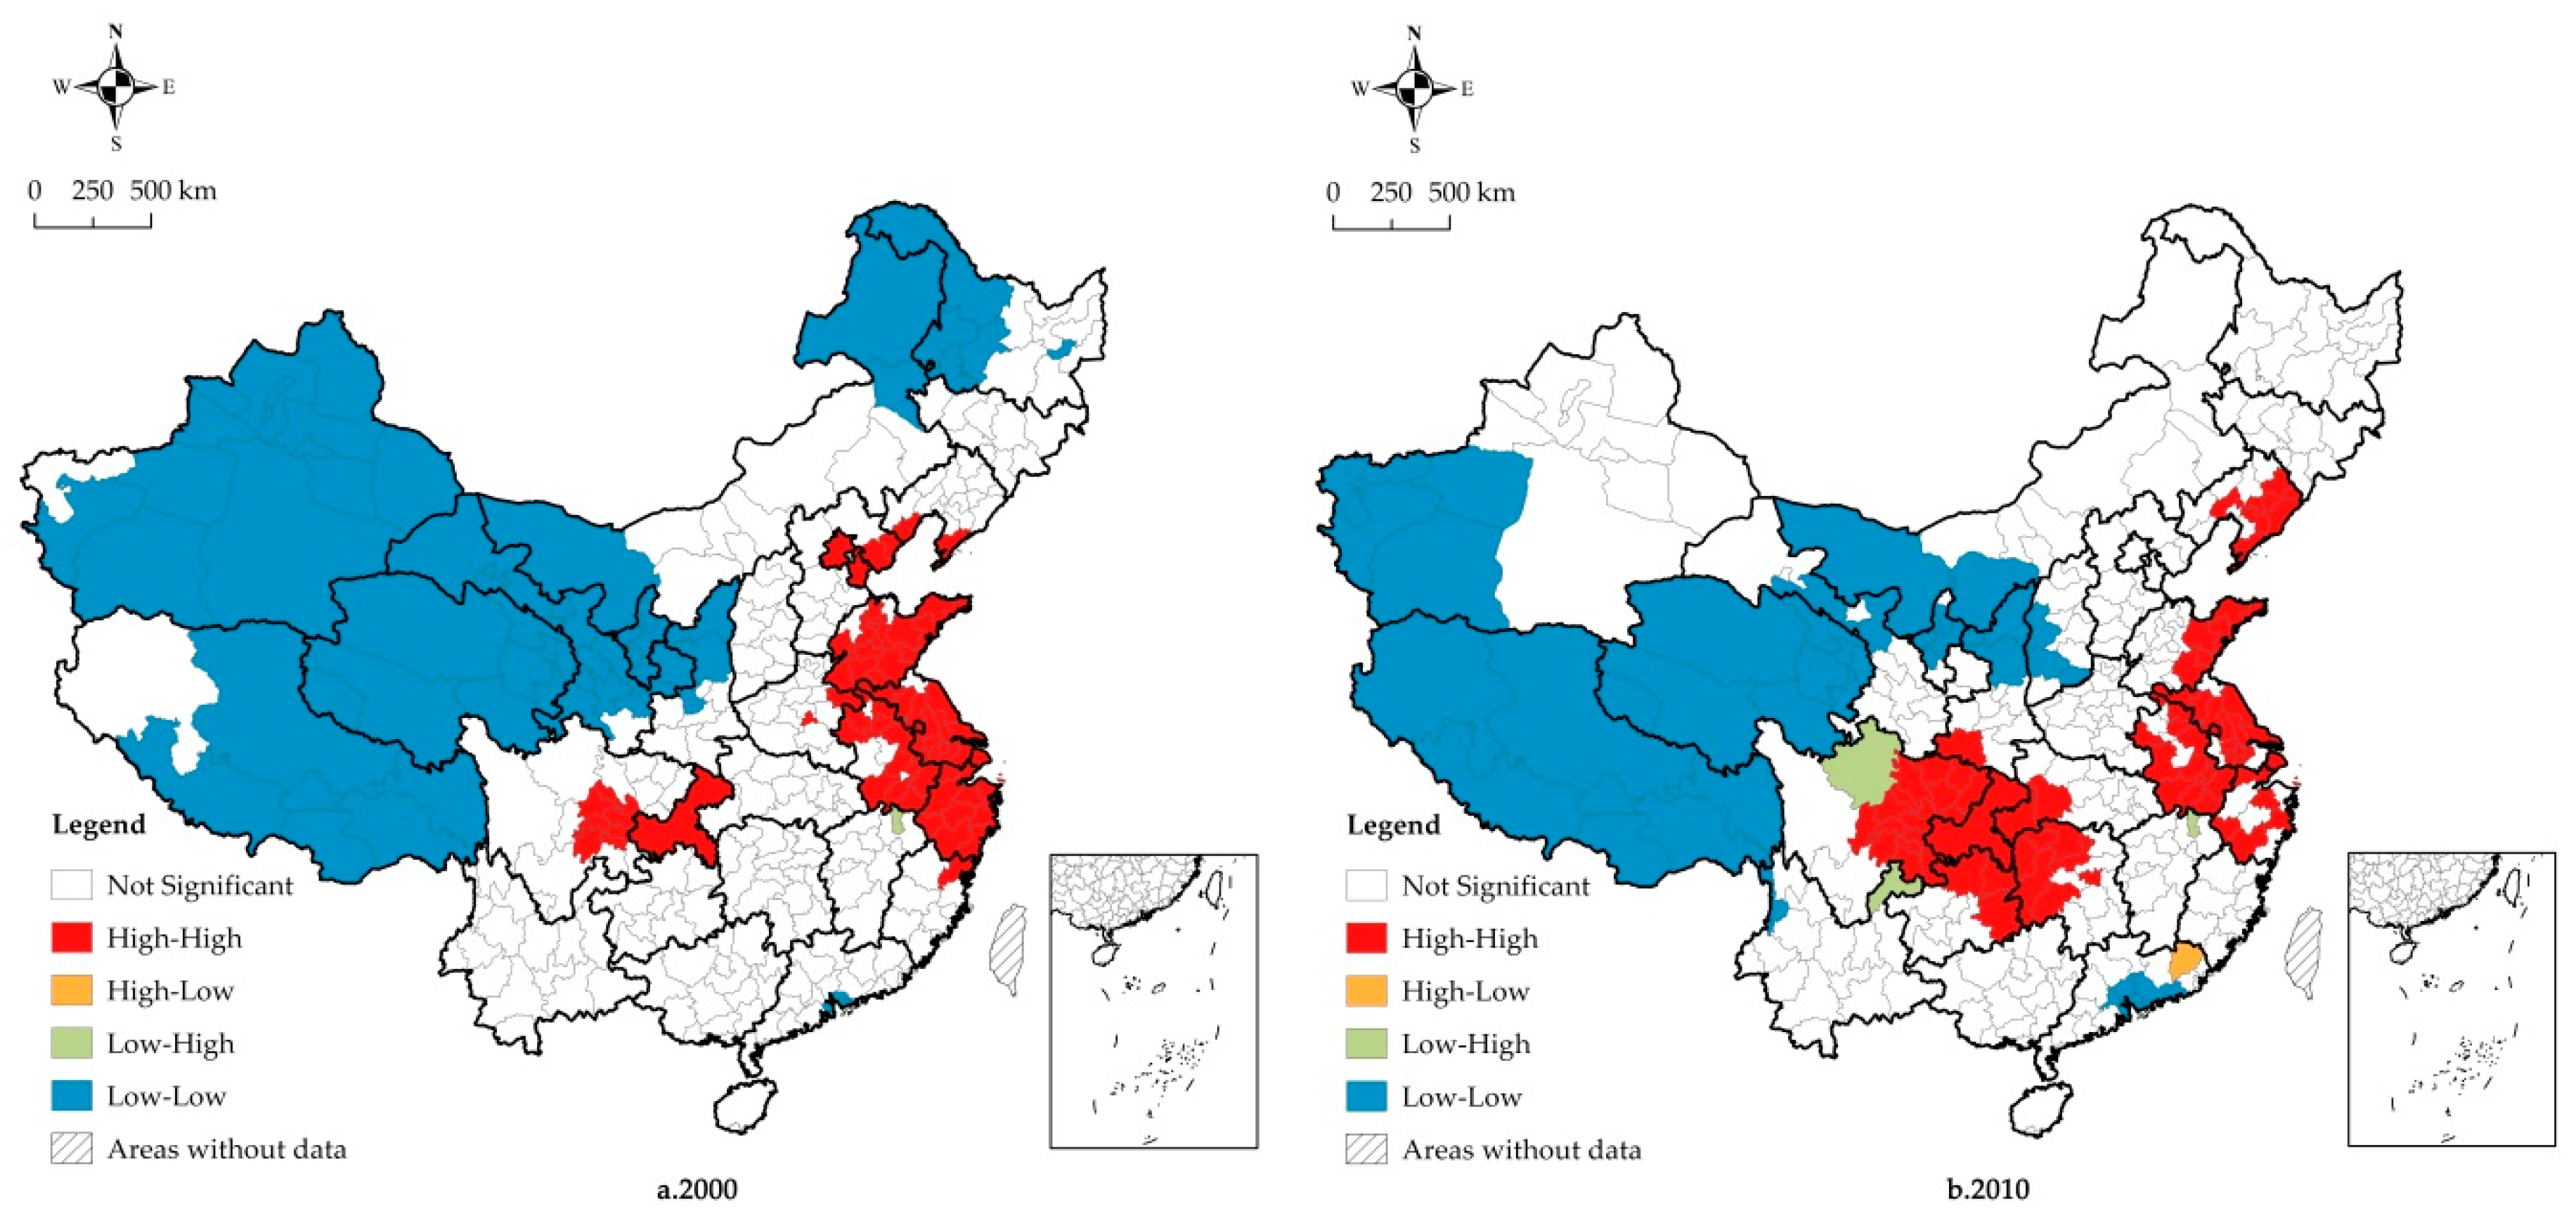
The LISA map further presents the four local spatial association categories of high–high, high–low, low–high, and low–low (
Figure 4). The high–high clusters are mainly distributed in areas such as the Yangtze River Delta, Shandong Peninsula, central and southern Liaoning Province, and Chengdu–Chongqing, and the first two high–high clusters are obviously reduced, mainly reflected in Zhejiang Province, except for Zhangzhou, Lishui, Taizhou, and Shaoxing. The local Moran’s
I of the other seven prefecture-level units changed from significantly positive to not significant. Similar changes occurred in Nanjing and Suzhou in Jiangsu Province during the study period, as well as in Beijing–Tianjin–Tangshan and some prefecture-level units in western Shandong. In contrast, the central and southern Liaoning Province and Chengdu–Chongqing clusters have expanded significantly. The central and southern Liaoning Province cluster has spread from Dalian to the north to the mid-southern urban agglomerations of Liaoning Province over the 10 years. The Chengdu–Chongqing cluster included only the urban agglomeration of the Chengdu Plain in 2000, while it covered the entire Sichuan Basin and expanded northward to southwestern Shaanxi and eastward from southwestern Hubei to northwestern Hunan in 2010.
The low–low clusters are mainly concentrated in western and northeastern China, including Xinjiang, Gansu, Qinghai, Ningxia, northwestern Shaanxi, eastern and western Inner Mongolia, Tibet, and western Heilongjiang. This type is also sporadically distributed in the Pearl River Delta region, especially in Shenzhen and Dongguan, which were the “youngest” prefecture-level units in China during the two census periods. The distribution of the low–low clusters in Xinjiang, Gansu, and northwestern Heilongjiang was significantly reduced, showing that the local Moran’s I in eastern Xinjiang, northern and southern Gansu, western Heilongjiang, and eastern Inner Mongolia changed from significantly positive to not significant. The exception was the Pearl River Delta region, where the number of low–low clusters increased, from the initial prefecture-level units, such as Shenzhen, Dongguan, and Zhongshan, to Guangzhou, Foshan, Huizhou, and Shanwei in the Pearl River Delta region, and finally to almost the entire Pearl River Delta region.
The high–low and low–high outliers were distributed around the low–low and high–high clusters, respectively. Although the number of prefecture-level units of the two types of areas increased during the study period, the “core-edge” structure of “high center, low periphery” and “low center, high periphery” had not yet been formed due to the small number of prefecture-level units. Moreover, the negative local spatial correlation generated by these two types had little effect on the spatial correlation pattern and evolution characteristics of China’s aging population, which further confirms that China’s population aging presents spatial correlation features dominated by positive spatial correlations of high–high and low–low agglomeration.
3.4. Analysis of Influencing Factors
The significant spatial differences in China’s population aging may be related to the demographic transition, socioeconomic development level, and natural environment of different regions. Therefore, it is necessary to verify the factors influencing China’s population aging and its inherent heterogeneity from a national and subregional perspective, and measure it through an econometric model. The results of the variance inflation factor (VIF) in
Table 2 show that all VIF values are less than 10, indicating that there is no obvious multicollinearity between the explanatory variables of the national and regional inclusion models. Moran’s I test of the error term can be used to determine whether spatial econometric models should be applied: if Moran’s I of the error term passes the significance test, the spatial econometric model considering spatial correlation needs to be more convincing than the traditional econometric model. The Lagrange multipliers (LMlag and LMerr) and their robust forms (RLMlag and RLMerr) can be used to further determine which spatial econometric model is more appropriate—if LMlag is significant, LMerr is not significant, or LMlag is statistically more significant than LMerr, and RLMlag is significant and RLMerr is not significant, then the spatial lag model (SLM) is selected; otherwise the spatial error model (SEM) is optimal. Therefore, combined with the results of
Table 3, Moran’s I, LMerr and RLMerr are all significant, and LMlag and RLMlag are not all significant and are less than the values of LMerr and RLMerr in China, central China and western China, it can be inferred that they are suited to the spatial error model. In contrast, Moran’s I in eastern China and Northeast China are not significant, therefore they are suited to the traditional measurement model; the final selected model estimation results are shown in
Table 4.
From a national perspective, the results show that BIR, DER, EDU, MED, and GCR passed the significance test of more than 10% at both time points, indicating that birth rate, death rate, education, and medical conditions are the main factors in China’s population aging. The coefficients of DER, EDU, MED, and GCR are significantly positive but BIR’s is not, suggesting that a reduction of the birth rate and an improvement of the death rate, education, medical conditions, and greening level can aggravate the population aging. The absolute values of the coefficients of these indicators are in the order DER > BIR > EDU > MED > GCR, which means that death rate and birth rate have the greatest impact on population aging, followed by education and medical conditions, while the greening level has the lowest impact. The effects of death rate, birth rate, and greening factors have declined, while the impacts of education and medical conditions have increased over time. In addition, the impacts of population migration, economy, urbanization, and family planning policies are phased. Notably, the impact of population migration and urbanization has changed from not significant to significant, and the degree of impact has increased, while the economic and family planning policy difference have the opposite effect. It is worth mentioning that λ is significantly positive and improved over time, indicating that some important missing variables or error terms related to geospatial space in other adjacent units can also aggravate population aging and that the intensity of this effect is increasing.
Similarly, the birth rate and death rate have the most significant impact on aging in the four regions, and the degree of impact has declined, while the remaining factors have different impacts, with obvious spatial heterogeneity. The influences of education, urbanization, family planning policy difference, and in-migration rate in eastern China are also significant; in particular, the impact of education is second only to that of death rate, and the impacts of urbanization and in-migration rate cannot be ignored. The family planning policy difference has little impact. Over time, the impact of factors other than urbanization declined. For central China, the out-migration rate and the family planning policy difference have a significant impact on population aging, with the former leading to an increase and the latter leading to a decrease during the study period. In addition to the birth rate and death rate, only the greening level has a significant impact on population aging in western China, and the impact declined from 2000 to 2010. In northeast China, medical conditions and urbanization are important factors influencing the local population aging, and its estimation coefficient shows a downward trend during the study period. In addition, spatial dependence exists in central and western China but not in eastern and northeast China, which means that the population aging among prefecture-level units in eastern and northeast China is not affected by neighboring hierarchical units.
4. Discussion
This study has proven that there has been a significant spatial inequality in China’s population aging since the beginning of the 21st century. The findings showed that the spatial inequality of population aging across the country and in all regions is decomposable, and the inequalities within provinces represent an important part of the national and regional inequalities. The selection of the prefecture-level unit and the two-stage Theil index method allowed us to more comprehensively consider and systematically decompose the spatial inequality of population aging at all levels in China, compensating for the narrowness or overgeneralization of the hierarchy in previous studies at the national or provincial scale.
The spatial distribution and spatial autocorrelation results more intuitively reflect the spatial differences in China’s population aging. Concerning the spatial distribution pattern, there are obvious spatial differences in the aging index, and the spatial distribution pattern is different from the economic development pattern, which is consistent with Chen’s findings [
36]. Since the reform and opening-up period, the regional nonequilibrium strategy implemented through the pursuit of rapid economic growth has led to particularly significant economic differences among the four major regions in China; the economic development is the highest in eastern China, medium in central and northeast China, and the lowest in western China. Correspondingly, the distribution pattern of the aging rate in 2000 overlaps with the regional economic development level; that is, eastern China, with a high level of social and economic development, became an aging society earlier, and its aging rate is higher, while the aging rate in central and northeast China is not much different. Correspondingly, western China has the youngest age structure. In 2010, the population aging showed a geographical expansion from eastern China to central, western, and northeast China, changing the pattern of population aging being initially similar to the economic development level.
From the results of spatial autocorrelation, the reduction of the global Moran’s I indicates that the spatial agglomeration characteristics of dissimilar attributes have become increasingly significant, thus verifying the expansion of the spatial inequality of China’s population aging. Additionally, the combined results of LISA and the aging rate distribution pattern also demonstrate the characteristics of the inequality within regions. In eastern China, where population aging is dominated by high–high clusters and aged types, there is still a low–low cluster with a young population structure in the Pearl River Delta area; and in western China, where population aging is generally dominated by low–low clusters and adult types, there is still a high–high cluster in the Chengdu–Chongqing area that entered old age earlier. In contrast, central and northeast China have more consistent population aging within their respective regions during the study period, which means that these regions were dominated by not significant local spatial autocorrelation and adult types in 2000 and became predominantly older after 10 years, and the local spatial autocorrelation values were still not significant. This further validates the relatively large spatial inequality within eastern and western China in the above analysis, as well as the small spatial inequality within northeast and central China in the spatial inequality analysis results.
The results of the influencing factors can help us to effectively identify the reasons for the spatial differences in population aging within China and across regions. From a national perspective, the birth rate and death rate are key factors affecting China’s population aging, and the impact of population migration is becoming more and more significant. On the one hand, the implementation of a strict family planning policy controls China’s population growth while reducing the birth rate, resulting in a decline in the proportion of the young and an increase in the proportion of the elderly in the total population. On the other hand, since the reform and opening-up, China’s rapid socioeconomic development and the improvement of education and medical conditions have led to great achievements in terms of health and longevity. The death rate has continued to decrease, and the life expectancy of the population has been greatly prolonged, which has led to an increase in population aging. In addition, in the 21st century, due to the interactive evolution of industrialization and urbanization and the growing economic disparity, the migration of China’s large-scale working-age population from less developed central, western, and northeast China to eastern China and the migration from rural areas to cities have gradually changed the distribution pattern of China’s population aging. The above results are in line with the theoretical basis of demographic transition and coincide with the formation mechanism of population aging in other countries, especially in Western/developed countries, where demographic transition occurred earlier, a decline in fertility and mortality has become the main cause of population aging, and with the continuous decline of the birth rate, the emergence of a “second demographic transition” has made population migration an important factor affecting the age structure of the population [
23,
27,
29]. However, contrary to the findings of the above scholars in developed countries who believe that a reduction in mortality has contributed to population aging, the death rate is found to have a positive effect on population aging in this paper. This is because, in developed countries, a decline in the death rate first appeared in the lower age group and then gradually extended to the middle and old-age groups [
68,
69]. As a result, the decline in death rate at this stage is more manifested by the prolonged life expectancy of the old-age population, which in turn leads to an aging population; for developing countries, such as China, though, the decline in death rate is still dominated by a decline in the mortality of infants and young people and then spreads to the middle-aged and elderly population, which indirectly increases the proportion of young people in the total population and slows down the process of aging [
5].
Furthermore, the level of education and medical and health conditions also have an important impact on the aging of China’s population. This is in line with the important role of the modernization process in demographic transition theory—that is, the improvement of education level and medical and health conditions as part of the modernization process can effectively promote a decline in birth rate and mortality. Notably, the impact of urbanization on China’s population aging has become more pronounced during the study period, and the intensity of the impact has increased, while with the economic factors the scenario is exactly the opposite. China has experienced rapid urbanization, and the population mobility greatly increased from 2000 to 2010. The advancement of urbanization led to a further reduction in the birth rate and large-scale movement of young people from developing to developed areas, making urbanization and migration increasingly important factors affecting China’s population aging. However, the impact of economic factors on the birth rate and death rate will be weakened as the decline of the birth rate and death rate are stable at the lowest level in the process of demographic transition. Moreover, economically developed regions have attracted a large number of floating populations, slowing down the local aging process and causing further inconsistencies in the spatial distribution of economic development and population aging. Also, the greening level has also promoted China’s population aging. With the rapid advancement of China’s urbanization and the great attention paid to ecological policies such as prohibiting excessive development, encouraging returning farmland to forests and afforestation, the greening level of various regions has been significantly improved, thus providing environmental protection for people’s health and safety.
The results of subregional influencing factors further validate the reasons for the spatial differences in population aging across regions. The strong economic development, relatively rich educational resources, rapid urbanization, and sound medical and health service system in eastern China have led to a low birth rate and a long life expectancy. Hence, most of the prefecture-level units in eastern China entered the aging society earlier and are leading in terms of the aging level in China. However, these advantages of social and economic development have attracted large working-age populations to move in, which slowed down the process of aging in eastern China. In central China, especially in Henan, Hunan, Hubei, and Anhui Provinces, a large working-age population has moved to the neighboring Beijing–Tianjin–Hebei, Yangtze River Delta, and Pearl River Delta areas. These three major economic growth poles have greatly affected central China as the main source of their population inflows due to their strong population siphon effect, which has accelerated the aging of the population structure and made the population aging higher in central China. Due to the large population of ethnic minorities and the low level of urbanization in western China, relatively loose family planning has resulted in a higher birth rate. As western China is located on the edge of regional economic development and has a harsh natural environment, the increase in the life expectancy of the population has been limited, and the risk of infant and child death has increased. Therefore, due to the relatively high birth rate and death rate, the age structure of the population in western China is younger. In northeast China, which has had the leading urbanization rate among all regions since the early days of modern China, a modern concept of fertility and family planning has resulted in a birth rate that is persistently lower than the national average, which has led to an increase in aging.
Although this paper makes a systematic analysis of the spatial differences and influencing factors of China’s population aging, there are two shortcomings that should be expressed. First, the cross-sectional data of the selected two time points cannot easily reflect the time series evolution of the spatial differences in China’s population aging. Second, the use of various regional scales is not enough to reflect the spatial heterogeneity of the factors affecting China’s population aging; that is, the existence of spatial nonstationarity may lead to different factors affecting the aging of different hierarchical units, even if they are located in the same area or even in the same province. Taking Guangdong Province as an example, the reasons for the higher aging in northern Guangdong are mostly related to the out-migration rate, while the Pearl River Delta area, especially Shenzhen, is highly attractive to young laborers due to its high socioeconomic development level and relatively open household registration system. Continuous in-migration makes it the youngest city in China. Therefore, future research should focus on the heterogeneous factors affecting population aging at the prefecture level to provide a reference for the development of more detailed solutions to the problem of aging.
5. Conclusions and Implications
5.1. Conclusions
This article identified the spatial differences of population aging at different scales in China from the regional, provincial, and prefectural levels, and found obvious differences in the aging patterns within each region, especially in eastern and western China, which are visually reflected in the form of spatial distribution and spatial association. Specifically, eastern China, as the main high–high cluster, had the highest population aging, followed by central and northeast China, and finally western China with the most low–low agglomeration types and the least aging. At the level of provincial and prefecture-level units, the population aging is marked by the Hu Line; that is, the southeast half of the Hu Line is aging, while the northwest half of the Hu Line is younger. China’s population aging has gradually formed a distribution pattern that is inconsistent with socioeconomic development level, and aging has begun to expand west of the Hu Line over time.
In addition, China’s significant spatial differences in population aging are formed under the influence of specific demographic, socioeconomic, and environmental factors. The changes in birth rate and mortality during the demographic transition process and population migration can directly affect population aging, while the socioeconomic and natural environmental factors indirectly change the age structure of the population through the above demographic factors. Specifically, the birth rate, death rate, education level, prevalence of medical conditions, and greening level are the main factors affecting China’s population aging. At both the national level and within each region, the decline in the birth rate and the extension of life expectancy during the demographic transition have been key factors in population aging, while the other factors have differing effects on the aging in each region. That is, the high level of education and urbanization in eastern China and the large-scale population in-migration are main reasons for population aging, and central and western China are aging due to population out-migration and greening level, respectively, while the better health care and higher urbanization in northeast China are the main reasons for its rapid population aging. The spatial heterogeneity of the influencing factors indicates that the direct cause is the demographic factor, while the root cause is the spatial differences in the socioeconomic natural environmental factors of China’s population aging.
5.2. Implications
The growing population aging will inevitably pose serious challenges to China’s old-age care and social and economic sustainable development. The emergence of the phenomenon of aging without becoming richer is caused by the disconnection between interregional population aging and social and economic development and will lead to a heavier burden of old-age care in relatively underdeveloped western China, where pension resources are scarce, and further aggravate the development gap with eastern China, forming a vicious circle. Thus, under the premise that the natural environment is difficult to change in the short term, it is necessary to propose corresponding countermeasures and suggestions targeting the demographic and socioeconomic factors that affect China’s population aging to cope with the comprehensive population aging process and the problem of being an aging but not yet rich country. In terms of population factors, increasing the birth rate and reducing infant mortality are the main ways to alleviate population aging. In terms of social and economic factors, narrowing the gap in social and economic development between regions can effectively reduce the infant mortality rate and the outflow of the working-age population in developing regions, which is especially important for balancing the regional differences in population aging and addressing related issues. Importantly, the spatial heterogeneity of the factors affecting population aging in this paper illustrates that appropriate strategies to alleviate the problem of population aging should be formulated based on the local development status of each region.
First, we should adhere to the “Universal Two-Child Policy” and promote the transformation of fertility willingness into fertility behavior by giving tax relief, maternity leave extension, and education subsidies to families with two children. Especially in northeast China, which has long had a low fertility level, it is necessary to adapt social security to the reproductive behavior of the population and promote a new population policy to increase the fertility rate. Second, the health care system should be further improved, especially by strengthening obstetrics services in underdeveloped western China, reducing infant mortality and thus slowing the process of aging. Third, for urban agglomerations in central China, we should actively guide migrants to nearby urban centers and increase investment in education by providing corresponding education subsidies for migrant children and poor families. Such measures may attract migrant workers and alleviate the continuing decline of the population in central China. Finally, we should improve and reform the old-age security system as soon as possible, and gradually improve the level of pension insurance. In particular, eastern China should support the barrier-free transfer of pension insurance relationships. While China benefits from the demographic dividend brought about by the floating population, it should provide protection for the pension insurance and labor compensation, social welfare, urban housing, and children’s education of the floating population, thereby reducing the burden of old-age care in underdeveloped regions.


