Article

Energy Taxes, Carbon Dioxide Emissions, Energy Consumption and Economic Consequences: A Comparative Study of Nordic and G7 Countries

1
School of Economics and Management, North China Electric Power University, Beijing 102206, China
2
Beijing Key Laboratory of New Energy and Low-Carbon Development, North China Electric Power University, Changping, Beijing 102206, China
3
School of Management, Minzu University of China, Zhongguancun South Avenue, Beijing 100081, China
*
Author to whom correspondence should be addressed.
Sustainability 2019, 11(21), 6100; https://0-doi-org.brum.beds.ac.uk/10.3390/su11216100
Submission received: 3 September 2019 / Revised: 19 October 2019 / Accepted: 24 October 2019 / Published: 2 November 2019

Abstract

:
Based on a panel ARDL (AutoRegressive Distributed Lag) model, this paper investigates the environmental and economic consequences of energy tax levied in the four Nordic countries and the G7 countries from 1994 to 2016. Based on the double dividend theory of environmental tax, this paper investigates five variables: energy tax, energy consumption per unit of GDP, income tax, profit tax and capital gains tax, carbon dioxide intensity and fossil fuel burning ratio. A panel ARDL model is established to empirically test the relationship between energy tax and other variables. Experiments show that both the four Nordic countries and the G7 countries have found the existence of green dividends in the long run: the green dividends of the four Nordic countries are reflected in the reduction of carbon dioxide emissions, while those of the G7 countries are reflected in the reduction of fossil fuel use. In terms of blue dividends, the implementation of energy tax in the four Nordic countries can not only reduce distorted taxes in the short term, but also promote economic growth and adjust tax structure in the long term. For the G7 countries, blue dividends are not reflected in the long term. The model used in this paper is a panel ARDL model, which is more suitable for the study of multiple countries, multiple variables and long-term cycles. This model has been seldomly used in previous studies. The application of the panel ARDL model in this paper is not only more scientific and applicable, but also more innovative, which makes up for the shortcomings of previous studies. The research object of this paper selects the energy tax, which is an important part of the environmental tax system, and strives to provide a reference for the implementation of environmental taxation priorities and effects through empirical research. This paper may also serve as a reference for other countries to establish and improve environmental tax. As the first environmental tax law in China, the Environmental Protection Tax Law of the People’s Republic of China was formally implemented on 1 January 2018. This paper chooses G7 countries and Nordic countries as the research objects. As these are important economies in the world, their environmental tax implementation is more perfected and has strong representativeness. This study can provide some experience for the continuous improvement of China’s environmental tax law.

1. Introduction

Energy is the foundation of economic development, and fossil energy sources such as coal, oil and natural gas are traditional and widely used forms of energy input and consumption. Since the industrial revolution, fossil energy as energy input and consumption has promoted unprecedented scientific and technological progress. However, with economic development, higher amounts of fossil energy have been used, resulting in increased generation of pollutants and greenhouse gases. Considering the limited nature of fossil energy reserves, such contemporary excessive use means that the future usability will be reduced, which will produce cross-generational negative externalities, resulting in user costs in an economic sense. Therefore, the final price of fossil energy should not only include environmental external costs such as pollution, but also fully reflect user costs [1]. In the 1970s, western industrial countries began to pay attention to environmental problems and take various measures to control environmental pollution. In addition to continuously improving energy efficiency and developing new energy technologies, human beings should be more cautious about the depletion of fossil energy, balance the dependence on fossil energy and fully consider the use of fiscal instruments such as taxation to promote energy production and consumption change. So far, Germany has the most complete and detailed environmental protection law in the world, which regards environmental protection as the second biggest domestic problem after employment. Green GNP, green accounting, green marketing, green tax and other concepts have emerged one after another. These “green” concepts not only reflect people’s attention to the environment, but also bring the consumption and compensation of environmental resources into the economic category, which is conducive to the solution of environmental problems.
Green tax intervenes in the environment by using fiscal and tax leverage to bring environmental tax into the cost of enterprises and to promote the internalization of external costs. This idea was first put forward by Pigou, a British economist, that is, according to the degree of harm caused by pollution, polluters are taxed to compensate for the gap between private and social costs of polluters’ production [2]. For behaviors with positive externalities, the government can adopt preferential tax policies so that the private marginal income of the actors equals the social marginal income [3]. At the same time, the levy of green tax has a double dividend effect. On the one hand, levying tax on the behavior of polluting the environment can increase the cost of polluters. This can restrain and reduce the polluting behavior of polluters, reduce the damage to the environment and promote environmental protection, which is the green dividend. On the other hand, it can promote the reform of the tax system, reduce the burden of other taxes according to the revenue cycle function of tax, promote the development of environmental protection industry, find new economic growth points, promote employment and improve economic efficiency, namely the “blue dividend”. Most of the green taxes in developed countries are energy taxes, and the types of taxes are diversified. Xu pointed out that by levying energy tax and using the tax lever of energy tax to influence energy prices, the relationship between supply and demand in energy market, the technological reform of production of high energy consumption products and social productivity can be guided and adjusted [4]. Secondly, through the levy of energy tax, energy consumption will be reduced and energy protection awareness will be established to protect the scarce and non-renewable energy.
According to the World Bank Development Indicators 2017, the GDP of the seven major groups has accounted for 45.53% of the world’s GDP, nearly half of which means that the Group of Seven plays an important role in the world economy. The Group of Seven is economically developed and emits a lot of CO2. Only the United States emits more than 25% of global emissions of CO2, making it the country with the largest global greenhouse gas emissions. The four Nordic countries (Denmark, Sweden, Finland and Norway) are the first countries to implement green taxes, widely use clean energy and have high environmental quality. Denmark is the first country in the European Union to truly implement green tax reforms. According to official Danish data, the Danish economy has grown by 78% over the past 30 years, but energy consumption has remained basically unchanged [5].
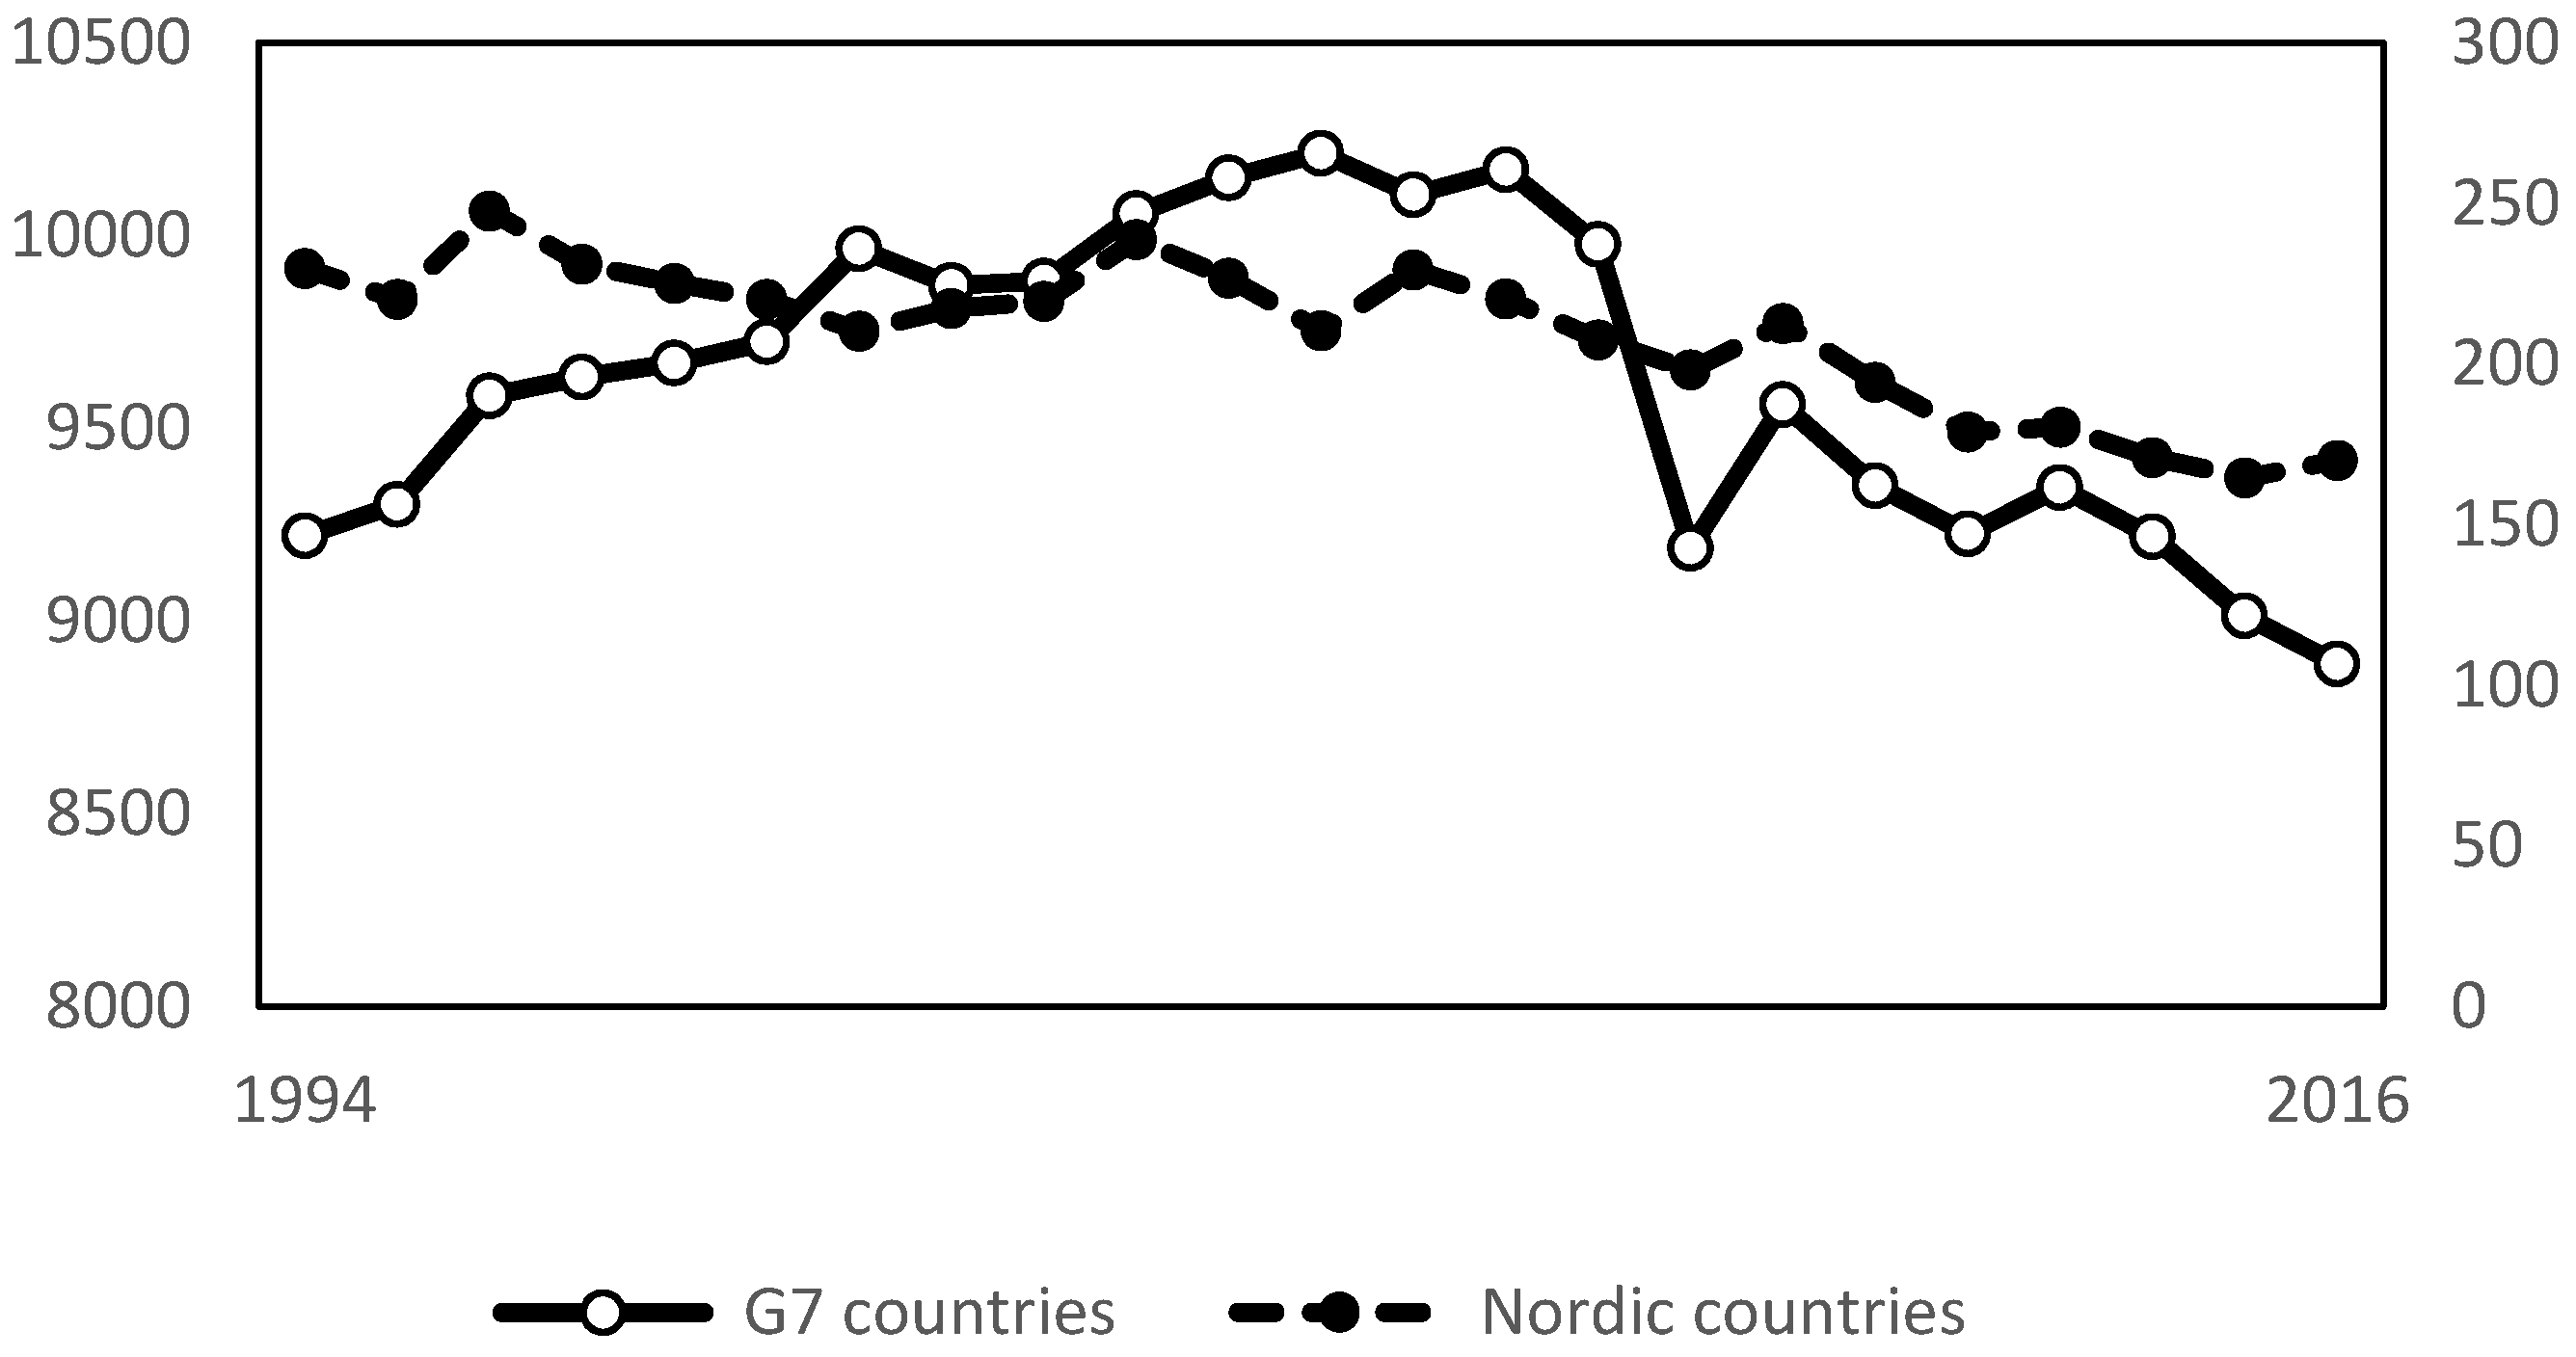
Figure 1 shows the trend of carbon dioxide emissions in G7 countries from 1994 to 2016. From Figure 1, we can see that the average annual carbon emissions of G7 countries are over 90 billion tons, and the total carbon emissions reached the peak in 2005. The total carbon emissions of G7 countries decreased sharply in 2009. In recent years, the total carbon emissions have shown a downward trend. Although the total carbon emissions of G7 countries have decreased in recent years, according to the BP World Energy Statistics Yearbook, the total carbon emissions of G7 countries still account for more than 40% of the total world carbon emissions and play an important role in the total world carbon emissions [6]. The average annual carbon emissions of the four Nordic countries are more than 20 billion tons. The total carbon emissions of the four Nordic countries showed a downward trend of fluctuation. According to the BP World Energy Statistics Yearbook, the total carbon emissions of the four Nordic countries account for about 0.96% of the total world carbon emissions [6]. Therefore, this paper selects these two major economies as research objects that are very representative.
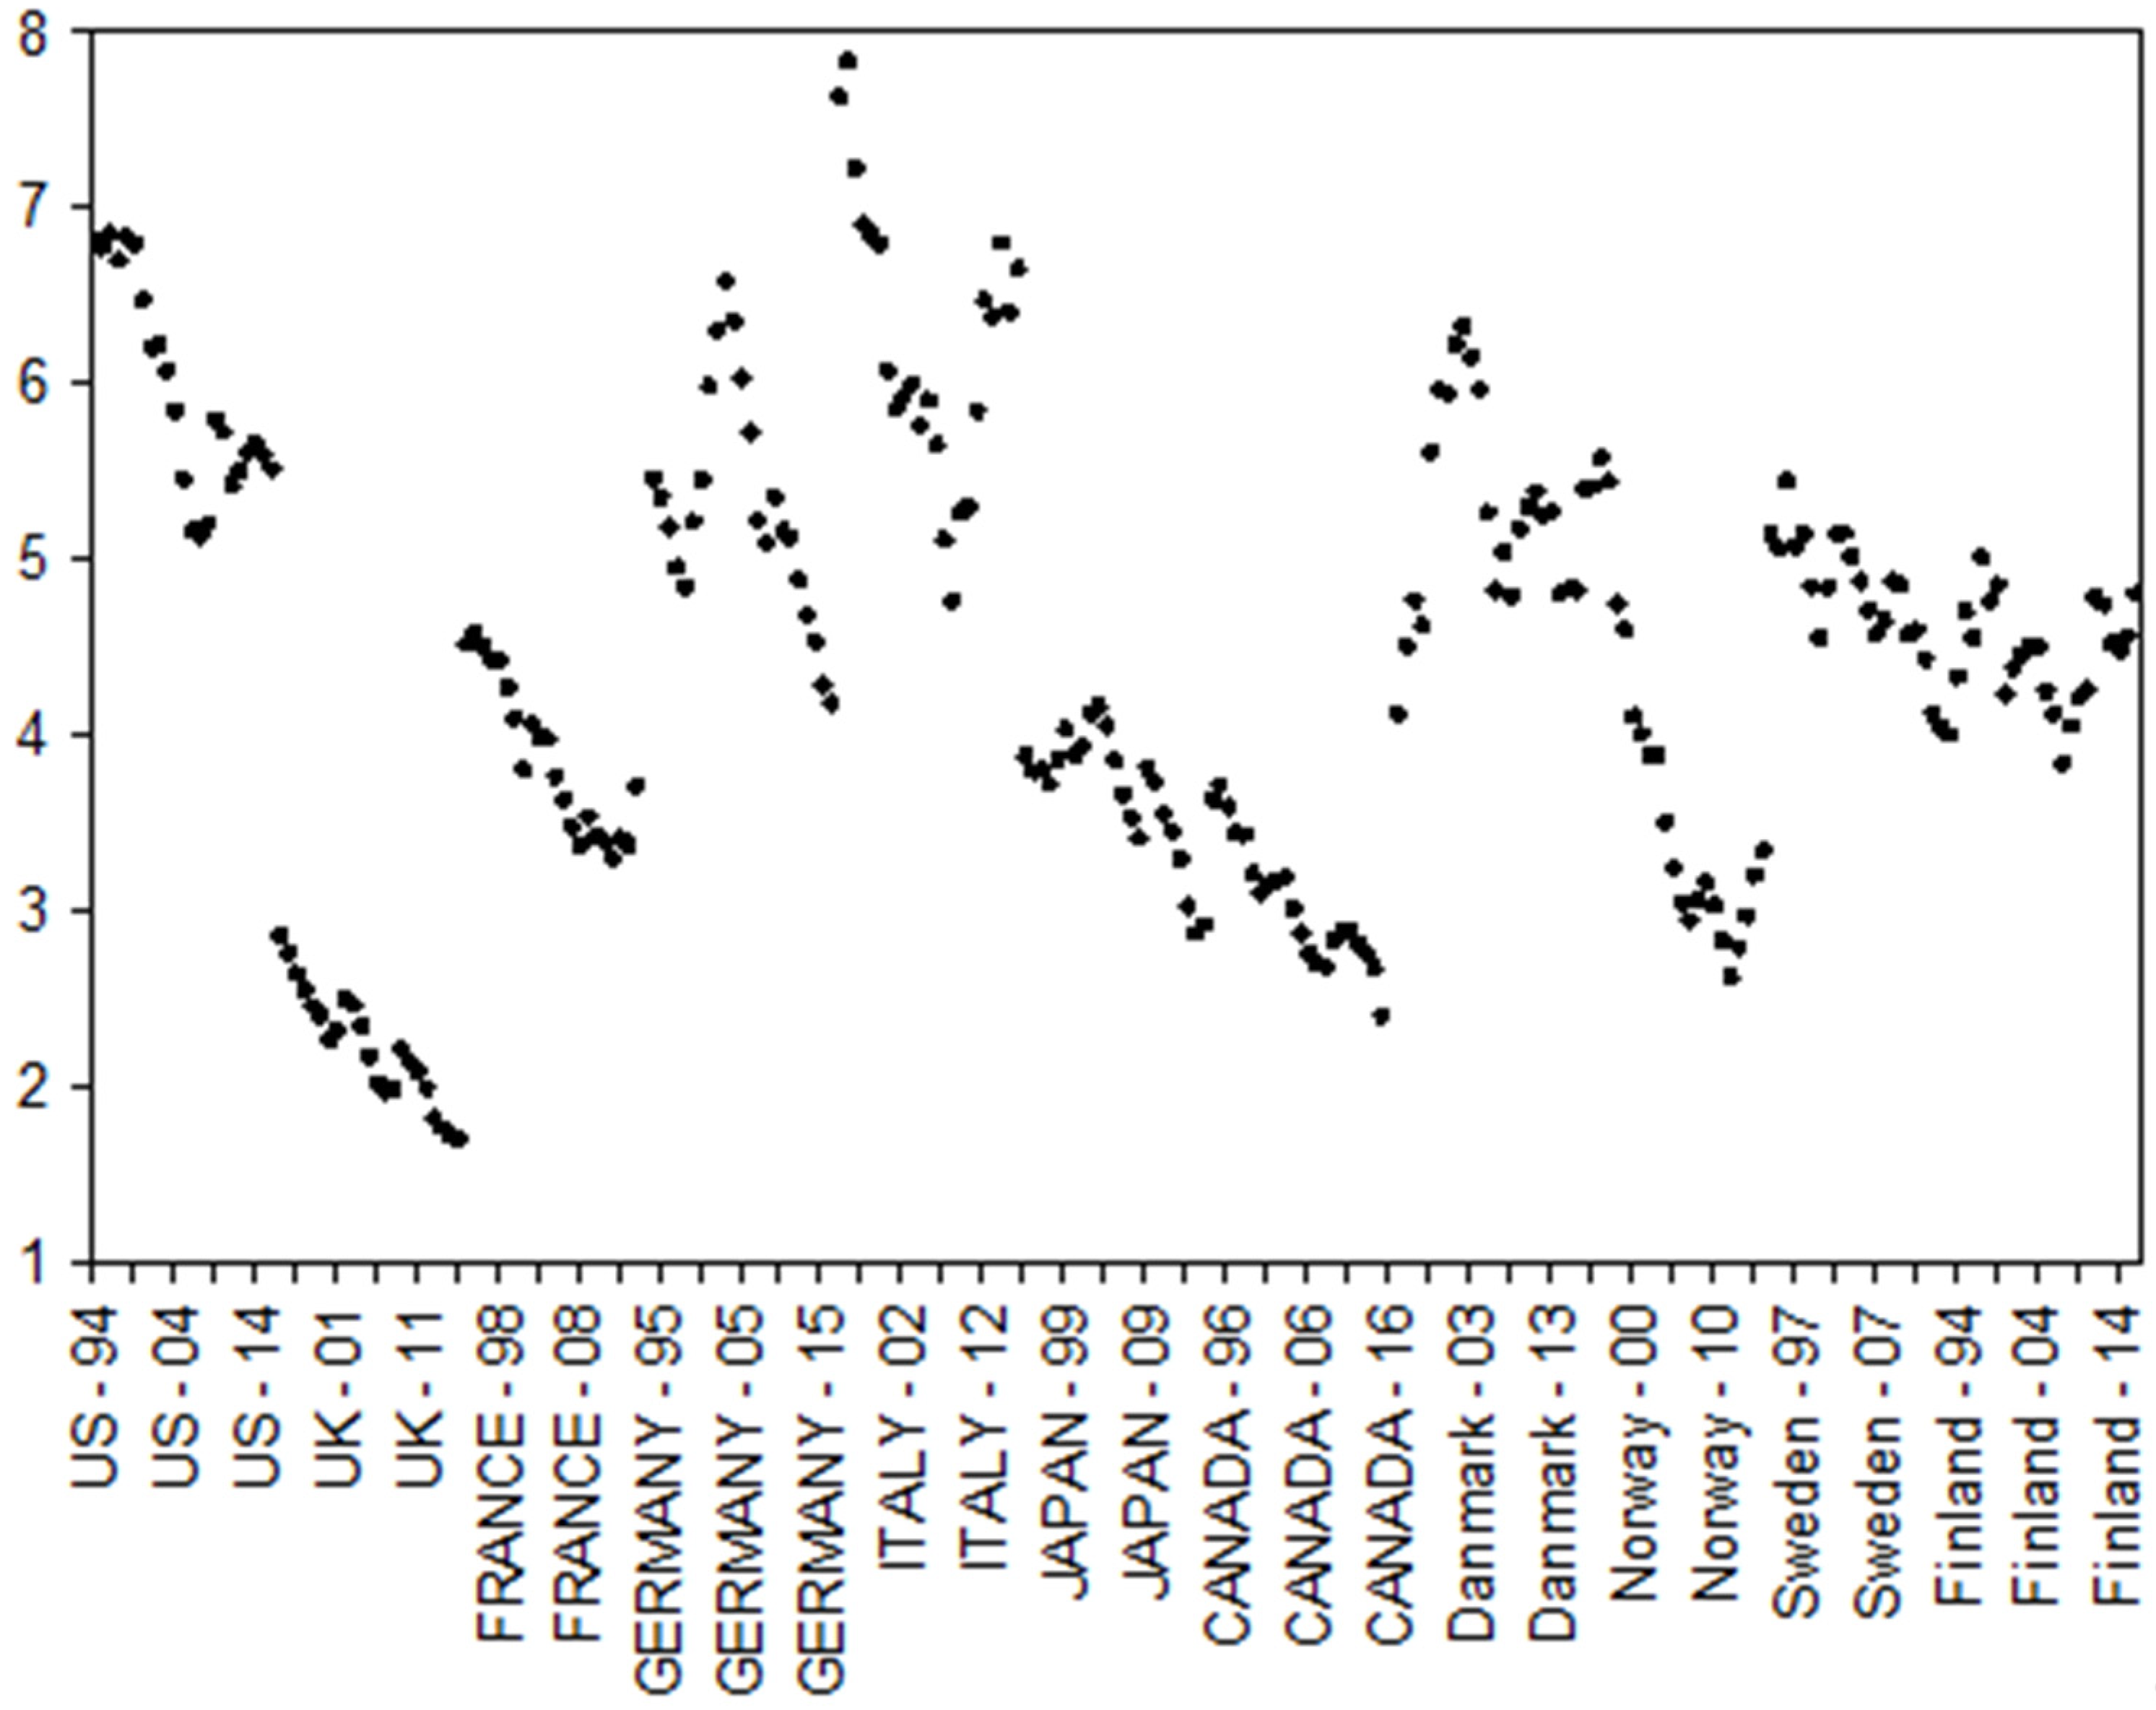
Figure 2 shows the proportion of energy tax in total tax in the four Nordic countries and the G7 countries. As can be seen from the figure, energy taxes in the United States, Germany and Italy account for a large proportion of the total tax revenue. Among them, Italy has the largest proportion, and its annual fluctuation is also large. Britain’s energy tax share is relatively small and stable. Of the four Nordic countries, Denmark has the largest share of energy tax. Finland and Sweden’s share of energy taxes fluctuates slightly. The proportion of energy tax to total tax varies greatly among countries, which provides us with ideas for studying the implementation effect of energy tax.
As the first environmental tax law in China, the Environmental Protection Tax Law of the People’s Republic of China was formally implemented on 1 January 2018. China’s environmental protection tax law is a separate tax law based on "fee to tax". That is to say, the pollutants discharged by enterprises or producers and operators are changed from the original collection of pollutant discharge fees to the collection of environmental protection tax. Because the implementation of environmental tax law in China started late and lacks experience, it can still benefit from useful experience from foreign countries which have implemented environmental taxes. This study can provide some experience for the continuous improvement of China’s environmental tax law. This paper aims to use panel ARDL model to empirically analyze the relationship between energy tax (ET), energy consumption per unit of GDP (GDP), income tax, profit tax and capital gains tax (IPC), fossil fuel combustion ratio (FFC) and carbon dioxide intensity (CO2) in the G7 and the four Nordic countries. A comparative study is conducted in order to provide policy implications for the continuous improvement of China’s environmental tax system. The structure of this paper is as follows: the second part is the literature review of energy tax; the third part is the theoretical analysis and research design; the fourth part is the empirical results and analysis; the fifth part is the research conclusions and inspiration.

2. Literature Review

The European Union has increasingly reached a consensus that the green dividend of environmental tax is to reduce environmental pollution, while the blue dividend is to increase government revenue and reduce fiscal expenditure, promote economic transformation, drive new economic growth points and promote employment growth. Researchers hold different attitudes towards the double dividend effect of environmental tax implementation. On the one hand, Arbolino et al. and Magdalena found that in practice, environmental tax only achieves a green dividend, while the effect of the blue dividend is not obvious [6,7]. On the other hand, Patuelli et al. argued that environmental tax has a positive effect on employment and that there is a blue dividend [8]. Carraro et al. and Glomm were skeptical of the double dividend theory of environmental tax. They believed that environmental tax played a very small role in real life and that environmental tax was not the only tool to control pollution [9,10].
In the process of economic development, on the one hand, energy subsidies increase the financial burden; on the other hand, they promote the emission of pollutants, especially greenhouse gases. Various countries have gradually recognized these limitations of energy subsidies and have gradually eliminated energy subsidies [11]. The World Bank points out that tax and carbon trading systems are two widely used economic tools in the world to reduce carbon dioxide emissions [12]. However, there are fears that the imposition of energy taxes will have a strong impact on prices. Paola, taking European Union countries as research subjects, found that for a few industries in a few European Union countries, the imposition of energy tax would increase prices by 0.5%. This does not add to the burden of people’s lives [13]. Liu took China’s coal industry as the research subject and found that tax reform reduces the coal price and the profitability of the coal industry [14].
David found that there is a consensus that a carbon tax is the best policy to manage greenhouse gas emissions [15]. Energy tax is an important part of environmental tax. Generally speaking, energy tax refers to all kinds of taxes levied on various kinds of energy, including fuel tax, electric power tax and refined oil consumption tax levied by China. IPCC pointed out that 21% of greenhouse gas emissions come from energy production processes, chemical reactions and waste disposal processes in the industrial sector [16]. Lin pointed out that taxing the energy sector is an effective way to save energy, reduce carbon dioxide emissions and improve environmental quality [17]. Cristian found that taxation shows a “peak shape” for Chilean CO2 emissions, but taxation on industrial sectors alone cannot achieve emission reduction targets [18]. Olson argued that the welfare losses of countries that do not tax energy are greater than those of countries that tax energy [19]. Kyle also confirmed this view in finding that Pennsylvania, the second largest gas producing and exporting state in the United States, suffers a great loss of social welfare without a gas tax, in which the electricity sector suffers the most [20]. Presley also held the same view. He pointed out that carbon tax levy could realize the economic dividends of energy, employment and social welfare. Energy dividends are due to private and public sector capital investments in renewable energy technologies, which put pressure on fossil fuels, promote energy efficiency and clean energy use [21]. Djula took EU countries as the research object and found that the rise of energy tax and energy price will affect the final level of energy consumption. In EU countries with less energy consumption, there exists an energy Kuznets curve [22]. The above researchers’ viewpoints confirm that the collection of energy tax has important practical significance.
Taxation is regarded as a transparent policy tool, which can improve economic efficiency and environmental benefits, and bring about the improvement of public finance. Environmental protection tax on energy products aims to improve the environment in a cost-effective way. Many scholars have found that the collection of energy tax can bring a “dividend” effect. Walid studied OECD countries and found that energy tax changed the price of commodities and production inputs, shifted the supply and demand of labor, capital and commodity markets, and also had a regulatory effect on individual income distribution [23]. Low-income groups rely on energy prices. Feng traced the direct and indirect (supply chain) effects of changes in energy prices. He found that eliminating energy subsidies and taxing energy resources will benefit high-income groups more from low energy prices than low-income groups, which may lead to polarization [24]. Niu argued that energy tax can improve energy structure and reduce carbon emissions by introducing clean energy to the market and reducing fossil energy use [25]. Wei’s research on China’s Guangdong found that the collection of energy taxes reduces energy consumption and that the energy-saving and emission-reducing effects of carbon taxes are more effective than energy taxes [26]. Pietro pointed out that the energy tax can realize the transformation of the labor force from the energy sector to the manufacturing sector, and in this way, the factor productivity will be increased and the employment rate of the society will also increase, bringing a blue dividend [27]. Camille used data from 1990 to 2003 from OECD countries and found that for industries with higher wages, higher energy tax rates have a positive effect on TFP and net trade [28]. In the same time, human capital and energy costs have achieved a win-win situation. Sebastian believed that with the increase of income, energy demand increases, but the increase of consumption leads to the increase of energy consumption and carbon emissions [29]. The implementation of energy and carbon taxes has less impact on public transport, but can bring about a social welfare effect and carbon emissions reduction in the short term. However, Arturo found that taxation can improve economic efficiency by correcting existing social deficiencies [30]. In resource-rich economies such as Peru, mining taxes and energy taxes can finance public projects, which will increase social welfare. On the one hand, the levy of energy tax will reduce CO2 emissions; on the other hand, it will promote the use of clean energy [31]. Stanislav found that energy taxes have increased oil prices and promoted the use of nuclear and hydro power, with coal energy taxes, LPG energy taxes, gasoline taxes and palm oil import taxes being negatively correlated with carbon dioxide emissions, that is, they reduce CO2 emissions and bring green dividends [32].
It can be seen that the existing research on the double dividend of energy tax mostly adopts macroeconomic models, CGE models or time series analysis models. The marginal contribution of this paper can be summarized as follows: (1) The existing literature is mostly about carbon tax as the representative tax of environmental tax. This paper focuses on the double dividend of energy tax. Energy tax, as an important part of environmental tax, has high research value. The model used in this paper is a panel ARDL model, which is more suitable for multiple countries, multiple variables and long-term research. This model has been seldomly used in previous studies. The application of panel ARDL model in this paper is not only more scientific and applicable, but also more innovative, which makes up for the shortcomings of previous studies. (2) The subjects of this study are G7 countries and the four Nordic countries. As important economies in the world, they are more perfected and representative in the implementation of environmental tax. The research method used in this paper is not only to study the existence of double dividends alone, but also to further illustrate the effect of energy tax in the two economies by comparing the G7 countries and the four Nordic countries.

3. Theoretical Basis and Research Design

3.1. Double Dividend Theory

Energy tax is the main environmental tax in developed countries. As an important part of environmental tax, it is of great significance to assess the environmental and economic consequences of tax collection. Environment and natural resources are limited, and their value cannot be duplicated, which requires people to achieve coordinated development of economic development and environmental protection in the process of economic development. Starting from the principle of sustainability, human beings must consider the cost of damage to others and the opportunity cost to future generations when utilizing the environment and natural resources, that is, the allocation of intergenerational resources and intergenerational equity, while the government, as the common representative of the interests of contemporary and future generations, exercises the place of environmental resources. It has the right to levy taxes on the use of the environment and natural resources and to use part of the environmental tax revenue as a source of funds for intergenerational compensation. From this point of view, environmental tax plays an intergenerational compensatory role for environmental damage, but the role of environmental tax is not only reflected in the intergenerational compensation and even governance at the environmental level, but also reflected in the adjustment of tax system, tax transfer means to achieve tax adjustment, and further restricting resource-intensive enterprises. Through the reasonable use of the environmental tax income, including energy tax, collected by the resource intensive enterprises, it feeds the development of labor-intensive enterprises, promotes the development vitality of such enterprises, creates more employment opportunities, and in the long run, adjusts the economic structure and promotes the economic development.
The double dividend theory was first proposed by Pearce (1991) to explain the environmental and economic consequences of green tax reform [33]. The first dividend of the double dividend refers to levying environmental tax to effectively suppress pollutant emissions. Environmental tax corrects negative externalities of the environment and improves environmental quality, which is called the green dividend. For example, the rise and development of environmental protection industry has improved the employment market, increasing the employment population, and the environmental tax has reduced the excess tax burden caused by the distorted tax categories such as income tax and capital tax accordingly by shifting the tax burden, thus promoting economic growth and generating economic red profit. Although the double dividend hypothesis is scientific in theory, it can be seen from the empirical research of scholars from all walks of life in recent years that whether the double dividend really exists in practice still has great research space. Many scholars have different views on the role of environmental tax. Presley found that in practice, environmental tax only achieved a green dividend, while the effect of blue dividend was not obvious [33]. On the other hand, Dusan believe that environmental tax can promote employment and there is a blue dividend [34]. In order to better explore the role of energy tax, and even environmental tax, this paper proposes the following two hypotheses based on the double dividend hypothesis:
H1: 
Under the same conditions, energy tax can adjust the energy structure, reduce the burning of fossil fuels, reduce carbon dioxide emissions, improve the ecological environment and realize the green dividend.
H2: 
Under the same conditions, energy tax can promote economic growth, reduce the tax burden of distorted taxes, adjust the tax structure and realize the blue dividend.

3.2. Model Design

According to the characteristics of the selected variable data, this paper uses the panel ARDL model for research. Panel ARDL can solve the problem of insufficient sample size and is suitable for the study of smaller samples. Moreover, panel ARDL is more effective than other linear regression models in avoiding the endogeneity of explanatory variables and explanatory variables. Therefore, in order to test the above Hypothesis H1, we set the following research models as Equations (1) and (2):
C O 2 i t = α i + j = 1 m 1 β i j C O 2 i , t j + l = 0 n 1 φ i l E T i , t l + k = 0 q 1 μ i k I P C i , t k + r = 0 p 1 γ i r G D P i , t r + x = 0 v 1 γ i x F F C i , t x + δ 1 C O 2 i , t 1 +   δ 2 E T i , t 1 +   δ 3 I P C i , t 1 + δ 4 G D P i , t 1 + δ 5 F F C i , t 1 + 1 i , t
F F C i t = α i + j = 1 m 1 β i j F F C i , t j + l = 0 n 1 φ i l E T i , t l + k = 0 q 1 μ i k I P C i , t k   + r = 0 p 1 γ i r G D P i , t r + x = 0 v 1 γ i x C O 2 i , t x + δ 1 F F C i , t 1 + δ 2 E T i , t 1 +   δ 3 I P C i , t 1 + δ 4 G D P i , t 1 + δ 5 C O 2 i , t 1 + 1 i , t
The explained variable in Equation (1) is carbon dioxide intensity and the explanatory variable in Equation (2) is fossil fuel combustion ratio. The explanatory variable is the proportion of energy tax revenue to total tax revenue. At the same time, in order to better explore the green dividend effect of energy tax, this paper uses the relative number of the above two common pollution indicators instead of the absolute number to study.
To test Hypothesis H2, we set the following research models as Equations (3) and (4):
G D P i t = α i + j = 1 m 1 β i j G D P i , t j + l = 0 n 1 φ i l E T i , t l + k = 0 q 1 μ i k I P C i , t k +   s = 0 u 1 γ i s F F C i , t s + x = 0 v 1 γ i x C O 2 i , t x + δ 1 G D P i , t 1 +   δ 2 E T i , t 1 +   δ 3 I P C i , t 1 + δ 4 F F C i , t 1   + δ 5 C O 2 i , t 1 + 1 i , t
I P C i t = α i + j = 1 m 1 β i j I P C i , t j + l = 0 n 1 φ i l E T i , t l + k = 0 q 1 μ i k G D P i , t k +   s = 0 u 1 γ i s F F C i , t s + x = 0 v 1 γ i x C O 2 i , t x + δ 1 I P C i , t 1 +   δ 2 E T i , t 1 + δ 3 G D P i , t 1 + δ 4 F F C i , t 1 + δ 5 C O 2 i , t 1 + 1 i , t
The explanatory variables in Equations (3) and (4) are energy consumption per unit of GDP, income tax, profit tax and capital gains tax. The explanatory variable is still the ratio of energy tax revenue to total tax revenue. Considering that the impact of energy tax revenue on other variables may be lagging, and in order to avoid the endogeneity of variable data, this paper will lag the variables in the first phase. Δ and k i , t ( k = 1 , 2 , 3 ) are first-order difference terms and white noise terms of each variable. In addition, α i represents the intercept term of different countries. The internal regression coefficients α , β , φ , γ , μ   a n d   τ are the same in different countries. The subscript i is a specific unit and varies from 1 to N. At the same time, this paper will determine the optimal lag time of each variable based on the minimization of Schwarz Information Criterion (SBIC).

3.3. Variables and Data

This paper chooses the four Nordic countries and G7 countries from 1994 to 2016 as research samples. The data of environmental tax in this paper come from the OECD database, which provided environmental tax information from 1994. The research variables used in this article are as follows: ET (the proportion of energy tax revenue to total tax revenue), CEC (the proportion of clean energy consumption to total energy consumption), FFC (the proportion of fossil fuel combustion to total combustion), GHE (the proportion of energy-related greenhouse gas emissions), energy consumption per unit of GDP, and IPC (income tax, profit tax and capital gains tax to total energy consumption). The above variable data are from the OECD database. At the same time, in order to avoid the influence of the units of measurement of the above variables on the experimental results, this paper standardizes them in the form of a ratio.
From the descriptive statistics in Table 1, we can see that the average level of energy tax in the four Nordic countries and the G7 countries is greater than 4%. The proportion of energy tax in the four Nordic countries is slightly higher than that in the G7 countries and the Nordic environmental tax collection is generally stronger. However, there is a large polarization in general, especially in G7 countries; the difference between the maximum and minimum of energy tax ratio can reach 6%. Further observations show that among the indicators reflecting the green dividend, in the proportion of fossil fuel combustion the average level of G7 countries (close to 80%) is much higher than that of the four Nordic countries (less than 60%). In addition, among the indicators reflecting the blue dividend, the average proportion of distorted taxes in the G7 countries is also higher than that in the four Nordic countries.

3.4. Method Framework

The research methods used in this study are as follows: First, the panel unit root test is performed on the variables to test the stability of the variables to prevent the occurrence of pseudo-regression. The unit root test methods used in this study were IPS test, ADF-Fisher test and PP-Fisher test. If the unit root test result is that the original sequence is stable, the cointegration test can be directly performed on the panel ARDL test. If the unit root test result is the same order, the cointegration test is needed to check whether there is a long-term relationship between the variables. If the unit root test results are mixed and stable, then will be studied with the panel ARDL model. In addition, this study will introduce Granger causality analysis to explore whether there is a statistically predictable relationship between variables.

4. Empirical Results and Analysis

4.1. Unit Root Test

In the panel data analysis, in order to avoid the result of pseudo-regression, it is necessary to confirm the stationary order between the variables, that is, the unit root test. In this paper, IPS test, ADF-Fisher test and PP-Fisher test are used to determine the order of stability between variables. When the results of the three methods are different, they are determined according to the voting principle. According to the results of Table 2, we can see that for the four Nordic countries and the G7 countries, all the research variables are first-order stationary, which conforms to the same order and completes the conditions of the cointegration test; in addition, the unit root test results are the same, meeting the conditions of the panel ARDL. The unit root test results of the four Nordic countries and G7 countries are shown in Table 3.

4.2. Cointegration Test

In order to further understand the long-term relationship between variables, the co-integration test is carried out in this paper. The methods used are Pedroni residual co-integration test and Johansen Fisher panel co-integration test. The experimental results are shown in Table 4 and Table 5.
The experimental results in Table 3 show that for Pedroni residual cointegration test, the test results of group PP and group ADF are significant at the 1% confidence level. The results of panel PP and panel ADF were also significant at the 1% significance level. For Johansen Fisher panel co-integration test, the original hypothesis of up to four co-integration relations was rejected at the 5% confidence level. It can be seen that for the four Nordic countries, there is a co-integration relationship among variables.
The experimental results in Table 4 show that for Pedroni residual cointegration test, the test results of group PP and group ADF are significant at the 1% confidence level. The results of panel PP and panel ADF were significant at 5% and 1%, respectively. For Johansen Fisher panel co-integration test, the original hypothesis of up to four co-integration relations was rejected at the 5% confidence level. It can be seen that for the G7 countries, there is a co-integration relationship between variables.

4.3. Panel ARDL Test

In this paper, the panel ARDL method is used to determine the long-term relationship between variables. At the same time, through the error correction coefficient ECT under this method, the time adjustment speed of the path needed for the variable from short-term equilibrium to long-term equilibrium can be determined. The results of the panel ARDL test are shown in Table 5 and Table 6:
According to the results in Table 5, for the four Nordic countries, the ARDL test results show that, in the long run, when energy tax is the explanatory variable, GDP, carbon dioxide intensity, fossil fuel combustion and distorted tax share are significantly higher than the 1% confidence level. Specifically, in the long run, the collection of energy tax will bring about the growth of GDP and the reduction of distorted taxes. For every unit of energy tax, GDP will increase by about 0.35 units, while distorted taxes will decrease by about 6.19 units. This shows that the four Nordic countries have long-term and significant blue dividends through energy tax collection. On the other hand, with the imposition of energy tax, the proportion of fossil fuel combustion will increase, and the density of carbon dioxide will decrease. For every unit of energy tax increase, the proportion of fossil fuel combustion will increase by 1.2 units, which is actually due to the fact that the four Nordic countries pay attention to the development of environmental protection technologies, such as desulfurization, while vigorously developing clean energy. The Nordic countries are gradually promoting the control standards of air pollutants for coal-fired thermal power units, and the flue gas treatment technology for coal-fired thermal power units is also constantly improving. In northern European countries, low NOx burners, SCR (Selective Catalytic Reduction) flue gas denitrification process, electrostatic precipitators, and limestone and gypsum wet flue gas desulfurization processes are mainly adopted in large coal-fired thermal power units. This paper holds that, although the collection of energy tax has brought about an increase in the proportion of fossil fuel combustion in the long run, its fossil fuel causes little damage to the environment under the support of its environmental protection technology. In addition, the carbon dioxide intensity will be reduced by 0.5 units for each additional unit of energy tax. This shows that the four Nordic countries have long-term and significant reductions in greenhouse gas emissions through the imposition of energy taxes, releasing a green dividend. In the short run, the energy tax will bring about a reduction in the proportion of distorted taxes, adjust the tax structure and bring blue dividends. Thus, for the four Nordic countries, in the short run, there is a blue dividend for energy tax to reduce the tax burden of distorted taxes. In the long run, energy tax can not only promote the economy and adjust the tax structure of the blue dividend, but also reduce the carbon dioxide intensity.
According to the results of Table 6, for G7 countries the ARDL test results show that in the long run, when the energy tax is the explanatory variable, the GDP, the proportion of fossil fuel combustion and the proportion of distorted tax are all significant at the confidence level of 1%. In particular, it is slightly different from the four Nordic countries. In the long run, with the imposition of energy tax, GDP will decrease by 0.19 units, which contradicts the idea of the blue dividend because the blue dividend theory implies that the collection of environmental tax drives the growth of GDP. At the same time, the proportion of fossil fuel combustion will be reduced by 0.6 units for every additional unit of energy tax, which is in line with the view of the green dividend. However, it is worth mentioning that the energy tax will lead to the increase of carbon dioxide intensity in G7 countries. Thus, although the collection of energy tax effectively reduces the proportion of fossil fuel consumption in G7 countries, the effect of carbon dioxide emission reduction is not significant. On the other hand, in the short run, the energy tax will bring about a reduction in the proportion of distorted taxes, which will adjust the tax structure and bring blue dividends in the short run.
Thus, for G7 countries, in the short run, there is a blue dividend in energy tax for transferring the tax burden of distorted taxes. In the long run, the energy tax has only a green dividend in reducing the proportion of fossil fuel burning consumption and its role in reducing carbon emissions has not been effectively realized. Instead of promoting economic growth, it inhibits GDP. This conclusion contradicts the idea of the blue dividend.

4.4. Granger Causality Test

Granger causality test is used to analyze Granger causality between economic variables. It is a statistical “Granger causality” rather than a real causality. It cannot be used as a basis for affirming or negating causality. Of course, even if Granger causation is not equal to actual causation, it does not hinder its reference value. In economics, Granger causality in the statistical sense is also meaningful and can still play a role in economic forecasting and so on. Table 7 shows the results of long-term and short-term Granger causality test in this paper. The results of long-term Granger causality test are derived from the error correction term ECT in ARDL test.
Specifically, the results of the Granger causality test in the long-run are as follows: for the four Nordic countries, there is Granger correlation among the variables. For G7 countries, the situation is different. When ET is an interpreted variable, the Granger relationship does not exist. At the same time, the short-term results are as follows: for the four Nordic countries, energy tax is the Granger cause of distorted taxes, the proportion of fossil fuel combustion and carbon dioxide intensity; for G7 countries, it can only be proved that energy tax is the Granger cause of GDP, while distorted tax is the Granger cause of energy tax.
Table 8 shows the comparison of energy tax double dividend effect between G7 countries and Nordic countries. Comparing the results of the experiment in this paper, we can find that firstly, for the green dividend imposed by the energy tax, the four Nordic countries have significantly reduced the carbon dioxide intensity. However, this has little effect on promoting the reduction of fossil energy consumption to improve the structure of energy consumption. The green dividend of G7 countries significantly reduces the proportion of fossil fuels in energy consumption and promotes the transformation of energy consumption structure. This is the same view as that held by Niu Tong [20]. Secondly, in terms of the blue dividends imposed by the energy tax, the four Nordic countries are perfect. With the imposition of energy tax, GDP has increased significantly, and the proportion of distorted taxes has decreased significantly. Obviously, while imposing energy tax, the four Nordic countries reduce the existing tax burden of labor, capital and other factors, achieve tax shifting and maintain tax neutrality. For example, the Swedish government converted the tax burden of 30 billion Swedish kronor (3.3 billion euros) into a green tax in 2001–2010. The blue dividend effect of the G7 national energy tax is relatively weak. In the long run, the energy tax levied by G7 countries also reduces the distorted tax share to a certain extent, but the experimental results are not significant. Thirdly, the experiment shows that the energy tax levied by G7 countries has little effect on reducing greenhouse gas emissions in the long run. Fourthly, on the whole, the double dividend effect of energy tax in the four Nordic countries is better than that in the G7 countries. In fact, the four Nordic countries, as represented by Sweden, were the first EU countries to develop and implement economic means in the field of environmental protection. Environmental taxes, fees and many other economic means are widely used in environmental protection. All the four Nordic countries attach great importance to environmental protection, and their environmental protection ideas are deeply rooted in the hearts of the people. The energy tax levied by the four European countries can restrain greenhouse gas emissions and help solve environmental problems. At the same time, the use of increased energy tax revenue instead of distorting tax revenue (such as income tax) in the economic system can encourage employment. This income is used to reduce or eliminate the additional tax burden, which leads to the improvement of the efficiency of the tax system itself.

5. Conclusions and Policy Enlightenment

According to the “double dividend” theory of environmental tax, this paper chooses the representative energy tax in environmental tax. In terms of green dividend index, two variables, the proportion of fossil fuel combustion and the density of carbon dioxide, were selected. In terms of blue dividend index, two variables were selected: energy consumption per unit of GDP and the proportion of income tax, profit tax and capital gains tax. By using unit root test, cointegration test, Granger causality test and other econometric methods, this paper makes a comparative analysis of the four Nordic countries and the G7 countries. The experimental results show that the existence of green dividends has been found in the four Nordic countries and the G7 countries for a long time. The difference between the two is that the green dividends of the four Nordic countries are reflected in the reduction of carbon dioxide emissions, while those in the G7 countries are reflected in the reduction of fossil fuel use. In addition, in terms of blue dividends, the energy tax performance of the two economies is also very different. The implementation of energy tax in the four Nordic countries can not only reduce distorted taxes in the short term, but also promote economic growth, adjust tax structure and reflect the blue dividend in the long run. For G7 countries, the blue dividend has not been reflected in the long run.
Through this study, we can get some inspiration for the design and improvement of China’s environmental tax system. First, the realization of the blue dividend in the double dividend is to use environmental tax to offset the existing tax burden on the premise of tax neutrality, thus causing market distortions. For example, personal income tax, enterprise income tax and so on, improve the allocation efficiency of resources. Taxation of products or factors of production (e.g., labor and capital) usually results in unnecessary loss of welfare. This is the distorting effect of some taxes. For example, the imposition of personal income tax and VAT are borne by the final consumers, which inhibits the growth of domestic consumption demand and then inhibits the long-term balanced income of the economy, increases the personal burden and squeezes out consumption and investment. The increase of government purchases in GDP makes government purchases account for a large proportion of GDP, which is not conducive to economic operation. This study shows that the energy tax of the four Nordic countries and the G7 countries is accompanied by distorted tax reduction in both the long-term and short-term effects. For example, for each additional unit of energy tax in the four Nordic countries, the distorted tax will be reduced by 6.19 units (Table 5). This shows that the way to realize the blue dividend is to follow tax neutrality and implement tax burden transition. While increasing the environmental tax, substantial tax cuts for other distorted taxes will be made, the additional burden of tax will be reduced, the unnecessary loss of social welfare will be reduced and the blue dividend will be fully realized. Secondly, the dual dividend effect of energy tax in the four Nordic countries is better than that in G7 countries on the whole. This shows that the reasonable test standard of the green tax system with energy tax as its core should be in the dimensions of protecting the environment, increasing tax revenue, reducing distorted tax burden and improving energy structure. The validity of the dividend effect is fully tested.

Author Contributions

P.H. and S.L. conceived and designed the research method used in this paper; L.C. and X.Z. collected the data used for empirical analysis; H.S. and J.J. performed the empirical analysis and wrote the paper.

Funding

This research was funded by the National Social Science Fund of China (17BGL051).

Conflicts of Interest

The authors declare no conflict of interest.

References

  1. Xiao, D.J. Energy tax is an opportunity for sustainable development of tax system reform. Econ. Prospects 2007, 7, 105–112. [Google Scholar]
  2. Qiao, Y.P.; Chu, C.J. Pigou Tax Reform, Depletable Resources Allocation and Economic Growth. Res. Econ. Manag. 2018, 2, 19–30. [Google Scholar]
  3. Feng, H.B. Promoting circular economy by means of Taxation. Tax. Res. 2005, 9, 10–14. [Google Scholar]
  4. Xu, X. German Energy Tax Collection and Management from the Perspective of Finance and Its Reference to China. German Stud. 2011, 3, 44–79. [Google Scholar]
  5. OECD. Statistics Stats Database. Available online: http://stats.oecd.org (accessed on 19 October 2019).
  6. The BP World Energy Statistics Yearbook. Available online: http://www.bp.com/statisticalreview (accessed on 19 October 2019).
  7. Magdalena, R.; Crenguta, I.S. Environmental Tax Policy in Romania in the Context of the EU: Double Dividend Theory. Sustainaability 2017, 9, 1986. [Google Scholar] [Green Version]
  8. Arbolino, R. A methodological approach for assessing policies: The case of the Environmental Tax Reform at European level. Sci. Direct 2014, 17, 202–210. [Google Scholar] [CrossRef]
  9. Patuelli, R.; Nijkamp, P.; Pels, E. Environmental tax reform and the double dividend: A meta-analytical performance assessment. Ecol. Econ. 2005, 55, 564–583. [Google Scholar] [CrossRef]
  10. Carraro, C.; Galeotti, M.; Gallo, M. Environmental taxation and unemployment: Some evidence on the ‘double dividend hypothesis’ in Europe. J. Public Econ. 1996, 62, 141–181. [Google Scholar] [CrossRef]
  11. Glomm, G.; Kawaguchi, D.; Sepulveda, F. Green taxes and double dividends in a dynamic economy. J. Policy Model. 2008, 30, 19–32. [Google Scholar] [CrossRef] [Green Version]
  12. World Bank Group. State and Trends of Carbon Pricing; World Bank Group: Washington, DC, USA, 2015. [Google Scholar]
  13. Paola, R.; Mònica, S.; Jordi, R. The reform of the European energy tax directive: Exploring potential economic impacts in the EU27. Energy Policy 2014, 75, 341–353. [Google Scholar]
  14. Liu, H.H.; Zhan, M.C.; Jian, L.W. The impact of resource tax reform on China’s coal industry. Energy Econ. 2017, 61, 52–61. [Google Scholar] [CrossRef]
  15. David, M.M. Negotiating a uniform emissions tax in international environmental agreements. J. Environ. Econ. Manag. 2018, 90, 217–231. [Google Scholar]
  16. IPCC. Climate Change 2014: Mitigation of Climate Change; Cambridge University Press: Cambridge, UK, 2015. [Google Scholar]
  17. Lin, B.Q.; Zhi, J.J. How does tax system on energy industries affect energy demand, CO2 emissions, and economy in China? Energy Econ. 2019. [Google Scholar] [CrossRef]
  18. Cristian, M. Effectiveness of a CO2 tax on industrial emissions. Energy Econ. 2018, 41, 370–382. [Google Scholar]
  19. Olson, D.O. The interregional incidence of energy-production taxes. Int. Reg. Sci. Rev. 1984, 9, 109–124. [Google Scholar] [CrossRef]
  20. Kyle, A.H. Unconventional energy, taxation, and interstate welfare: An analysis of Pennsylvania’s severance tax policy. Energy Econ. 2018, 73, 53–65. [Google Scholar]
  21. Wesseh, P.K., Jr.; Boqiang, L. Environmental policy and ‘double dividend’ in a transitional economy. Energy Policy. 2019. [Google Scholar] [CrossRef]
  22. Djula, B. Unveiling the heterogeneous effect of energy taxes and income on residential energy consumption. Energy Policy 2019, 129, 13–22. [Google Scholar]
  23. Walid, O. Energy taxes, reforms and income inequality: An empirical cross country analysis. Int. Econ. 2017, 150, 80–95. [Google Scholar]
  24. Feng, K.; Hubacek, K.; Liu, Y.; Marchán, E.; Vogt-Schilb, A. Managing the distributional effects of energy taxes and subsidy removal in Latin America and the Caribbean. Appl. Energy 2018, 225, 424–436. [Google Scholar] [CrossRef] [Green Version]
  25. Niu, T. Environmental tax shocks and carbon emissions: An estimated DSGE model. Struct. Chang. Econ. Dyn. 2018, 47, 9–17. [Google Scholar] [CrossRef]
  26. Wei, C. Effects of an Energy Tax (Carbon Tax) on Energy Saving and Emission Reduction in Guangdong Province-Based on a CGE Model. Sustainability 2017, 9, 230–250. [Google Scholar]
  27. Pietro, F.P. Energy taxes and endogenous technological change. J. Environ. Econ. Manag. 2009, 57, 269–283. [Google Scholar] [Green Version]
  28. Camille, G. Energy-tax changes and competitiveness: The role of adaptive capacity. Energy Econ. 2015, 48, 127–135. [Google Scholar]
  29. Sebastian, R. Household welfare and CO2 emission impacts of energy and carbon taxes in Mexico. Energy Econ. 2018, 72, 222–235. [Google Scholar]
  30. Pearce, D.W. Repetto. The role of carbon taxes in adjusting to global warming. Econ. J. 1991, 101, 938–948. [Google Scholar] [CrossRef]
  31. Arturo, L.V.C. The marginal cost of public funds of mineral and energy taxes in Peru. Resour. Policy 2010, 35, 257–264. [Google Scholar]
  32. Stanislav, E.S. Green fiscal reform in Sweden: Econometric assessment of the carbon and energy taxation scheme. Renew. Sustain. Energy Rev. 2018, 90, 969–981. [Google Scholar]
  33. Presley, K.W.; Lin, B.Q.; Philip, A. Carbon taxes, industrial production, welfare and the environment. Energy 2017, 123, 305–313. [Google Scholar]
  34. Dusan, P. Mineral taxes and the local public goods provision in mining communities. Resour. Policy 2017, 53, 328–339. [Google Scholar]
Figure 1. Trends in carbon emissions in the four Nordic countries and G7 countries from 1994 to 2016 (unit: million metric tons; data source: BP Energy Statistics Yearbook).
Sustainability 11 06100 g001
Figure 2. Tax as a share of total tax revenue in the four Nordic countries and G7 countries from 1994 to 2016 (unit: %; data source: BP Energy Statistics Yearbook).
Sustainability 11 06100 g002
Table 1. Descriptive statistics
CountriesThe Four Nordic CountriesG7 Countries
VariablesETFFCCO2GDPIPCETFFCCO2GDPIPC
Mean4.5656.031.747.4124.904.3379.012.258.7343.03
Median4.6753.481.636.4720.844.0482.862.398.6436.03
Max6.3198.533.2916.6848.057.8294.682.7814.0692.59
Min2.6126.840.903.095.541.6946.211.253.9914.40
Std.Dev0.8118.970.622.9010.671.5212.370.392.5523.23
Skewness−0.410.590.690.970.430.20−1.41−1.300.000.95
Kurtosis3.052.412.663.701.891.993.923.552.203.026
Sum419.244930.48146.08635.872291.11688.2012,167.5330.541343.916884.34
Sum Sq. Dev60.0331,309.6431.60738.3910,353.18362.8923,429.8821.79995.0685,766.04
Table 2. Panel original sequence and first-order differential sequence unit root test results.
VariableIm, Pesaran and Shin W-StatADF—Fisher Chi-SquarePP—Fisher Chi-Square
LevelFirst DifferenceLevelFirst DifferenceLevelFirst Difference
The Four Nordic CountriesET−0.70628−1.67864 **12.099618.4604 **8.7131644.3254 ***
(0.2400)(0.0466)(0.1468)(0.0180)(0.3671)(0.0000)
FFC2.60237−8.75530 ***2.2572066.8048 ***2.8079371.1157 ***
(0.9954)(0.0000)(0.9721)(0.0000)(0.9458)(0.0000)
CO21.10817−8.96173 ***2.7101667.7996 ***3.2935976.4810 ***
(0.8661)(0.0000)(0.9512)(0.0000)(0.9146)(0.0000)
GDP3.31260−2.52402 ***1.8169328.4721 ***2.2609240.3021 ***
(0.9995)(0.0058)(0.9861)(0.0004)(0.9719)(0.0000)
IPC0.16723−3.20998 ***6.9746924.9579 ***20.3352 ***74.3412 ***
(0.5664)(0.0007)(0.5394)(0.0016)(0.0091)(0.0000)
G7 CountriesET0.19119−3.11385 ***10.455933.1571 ***6.3302952.7925 ***
(0.5758)(0.0009)(0.7281)(0.0027)(0.9575)(0.0000)
FFC3.84809−1.9956 ***5.2213844.2051 ***5.6931084.3435 ***
(0.9999)(0.0000)(0.9825)(0.0001)(0.9736)(0.0000)
CO23.26303−4.66914 ***5.8937248.3170 ***7.9727978.3616 ***
(0.9994)(0.0000)(0.9691)(0.0000)(08907)(0.0000)
GDP6.10684−7.85028 ***0.3338780.7893 ***0.26705109.396 ***
(1.0000)(0.0000)(1.0000)(0.0000)(1.0000)(0.0000)
IPC−0.87883−6.69879 ***16.346967.5003 ***17.685063.9838 ***
(0.1897)(0.0000)(0.2927)(0.0000)(0.2215)(0.0000)
Note: The values in parentheses are the p-values of the statistics; ***, **indicate statistical significance at the 1%, 5% and 10% levels, respectively.
Table 3. Panel cointegration test results—the four Nordic countries.
Pedroni Residual Cointegration Test
Alternative Hypothesis: Individual AR Coefficients (Between-Dimension)
StatisticProb.
Group PP-Statistic−2.796193 ***(0.0026)
Group ADF-Statistic−3.956672 ***(0.0000)
Panel PP-Statistic−3.402303 ***(0.0003)
Panel ADF-Statistic−4.057923 ***(0.0000)
Johansen Fisher Panel Cointegration Test
HypothesizedFisher Stat.* Fisher Stat.*
No. of CE(s)(from trace test)Prob.(from max-eigen test)Prob.
None102.80 ***(0.0000)63.40 ***(0.0000)
At most 150.58 ***(0.0000)31.28 ***(0.0001)
At most 226.19 ***(0.0010)16.58 **(0.0348)
At most 317.80 **(0.0228)15.13*(0.0567)
At most 412.27(0.1397)12.27(0.1397)
Note: The values in parentheses are the p-values of the statistics; ***, ** and * indicate statistical significance at the 1%, 5% and 10% levels, respectively.
Table 4. Panel cointegration test results—G7 countries.
Pedroni Residual Cointegration Test
Alternative Hypothesis: Individual AR Coefficients (Between-Dimension)
StatisticProb.
Group PP-Statistic−4.113036 ***(0.0000)
Group ADF-Statistic−4.876116 ***(0.0000)
Panel PP-Statistic−2.317972 **(0.0102)
Panel ADF-Statistic−2.330052 ***(0.0099)
Johansen Fisher Panel Cointegration Test
HypothesizedFisher Stat.* Fisher Stat.*
No. of CE(s)(from trace test)Prob.(from max-eigen test)Prob.
None158.00 ***(0.0000)78.13 ***(0.0000)
At most 194.26 ***(0.0000)50.02 ***(0.0000)
At most 256.61 ***(0.0000)41.52 ***(0.0001)
At most 328.37 **(0.0127)27.54 **(0.0164)
At most 417.70(0.2206)17.7(0.2206)
Note: The values in parentheses are the p-value of the statistics; ***, ** indicate statistical significance at the 1%, 5% and 10% levels, respectively.
Table 5. Long-run and short-run panel ARDL dynamic estimate results—the four Nordic countries.
Dependent VariableD(ET)D(GDP)D(IPC)D(FFC)D(CO2)
Long-Run Estimate
ET 0.353489 ***−6.190508 ***1.196771 ***−0.048011 ***
(0.0039)(0.0000)(0.0000)(0.0000)
GDP0.209872 *** −1.431178 ***−0.121613 ***0.004390 ***
(0.0096) (0.0055)(0.0005)(0.0016)
IPC−0.0816380.085686 *** 0.065495 ***−0.001975 ***
(0.1363)(0.0079) (0.0006)(0.0032)
FFC−0.262856 **−0.375235 ***−0.606193 0.034926 ***
(0.0101)(0.0000)(0.2794) (0.0000)
CO210.72573 ***4.572594 **21.1047229.66976 ***
(0.0001)(0.0393)(0.1839)(0.0000)
Short-Run Estimate
ECTt-1−0.128714 *−0.524518 ***−0.446165 ***−0.531627 **−0.531148 **
(0.0699)(0.0061)(0.0021)(0.0469)(0.0167)
D(ET) 0.044202−2.578065 **−0.1376660.019288
(0.7983)(0.0029)(0.7937)(0.2043)
D(GDP)−0.078801 0.914756 *−0.223433−0.020288
(0.4645) (0.0541)(0.2780)(0.1174)
D(IPC)−0.042837 ***−0.001632 −0.0079910.000436
(0.0000)(0.5966) (0.8443)(0.6445)
D(FFC)0.316300.0702860.361226 0.016528 *
(0.4759)(0.5016)(0.4650) (0.0532)
D(CO2)−1.612523 *−1.614069−9.0175208.863080
(0.0531)(0.5300)(0.3838)(0.1063)
Note: The values in parentheses are the p-values of the t-statistics of the coefficients; ***, ** and * indicate statistical significance at the 1%, 5% and 10% levels.
Table 6. Long-run and short-run panel ARDL dynamic estimate results—G7 countries.
Dependent VariableD(ET)D(GDP)D(IPC)D(FFC)D(CO2)
Long-Run Estimate
ET −0.189021 ***−304.1514−0.605548 ***0.018064 ***
(0.0018)(0.9890)(0.0001)(0.0004)
GDP3.690109 *** 724.2573−0.872943 ***0.026282 ***
(0.0000) (0.9890)(0.0000)(0.0000)
IPC−0.970884 ***0.015821 * 0.105522 ***−0.003419 ***
(0.0000)(0.0776) (0.0000)(0.0000)
FFC1.503700 **0.022467−183.1966 0.033201 ***
(0.0112)(0.3814)(0.9891) (0.0000)
CO2−26.69562 *−0.8469887162.48829.63718 ***
(0.0570)(0.1887)(0.9890)(0.0000)
Short-Run Estimate
ECTt-1−0.060265−0.550519 ***−0.000865 *−0.376764 *−0.366474 *
(0.2948)(0.0041)(0.0939)(0.0916)(0.0880)
D(ET) −0.119879−5.305537 **0.791161−0.023050
(0.5197)(0.0146)(0.1832)(0.1209)
D(GDP)−0.253480 ** −1.4375360.460659−0.016865
(0.0369) (0.5371)(0.4101)(0.3169)
D(IPC)−0.0347960.030643 0.0015860.001044
(0.4057)(0.2312) (0.9478)(0.3370)
D(FFC)−0.0464310.0054970.137367 0.020229 ***
(0.5661)(0.9047)(0.6908) (0.0069)
D(CO2)−0.047154−1.4678945.82862113.12742 **
(0.9745)(0.4775)(0.5263)(0.0254)
Note: The values in parentheses are the p-values of the t-statistics of the coefficients; ***, ** and * indicate statistical significance at the 1%, 5% and 10% levels, respectively.
Table 7. Long-term and short-term Granger causality test results.
Short-Run CausalitiesLong-Run CausalitiesECTt--1
The Four Nordic Countries
D(GDP) ⇒ D(FFC)3.81296 ***(0.0077) f ( E T | G D P , I P C , F F C , C O 2 ) −0.12871*
D(GDP) ⇒ D(IPC)2.17006 *(0.0823) f ( G D P | E T , I P C , F F C , C O 2 ) −0.524518***
D(ET) ⇒ D(IPC)2.54630 **(0.0473) f ( I P C | E T , G D P , F F C , C O 2 ) −0.44617***
D(ET) ⇒ D(FFC)2.27116 *(0.0714) f ( F F C | E T , G D P , I P C , C O 2 ) −0.531627**
D(ET) ⇒ D(CO2)3.54156 **(0.0117) f ( C O 2 | E T , G D P , I P C , F F C ) −0.531148**
G7 Countries
D(ET) ⇒ D(GDP)2.42195 *(0.0926) f ( E T | G D P , I P C , F F C , C O 2 ) −0.060265
D(IPC) ⇒ D(ET)3.36856 **(0.0373) f ( G D P | E T , I P C , F F C , C O 2 ) −0.550519***
D(IPC) ⇒ D(GDP)5.29987 ***(0.0061) f ( I P C | E T , G D P , F F C , C O 2 ) −0.000865*
D(IPC) ⇒ D(FFC)3.92135 **(0.0221) f ( F F C | E T , G D P , I P C , C O 2 ) −0.376764*
D(IPC) ⇒ D(CO2)3.73585 **(0.0265) f ( C O 2 | E T , G D P , I P C , F F C ) −0.366474*
Table 8. Comparison of the effects of double dividends of energy tax between the four Nordic countries and G7 countries.
Variable Model Hypothesis The Nordic Four CountriesG7 Countries
Long-Term Effect Short-Term Effect Long-Term Effect Short-Term Effect
Green DividendCarbon Dioxide Intensity−(1% level is significant)+ (not obvious)+ (1% level is significant)(not obvious)
Fossil Fuel Combustion Ratio+ (1% level is significant)− (not obvious)−(1% level is significant)+ (not obvious)
Blue BonusGDP++ (1% level is significant)+ (not obvious)−(1% level is significant)− (not obvious)
Twisted Tax Share−(1% level is significant)−(1% level is significant)−(1% level is significant)−(1% level is significant)

