Tourism Investment Gaps in Poland


1
Department of Economics, Koszalin University of Technology, 75-343 Koszalin, Poland
2
Department of Business Administration, Western Norway University of Applied Sciences, 6856 Sogndal, Norway
3
Department of Sports and Tourism, Poznan University of Physical Education, 61-876 Poznan, Poland
*
Author to whom correspondence should be addressed.
Sustainability 2019, 11(22), 6188; https://0-doi-org.brum.beds.ac.uk/10.3390/su11226188
Submission received: 26 August 2019
/
Revised: 21 October 2019
/
Accepted: 23 October 2019
/
Published: 6 November 2019
(This article belongs to the Special Issue Sustainable Tourism - Ways to Counteract the Negative Effects of Overtourism at Tourist Attractions and Destinations)
Abstract
:Against a rapid and frequently unsustainable development of tourism in Poland, this article aims to recognize the investment attractiveness for tourism in Poland and its spatial diversity in the context of relieving the effects of overtourism. In the first stage, a multi-dimensional indicator model was developed, and then it was used to assess the attractiveness level of cities and rural, urban and urban-rural municipalities in Poland. The results of the study were the basis of the analysis of the attractiveness of cities in relation to their size, location in the tourist region and various forms of tourism. From a theoretical standpoint, the study shows that there is a clear-cut need to redirect tourism investments from the centres to more distinct locations in order to achieve more sustainable development of tourism. Furthermore, it was found, that the main factors that determine the tourism attractiveness of cities are market potential, cultural values, social infrastructure, and in some cases, natural values. The tourist potential of cities and rural areas allows for spatial dispersion of investments and counteracting the concentration of phenomena related to overtourism. The analysis was carried out for 2478 municipalities in Poland. The sums of zero unitarization method was used to assess the level of investment attractiveness.
1. Introduction
Tourism boosts local development in many locations. Beautiful tourist centres of cities and their districts attract tourists, which is why they are responsible for new investments, development of entrepreneurship, creation of new jobs and generation of income. The increase in interest in investments in tourism is the result of socio-economic changes that have contributed, inter alia, to the increase in tourist traffic around the world [1]. Traveling has become cheaper, and thus, more accessible to members of a greater number of households. New carriers with cheaper airfares have significantly increased the flow of tourists around the world [2]. At the same time, there can be observed a rising income of households, which in turn increases their possibilities of purchasing products and services, and thus, causes more interest in tourism products [3]. The World Tourism Organization predicts that by 2030, the number of tourist trips in the world will increase to 1.8 billion [1]. With such a large increase in demand, at the same time, a significant increase in investment is forecast in order to provide accommodation, transport and other services related to tourism and infrastructure necessary to meet expected demand, simultaneously increasing economic, social and environmental results [4]. Excessive tourist traffic and forecasts for its further increase affect tourism income growth in many countries around the world. Investors encouraged by good financial results of the tourism industry are looking for new investment opportunities and optimal locations for new investments. Despite optimistic forecasts, the development of tourism and especially the progressive concentration of tourist traffic causes a number of negative effects. The literature lists two mechanisms of arising conflicts, which are caused by cultural differences, especially the mass tourist traffic and negative behavior of tourists [5,6]. This is related, among others, to the feeling of excessive overpopulation and discomfort among the local population and tourists. This phenomenon occurs in many cities where the critical point of the capacity of the tourist system has been exceeded. Observation of the dynamically developing tourist market raises the question of whether mature or fast-growing destinations should continue to implement strategies for increasing attraction and the number of tourists [7,8]. Research to date confirms that in the event of overtourism, places struggling with this problem should try to better understand the situation on the local market in order to determine its profitability, including tourists’ behaviour, length of stay, expenses, as well as preferences and leisure activities [9]. Therefore, the development of tourism should be more balanced, well-thought-out and corrected in order to obtain the effects of balance of the natural and economic environment and care for the quality of life of local residents.
The development of tourism is a consequence of complex natural factors, forms of spatial organization, and the effects of human activities. One of the development directions is the use of tourism attractiveness to build competitive advantage and attract tourists. In many regions, tourism has become the sole or key determinant of income, as well as economic and social changes. The conducted research confirms the relations between the income generated by the inhabitants and the competitiveness of tourist destinations [10,11,12,13,14,15]. Tourism competitiveness of cities and villages should be understood as the ability of the area to provide goods and services to tourists better than others. Cities and rural municipalities compete with each other in building attractive tourism spaces, which are a multidimensional structure of tourist attractions, accommodation, catering, transport and other technical and social aspects that are important elements of a tourism product.
Competitiveness can be linked to tourism attractiveness of the destination, which is often determined based on the opinion of visitors on the perceived ability of the destination spot to meet their needs related to their stay. As far as the competitiveness of a given place is concerned, the overriding value of a tourist destination’s attractiveness is its ability to interest and encourage tourists to visit it [16].
Research on tourism attractiveness is necessary to understand the elements that encourage people to travel. However, there is a thin line, beyond which attractive tourist destinations begin to struggle with the problem of overtourism and gentrification [17,18]. The intensity of ill-considered investments together with mass visits of tourists cause a number of negative phenomena among local communities, the economic environment and tourists. One of the directions of actions proposed in the context of mitigating the effects of overtourism is the deliberate dispersion of visitors inside and outside the city [19]. This can be achieved, among others, by increasing the number of events organized in less-visited parts of the city and its surroundings (e.g., sports events that do not always require sports infrastructure, e.g., marathons) and developing and promoting tourist attractions and facilities in less-visited cities. In the context of sustainable development of regions and cities, the promotion and development of investments in places with high potential investment attractiveness, which have not used their potential yet, may turn out to be crucial.
Although there are many published studies regarding the investment attractiveness and factors determining it [20,21,22,23], a research gap regarding the relations between potential investment attractiveness and actual investment in tourism can be distinguished.
The study aims to show how investment attractiveness and its components can affect the development of tourism in various types of areas: Rural, urban and urban-rural. The proposed investment attractiveness model identifies five investment microclimates: Social and technical infrastructures, administrative climate, natural values and tourist attractions, thus, increasing the conceptual understanding of the impact of a wide spectrum of factors on tourism development.
The model identifies the relationship between the potential investment attractiveness of tourism and its individual components (microclimates) and actual investments on the example of accommodation facilities. The main assumption of the model is that the potential investment attractiveness of tourism affects real investment. The difference between potential investment opportunities and implemented investments creates an investment gap, i.e., unused tourism development opportunities. The following hypotheses were adopted:
Hypothesis 1.
There is an investment gap in the regions, i.e., a lack of fit between the level of actual investment and the level of potential investment attractiveness.
Additionally, hypotheses regarding the changing role of model components depending on the type of analyzed municipalities were assumed.
Hypothesis 2.
The main factors in the development of accommodation facilities in cities are anthropogenic factors such as social infrastructure, administrative microclimate and the microclimate of tourist attractions.
Hypothesis 3.
The main factors in the development of accommodation facilities in urban-rural municipalities are tourist attractions and natural values.
Hypothesis 4.
The main factors in the development of accommodation facilities in rural municipalities are less often anthropogenic factors, and more frequently natural values.
The practical objective of the model is the ability to use it in order to show investment gaps and propose new investment locations. Theoretically, new locations can take over part of the growing tourist traffic in the context of phenomena, such as crowding and overtourism in cities with high tourist attractiveness.
2. Tourism and Investment Attractiveness
The literature on the subject provides a number of examples of location factors relevant to hotel industry investors. These factors can be divided into four main groups: The level of economic growth, the level of economic, political, legal and cultural stability, the degree of internationalization of the economy, and specific factors related to the hotel industry market [23]. Among the mentioned factors, various authors most often emphasize the importance of the level of economic development [24,25,26,27]. This factor is the key determinant of many elements of the redeployment and development of technical, social and transport infrastructures, communications technology, as well as the quality of human capital and tourist attractions. The literature often emphasizes that the main determinants of the volume of tourism demand are high natural and anthropogenic values. Tourist values play an important role in accommodation facilities located in places with developed tourist functions and facilities located in cities that have significant cultural and historical values, monuments and cultural objects [28,29,30]. Other equally important factors that are highlighted in the literature are: Sports, cultural and commercial events [31], as well as tourist attractions in the region [28,29].
The concept of tourism attractiveness cannot be considered equivalent to the concept of investment attractiveness for tourism—the main difference results from the subject of observation. In the first case, the focus is put on the demand side, i.e., all elements related to the tourist and their behavior on the market, including the perception of the ability to meet the needs. In the case of investment attractiveness for tourism, the main subject of observation is the investor, i.e., the supply side. This applies especially to their decisions taken as part of managing investment capital and business location.
Investment attractiveness is a complex phenomenon that comprises many separate factors. Attractiveness is increased by attributes of the area or those components that make up the final destination [32]. The concept of the attractiveness of a destination can be referred to individual benefits and perceived capacity of the final destination to provide individual benefits [33]. The investment attractiveness model should take into account those features that refer to the specifics of demand and supply. In the case of tourism, these are tourist values, which are the main component of most tourism products.
Tourist values are specific features and elements of the natural environment, as well as manifestations of human activity that are of interest to tourists [34]. Tourist values can have a recreational, sightseeing and specialist character. The first create specific conditions for rest and regeneration based on elements of the natural environment, such as water (sea, rivers, lakes), clean air, forests, terrain, etc. On the other hand, sightseeing values are of explorative interest to tourists. Among them, there can be distinguished natural values created without human interference or with their little impact (e.g., national and landscape parks), and cultural values or objects of material and non-material culture created by man. All of this is complemented by specialized values, which give the opportunity to practice various specialized forms of tourism, e.g., sailing, mountain climbing, horse riding, etc.
The investment attractiveness model should also take into account elements important for investors that are related to service infrastructure, technical infrastructure, population relations and municipalities’ finances [35]. These are elements that refer to both spatial development, as well as market and administrative conditions in a given area, including business environment, government policy and organization of major events [36]. Some of these conditions, e.g., regarding transport accessibility, are a prerequisite for using tourist values, as well as are an important element of the development of tourist regions.
When planning investments, the investor must take into account the needs of tourists. The literature mentions a number of examples of tourist attractions relevant to tourists, namely:
- Attributes of the final destination’s attractiveness: Facilities, accommodation prices and transport networks [37];
- Historic and cultural sites, nightlife, outdoor activities, natural environment and openness, hospitality of people [38];
- Landscape [39];
- Clean and peaceful environment, quality of accommodation facilities, facilities for families, security, availability, reputation, entertainment and recreational opportunities [40];
- Festivals as an element embedded in the local ecosystems of sport, culture and business [41];
- Events related to the sport heritage of the region and other smaller sports events, including mass sporting and recreational events [42].
The above examples show the complexity of issues related to investment attractiveness. Based on the literature review and previous research, it was assumed that the potential investment attractiveness should be defined as a set of regional location values that have an impact on achieving the objectives by an investor who undertakes activities related to tourist services (e.g., in the form of business costs, sales revenues, net return and the competitiveness of the investment). The above definition was the basis for the development of a multidimensional statistical model of potential investment attractiveness.
3. Potential Investment Attractiveness Model for Tourism
Potential investment attractiveness is a complex phenomenon, and its measurement requires the involvement of many indicators describing different location values [21]. The difficulty of measuring investment attractiveness lies in translating the theoretical term into a system of empirical indicators. The components (investment microclimates) useful for the research were determined using the algorithm of sums of zero unitarization [43], for which the appropriate empirical indicators were selected. The selection of indicators for the model was based on similar studies on the assessment of investment attractiveness [21,22]. In the next step, the indicators were standardized and then aggregated into individual microclimates. Finally, the microclimates were combined, and thus, synthetic indicators of the level of investment attractiveness were obtained. Due to the aim of the study, i.e., determining the relations between model components and actual investments, uniform weights for model indicators were used [44]. The aggregation process included the implementation of further activities:
- Determining the main components of investment attractiveness;
- Selecting empirical features;
- Standardizing variables;
- Calculating sums of zero unitarization;
- Grouping units of the surveyed population (Jenks Natural Breaks Classification);
- Defining the development level.
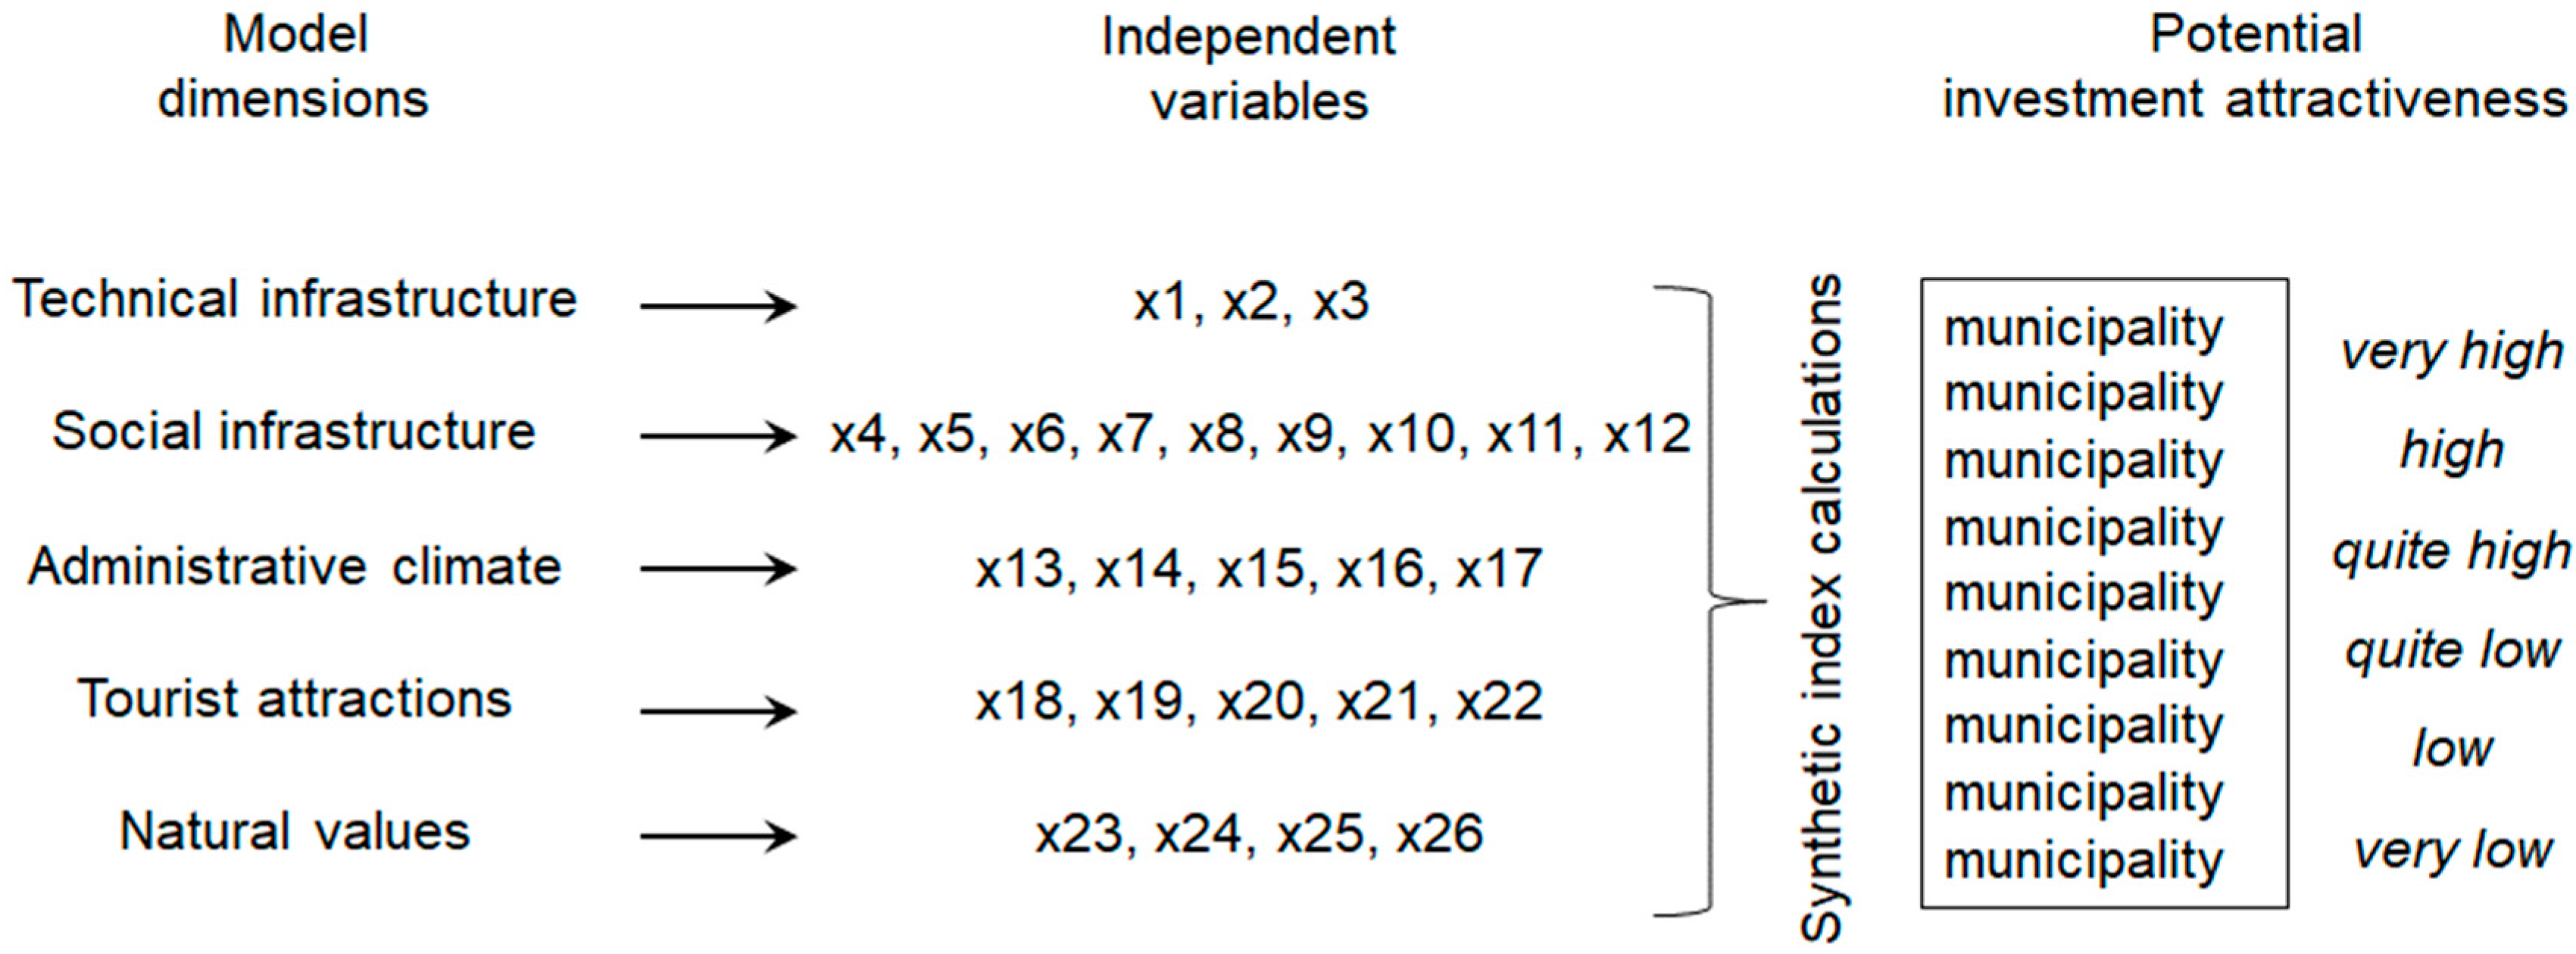
For easier interpretation, the indicators were grouped into five main investment microclimates (Figure 1) that are components of the model (Table 1).
The technical infrastructure is the first microclimate that allows assessing the preparation of an investment area for basic transmission networks, e.g., water, gas and electricity. An appropriate level of infrastructure is a basic condition for the location of accommodation, catering and entertainment facilities. Social infrastructure is assessed through the prism of equipping a given place with buildings, as well as entertainment, recreation and sports facilities. In addition to the basic tourist values, it is a complementary element that allows the development of various forms of active leisure. The next market microclimate informs about the market responsiveness, the number of potential consumers, as well as the level of investment to date and competition in a given place, e.g., the number of available accommodation sites or the scale of ongoing investments. Moreover, the model takes into account the administrative microclimate that assesses the level of public spending on tourism. These expenses allow financing of both tourist infrastructure and local events, e.g., festivals or concerts. Natural conditions are a key element of the discussed investment attractiveness model. This mainly applies to the landscape and various forms of terrain, such as mountains, lowlands, lakes and coast. These are the basic factors that determine the development of leisure and sightseeing tours. The last element of the model is tourist attractions related to historical and cultural achievements of the place, which include: Museums, monuments and cultural events, etc.
The standardized sums method was used to assess the level of investment attractiveness. It is a method of the linear ordering of standardized data, which assumes that all variables are stimulant. The procedure begins with standardization by normalizing one-dimensional variables that simulate based on the following formula.
where:
- next feature number,
- next spatial unit number,
- normalized feature j in the spatial unit i,
- value of the feature j in the spatial unit i.
If the nature of the variable is different, e.g., destimulants or nominants, the procedure for the replacement for a stimulant should be applied:
Based on standardized variables, a vector of standardized sums for individual investment microclimate is then determined. These are the arithmetic mean values of the standardized features which correspond to individual facilities, where n is the number of investment microclimate and m is the number of variables in a given microclimate, according to the formula:
Pseudo-one-dimensional variables describing microclimate were the basis for calculating investment attractiveness indicators ,
The attractiveness indicators assigned to individual municipalities were divided into classes from 1 to 6 in accordance with the Jenks Natural Breaks Classification method. This method is used to present heterogeneous data, as it aggregates groups with similar values. The ordering of values in different classes is carried out by striving to minimize the average deviation of each class from the average class, while maximizing the deviation of each class from the average of other groups [45].
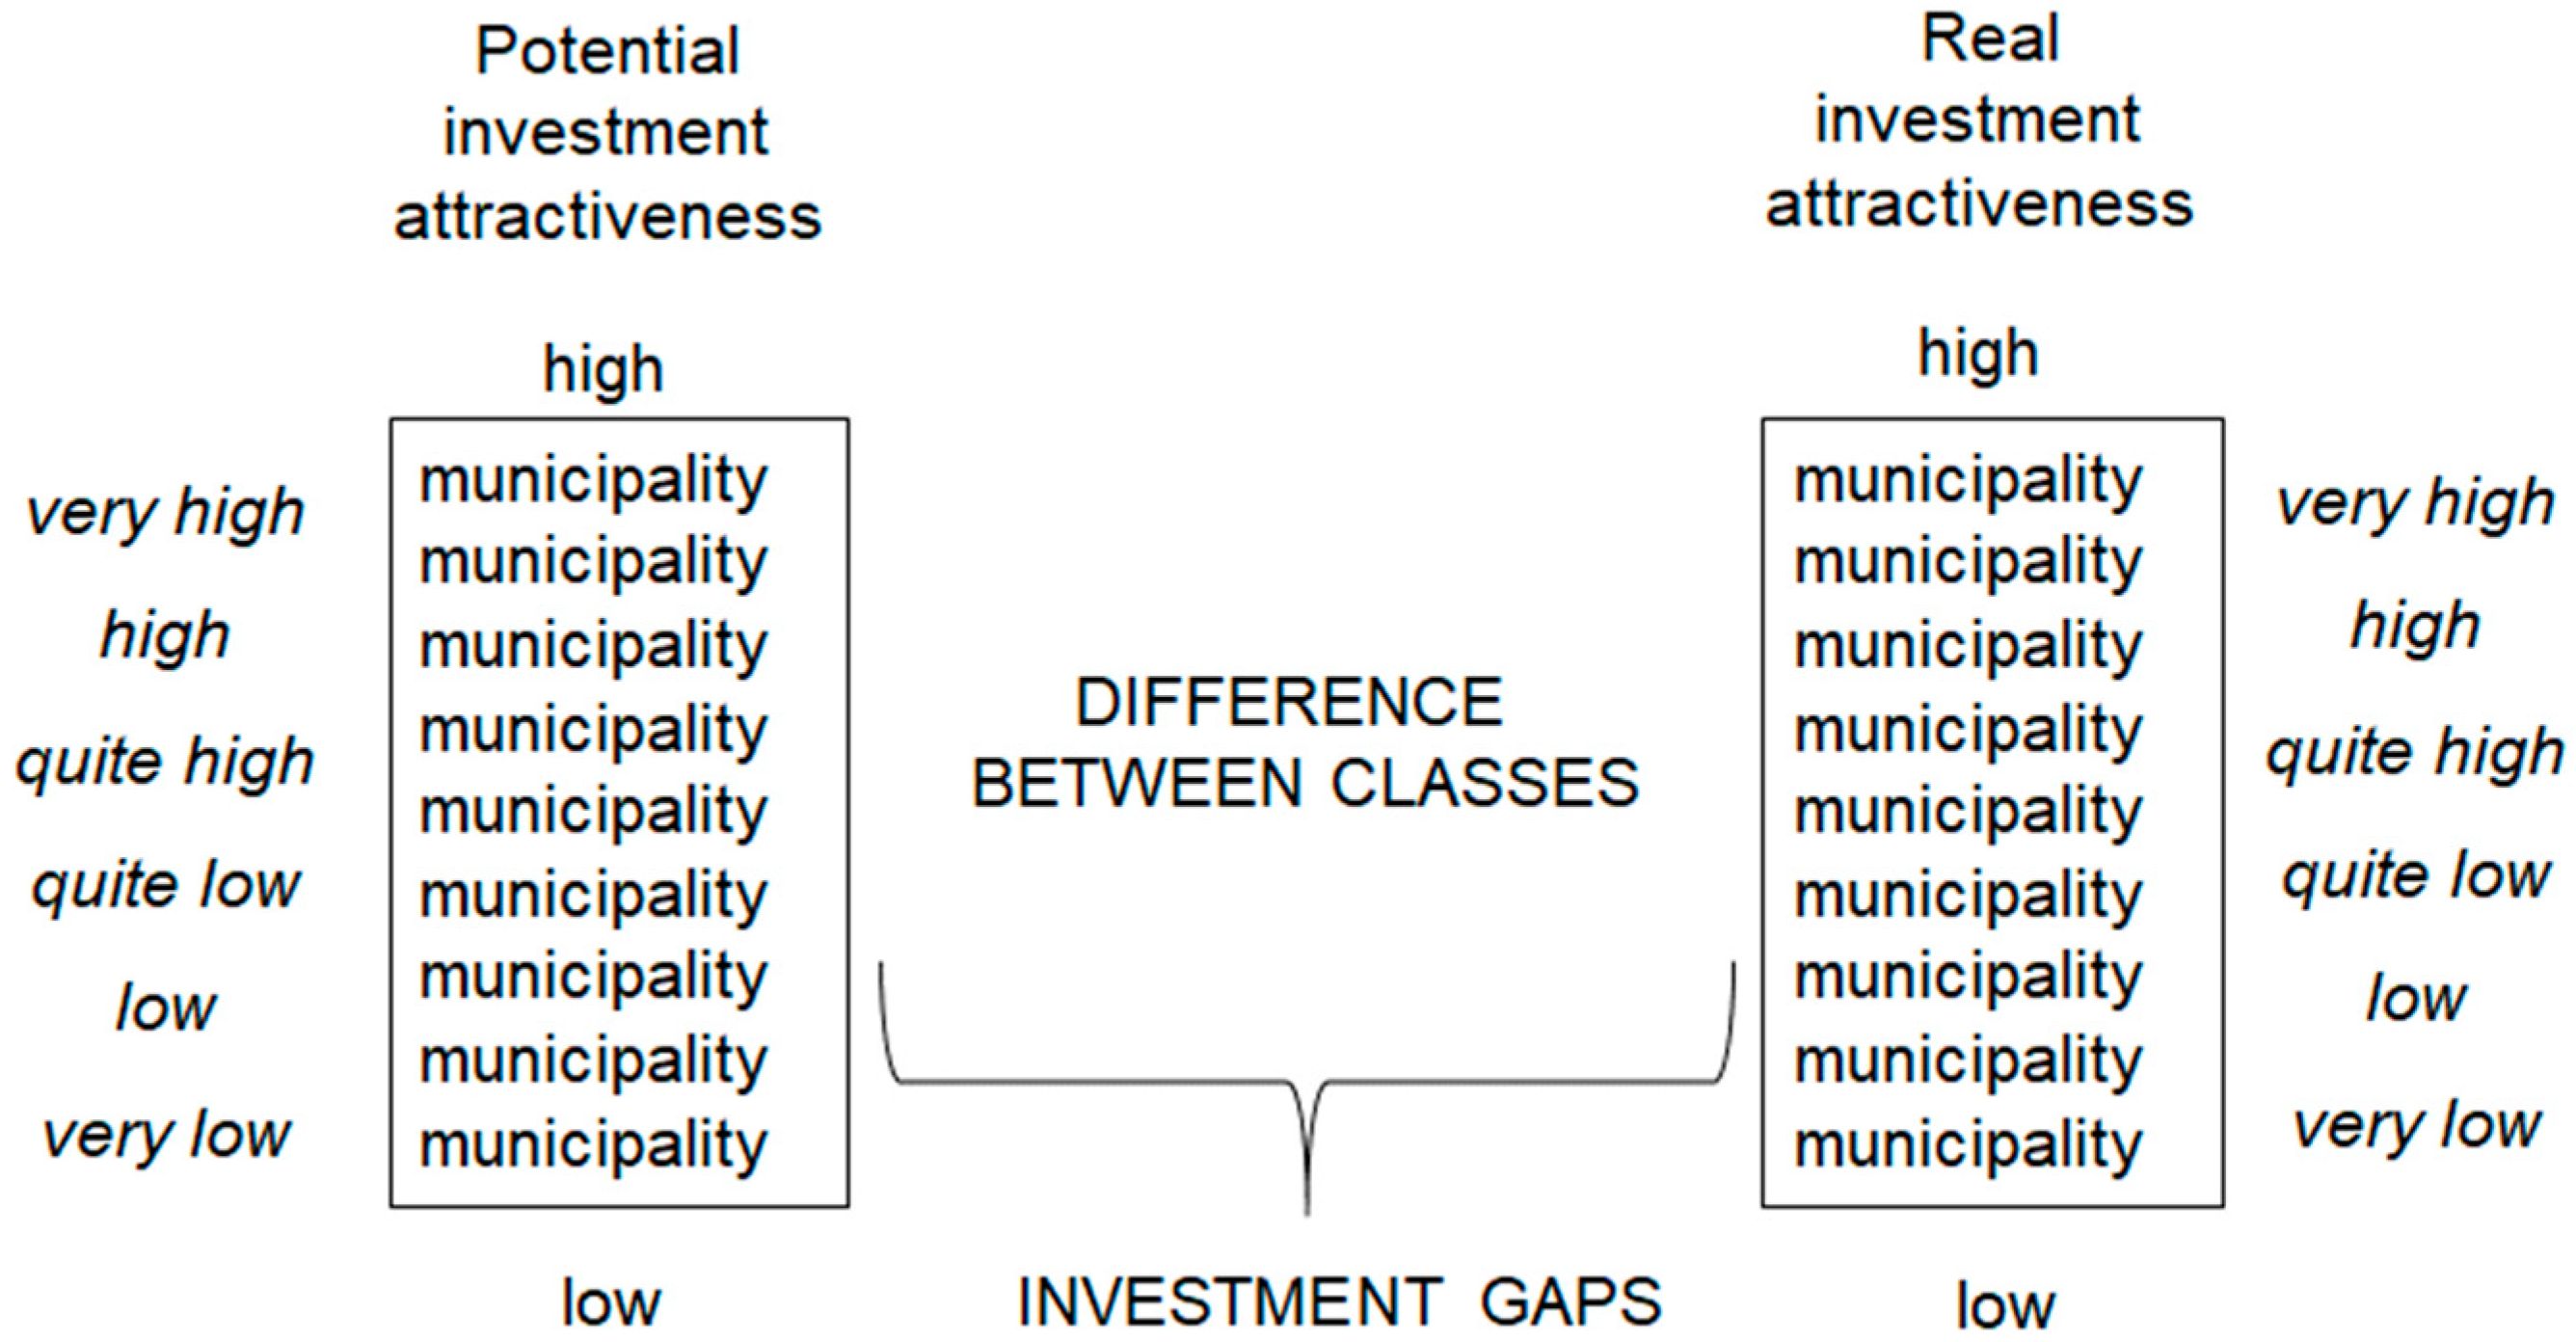
In the last stage, investment gaps were calculated as class differences (1–6) created as a result of typing of variables of potential investment attractiveness and actual tourism investments, which were measured by the number of accommodation facilities using the Jenks Natural Breaks Classification method (Figure 2).
The analysis was carried out for the entire research sample, i.e., 2478 municipalities in Poland in accordance with the administrative division into rural, urban and urban-rural municipalities. Due to the amount of data needed to construct a multidimensional model for 2478 administrative units, it was decided to use reliable information resources of official statistics in Poland presented by Statistics Poland [46]. The data obtained to build the model concerned the year of 2016, whereas, the data on the number of accommodation facilities regarded the years 2012 and 2017. The data used to construct indicators of the natural microclimate constituted an exception. To calculate the index of the municipality’s access to the sea, digital maps and a computer program supporting GIS (geographical information system) were used, while in the case of the terrain indicator, research on the agricultural production space valuation carried out by the Institute of Soil Science and Plant Cultivation [47] was applied.
4. Results
The research results were presented by assuming the following structure. First, the level of investment attractiveness and its profile according to previously defined administrative areas were discussed. Next, the obtained results were compared with actual investments in the field of accommodation facilities. At the same time, the degree of tourism investment and overtourism in municipalities of the spatial scale was described. The combination of two indicators of investment attractiveness and the level of real tourism investments was the basis for determining investment gaps. Potential areas for investment development and mitigation of the effects of overinvestment and overtourism were identified.
4.1. The Attractiveness of Municipalities and Real Tourism Investments
The attractiveness indicators assigned to individual municipalities were divided into classes from 1 to 6 using Jenks Natural Breaks Classification optimization method (Table 2).
Table 3 presents the potential for the development of tourism in Poland in structural terms for the three groups of municipalities covered by the research. The total number of administrative units examined is 2478, including 302 urban municipalities, 628 urban-rural municipalities and 1548 rural municipalities. The conducted research shows that about 14% of municipalities have a very high level of investment attractiveness. This group is dominated by cities (59%) and urban-rural municipalities (24%), while rural municipalities constitute only 17%. In the lower rating category, i.e., high and quite high, rural municipalities already achieve a significantly higher share, 44% and 52% respectively.
The high investment attractiveness of urban municipalities in relation to rural municipalities is the result of very good technical, social infrastructure and administrative climate (Table 4). An undoubted attribute of rural municipalities is their natural values, which were rated quite high.
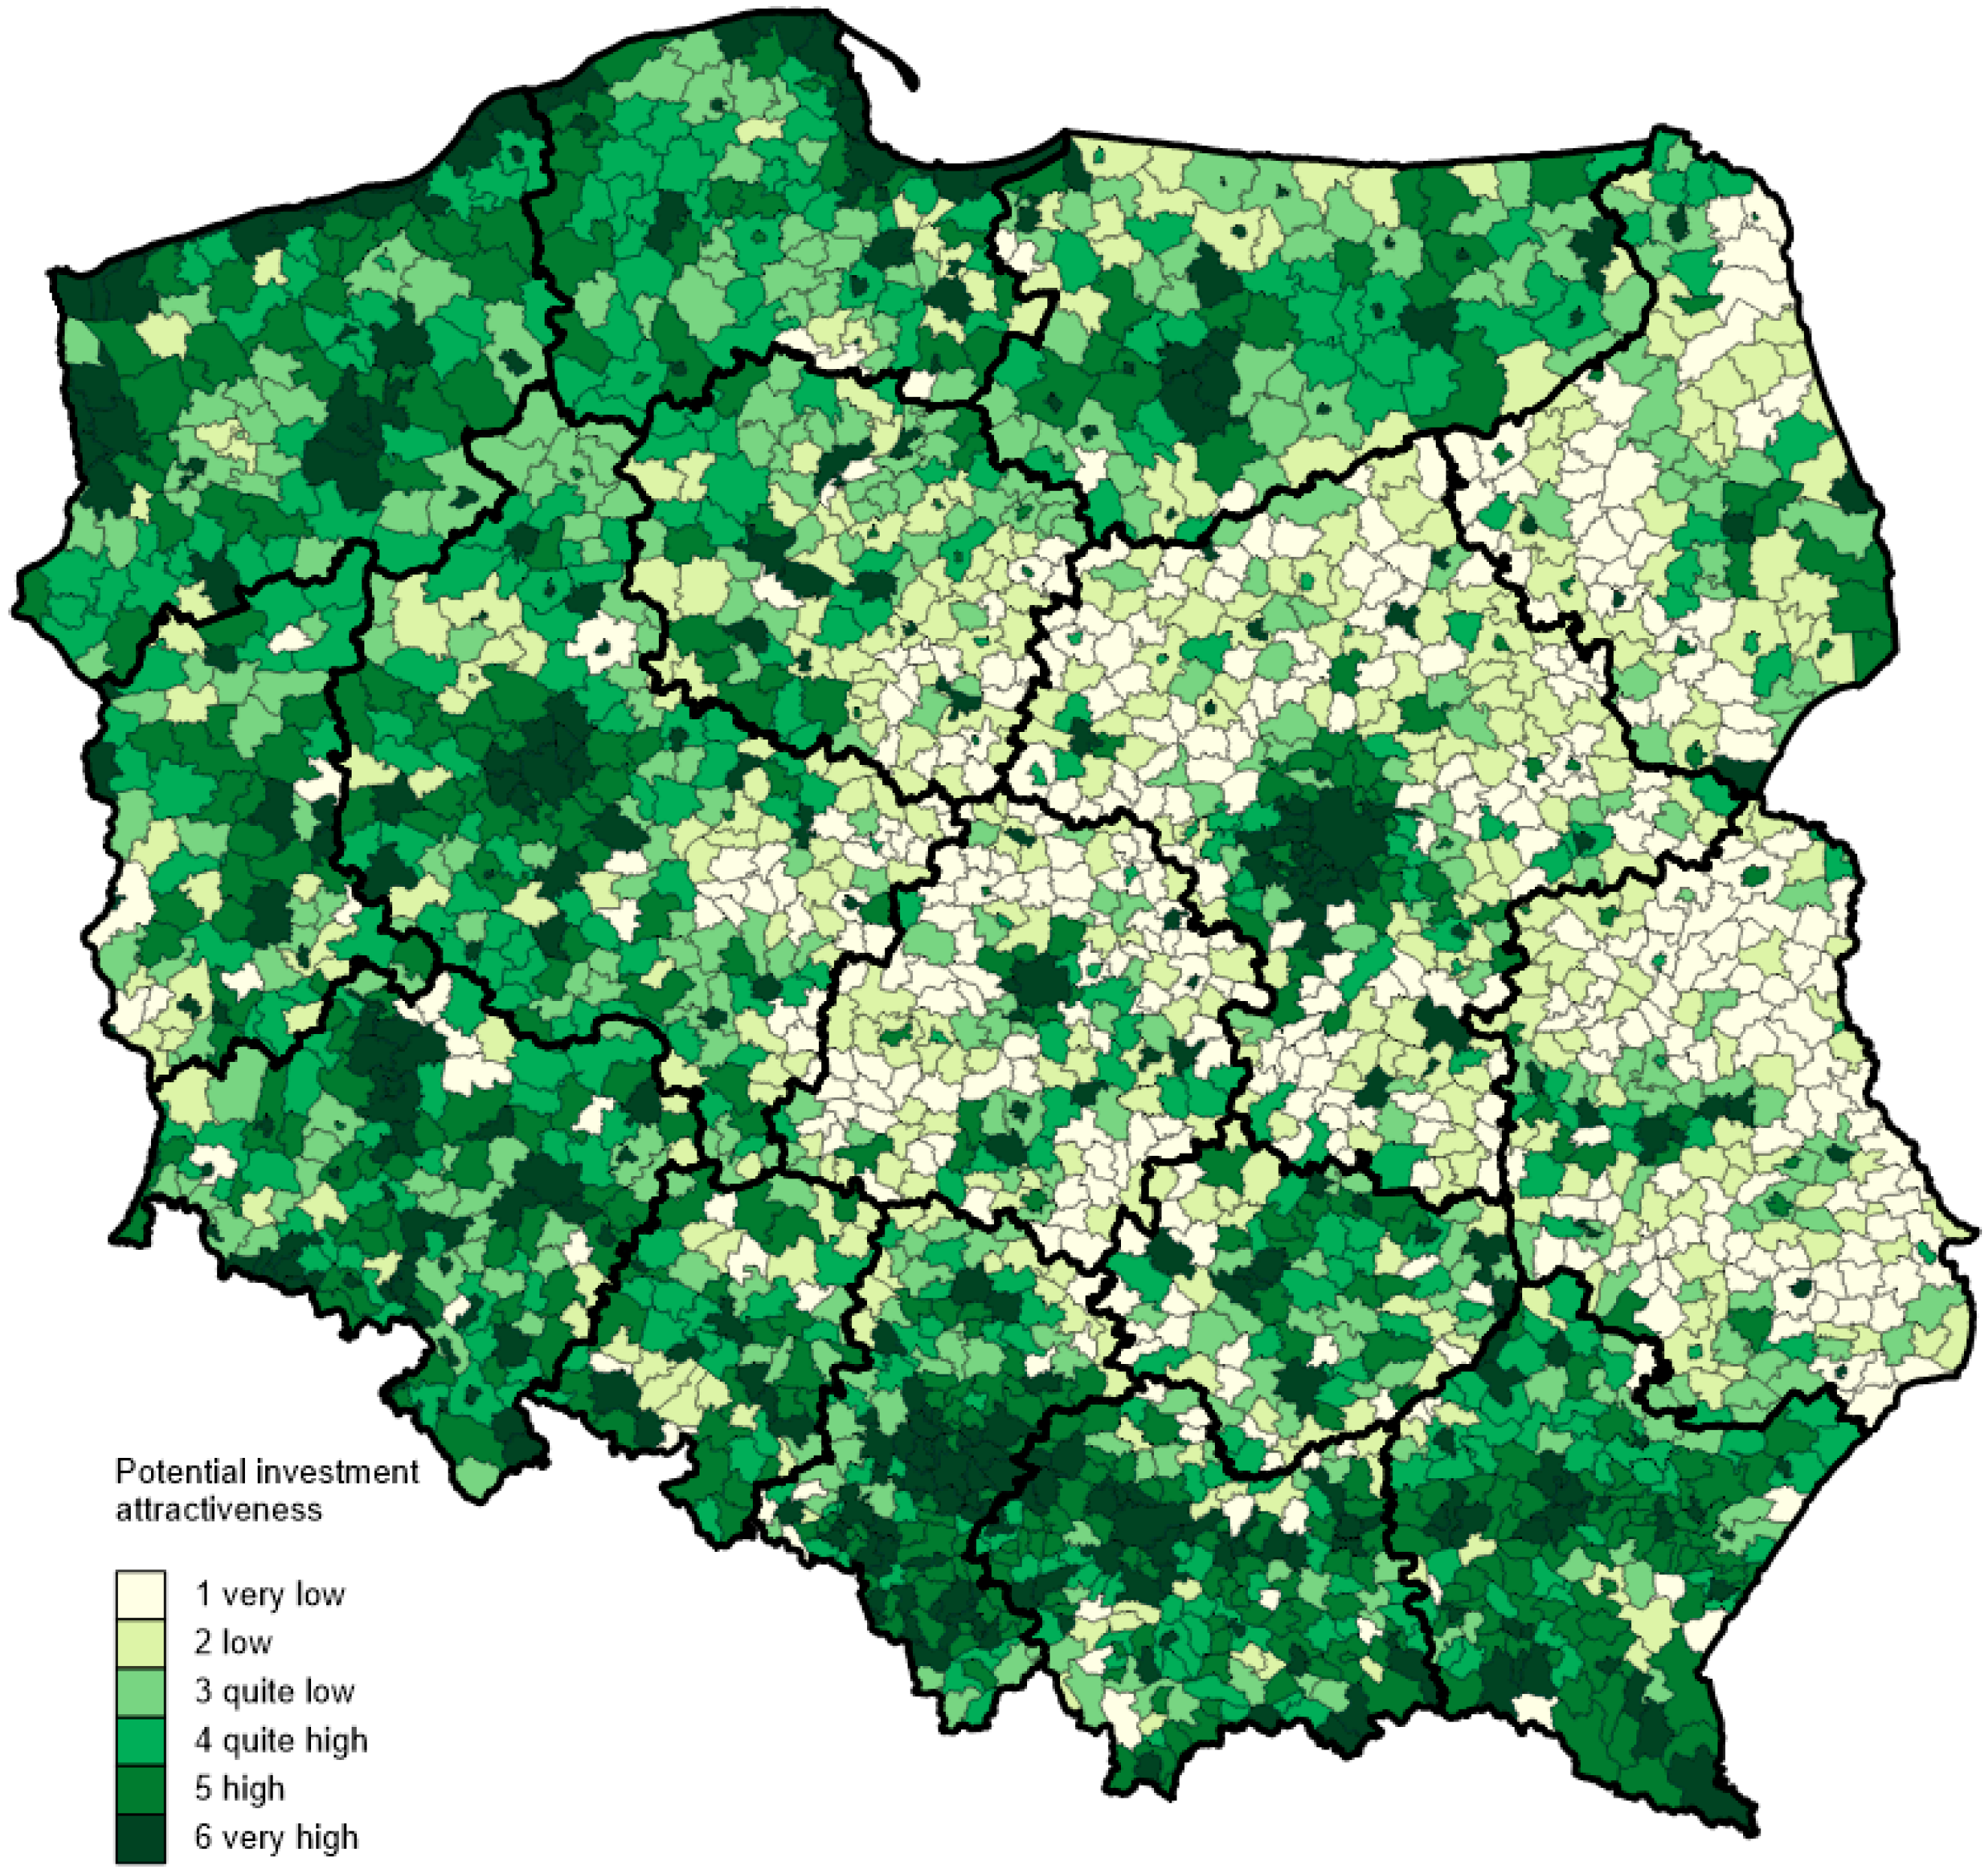
The geographical area does not maintain continuity with respect to values and tourist attractions. Diverse terrain and the intensity of the scale of socio-economic phenomena caused a lack of territorial cohesion and the formation of different development conditions for tourism. This is particularly evident in the case of the spatial distribution of the results of measuring investment attractiveness (Figure 3).
The obtained results of the spatial distribution of potential investment attractiveness can be related to the characteristic tourist regions of Poland. The first group are municipalities located in the coastal region, which is a narrow strip of land adjacent to the Baltic Sea. These municipalities have valuable assets in the form of beaches with access to the sea. Specific natural conditions mean that recreational tourism in these municipalities takes place mainly during summer. The exceptions are seaside resorts, which operate throughout the entire calendar year. Investments in the coastal belt are concentrated in close proximity to the beaches. This causes a high concentration of tourist traffic and opens opportunities for investing in semi-touristic types of economic activity. In the coastal belt, in addition to the typical accommodation base, other services, like gastronomy, entertainment and transport, are developed. That is why coastal municipalities with a high tourist function indicator are often considered some of the most economically developed rural municipalities in Poland [48]. Local taxes and fees supplying the budgets of local government units provide great investment opportunities, which significantly increase the quality of infrastructure and at the same time, the level of investment attractiveness.
Another group of municipalities with above-average conditions for tourism investments are the municipalities of the Pomeranian, Masurian and Greater Poland Lakelands. In this case, the main factor increasing the investment value of these municipalities is the post-glacial landscape, whose main forms are lakes, moraine hills and forest complexes. The municipalities located within the discussed Lakelands do not have such advanced tourist infrastructure as it is the case with coastal municipalities. In their area, mainly seasonal tourism is developed in summer with the main forms being leisure and adventure tourism (sailing, diving, canoeing, etc.).
The most attractive municipalities in the southern part of Poland are located in three main regions: Małopolska Upland with the Świętokrzyskie Mountains and the Kraków-Częstochowa Upland, the Sudetes Region, including the oldest mountain ranges in Poland and the Carpathian Mountains. An important investment asset of these municipalities is the quite long season of tourist traffic, which covers most days of the year. In summer, they have good conditions for adventure tourism (hiking, trekking, extreme tourism, cycling, speleology), leisure and cognitive tourism. Whereas, in winter, the terrain and heavy snowfall create good conditions for winter sports, mainly skiing.
Due to their specificity, cities have different location values referring to historical, cultural, natural and economic conditions. These conditions determine the development of various forms of tourism. Depending on the scale and variety of conditions, there can be distinguished cities with individual tourist specializations, as well as cities with a bundle of tourist attractions and development opportunities for many forms of tourism. An appropriate investment climate does not yet condition real tourism investments in cities. A set of specific conditions and location factors determines the potential investment attractiveness and provides incentives for real investments of the tourism industry. However, the real investment attractiveness of cities shows an important aspect related to the level of investment and allows assessing to what extent investors are interested in a given location and the capital employed is able to generate added value.
The investment level indicator and the way it had changed in the years 2012–2017 were used to assess the level of investment. The spatial distribution of this indicator shows that the location of tourist companies is characterized by strong spatial concentration. Almost half of the accommodation sites in Poland (49%) are located in cities. Since 2012, 56% of all new accommodation sites in Poland have been created in cities (Table 5).
When compared to rural areas, cities are much better equipped with basic technical and social infrastructure. They also have numerous historical, cultural, and sports facilities, as well as gastronomic establishments and entertainment venues. Furthermore, they generate the greatest number of cultural events, festivals and large concerts that enrich the tourist offer. In the group of municipalities with the highest level of attractiveness, there were large cities performing the functions of economic, social and cultural centers, as well as having a rich past. In addition, they are also cities that combine many urban functions with the function of leisure tourism. Examples are cities located by the sea: Świnoujście, Kołobrzeg, Darłowo, Ustka, Gdynia, Sopot, Gdańsk, and cities located in the mountains, such as: Szklarska Poręba, Polanica-Zdrój, Karpacz, Szczyrk, Świeradów-Zdrój. Economic functions cause these cities to often be the destination of business trips and the area of development of the Meetings Industry. Due to the high population density, they also experience a large number of trips related to visiting relatives and friends.
In the next step, the relations between components of investment attractiveness and actual investments in general, as well as for individual groups of municipalities were examined (Table 6) using the linear correlation coefficient. It was observed that the analyzed factors are characterized by a changing role and weak or moderate impact (correlation) on real investment. It should be noted that in no case were the correlation coefficients determined high. In accordance with the adopted model, the main factors for the development of accommodation facilities in cities are social infrastructure (r = 0.41, p = 0.00), administrative microclimate (r = 0.40, p = 0.00) and microclimate of tourist attractions (r = 0.42, p = 0.00). These are elements of anthropogenic origin created by man and strongly associated with the development and economic potential of cities. The situation looks different in the case of rural municipalities, where natural values (r = 0.28, p = 0.00) were recognized as the main factor in the development of the accommodation facilities. The main factor in the development of accommodation facilities in urban-rural municipalities are tourist attractions (r = 0.31, p = 0.00) and natural values (r = 0.26, p = 0.00). In general, the regions presented a low correlation between the number of newly created accommodation facilities (investments) and the level of potential investment attractiveness (r = 0.31, p = 0.00).
Multiple linear regression was calculated to predict real investments based on their technical infrastructure, social infrastructure, administrative climate, natural values and tourism attractions. A significant regression equation was found (F(5, 2472) = 105.417, p < 0.00), with an R2 of 0.176 (Table 7). Participants’ predicted real investments is equal to 0.220–0.005 (technical infrastructure) + 0.214 (social infrastructure) + 0.081 (administrative climate) + 0.109 (natural values) + 0.414 (tourism attractions), where all are measured in synthetic index (Table 8). The significant predictors of real investments were social infrastructure, administrative climate, natural values and tourism attractions. The results of the multiple linear regression indicated that the model explained 17.6% of the variance in real investments (Table 9).
4.2. Investment Gaps in Tourism
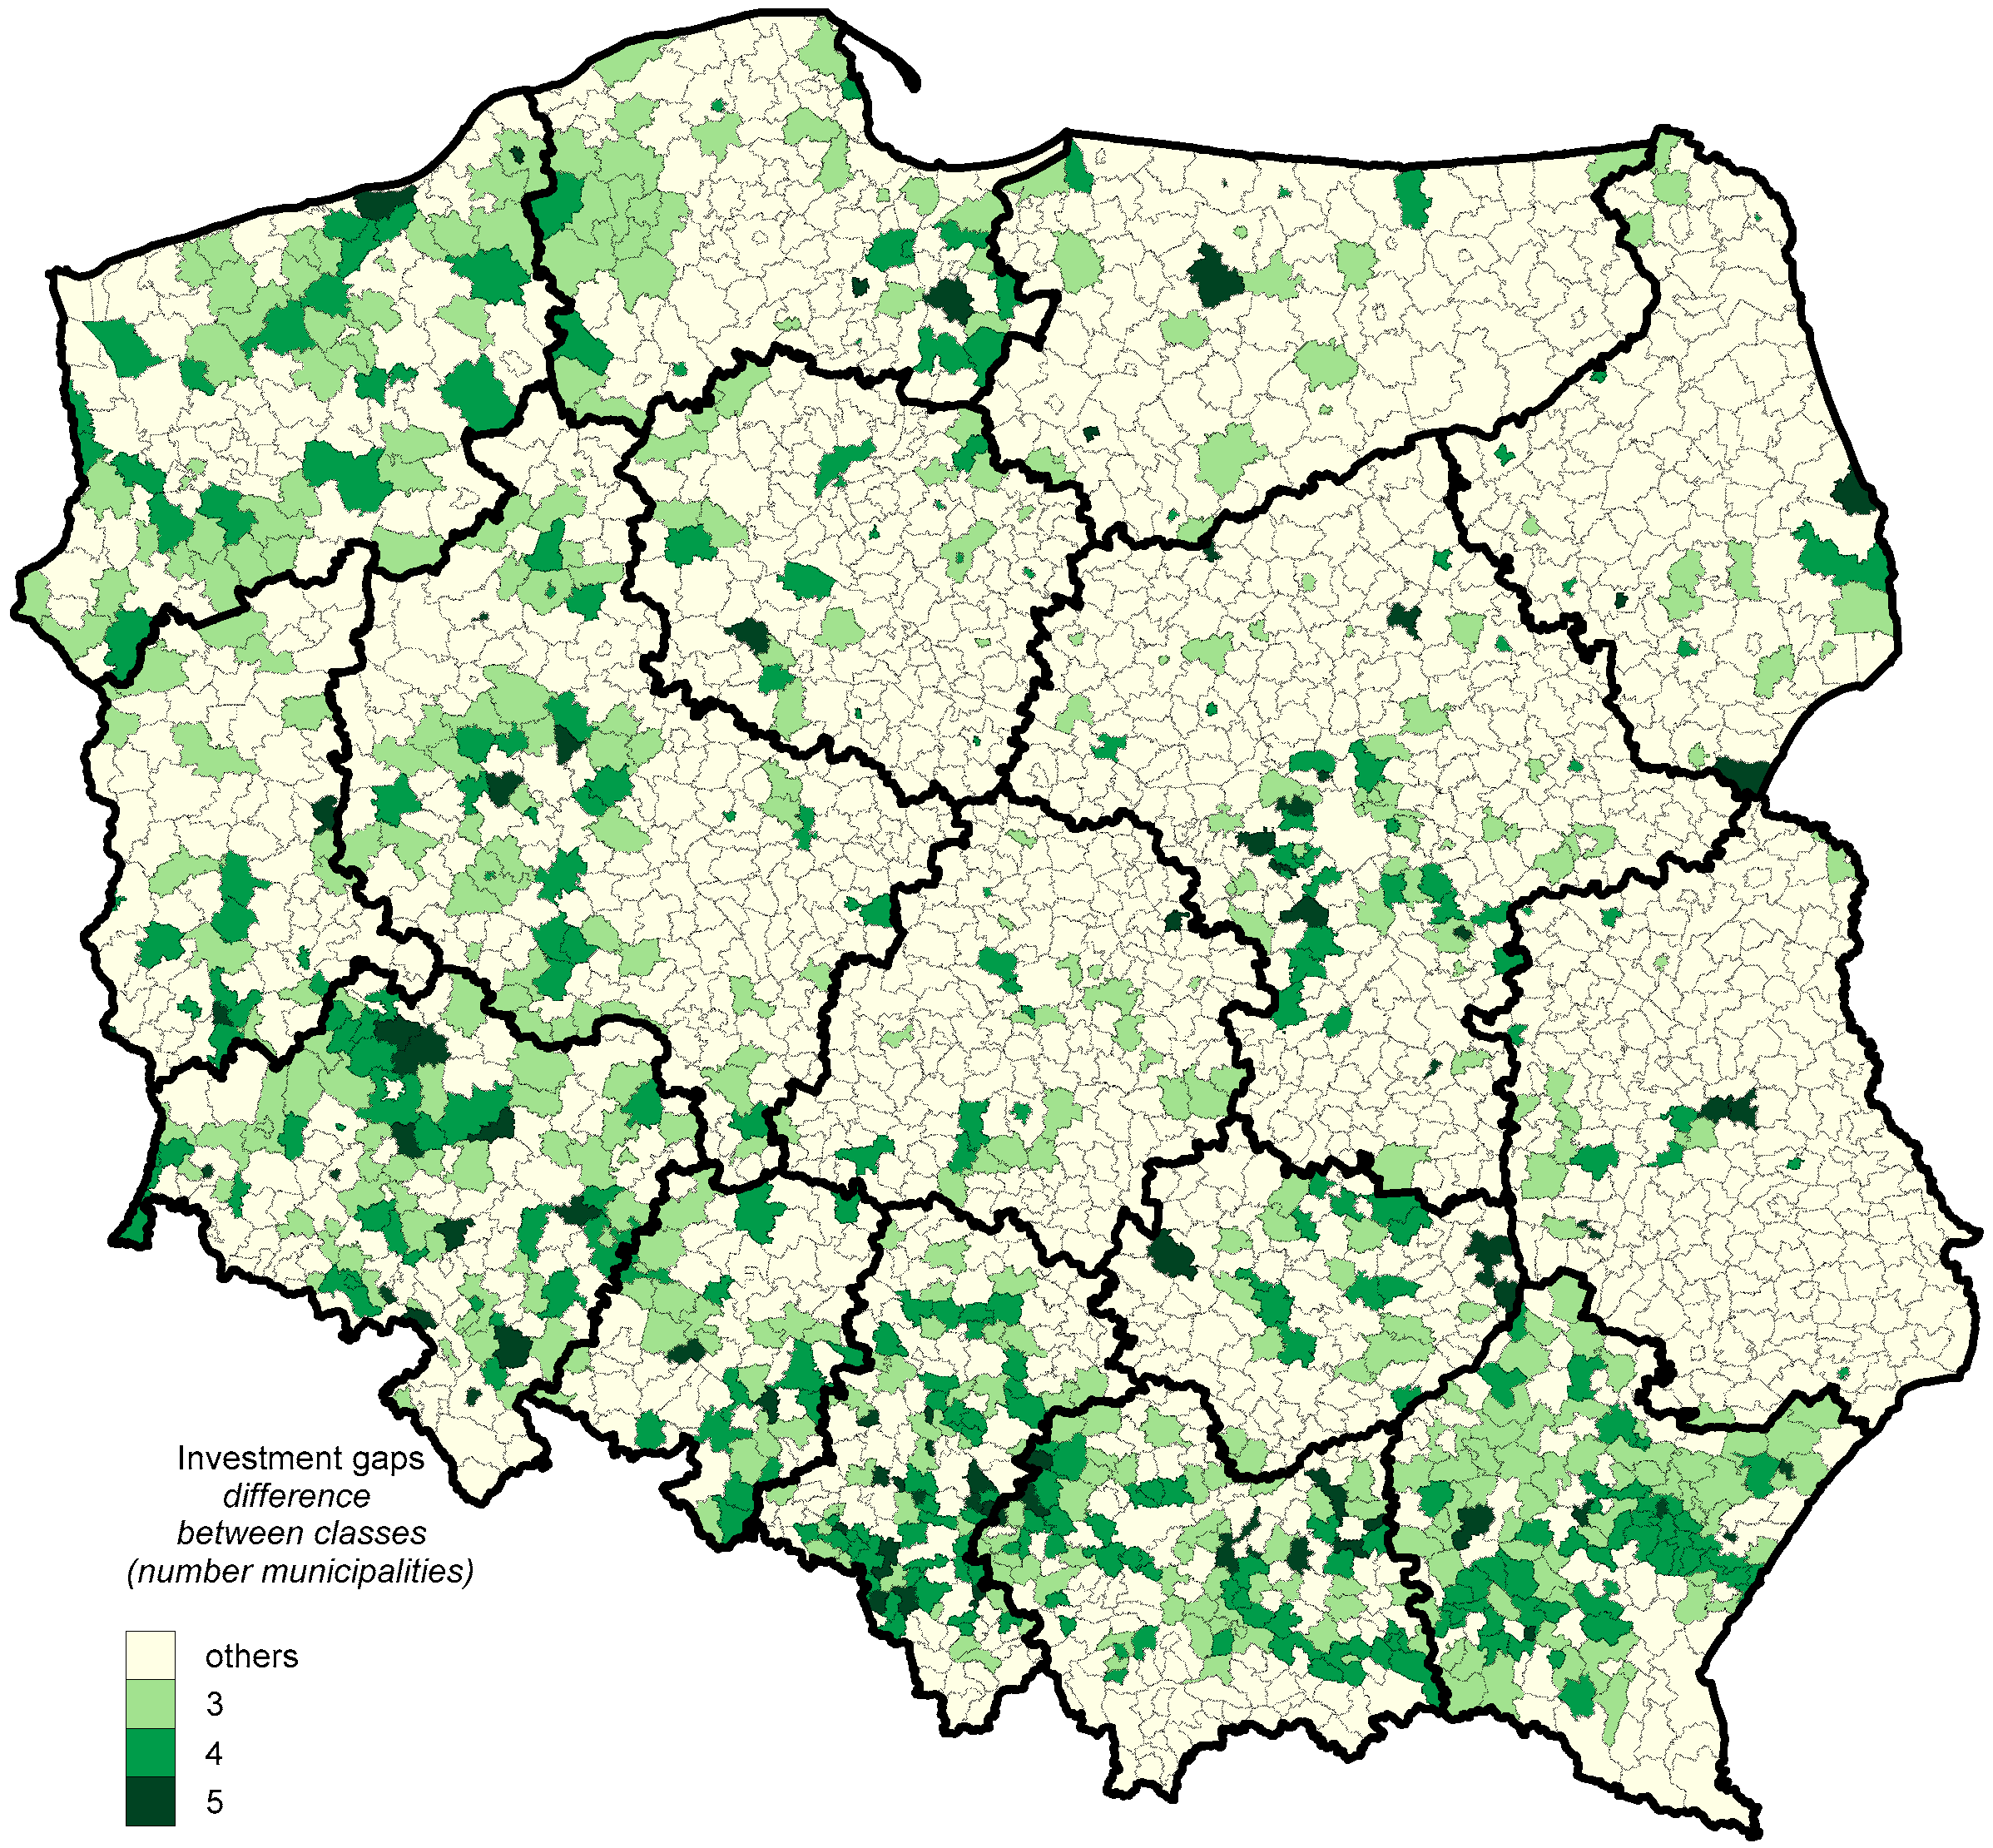
The above results of a moderate correlation between real and potential possibilities of investing in tourism led to finding the causes of this phenomenon. It was assumed that there is an investment gap in the regions, which arises as a result of unused investment opportunities. Municipalities with favorable investment conditions have not yet developed tourism investments. This situation applies to all types of municipalities, both cities and rural areas. The analysis of individual administrative types indicated that as many as 53% of cities have investment gaps, whereas, in the case of urban-rural municipalities this percentage amounted to 42%, and 24% (Table 10) in the group of rural municipalities. The municipalities with the largest investment gap are mainly medium and small cities, as well as rural municipalities, whose spatial distribution on a map shows that they are located in areas with attractive natural terrain, such as lakelands, sea coast, and mountainous areas (Figure 4). Large investment gaps also occur in municipalities located around the largest cities in Poland, such as Warszawa, Kraków and Poznań.
4.3. The Concentration of Investments in Cities and Overtourism
The year-on-year increase in tourist traffic causes that many cities in the world face the problem of excessive numbers of tourists. Pressure on urban centers resulting from tourism has led to the popularization of the term “overtourism.” Despite its popularity, the term is still not clearly defined and even interpreted differently. This is due to the fact that it describes a multidimensional and complex problem that concerns not only stakeholders from the tourism and non-tourism industry, but also requires a broader view of it in the context of social and urban development [49]. The World Tourism Organization (UNWTO) defines overtourism as the impact of tourism on a destination, or parts thereof, that excessively influences perceived quality of life of citizens and/or quality of visitor experiences in a negative way [19]. The rapid development of tourism is now an important problem concerning mainly urban population. An example is southern Europe, where the number of protests and social movements against the wave of tourists who flood attractive tourist cities is growing. The dissatisfaction of city residents has led to the emergence of organizations, such as the Assembly of Neighborhoods for Sustainable Tourism (ABTS) and the Network of Southern European Cities against tourism (SET). Tourist organizations have published a number of reports in which they describe ways of dealing with overtourism [50,51], which now constitutes an important problem for tourism development. In this respect, this part of the article will focus on the investment attractiveness of cities and investment gaps in the context of excessive investment and the threat of overtourism. For this purpose, 30 cities with the greatest potential investment attractiveness and the highest increase in the number of accommodation sites were selected for detailed analysis and case study. 31% of all accommodation sites in Poland are located in these cities (Table 11). They also comprised 51% of newly created accommodation sites in the years 2012–2017. However, these cities differ in many features, including the number of citizens, economic functions, natural and anthropogenic values. The analysed group included 15 cities that perform mainly economic and social functions in the regions. They are characterized by an above-average number of inhabitants, as well as numerous cultural values and historic sites. Another 15 cities are distinguished primarily by natural values related to the seaside or mountain location. The specificity of these values above all determined the formation of various forms of leisure tourism.
Cities with the largest investments differ from each other, due to their natural and anthropogenic values. Investors choose both large voivodship cities, such as Warszawa, Kraków, Gdańsk, Poznań, Toruń, Rzeszów, Legnica, as well as smaller cities located in the coastal zone: Władysławowo, Kołobrzeg, Krynica Morska, Świnoujście, and in the mountainous areas: Szklarska Poręba, Polanica- Zdrój, Karpacz (Table 12).
The comparison of the results of potential investment attractiveness with actual investments indicates that investors are not always interested in areas with high potential investment attractiveness. This is confirmed by the relatively low value of the correlation coefficient at the level of r = 0.47 (Table 6) between the number of newly created accommodation sites and the investment attractiveness indicator. It is also worth emphasizing the seasonality of demand in tourism and its impact on investment. Cities retain their tourism attractiveness for most of the year, while coastal and lakeside towns attract tourists mainly in summer during the holiday season. This has an impact on the nature of tourism development and tourism income. The high concentration of demand in the summer months means that investors in cities and large coastal cities are increasing their accommodation base, hoping for an increase in income. This can also be explained by the intense development in the coastal belt and the increasingly frequent phenomenon of overinvestment and overtourism. The intensive development of the accommodation base may lead to a situation in which a given location begins to lose its original tourist attractiveness.
Crowded promenades, museums, restaurants, and swimming pools, traffic jams, noise, littering streets, intense nightlife, and in some cases increased crime, make attractive cities a holiday horror for both residents and tourists. Monitoring this phenomenon is currently an important aspect of managing tourism development and assessing the real investment attractiveness of cities.
5. Discussion and Final Conclusions
The obtained research results on the factors of development of real tourism investments correspond to the results obtained by other researchers [23,25,27,31]; however, only in relation to cities. It turned out that the key factors determining tourism investments in cities are the degree of urbanization and the level of economic development. In particular, this concerns the examined microclimate of technical and social infrastructure, as well as tourist attractions. At the same time, it was observed that in the case of rural municipalities, this regularity was not confirmed. In this case, the determinants of real tourism investments were mainly natural values. This applies especially to rural municipalities located in the coastal belt and in mountainous areas.
Tourism is a complex system, which means that the aim of planning in this field must be the integrated development of all elements of this system, both in the area of demand and supply, as well as in relation to physical and institutional elements [52].
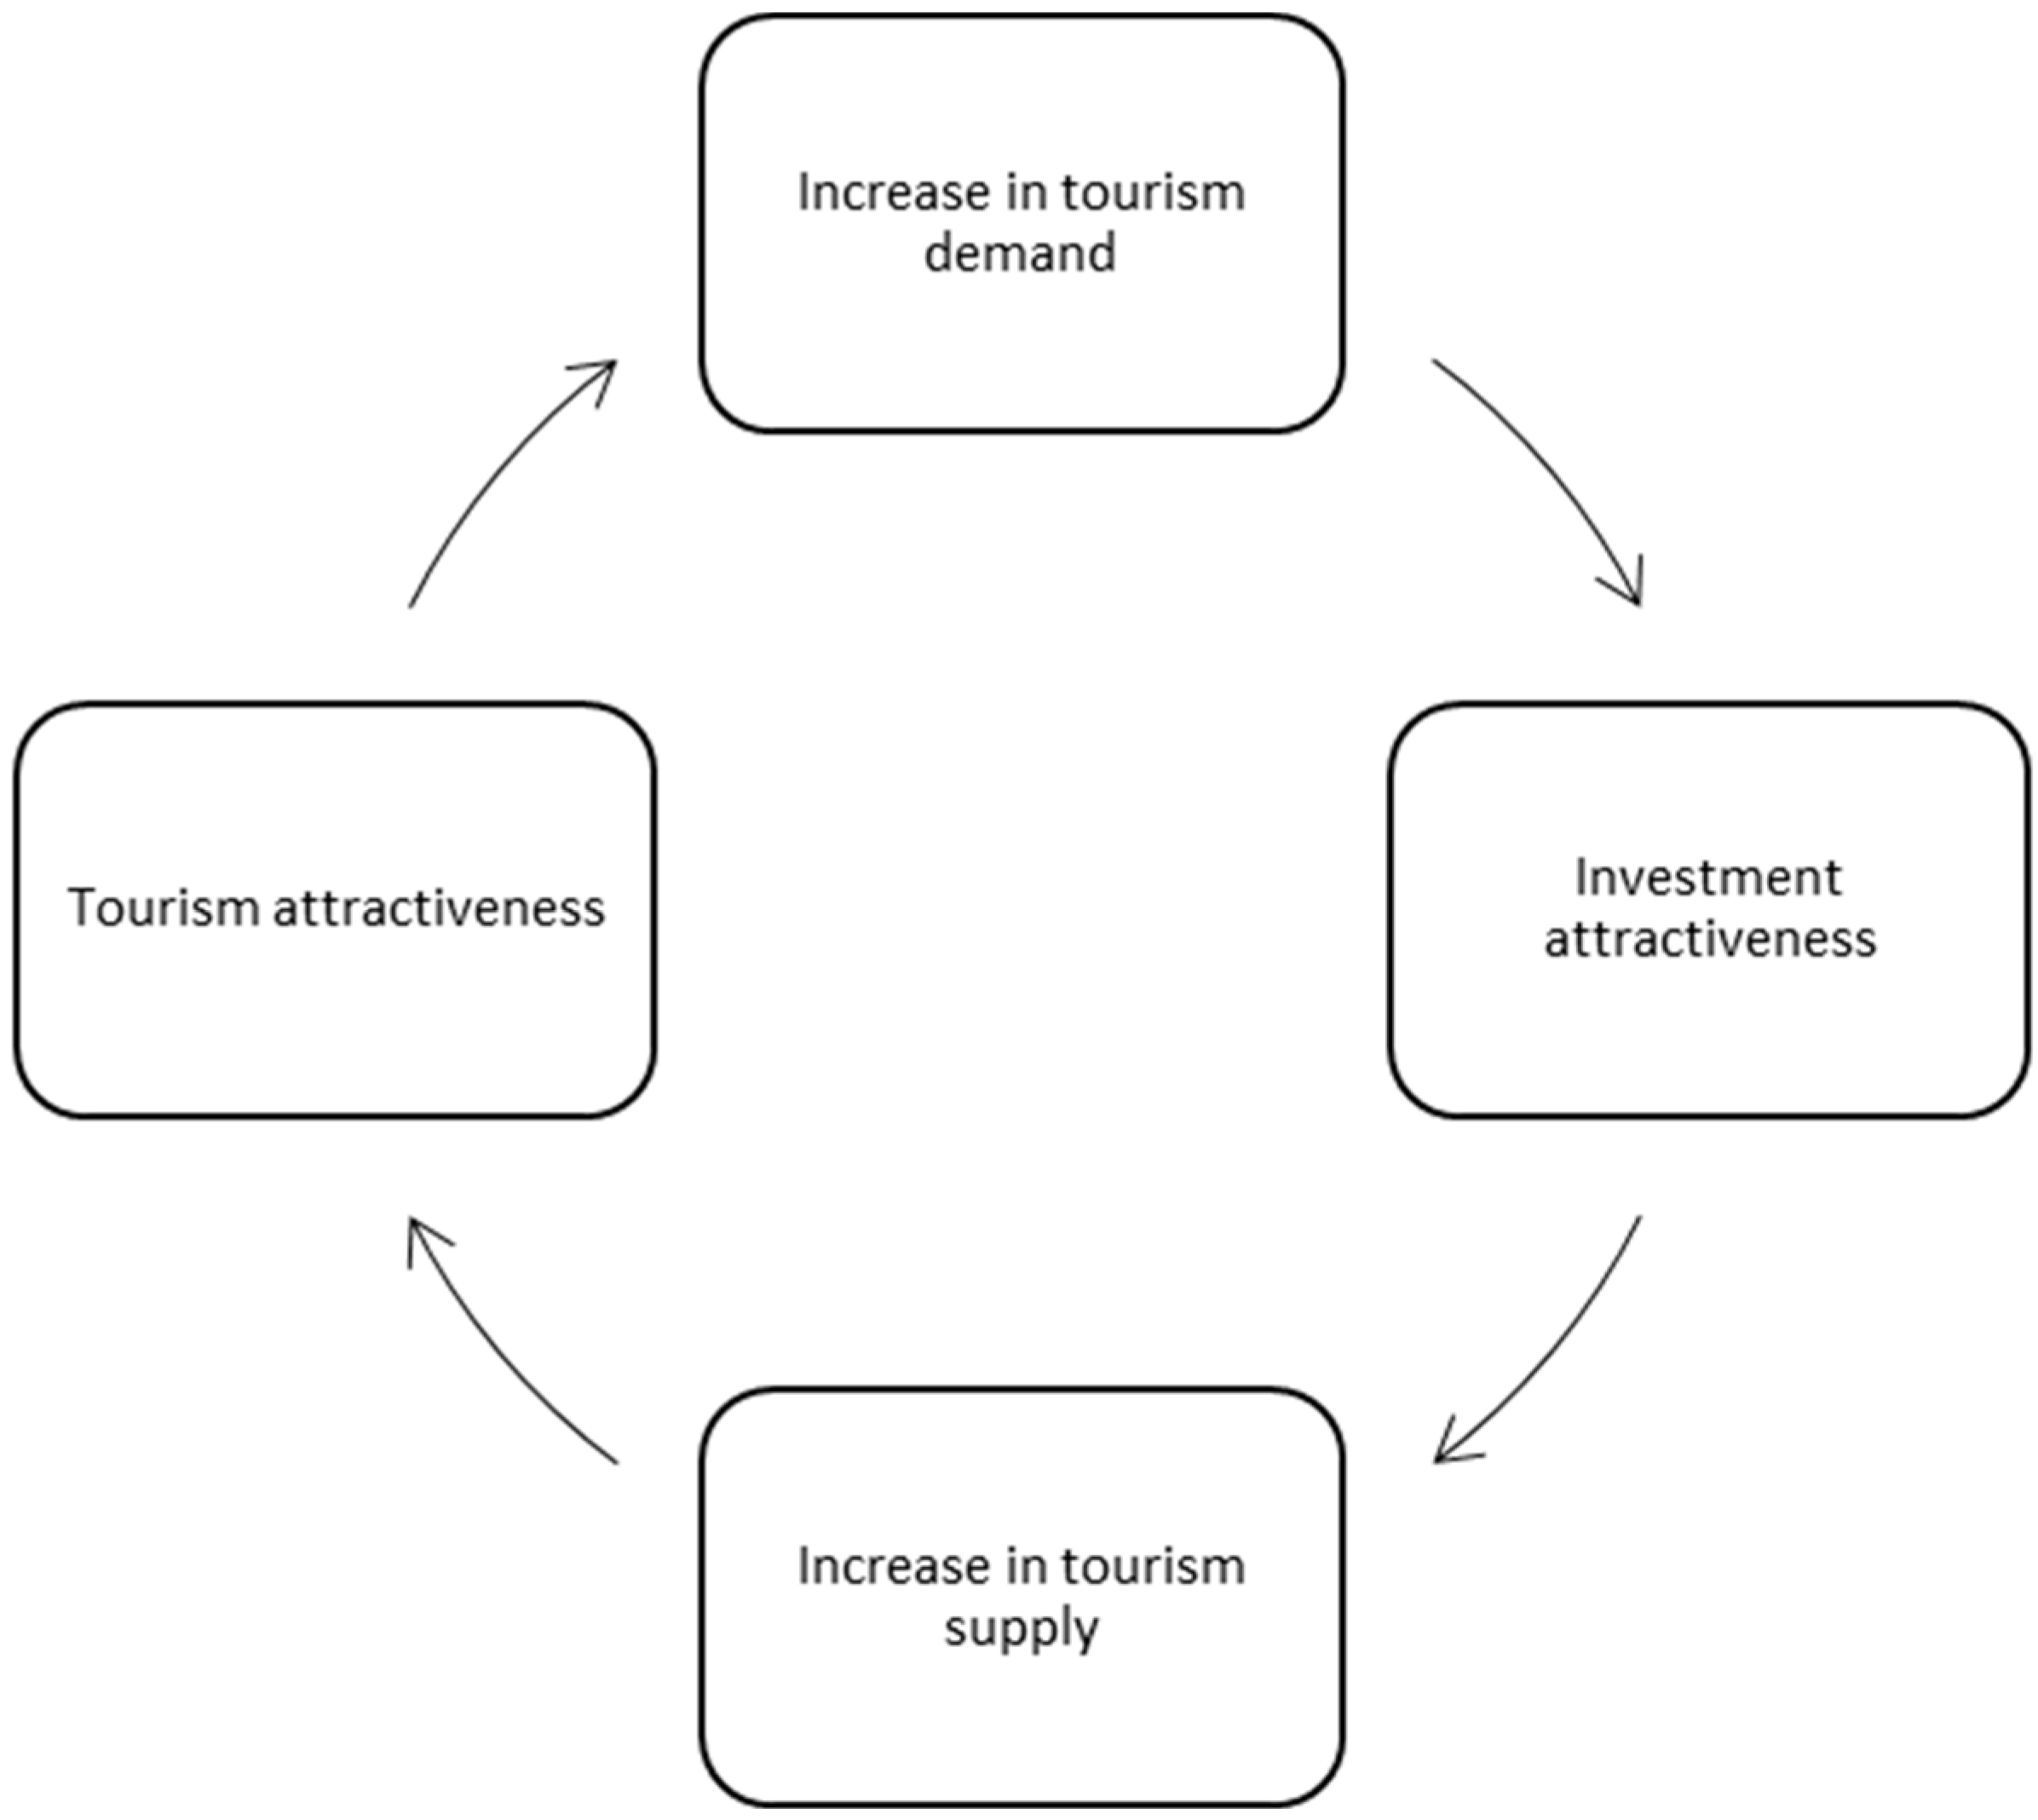
Despite the fact that the phenomenon of overtourism results from an excessive number of tourists, i.e., too high demand, in the case of many types of tourism this phenomenon can also be analyzed from the supply side. This is especially true for seaside holiday tourism. Massive investments related to the creation of new accommodation sites, restaurants, shops and entertainment facilities are largely responsible for tourist traffic in coastal towns. A vicious uncontrolled circle of tourism development is created, in which new investments stimulate the increase in tourist demand (Figure 5). The development of supply increases the tourism attractiveness of the place and encourages tourists to an increased number of trips. Exceeding the tourist capacity creates the aforementioned discomfort in both residents and tourists, as well as the local economic environment.
As previously emphasized, one of the directions of mitigating the effects of overtourism is the use of investment gaps, which arise as a result of not using the potential attractiveness of a given location by investors. Investment attractiveness indicators can be used to assess the investment possibilities of a location.
Tourism investments are characterized by strong concentration. Investors often make decisions based on market observation and supply, hoping to obtain similar location benefits as the competition. Unfortunately, this often leads to overinvestment and the process of withdrawing the investment from the given location. Overinvestment in tourism is one of the reasons for overtoursim. An example of this can be coastal resorts that are under siege of tourists during the summer. During the holiday season, tourist traffic is concentrated in time and space. This situation applies not only to large coastal cities, but also to smaller towns, where the ratio of tourists to residents is very high and has exceeded the critical point.
Cities, due to their specificity, have different values that determine the location of economic activity, which relate to historical conditions, cultural and natural values, as well as the business environment. These conditions determine the development of various forms of tourism, which in some cities occur as individual tourist specialties, or in others as a bundle of tourist attractions and opportunities for the development of various forms of tourism. A set of specific conditions and location factors determines the potential investment attractiveness and provides incentives for investors from the tourism industry.
The presented research results allow for the formulation of several conclusions relating to the current state and future situation on the map of Poland’s investment attractiveness for the tourism industry. There is a large spatial diversity of investment attractiveness in Poland. The east-west divide is particularly visible. This is due to the course of existing socio-economic processes, a higher concentration of population density and entrepreneurship in western Poland. In spatial distribution, the high investment attractiveness of cities that act as the centers of regions or subregions can be observed. This phenomenon occurs in regions with different levels of investment attractiveness.
The location of tourist companies is characterized by strong spatial concentration. Almost half of the accommodation sites in Poland are located in large and medium-sized cities. At the same time, the largest number of new accommodation sites were created in cities in the period under review. The observed disproportions between the potential and actual investment attractiveness are worrying. High concentration of investments in cities can lead to overinvestment and the phenomenon of overtourism. One of the directions of actions that can be taken to mitigate its effects is the use of investment gaps and the spatial dispersion of tourist attractions and accommodation sites.
Limitations regarding the smaller study included mainly the availability of data used to present the complex phenomenon of investment attractiveness for tourism. Despite the availability of some indicators in official statistics, there is still a lack of information at the local level regarding many elements of tourism development, transport and natural components. This data could enrich the model and improve its interpretation capabilities.
This paper provides new evidence on investment attractiveness in tourism, as well as the investment gap. Moreover, it responds to the current debate on overtourism, as it indicates investment gaps that can be used in tourism policy and tourism development planning. Finally, it opens a series of new avenues for potential research, for example, searching for a mechanism and conditions for structural changes in tourism, especially the role of diffusion of innovations, innovation gaps in rural tourism [53], cooperation networks and entrepreneurial ecosystems that are conducive to investment.
Author Contributions
Conceptualization, Methodology, Validation, Data Curation, Writing—Original Draft, Writing—Review & Editing, Visualization, Project administration, Supervision, Investigation: P.Z.; Resources, Formal analysis, Software: P.Z., G.K., E.M.-M.; O.O.
Funding
Grzegorz Kwiatkowski and Ove Oklevik.
Conflicts of Interest
The authors declare no conflict of interest.
References
- World Tourism Organization (UNWTO). World Tourism Barometer; UNWTO: Madrid, Spain, 2019. [Google Scholar]
- Santos, A.; Cincera, M. Tourism demand, low cost carriers and European institutions: The case of Brussels. J. Transp. Geogr. 2018, 73, 163–171. [Google Scholar] [CrossRef]
- Eugenio-Martin, J.L.; Inchausti-Sintes, F. Low-cost travel and tourism expenditures. Ann. Tour. Res. 2016, 57, 140–159. [Google Scholar] [CrossRef]
- Organization for Economic Co-operation and Development (OECD). Tourism Trends and Policies; OECD: Paris, France, 2018. [Google Scholar]
- Boley, B.B.; McGehee, N.G.; Perdue, R.R.; Long, P. Empowerment and resident attitudes toward tourism: Strengthening the theoretical foundation through a Weberian lens. Ann. Tour. Res. 2014, 49, 33–50. [Google Scholar] [CrossRef]
- Postma, A.; Schmücker, D. Understanding and overcoming negative impacts of tourism in city destinations: Conceptual model and strategic framework. J. Tour. Futures 2017, 3, 144–156. [Google Scholar] [CrossRef]
- Gössling, S.; Ring, A.; Dwyer, L.; Andersson, A.C.; Hall, C.M. Optimizing or maximising? A challenge to sustainable tourism. J. Sustain. Tour. 2016, 24, 527–548. [Google Scholar] [CrossRef]
- Hall, C.M. Degrowing tourism: Decroissance, sustainable consumption and steady-state tourism. Anatolia 2009, 20, 46–61. [Google Scholar] [CrossRef]
- Oklevik, O.; Gössling, S.; Hall, C.M.; Steen Jacobsen, J.K.; Grøtte, I.P.; McCabe, S. Overtourism, optimisation, and destination performance indicators: A case study of activities in Fjord Norway. J. Sustain. Tour. 2019. [Google Scholar] [CrossRef]
- Go, F.M.; Govers, R. Integrated quality management for tourist destinations: A European perspective on achieving competitiveness. Tour. Manag. 2000, 21, 79–88. [Google Scholar] [CrossRef]
- Wahab, S.; Cooper, C. Tourism, globalisation and the competitive advantage of nations. In Tourism in the Age of Globalisation; Routledge: Abingdon-on-Thames, UK, 2001. [Google Scholar]
- Hassan, S.S. Determinants of market competitiveness in an environmentally sustainable tourism industry. J. Travel Res. 2000, 38, 239–245. [Google Scholar] [CrossRef]
- Enright, M.J.; Newton, J. Tourism destination competitiveness: A quantitative approach. Tour. Manag. 2004, 25, 777–788. [Google Scholar] [CrossRef]
- Das, J.; Dirienzo, C.E. Tourism competitiveness and the role of fractionalization. Int. J. Tour. Res. 2012, 14, 285–297. [Google Scholar] [CrossRef]
- Jackman, M.; Lorde, T.; Lowe, S.; Alleyne, A. Evaluating tourism competitiveness of small island developing states: A revealed comparative advantage approach. Anatolia 2011, 22, 350–360. [Google Scholar] [CrossRef]
- Kim, S.S.; Lee, C.K. Push and pull relationships. Ann. Tour. Res. 2002, 29, 257–260. [Google Scholar] [CrossRef]
- Kruczek, Z. Turyści vs. mieszkańcy. Wpływ nadmiernej frekwencji turystów na proces gentryfikacji miast historycznych na przykładzie Krakowa. Tur. Kult. 2018, 3, 29–41. (In Polish) [Google Scholar]
- Kowalczyk-Anioł, J.; Zmyślony, P. Turystyka miejska jako źródło protestów społecznych—Przykłady Wenecji i Barcelony. Tur. Kult. 2017, 2, 7–36. (In Polish) [Google Scholar]
- World Tourism Organization (UNWTO). ‘Overtourism’? Understanding and Managing Urban Tourism Growth beyond Perceptions; Executive Summary; UNWTO: Madrid, Spain, 2018. [Google Scholar]
- Godlewska-Majkowska, H.; Zarębski, P. Atrakcyjność Inwestycyjna Polskich Regionów, Jako Podstawa Korzyści Aglomeracji; Studia i Analizy Instytutu Przedsiębiorstwa, Szkoła Główna Handlowa: Warszawa, Poland, 2012. (In Polish) [Google Scholar]
- Godlewska-Majkowska, H. Atrakcyjność Inwestycyjna Polskich Regionów: W Poszukiwaniu Nowych Miar; Wydawnictwo Szkoły Głównej Handlowej: Warszawa, Poland, 2008. (In Polish) [Google Scholar]
- Borowicz, A.; Kostyra, M.; Dzierżanowski, M.; Szultka, S.; Wandałowski, M. Atrakcyjność Inwestycyjna Województw i Podregionów Polski 2016; Instytut Badań nad Gospodarką Rynkową: Gdańsku, Poland, 2016. (In Polish) [Google Scholar]
- Puciato, D. Attractiveness of municipalities in South-Western Poland as determinants for hotel chain investments. Tour. Manag. 2016, 57, 245–255. [Google Scholar] [CrossRef]
- Adam, I.; Amuquandoh, F.E. Dimensions of hotel location in the Kumasi Metropolis, Ghana. Tour. Manag. Perspect. 2013, 8, 1–8. [Google Scholar] [CrossRef]
- Assaf, A.G.; Josiassen, A.; Agbola, F.W. Attracting international hotels: Locational factors that matter most. Tour. Manag. 2015, 47, 329–340. [Google Scholar] [CrossRef]
- Chen, M.H. The economy, tourism growth and corporate performance in the Taiwanese hotel industry. Tour. Manag. 2010, 31, 665–675. [Google Scholar] [CrossRef]
- Rodríguez, A.R. Determining factors in entry choice for international expansion. The case of the Spanish hotel industry. Tour. Manag. 2002, 23, 597–607. [Google Scholar] [CrossRef]
- Crecente, J.M.; Santé, I.; Díaz, C.; Crecente, R. A multicriteria approach to support the location of thalassotherapy (seawater therapy) resorts: Application to Galicia region, NW Spain. Landsc. Urban Plan. 2012, 104, 135–147. [Google Scholar] [CrossRef]
- Polyzos, S.; Minetos, D. An ordinal regression analysis of tourism enterprises’ location decisions in Greece. Anatolia 2011, 22, 102–119. [Google Scholar] [CrossRef]
- Sund, K.J. The geographical concentration of hotels in Switzerland and the industry lifecycle. Tour. Hosp. Plan. Dev. 2006, 3, 1–18. [Google Scholar] [CrossRef]
- Zhang, H.Q.; Guillet, B.D.; Gao, W. What determines multinational hotel groups’ locational investment choice in China? Int. J. Hosp. Manag. 2012, 31, 350–359. [Google Scholar] [CrossRef]
- Lee, C.F.; Huang, H.I.; Yeh, H.R. Developing an evaluation model for destination attractiveness: Sustainable forest recreation tourism in Taiwan. J. Sustain. Tour. 2010, 18, 811–828. [Google Scholar] [CrossRef]
- Mayo, E.J.; Jarvis, L.P. The Psychology of Leisure Travel: Effective Marketing and Selling of Travel Service; CBI Publishing: Boston, MA, USA, 1981. [Google Scholar]
- Lijewski, T.; Mikułowski, B.; Wyrzykowski, J. Geografia Turystyczna Polski; PWE: Warsaw, Poland, 1985. (In Polish) [Google Scholar]
- Gołembski, G. Wyodrębnianie regionów turystycznych. In Kompendium Wiedzy o Turystyce; Gołembski, G., Ed.; Wydawnictwo Naukowe PWN: Warsaw, Poland, 2002. (In Polish) [Google Scholar]
- Guillet, B.D.; Zhang, H.Q.; Gao, B.W. Interpreting the mind of multinational hotel investors: Future trends and implications in China. Int. J. Hosp. Manag. 2011, 30, 222–232. [Google Scholar] [CrossRef]
- Middleton, V. Tourist product. In Tourism Marketing and Management Handbook; Witt, F.S., Moutinho, L., Eds.; Prentice Hall: London, UK, 1989. [Google Scholar]
- Gartner, W. Tourism image: Attribute measurement of state tourism products using multidimensional scaling techniques. J. Travel Res. 1989, 28, 16–20. [Google Scholar] [CrossRef]
- Meinung, A. Determinants of the attractiveness of tourism region. In Tourism Marketing and Management Handbook; Witt, F.S., Moutinho, L., Eds.; Prentice Hall: Hertfordshire, UK, 1995. [Google Scholar]
- Kim, H.B. Perceived attractiveness of Korean destinations. Ann. Tour. Res. 1998, 25, 340–361. [Google Scholar]
- Hjalager, A.M.; Kwiatkowski, G. Entrepreneurial implications, prospects and dilemmas in rural festivals. J. Rural Stud. 2018, 63, 217–228. [Google Scholar] [CrossRef] [Green Version]
- Malchrowicz-Mośko, E.; Poczta, J. A small-scale event and a big impact—Is this relationship possible in the world of sport? The meaning of heritage sporting events for sustainable development of tourism—Experiences from Poland. Sustainability 2018, 10, 4289. [Google Scholar] [CrossRef]
- Kukuła, K. Metoda unitaryzacji zerowanej na tle wybranych metod normowania cech diagnostycznych. Acta Sci. Acad. Ostroviensis 1999, 4, 5–31. (In Polish) [Google Scholar]
- Zeliaś, A. Taksonomiczna Analiza Przestrzennego Zróżnicowania Poziomu Życia w Polsce w Ujęciu Dynamicznym; Akademia Ekonomiczna w Krakowie: Kraków, Poland, 2000. (In Polish) [Google Scholar]
- Jenks, G.F. The data model concept in statistical mapping. Int. Yearb. Cartogr. 1967, 7, 186–190. [Google Scholar]
- Local Data Bank. Statistics Poland. Available online: https://bdl.stat.gov.pl (accessed on 11 July 2018).
- Instytut Uprawy Nawożenia i Gleboznawstwa. Waloryzacja Rolniczej Przestrzeni Produkcyjnej; Instytut Uprawy Nawożenia i Gleboznawstwa: Puławy, Poland, 2007. [Google Scholar]
- Borzyszkowski, J.; Marczak, M.; Zarębski, P. Spatial diversity of tourist function development: The municipalities of Poland’s West Pomerania province. Acta Geogr. Slov. 2016, 56, 267–276. [Google Scholar] [CrossRef]
- Koens, K.; Postma, A.; Papp, B. Is overtourism overused? Understanding the impact of tourism in a city context. Sustainability 2018, 10, 4384. [Google Scholar] [CrossRef]
- World Travel and Tourism Council (WTTC). Coping with Success: Managing Overcrowding in Tourism Destinations; WTTC: London, UK, 2017. [Google Scholar]
- World Tourism Organization (UNWTO). Overtourism? Understanding and managing urban tourism growth beyond perceptions. In ‘Overtourism’? Understanding and Managing Urban Tourism Growth beyond Perceptions: Case Studies; UNWTO: Madrid, Spain, 2019. [Google Scholar]
- Alejziak, W. Multi-level governance jako instrument planowania rozwoju i zarządzania obszarami recepcji turystycznej. Tur. Rekreac. 2016, 16, 9–31. [Google Scholar]
- Hjalager, A.-M.; Kwiatkowski, G.; Larsen, M.Ø. Innovation gaps in Scandinavian rural tourism. Scand. J. Hosp. Tour. 2017, 18, 1–17. [Google Scholar] [CrossRef]
Figure 1.
Potential investment attractiveness model for tourism. Source: Author’s own elaboration.

Figure 2.
Investment gaps model for tourism. Source: Author’s own elaboration.

Figure 3.
Potential investment attractiveness of Polish municipalities. Source: Author’s own elaboration.
Figure 3.
Potential investment attractiveness of Polish municipalities. Source: Author’s own elaboration.

Figure 4.
Investment gaps in tourism. Source: Author’s own elaboration.

Figure 5.
Uncontrolled circle of tourism development. Source: Author’s own elaboration.


Table 1.
Components of the potential investment attractiveness indicator for tourism.
| Technical Infrastructure |
| X1 Share of the population served by the waterworks |
| X2 Share of flats with connection to the gas pipeline |
| X3 Share of the population served by the sewage system |
| Social infrastructure |
| X4 Number of viewers in permanent cinemas per 100 inhabitants |
| X5 Sports halls with dimensions from 36 × 19 to 44 × 22 m and 44 × 22 m and larger per 1000 inhabitants |
| X6 Tennis courts open and covered for 1000 inhabitants |
| X7 Swimming open and covered for 1000 inhabitants |
| X8 Aquaparks for 1000 inhabitants |
| X9 Skate parks for 1000 inhabitants |
| X10 Length of bicycle paths per 1000 inhabitants |
| X11 Parks, walking and recreation [ha]/1000 inhabitants X12 Number of residents |
| Administrative climate |
| X13 Share of own revenues in total revenues |
| X14 Expenditure on culture and protection of national heritage per inhabitant |
| X15 Expenditure on physical culture and sport per inhabitant |
| X16 Expenditure on tourism per inhabitant |
| X17 Expenditure on public safety and fire protection per inhabitant |
| Tourist attractions |
| X18 Number of mass events per 1000 inhabitants |
| X19 Number of participants of mass events per 1000 inhabitants |
| X20 Number of seats in conference rooms per 1000 inhabitants |
| X21 Museum/branch visitors per 1000 inhabitants |
| X22 Audience drama theater per 1000 inhabitants |
| Natural values |
| X23 Access to the sea |
| X24 Lake district |
| X25 Landmark indicator |
| X26 Accommodation in health resorts |
| Real investments |
| X27 Number of beds in 2017 |
| X28 Change in the number of beds in years 2012–2017 |
Source: Author’s own elaboration.
Table 2.
Jenks natural breaks classification a synthetic indicator of investment attractiveness.
| Class | Lower | Upper | Count |
|---|---|---|---|
| 1 very low | 0.021019 | 0.094264 | 410 |
| 2 low | 0.094313 | 0.108285 | 414 |
| 3 quite low | 0.108374 | 0.121113 | 411 |
| 4 quite high | 0.121118 | 0.136356 | 420 |
| 5 high | 0.136395 | 0.159968 | 455 |
| 6 very high | 0.160125 | 0.359515 | 368 |
| Goodness of variance fit | d * = 0.469689 | d ** = 3.270889 | GVF *** = 0.856403 |
* Minimum total squared deviation, ** squared deviation, *** goodness of variance fit. Source: Author’s own elaboration.
Table 3.
Assessment of potential investment attractiveness by municipalities.
| Municipalities | Very Low | Low | Quite Low | Quite High | High | Very High | Total |
|---|---|---|---|---|---|---|---|
| Urban | 1 | 9 | 41 | 47 | 204 | 302 | |
| Urban-Rural | 8 | 73 | 151 | 190 | 124 | 82 | 628 |
| Rural | 258 | 443 | 406 | 248 | 134 | 59 | 1548 |
| Total | 267 | 516 | 566 | 479 | 305 | 345 | 2478 |
Source: Author’s own elaboration.
Table 4.
Assessment of potential investment microclimate by municipalities.
| Municipalities/Rating * | Technical Infrastructure | Social Infrastructure | Administrative Climate | Natural Values | Tourist Attractions | Potential Investment Attractiveness |
|---|---|---|---|---|---|---|
| Urban | 0.575 | 0.026 | 0.162 | 0.080 | 0.032 | 0.175 |
| Urban-Rural | 0.462 | 0.013 | 0.118 | 0.070 | 0.011 | 0.135 |
| Rural | 0.381 | 0.006 | 0.094 | 0.072 | 0.006 | 0.112 |
| Total | 0.425 | 0.010 | 0.109 | 0.072 | 0.010 | 0.125 |
* Average value of potential investment indicators. Source: Author’s own elaboration.
Table 5.
Accommodation infrastructure by municipalities.
| Municipalities | Share of Beds Number | Change in the Number of Beds 2012–2017 | Share of Residents |
|---|---|---|---|
| Urban | 49% | 56% | 48% |
| Urban-Rural | 21% | 8% | 23% |
| Rural | 30% | 36% | 29% |
| Total | 100% | 100% | 100% |
Source: Author’s own elaboration.
Table 6.
Relations between potential investment attractiveness and real investments measured by correlation coefficient (descriptive statistics and correlation analysis).
Table 6.
Relations between potential investment attractiveness and real investments measured by correlation coefficient (descriptive statistics and correlation analysis).
| Municipalities | Technical Infrastructure | Social Infrastructure | Administrative Climate | Natural Values | Tourism Attractions | Potential Investment Attractiveness |
|---|---|---|---|---|---|---|
| Urban | ||||||
| r | 0.18 | 0.41 | 0.40 | 0.25 | 0.42 | 0.47 |
| Mean | 0.58 | 0.03 | 0.16 | 0.08 | 0.03 | 0.18 |
| SD | 0.07 | 0.02 | 0.05 | 0.07 | 0.04 | 0.03 |
| p | 0.00 | 0.00 | 0.00 | 0.00 | 0.00 | 0.00 |
| N | 302 | 302 | 302 | 302 | 302 | 302 |
| Urban-Rural | ||||||
| r | 0.08 | 0.07 | 0.18 | 0.26 | 0.31 | 0.26 |
| Mean | 0.46 | 0.01 | 0.12 | 0.07 | 0.01 | 0.13 |
| SD | 0.08 | 0.02 | 0.05 | 0.05 | 0.02 | 0.03 |
| p | 0.05 | 0.06 | 0.00 | 0.00 | 0.00 | 0.00 |
| N | 628 | 628 | 628 | 628 | 628 | 628 |
| Rural | ||||||
| r | 0.07 | 0.19 | 0.19 | 0.28 | 0.14 | 0.25 |
| Mean | 0.38 | 0.01 | 0.09 | 0.07 | 0.01 | 0.11 |
| SD | 0.10 | 0.02 | 0.05 | 0.06 | 0.02 | 0.03 |
| p | 0.01 | 0.00 | 0.00 | 0.00 | 0.00 | 0.00 |
| N | 1548 | 1548 | 1548 | 1548 | 1548 | 1548 |
| Total | ||||||
| r | 0.14 | 0.25 | 0.25 | 0.23 | 0.35 | 0.31 |
| Mean | 0.43 | 0.01 | 0.11 | 0.07 | 0.01 | 0.13 |
| SD | 0.12 | 0.02 | 0.05 | 0.06 | 0.02 | 0.04 |
| p | 0.00 | 0.00 | 0.00 | 0.00 | 0.00 | 0.00 |
| N | 2478 | 2478 | 2478 | 2478 | 2478 | 2478 |
Source: Author’s own elaboration.
Table 7.
ANOVA.
| Model | Sum of Squares | df | Men Squares | F | p |
|---|---|---|---|---|---|
| Regression | 0.665 | 5 | 0.133 | 105.417 | 0.000 |
| Residual | 3.118 | 2472 | 0.001 | ||
| Total | 3.782 |
Table 8.
Coefficients.
| Model | Unstandardized Coefficients | Standardized Coefficients | t | p | |
|---|---|---|---|---|---|
| B | St. Error | Beta | |||
| (Constant) | 0.220 | 0.003 | 74.083 | 0.000 | |
| Technical infrastructure | −0.005 | 0.007 | −0.015 | −0.703 | 0.482 |
| Social infrastructure | 0.214 | 0.045 | 0.098 | 4.712 | 0.000 |
| Administrative climate | 0.081 | 0.016 | 0.113 | 4.960 | 0.000 |
| Natural values | 0.109 | 0.013 | 0.162 | 8.666 | 0.000 |
| Tourism attractions | 0.414 | 0.034 | 0.249 | 12.150 | 0.000 |
Source: Author’s own elaboration.
Table 9.
Model summary multiple linear regression.
| Model | R | R Square | Adjusted R Square | Std. Error of the Estimate |
|---|---|---|---|---|
| 1 | 0.419 | 0.176 | 0.174 | 0.036 |
Table 10.
Investment gaps—difference between potential investment attractiveness class and real investments class by municipalities.
Table 10.
Investment gaps—difference between potential investment attractiveness class and real investments class by municipalities.
| Municipalities | Difference between Classes (Number of Municipalities) | ||||||||||
|---|---|---|---|---|---|---|---|---|---|---|---|
| −4 | −3 | −2 | −1 | 0 | 1 | 2 | 3 | 4 | 5 | ||
| Urban | 37 | 54 | 52 | 60 | 66 | 33 | 302 | ||||
| Urban-Rural | 8 | 21 | 71 | 128 | 138 | 156 | 84 | 22 | 628 | ||
| Rural | 1 | 8 | 18 | 59 | 428 | 378 | 288 | 211 | 136 | 21 | 1548 |
| Total | 1 | 8 | 26 | 80 | 536 | 560 | 478 | 427 | 286 | 76 | 2478 |
Source: Author’s own elaboration.
Table 11.
Accommodation infrastructure by types of municipalities.
| Types of Municipalities | Number of Cities | Number of Residents | Number of Beds 2017 | Changes in the Number of Beds in Years 2012–2017 |
|---|---|---|---|---|
| Cities | 15 | 5,921,526 | 120,245 | 24,343 |
| Seaside cities | 9 | 627,947 | 91,308 | 21,607 |
| Mountain cities | 5 | 27,681 | 24,140 | 3593 |
| Lowland spa cities | 1 | 10,586 | 5811 | 1045 |
| Total types of cities | 30 | 6,587,740 | 241,504 | 50,588 |
| In relation to Poland | 1% | 14% | 31% | 51% |
Source: Author’s own elaboration.
Table 12.
Real investment attractiveness in cities–list of the most attractive.
| City Name | Number of Residents | Synthetic Indicator | Number of Beds 2017 | Number of Beds 2012 | Changes in the Number of Beds in Years 2012–2017 | Resident to Number of Beds Ratios |
|---|---|---|---|---|---|---|
| Władysławowo | 15,482 | 0.24 | 17,232 | 11,362 | 5870 | 1:1.11 |
| Warszawa | 1,764,615 | 0.26 | 31,021 | 25,382 | 5639 | 1:0.02 |
| Kraków | 767,348 | 0.24 | 31,022 | 26,513 | 4509 | 1:0.04 |
| Gdańsk | 464,254 | 0.26 | 17,315 | 13,417 | 3898 | 1:0.04 |
| Kołobrzeg | 46,568 | 0.27 | 17,323 | 13,852 | 3471 | 1:0.37 |
| Legnica | 100,324 | 0.20 | 12,553 | 9904 | 2649 | 1:0.13 |
| Sopot | 36,533 | 0.36 | 5964 | 3426 | 2538 | 1:0.16 |
| Rzeszów | 189,662 | 0.19 | 4136 | 1879 | 2257 | 1:0.02 |
| Krynica Morska | 1302 | 0.29 | 5829 | 4008 | 1821 | 1:4.48 |
| Poznań | 538,633 | 0.20 | 9379 | 8065 | 1314 | 1:0.02 |
| Toruń | 202,562 | 0.23 | 4305 | 2997 | 1308 | 1:0.02 |
| Świnoujście | 41,032 | 0.25 | 10,949 | 9703 | 1246 | 1:0.27 |
| Lublin | 339,850 | 0.21 | 3553 | 2320 | 1233 | 1:0.01 |
| Kielce | 196,804 | 0.21 | 3209 | 1983 | 1226 | 1:0.02 |
| Hel | 3373 | 0.26 | 1657 | 560 | 1097 | 1:0.49 |
| Ciechocinek | 10,586 | 0.23 | 5811 | 4766 | 1045 | 1:0.55 |
| Łeb | 3694 | 0.25 | 9788 | 8842 | 946 | 1:2.65 |
| Szklarska Poręba | 6681 | 0.22 | 5412 | 4497 | 915 | 1:0.81 |
| Polanica-Zdrój | 6381 | 0.21 | 2553 | 1676 | 877 | 1:0.4 |
| Bydgoszcz | 352,313 | 0.19 | 3403 | 2578 | 825 | 1:0.01 |
| Karpacz | 4711 | 0.33 | 10,360 | 9555 | 805 | 1:2.2 |
| Ustka | 15,709 | 0.25 | 5251 | 4531 | 720 | 1:0.33 |
| Katowice | 296,262 | 0.20 | 4224 | 3536 | 688 | 1:0.01 |
| Siedlce | 77,653 | 0.19 | 1484 | 840 | 644 | 1:0.02 |
| Łódź | 690,422 | 0.21 | 7113 | 6544 | 569 | 1:0.01 |
| Gliwice | 181,309 | 0.20 | 2107 | 1588 | 519 | 1:0.01 |
| Opole | 128,140 | 0.21 | 1367 | 849 | 518 | 1:0.01 |
| Szczyrk | 5699 | 0.21 | 2855 | 2339 | 516 | 1:0.5 |
| Świeradów-Zdrój | 4209 | 0.24 | 2960 | 2480 | 480 | 1:0.7 |
| Grudziądz | 95,629 | 0.18 | 1369 | 924 | 445 | 1:0.01 |
Source: Author’s own elaboration based on statistical data of Central Statistical Office in Poland.
© 2019 by the authors. Licensee MDPI, Basel, Switzerland. This article is an open access article distributed under the terms and conditions of the Creative Commons Attribution (CC BY) license (http://creativecommons.org/licenses/by/4.0/).
Share and Cite
MDPI and ACS Style
Zarębski, P.; Kwiatkowski, G.; Malchrowicz-Mośko, E.; Oklevik, O. Tourism Investment Gaps in Poland. Sustainability 2019, 11, 6188. https://0-doi-org.brum.beds.ac.uk/10.3390/su11226188
AMA Style
Zarębski P, Kwiatkowski G, Malchrowicz-Mośko E, Oklevik O. Tourism Investment Gaps in Poland. Sustainability. 2019; 11(22):6188. https://0-doi-org.brum.beds.ac.uk/10.3390/su11226188
Chicago/Turabian StyleZarębski, Patrycjusz, Grzegorz Kwiatkowski, Ewa Malchrowicz-Mośko, and Ove Oklevik. 2019. "Tourism Investment Gaps in Poland" Sustainability 11, no. 22: 6188. https://0-doi-org.brum.beds.ac.uk/10.3390/su11226188
Note that from the first issue of 2016, this journal uses article numbers instead of page numbers. See further details here.