A Decision Support System for Water Resources Management: The Case Study of Mubuku Irrigation Scheme, Uganda

1
Engineering Department, University of Roma Tre, via Vito Volterra 62, 00146 Rome, Italy
2
Land and Water Division, Food and Agriculture Organization of United Nations, Viale delle Terme di Caracalla, 00153 Rome, Italy
*
Author to whom correspondence should be addressed.
Sustainability 2019, 11(22), 6260; https://0-doi-org.brum.beds.ac.uk/10.3390/su11226260
Submission received: 24 September 2019
/
Revised: 26 October 2019
/
Accepted: 3 November 2019
/
Published: 7 November 2019
Abstract
:The greater competing demand for water requires an efficient use of water resources. Therefore, an optimum management is necessary in order to deal with the constraining factors. In African countries, irrigated agriculture is the largest user of surface water resources. Nevertheless, recent assessments in small-scale surface irrigation schemes resulted in poor performance indicators: Water use efficiency indicators of existing schemes are below 50 percent, owing to inadequate management modes. The paper sheds the light on the potential development of a decision-support system based knowledge with the Mapping System and Services for Canal Operation Techniques approach, merged with the MIKEHydro Basin model as a versatile and flexible framework conceived for a large variety of applications in small-scale irrigation. The model aims to improve water service, increase irrigation efficiency, comply with socio-economic objectives at country level. In order to address the prevailing heterogeneity of small-scale irrigation scheme, numerous variables are adjusted in the model, in terms of cropping patterns, climate data, and irrigation time. The evaluation of established water balance under different scenarios showed that tackling supply-driven scheduling and distributive issues significantly increases efficiency. Nevertheless, water allocation according to socio-economic objectives of food security and market security implies trading off the efficiency objectives.
1. Introduction
Increasing water resources management complexities and constraints have become challenging issues for several reasons. Firstly, a greater competing demand for water requires an efficient use of a finite and irreplaceable resource. The use implies appropriate and sustainable responses to a wider range of water management issues, including water use conservation and water use efficiency. Therefore, optimum management of available water resources is necessary in order to deal with all these factors, that are negatively affecting valuable resources for agricultural production [1]. Available tools already provide irrigation managers the means to consider and assess these complex issues and make plans for the future [2]. Lastly, fundamental uncertainties and risks of irreversible environmental changes make natural resources management a further challenging task, requiring a wider spectrum of different policy implications and possible solutions [3]. However, irrigation development has made major gains in agricultural productivity [4,5]. Furthermore, irrigated agriculture plays an important role in fostering economic viability in African countries [6]. Agriculture is called the engine of growth as it is the absorber for rural employees and main income of households [7]. Consequently, irrigation has a direct effect not only on productivity, but directly on poverty alleviation. The current use of resources has a profound impact on other water uses though (domestic, livestock, and industrial). Improving the sustainability of water use is certainly essential. What are the revealed factors constraining sustainable water resource use? Recently, several assessments of small-scale irrigation scheme proved that numerous irrigation schemes have poor performance values due to inappropriate planning, low operational and management processes, inappropriate land arrangements, and lack of technical knowledge [8]. Improving small-scale irrigation schemes is particularly difficult in the sense that they often represent large heterogeneity in farm management. The performance of an irrigation system is significantly affected by adopted operations and management modes, and mismanagement can lead to biases [9]. Therefore, creating optimal management, which provides equal advantage for users, gives a greater effect. In irrigated areas, farmers’ lack of adequate water resources management skills implies the employment of inadequate practices [10]. Currently, irrigation efficiency levels of existing schemes are below 50 percent owing to high water losses in the conveyance efficiency and inefficient application to cultivated crop areas [11,12]. In order to judiciously plan the development of water resources, performance indicator such as irrigation efficiency should be evaluated through water balance approach. Matching delivered water supply to water demand allows for more efficient water use without posing a threat to farmers’ productivity. Implications require careful considerations in terms of irrigation infrastructures development (i.e., planning and design), management (i.e., operation and maintenance), and by taking into account all technical, socio-economic, and environmental issues [13].
Uganda has a high-potential agricultural sector, due to its favorable agro-climatic conditions [14]. The country is not an exception from formulating agriculture-driven development strategies in order to reach the abovementioned gains. The National Irrigation Policy pronounces the two major constraints of agricultural productivity: Climate change and population pressure. Despite its yield stabilizing effect, only 0.5 percent of the irrigation potential is currently exploited. Therefore, further irrigation development is instrumental. Uganda’s master plan “Vision 2040” is in line with its commitment to SDGs: ”Uganda aspires to transform agriculture from subsistence to commercial agriculture through both mechanization and introduction of modern irrigation systems” (National Irrigation Policy, 2017). Irrigation development must enhance agricultural productivity that is consistent with pro-poor and sustainability objectives. The Mubuku Irrigation Scheme—the pilot scheme of the recent study—is considered the food basket for Kasese district [15]. Based on its excellent agroclimatic conditions, the Mubuku settlement scheme has been established under governmental programming with the target to supply the domestic food demand and accelerate transitioning from subsistence-based to commercial production. The small-scale scheme has been recently undergoing further irrigation development and extension in order to exploit its irrigation potential. However, irrigation management must overcome many identified shortcomings. Despite the scheme providing a sufficient amount of water resources for irrigation, farmers have often experienced water shortage or water logging, failing production, limited access to information systems on production and water use, poor levels of knowledge and training experiences concerning irrigation management and land and water management techniques [16]. Moreover, conflicts are present between upstream farmers and downstream, whereas a sense of inferiority is increasing because of the unregulated upstream water withdrawal. How optimum strategies can be investigated? What are the internal and external factors for considerations? Is there a methodology or combination of methodologies which can be scaled at smallholder level without jeopardizing equal access to water services?
In order to meet people’s water-related needs, soft-path measures, such as optimal allocation and schedule or harmonized management can provide a comprehensive approach towards a sustainable agricultural production [17,18]. In order to create an effective tool for decision support, the current study combines two types of methodologies: Mapping System and Services for Canal Operation Techniques (MASSCOTE) developed by the Food and Agricultural Organization (FAO) and decision support system (DSS) approaches. MASSCOTE enables the establishment of diagnosis and performance assessment in terms of efficiency, management and overall water service. DSS could be an important tool to assist in making and improving policies in agriculture, supporting decision-making processes that are in line with the objectives of smallholders. DSS is a dedicated software-based system, able to address water resources management. It can provide an operational framework to integrate three disciplines together: Simulation modelling (SM), participatory planning (PP), and decision analysis (DA) [3]. By merging these disciplines, farmers would be supported in decision-making processes to assess acceptable management strategies targeting the best economic, social and environmental alternative solution. DSS applications have been elaborated ever since 1998. Lilburne et al. conceived a system combined to a numerical simulation model, indicating the most feasible water requirements for specific crop production [19]. Results related to adequate policies and individual actions for agricultural producers were provided by Da Silva and Pinto in 2001. Furthermore, a DSS was developed by Mateos et al. in 2002, with regards to irrigation schemes management. Relevant studies, concerning its applicability in order to directly improve water resources management, were developed focusing on irrigation management in the Gezira Scheme (Sudan) and computing seasonal crop water requirement [20]. In 2007, a DSS implication was presented in Latin America to improve the sustainability of intensive irrigated agriculture. The tool aimed to provide information, simulation and optimization models improving the irrigation efficiency level [21]. Environmental, socio-economic, and technical aspects were combined together, in order to adopt an innovative approach within the DSS. In 2016, an integrated decision support system (IDSS) was investigated for its application in Amhara (Ethiopia). Hence, agricultural production at small-farm level in the region has regularly been affected by scarce water resources. The IDSS facilitated the multi-scale and multi-aspects assessment [22], as it includes cropping pattern analysis at irrigation scheme level, environmental risk assessment, nutritional and economic analysis at farm level. The MIKEHydro Basin model was utilized in 2014, as a DSS for irrigation management and water sharing issues of the Rangawan reservoir (India) [23]. Two separate models were developed: One for the analysis of the optimum irrigation releases and one for water sharing problems. The former was implemented to compute irrigation water demand and was utilized as input for the latter, in order to calculate water excesses and deficits. Twelve different scenarios were evaluated, in terms of water supply, water demand deficit/excess, and actual cropping patterns in the Madhya Pradesh command area. The MIKEHydro Basin model, developed as a DSS, was successfully implemented for real time operations and irrigation planning, through meteorological data and crops characteristics. The study applied the same MIKEHydro Basin model.
The paper sheds the light on the potential development of a knowledge-based DSS in the Mubuku Irrigation Scheme through merging two approaches: MASSCOTE together with the implementation of the MIKEHydro Basin model. The development of such methodology presents a novel approach that reflects on socio-economic requirement and unlocks the resource constraints. This is a versatile and highly flexible water framework conceived for a large variety of applications. It enables the investigation of four different scenarios in terms of water supply, water demand deficit/excess, and existing cropping patterns through the case study of the Mubuku Irrigation Scheme. The research paper has been carried out with the following objectives: (i) to investigate the development of knowledge-based DSS in small-scale irrigation scheme, which supports optimal water resources allocation, enhanced water use efficiency and water use productivity and socio-economic development at country level; (ii) to analyze the baseline conditions in the irrigation scheme; and (iii) to construct possible alternative scenarios, for optimal water distribution and cropping patterns. The novelty of the current approach is the integration of multiple objectives of smallholders while considering water resource constraints. The approach is suitable to assist Sub-Saharan countries in meeting the new monitoring challenges, strengthening indicators that measure food, agriculture and the sustainable use of natural water resources, assessing the best agricultural management practices, and enhancing the sustainable use of natural water resources. Consequently, the paper contributed to the overarching goal of achieving related targets and indicators of Sustainable Development Goals.
2. Materials and Methods
2.1. Study Area
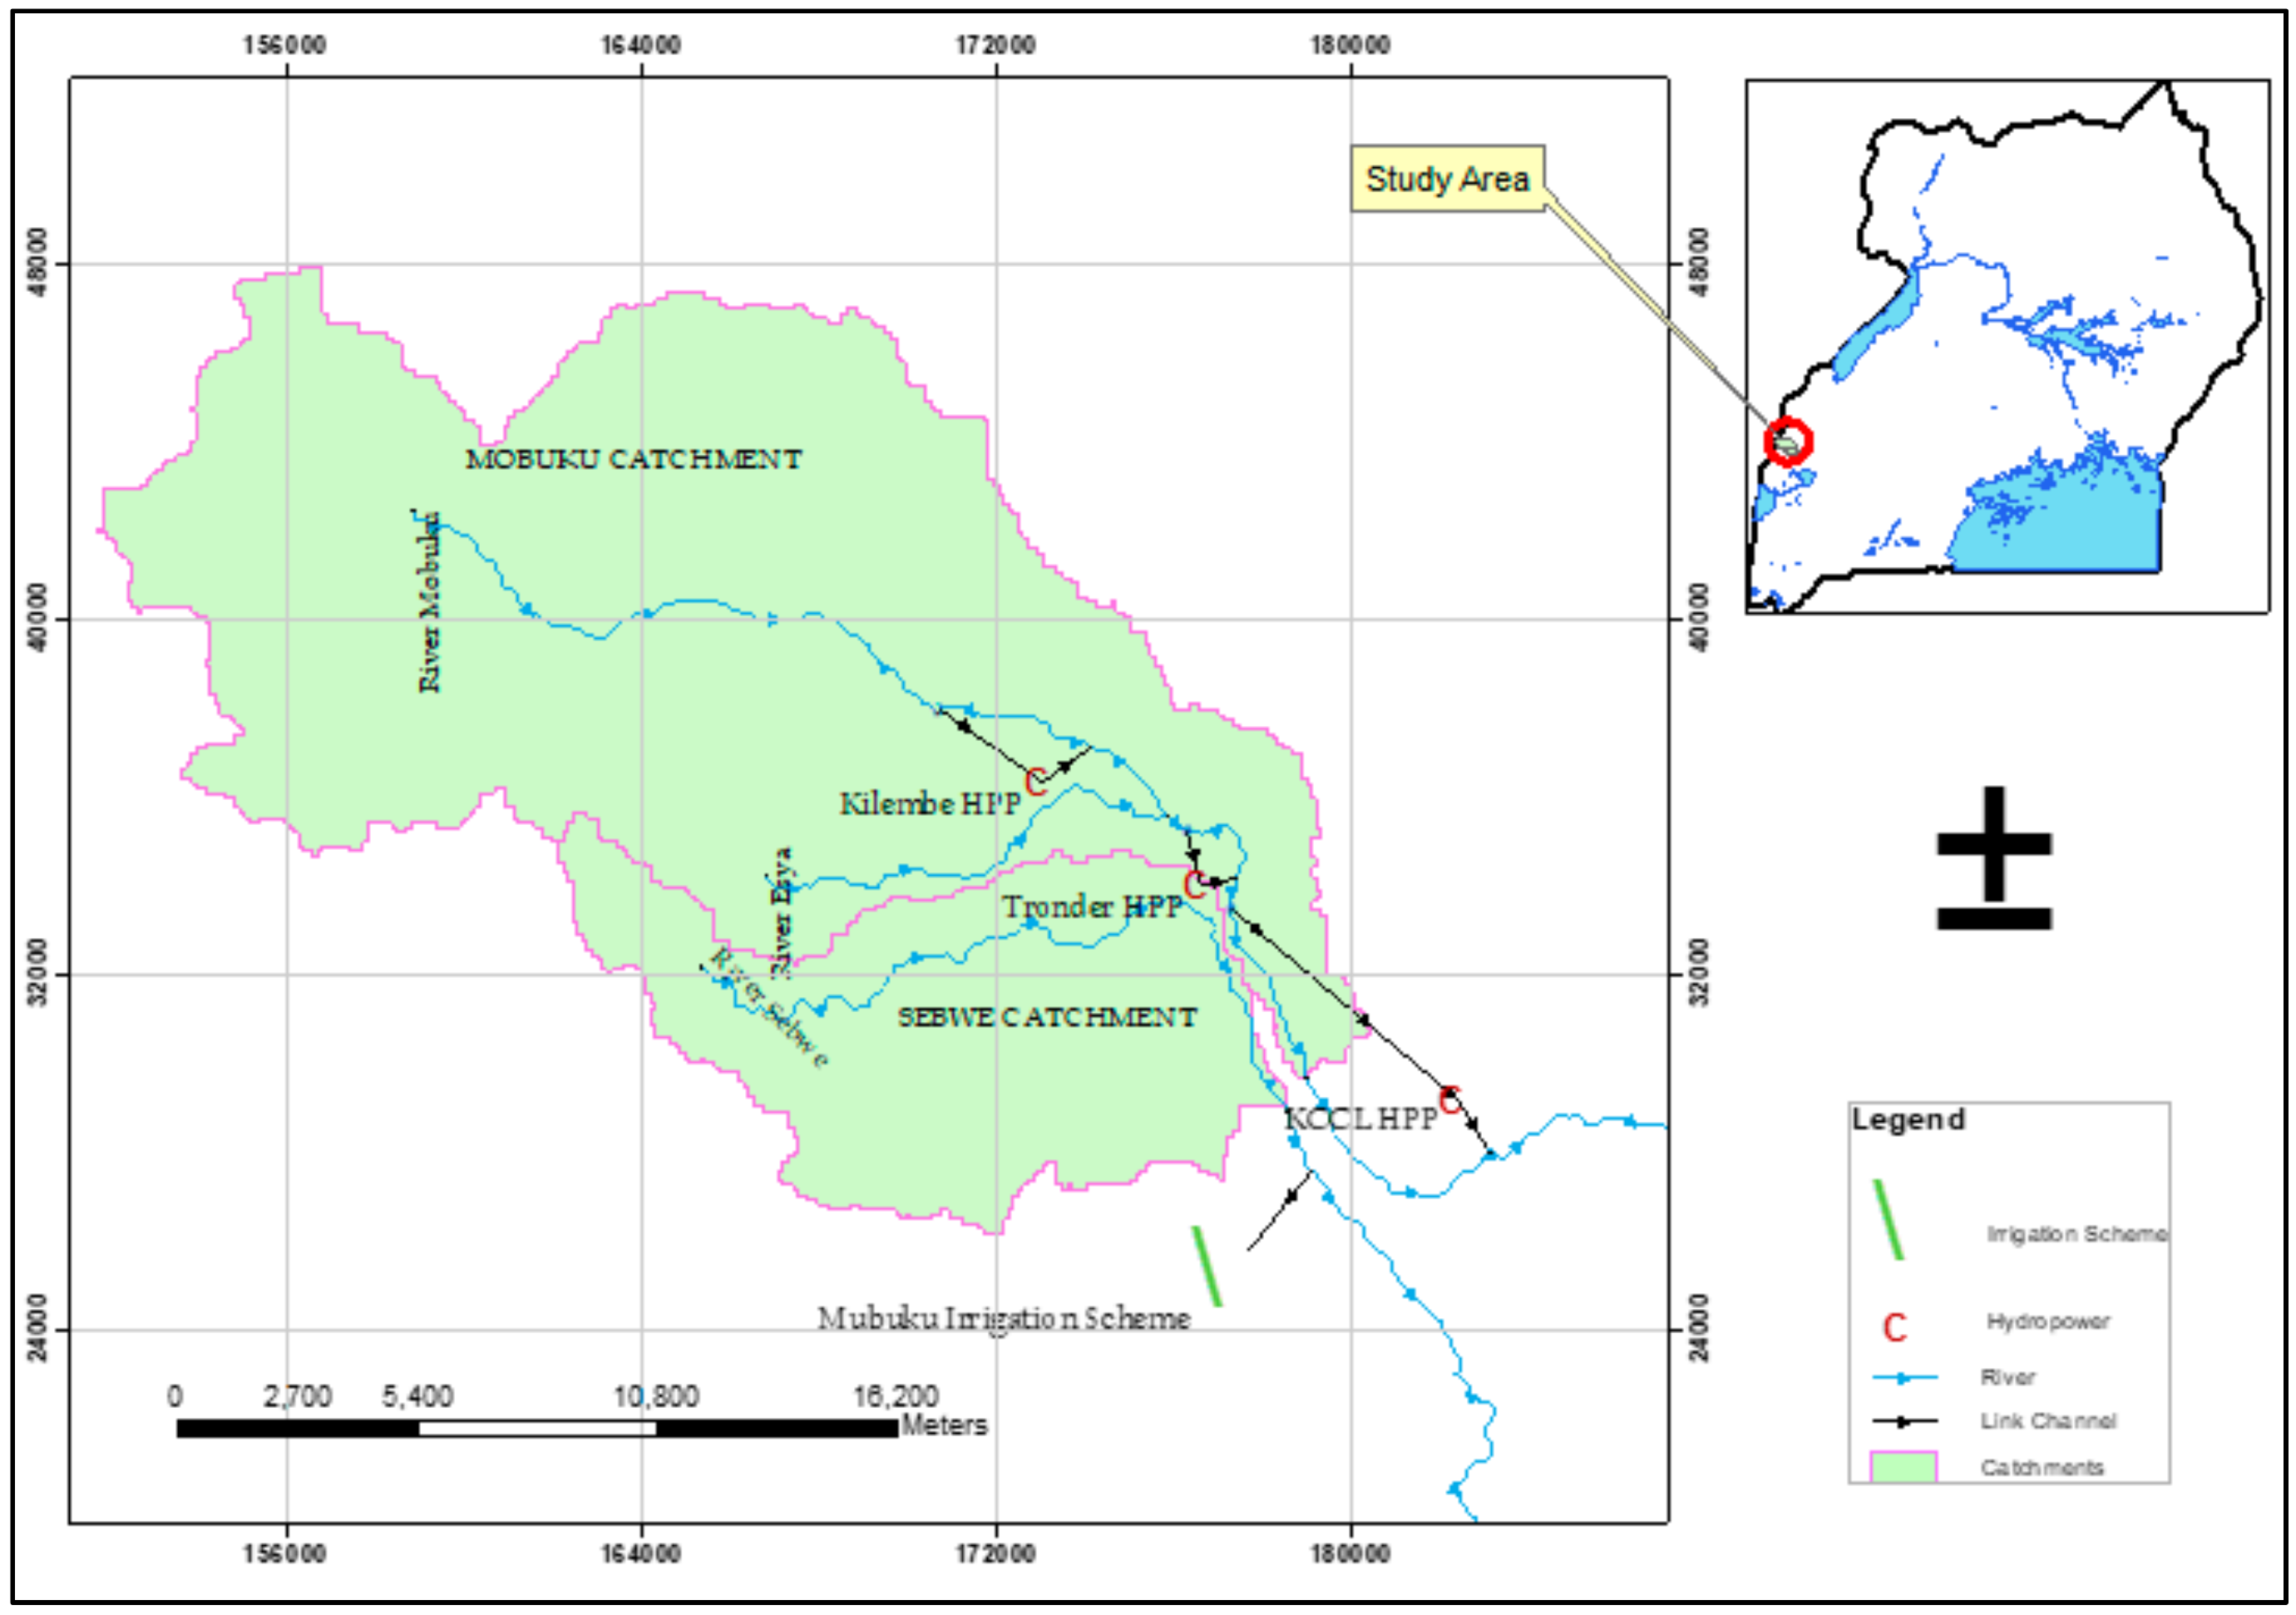
The approach was piloted in a selected small-scale irrigation scheme in Uganda (Figure 1). Mubuku, in Kasese District, was established as the settlement scheme under the governmental program in the 1980s [15]. Its main objective was the provision of agricultural facilities to absorb unemployed rural people, thus providing them decent livelihood. Since its establishment, the scheme experienced volatilities in its performance. However, Mubuku remains the only possibility of many households in the area to generate income and staple crop for household food consumption. Furthermore, the Government recently allocated public funds for the extension of the scheme. The scheme extension complies with the National Irrigation Policy, which envisages the improvement of household food security and commercial agriculture through irrigation development. Through the extended production area, more downstream household would benefit from the water sources. This requires more efficient water use in the current area though. At the same time, the scheme is undergoing a FAO conducted pilot project to enhance crop water productivity and to increase water use efficiency in small-scale irrigation scheme. Based on the project findings and the projected irrigation expansion, introduction of knowledge-based DSS was timely to support the elaboration of appropriate management strategies.
The scheme is located at an altitude of 900–1050 m.a.s.l. The latitude is less than 30 min north of Equator. The Sebwe River is the only water resource of the irrigation scheme. The river drains the eastern slopes of Rwenzori mountain chains and its catchment is part of the Lake George drainage system. The Sebwe catchment originates from the Kianamo area, with a surface area of 86.30 Km2. The catchment can be divided in two sub-areas: The upper part is characterized by mountainous terrain and dense vegetation, whilst the lower is dominated by flat lands of Rukoki and Kurusandara areas, North of Lake George, and Rwenzori National Park. Irrigation water is diverted from the River Sebwe and conveyed through gravity-fed canal system. Traditionally, irrigation practices are based on surface irrigation. The scheme has been phased in order to achieve a better coordination during its development. It has been divided among four different phases: Phase I (412 ha), Phase II (156 ha), Phase II B (78 ha), and Phase III (375 ha) [24]. The current study investigates Phase II with its production area of 156 ha shared by 167 farmers. Each farm was divided into four blocks, with an area of approximately eight acres each (almost 3.2 ha in total). Water discharge was distributed from the main canal to five secondary canals according to fixed schedule. From each secondary canal, water was subsequently diverted into several tertiary open earth canals. Every tertiary canal supplies water to two farmers (two holdings with a total area of 16 acres or around 6.40 ha), according to community-based schedule. Division 8, the micro-scope of the analysis, has six tertiary canals, each providing water for two farms with an area of approximately 6.4 ha. Twelve farmers were served by secondary canals. Each farm was divided into four blocks with an area of two Acres. Therefore, the total number of blocks served is 48, with an area of around 41 ha. The farmers produce in multi-cropping system with the following crops: Maize, rice, onions, beans, tomatoes, and mangoes.
2.2. Method
2.2.1. MASSCOTE Approach
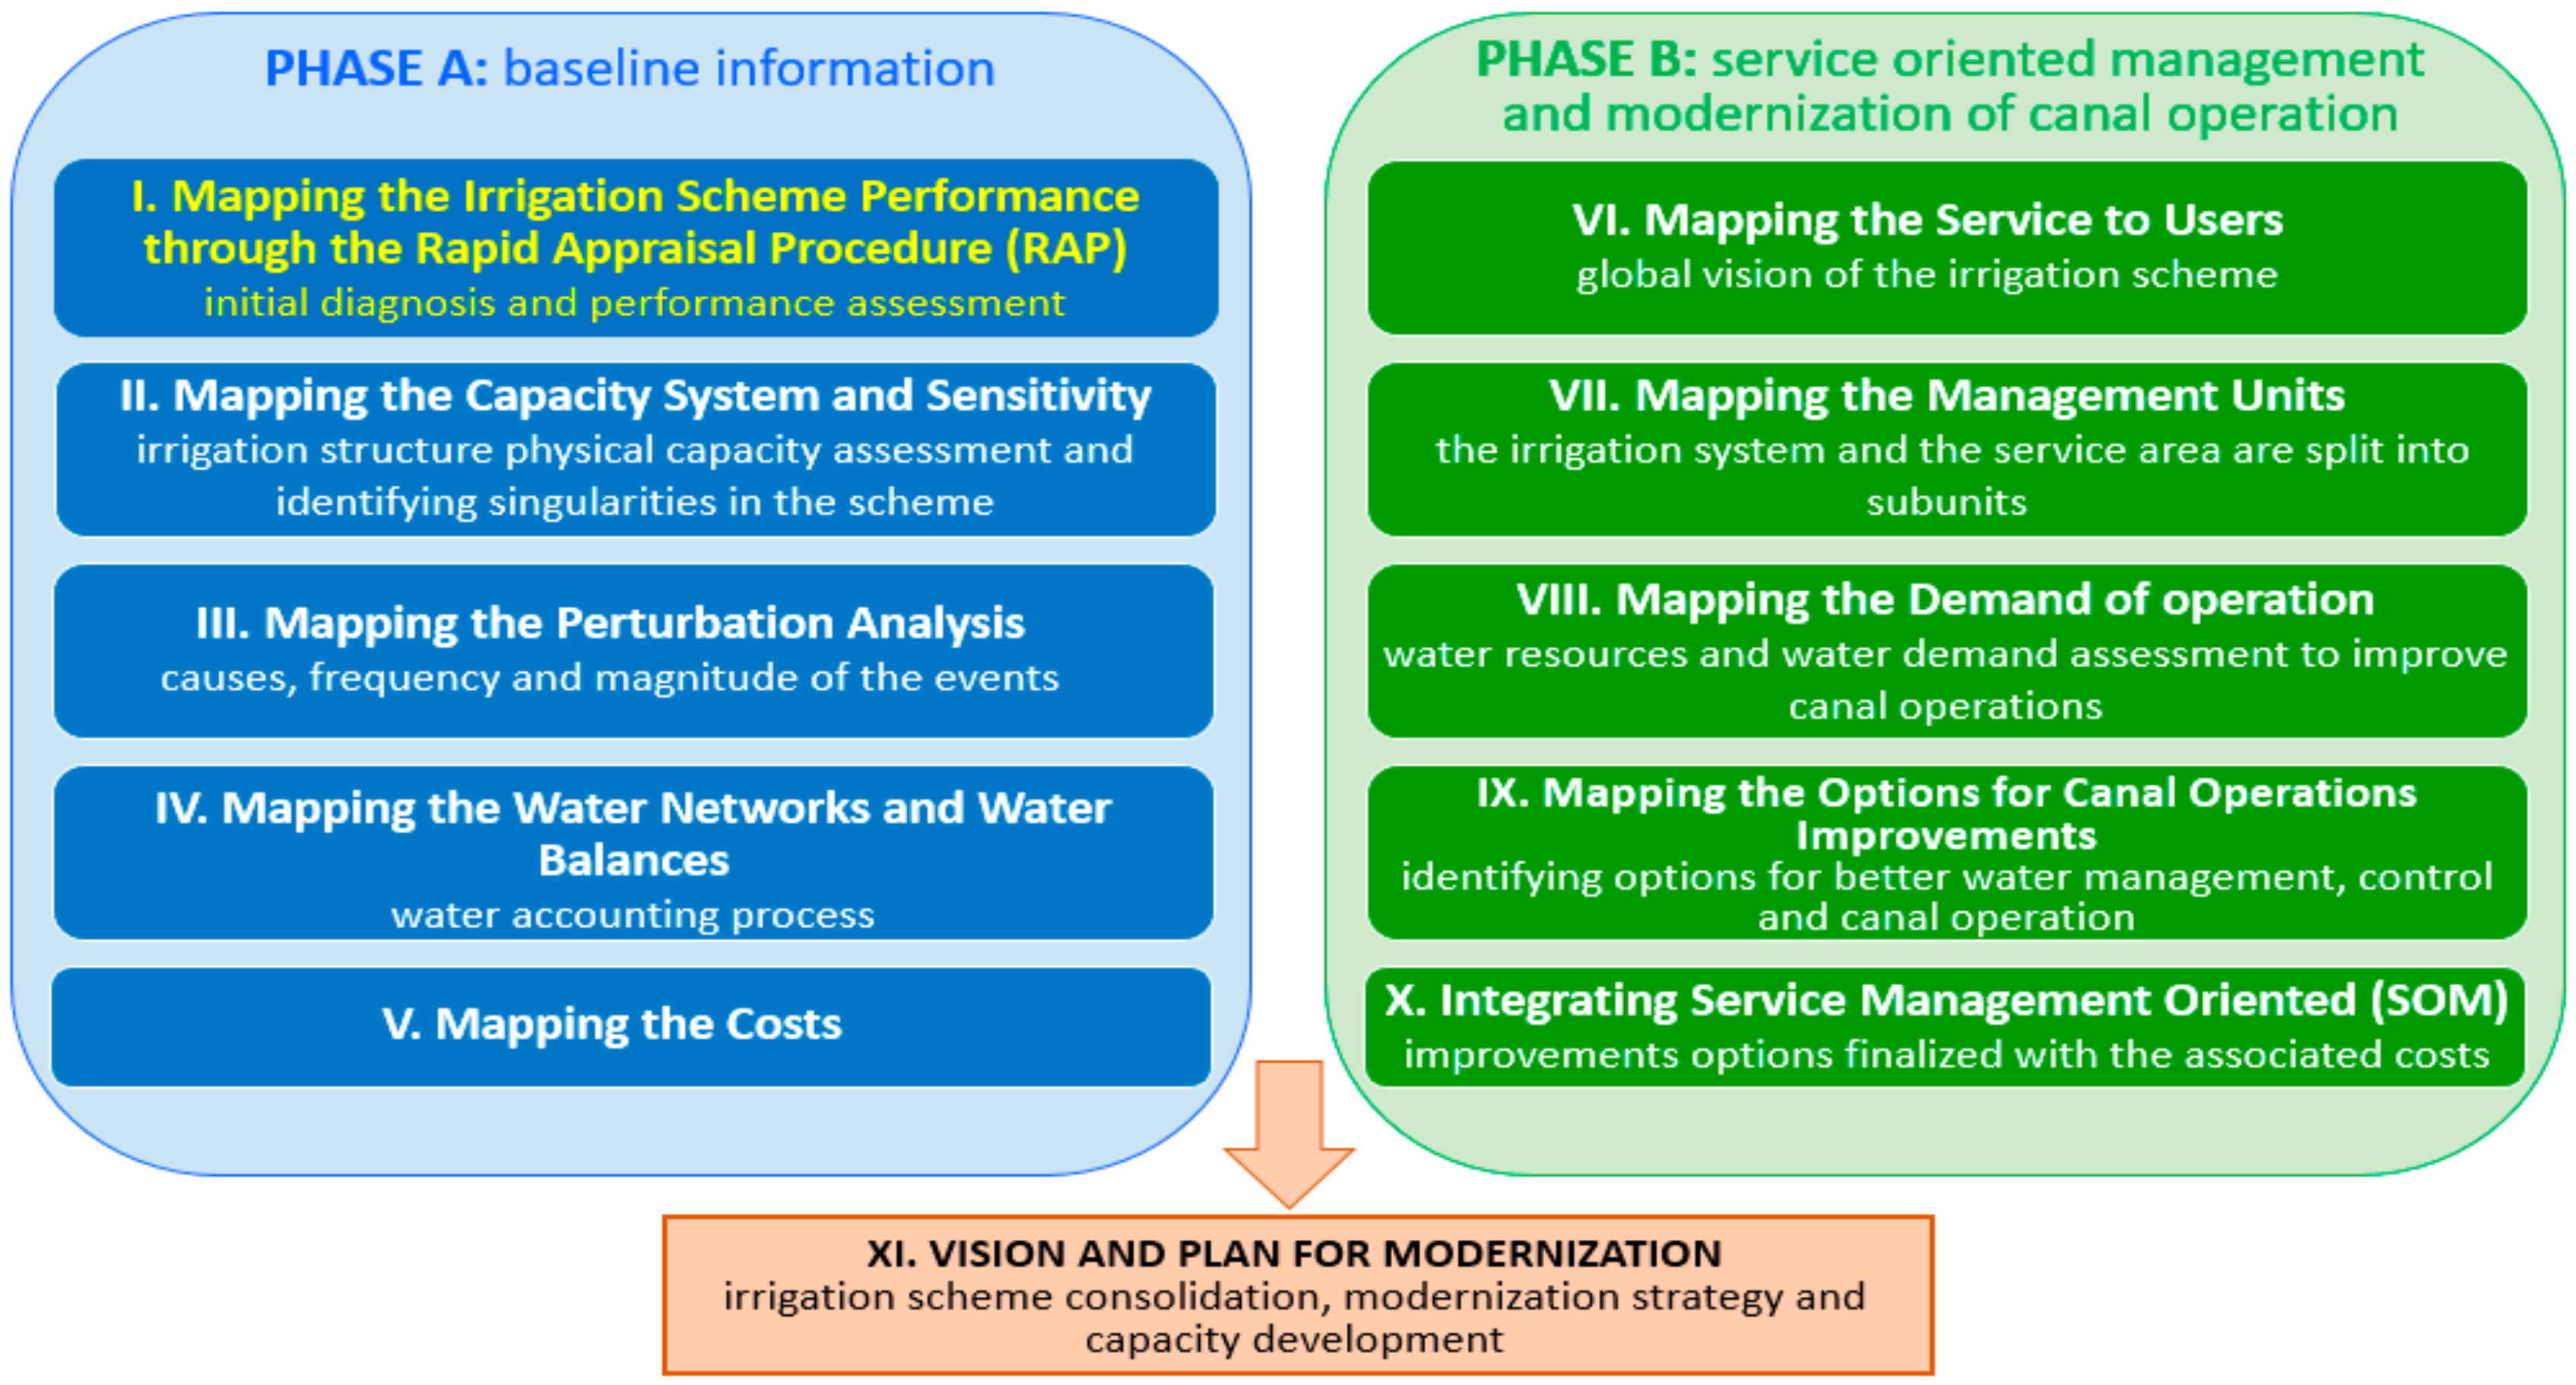
Water management and decision-making processes are necessary building blocks to sustainably manage and to provide an adequate balance on water supply and water demand [25]. In order to keep informed decision makers, assessment of baseline conditions is of paramount importance. The Mapping System and Services for Canal Operation Techniques was the methodology on which the knowledge-based DSS was focused. The MASSCOTE methodology (Figure 2) is a step-by-step framework to generate optimal strategies for irrigation management with the objective of facilitating a more effective water management and water delivery service [26]. The core of the MASSCOTE approach was the canal operation through two major steps: Diagnosis phases and development of modernization plan.
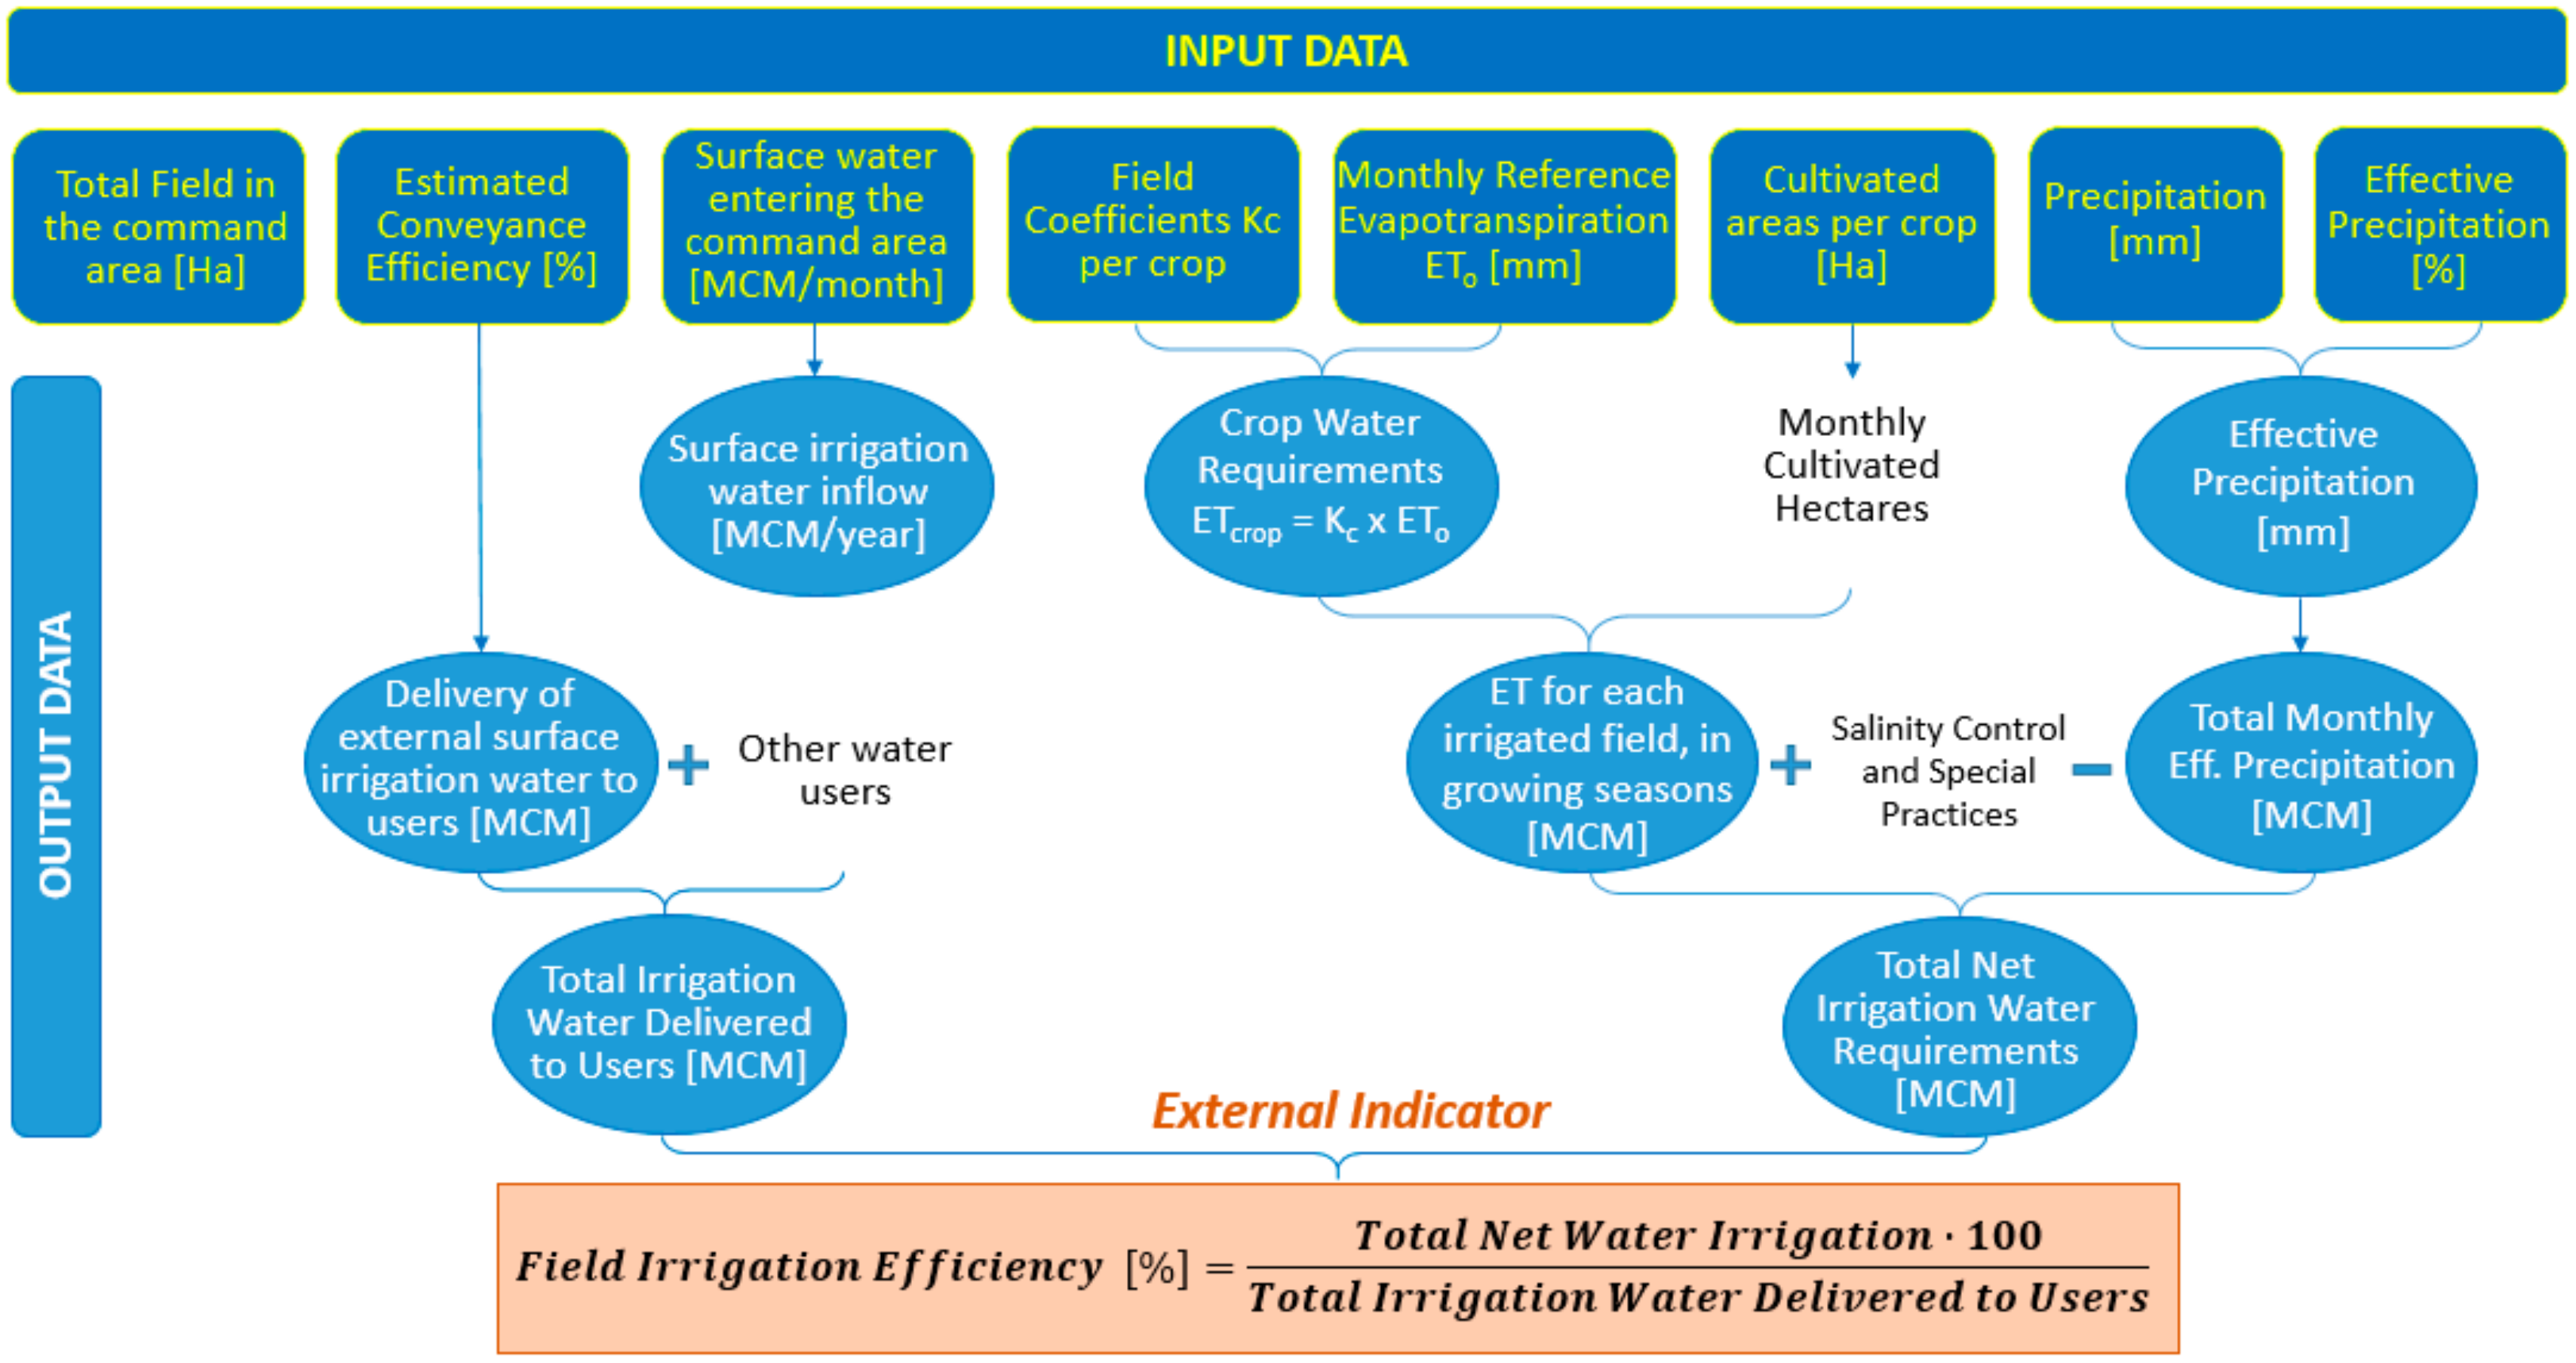
The DSS integrates the MIKEHydro Basin model in the MASSCOTE approach via the first step of Phase A. In the knowledge-based DSS, the rapid appraisal procedure (RAP) was combined with MIKEHydro Basin model. Currently, the diagnostic process of RAP is performed on spreadsheet basis to establish systematic assessment of the irrigation scheme performances at multi-management layers. The three principal objectives of the RAP are (i) the rapid evaluation of key performance indicators, (ii) knowledge acquisition for modernization strategies, and (iii) the baseline assessment in sequential manner, against which progress can be measured. External and internal indicators provide a comprehensive overview about efficiency of water use, management, and received water services. Internal indicators provide a detailed perspective of the existing operational conditions of the scheme and the water delivery service. External indicators are necessary to assess the possibility of conserving water and improving water management in line with agricultural conditions and practices. When considering irrigation scheme management and design, the main purpose is to guarantee an efficient use of water, as well as the optimum crop production. For over four decades, performance indicators, usually called efficiencies, have been applied according to the objective of the assessments [27]. In the current context, field irrigation efficiency was considered as the principal indicator of water use efficiency. By applying a water balance calculation, it incorporates the effective precipitation and water supply against ET-based crop water requirements (Figure 3).
The field irrigation efficiency indicator (IE) was calculated by the following formula:
whereas total net water irrigation was calculated from crop water requirement including evapotranspiration at field level and special irrigation practices, and total irrigation water delivered to users presented the difference of water supply and water losses through conveyance
2.2.2. Decision-Support System
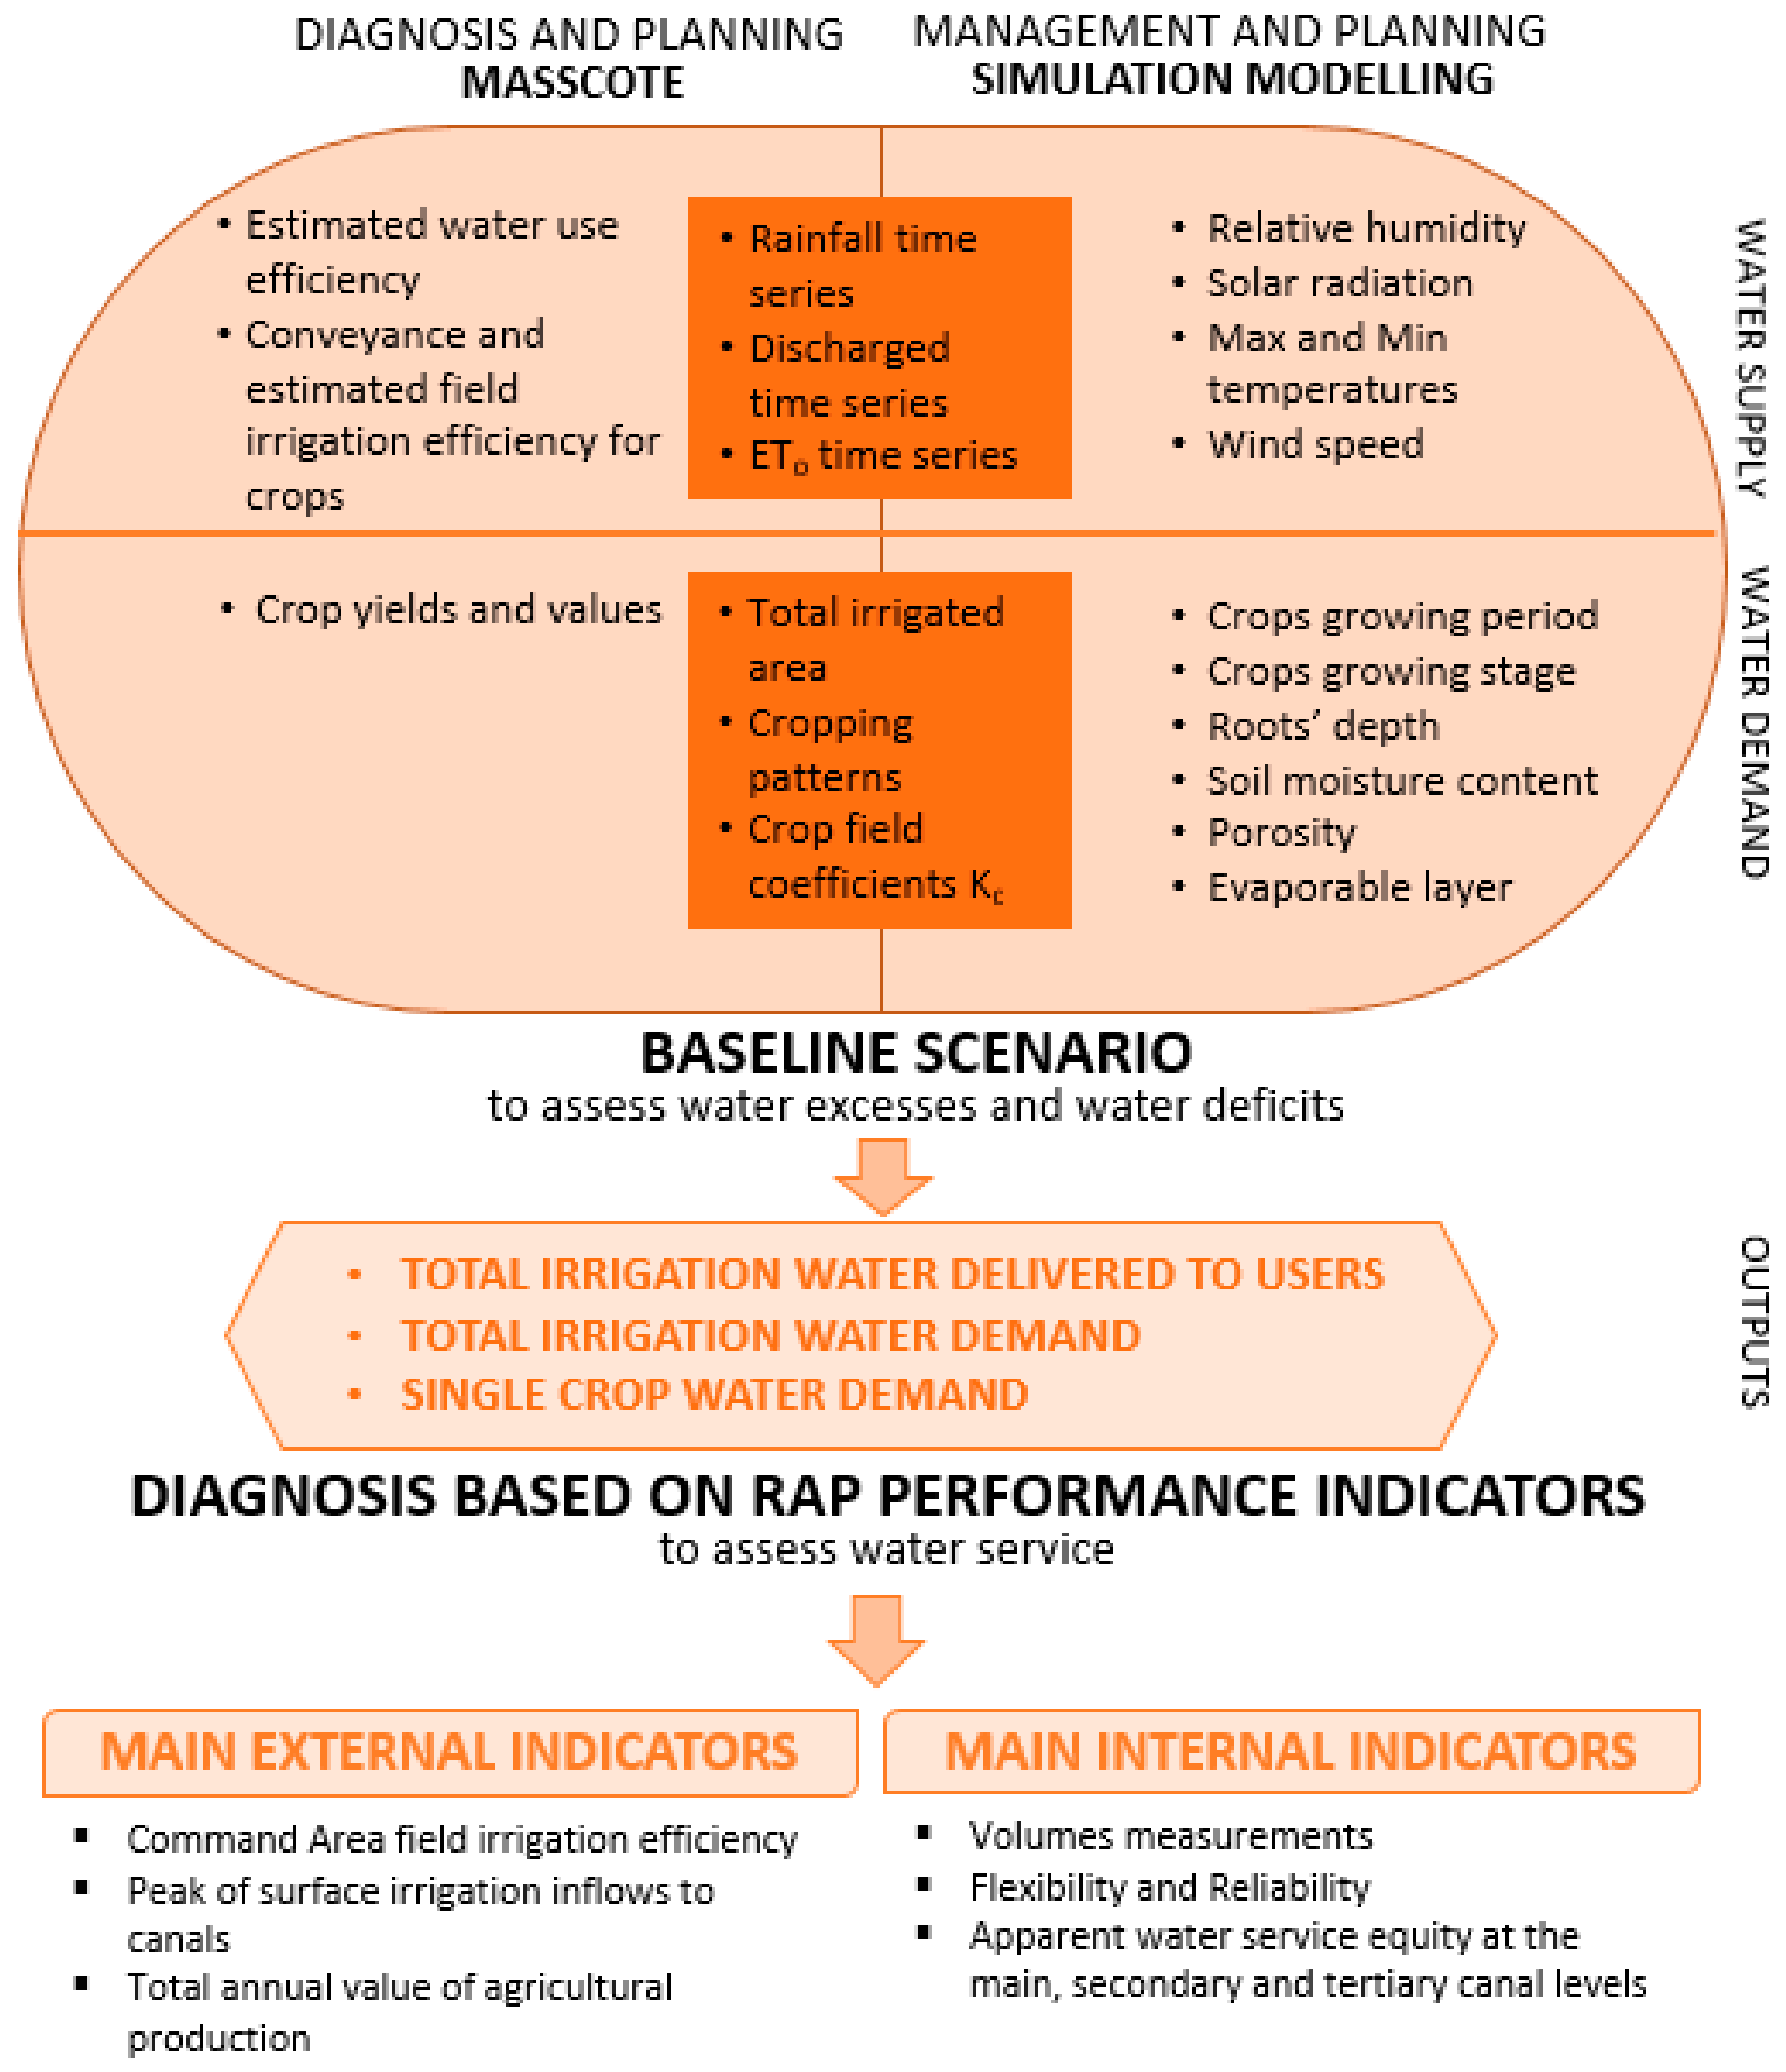
Recent approaches such as the development of a DSS are scaled to irrigated agriculture with different conditions. Improving the allocation, planning, and management of water resources and irrigation schemes are the main concerns of DSS models applied at farm level. Irrigation DSS is used to address decision-making problems regarding how to equally and promptly support optimal water allocation in accordance to the irrigation schemes [28]. The MIKEHydro Basin is a map-based decision support tool, a comprehensive deterministic, and multipurpose model used for a large variety of applications. It includes modular structures with model features required for efficient and accurate water resources modelling (Figure 4). It is the ideal tool to solve water allocation and water shortage problems, to evaluate and assess water supply and crop water requirements. Simulations scale of application may range from large river basins to smaller local projects [29].
The model is applied to compute crop water requirements (CWR or ETcrop), specific irrigation scheduling (number, quantity, time, and interval of irrigation), and cropped lands in the pilot area. Finally, combining the MikeHydro model with the RAP external indicators helps to define which long-term actions should be adopted, and which steps should be taken to assess overall performance. While the RAP was applied for the performance and service levels of the irrigation schemes, the model was implemented for establishing strategies for land and water management [26].
2.2.3. The Combined Approach
The implementation of a DSS was an important step to improve the performance of the investigated schemes [30]. The diagnosis of an irrigation scheme with open earth canals and the way it operates provides evidence of the existing management organization and the service to users. Modelling the current operation rules is critical to improve the service. The first step consists in mapping the whole scheme. Consequently, all the subunits were investigated from the spatial and institutional point of view. The model is applied to evaluate the optimal allocation of water resources in the scheme—while enhancing water use efficiency and water productivity level—to achieve socioeconomic development in the country.
Phase II, in particular Division 8 is set under scope in the study to simulate the shortfalls of the current management and to line-up improvement strategies. MIKEHydro Basin model implementation began with the calibration process inbuilt in the model itself. For the purpose intended, data collections and preparations were required for accurate simulations and results analysis. Firstly, Phase II Baseline Scenario is simulated to estimate the baseline field irrigation efficiency through a water balance approach, based on the RAP. The baseline scenario was constructed to assess the current conditions. Potential alternative scenarios are selected according to the objectives of the Mukubu Scheme [31], then simulated through the model implementation (Figure 5). In order to respond to the identified shortcomings related to efficiency, the first scenario attempted to overcome the general imbalance between water supply and demand. Focusing on Mubuku Irrigation Scheme Division 8, the flexible water service alternative scenario was simulated for water use efficiency optimization. Flexible water service follows a water balancing approach for better water distribution to improve the indicator of efficiency at farm level. Moreover, flexibility is increased in terms of irrigation time freedom and the recovering of any malfunctioning. It was assumed that better water distribution satisfies the water requirements of any crop [30]. Moving from the single division (i.e., Div. 8), the service can be expanded to the entire Phase II. The simulation consisted of the evaluation of water excesses and water deficits to compute the amount of total water demand (ETcrop). Crop water requirements produced by the model represent the current irrigation water used per crop in relation to the cultivated area [32]. As soon as, supply and demand of water are provided by the model, the proper discharge quantity to be delivered to every cropped division is easily predicted. By fixing the maximum admissible threshold, expressed in terms of relative error between water supply and water demand, the optimal amount of irrigation water could then be set according to the threshold level. As a settlement scheme, development strategies must take the socio-economic objectives of Mubuku in account. Two additional scenarios related to food security and market conditions are proposed for this reason. Similarly to flexible water services, the two scenarios apply water balance approach. Nevertheless, instead of limiting the simulation to efficiency objectives, the scenarios set focus on socio-economic objectives. Both scenarios proposed monocropping in order to satisfy the market demand. Only maize was implemented towards a market stability perspective. The scenario is driven by socio-economic surveying, which investigates the profitability of subsidized maize production against other crops. The low market risk of maize is due to the governmental maize program, which provides the trigger price for farmers. In the food security scenario, only rice is implemented. Rice is gaining substantial role in household food security due to changing market preferences. However, the gap between national rice production and consumption is still growing [33]. The Government of Uganda considers rice as one of country’s strategic sectors, as it possesses a great potential in contributing to the increase in rural incomes and livelihoods, improving food, and nutrition security [34]. Under these conditions, policy decision makers would be interested in examining a number of scenarios rather than investigating a single optimal solution.
2.3. Data
2.3.1. Hydrological and Climate Data: Model Calibration
The implementation of the MIKEHydro Basin model required the following data: Hydro-meteorological time series (rainfalls, evapotranspiration, and the main observed discharge time series), crop properties (crop growing period, initial, development, middle and late growing stages, crop coefficients kc, crop root depth, and the vegetation maximum height), and soil characterization properties (soil moisture content, in terms of initial water content, field capacity and the wilting point, soil porosity, and evaporable layer depth). The MIKEHydro Basin model for Sebwe catchment was manually calibrated. The Nedbor-Afstromnings Model (NAM) is a deterministic, conceptual rainfall-runoff, and lumped model, which means that the catchment is analyzed as a single unit with average values of parameters [35]. Owing to the lack of continuous discharge measurements of the Sebwe river, the NAM was adopted for the calibration process. Climate and hydrological data required by the NAM model are the following: river discharge measurements [m3/s], rainfall time series [mm], minimum and maximum temperatures [°C], relative humidity [percentage], wind speed [m/s], and solar radiation [MJ/m2/day]. The FAO-56 Penman-Monteith Method [36] was applied to compute the reference evapotranspiration (ETo), which constitutes the independent variable to calculate the ETcrop. As climate data affects plant growth, each crop requires a different level of climate data, as mentioned here above [37]. Since the existing rainfall stations within the study area provided rainfall time series which are not representative enough, data was obtained from Kasese Meteorological Station. Daily rainfall time series and climate data, implemented in the model, cover a period of 64 years, from 1952 to 2016. The local research institute, the Ugandan National Agricultural Research Organization (NARO), provides the range of the available river Sebwe discharge covering a 12 years period, from January 1956 to August 1968. It was observed that this period referred to both rainfall observations and river discharge, therefore it was suitable for the calibration of the model. However, only a five year time-range was taken into account for the calibration of the model, from 1956 to 1961, since the discharge records from 1961 to 1968 would have not fitted the calibration period. Before the calibration of the model, discharge time series were treated by eliminating outliers. The discharge data was acquired through regular gauge reading from weirs and validated by large scale particle image velocimetry techniques. The measurements were performed in parallel with each other to reach the highest accuracy. The calibration of the model was based on several parameters (Table 1).
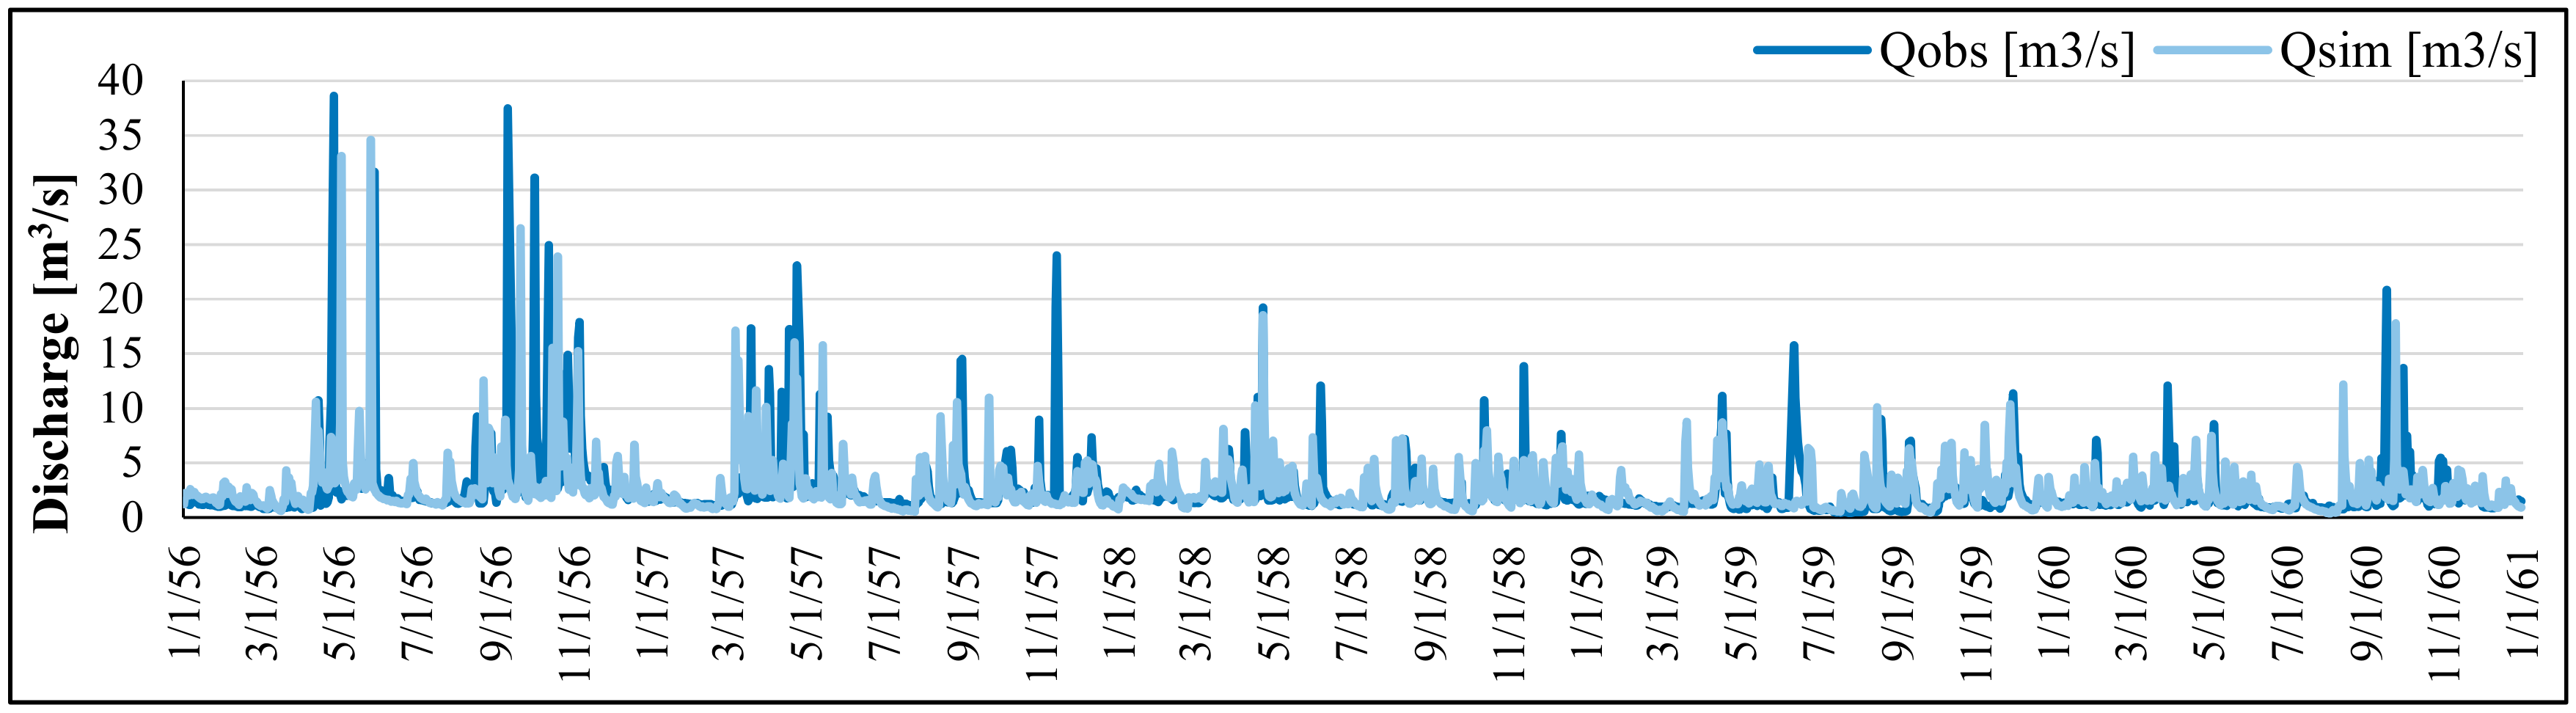
The hydrograph of the observed discharge (Qobs) and the simulated daily values (Qsim), for the calibration period proved that the model was able to predict the flow on a rainfall time series (Figure 6).
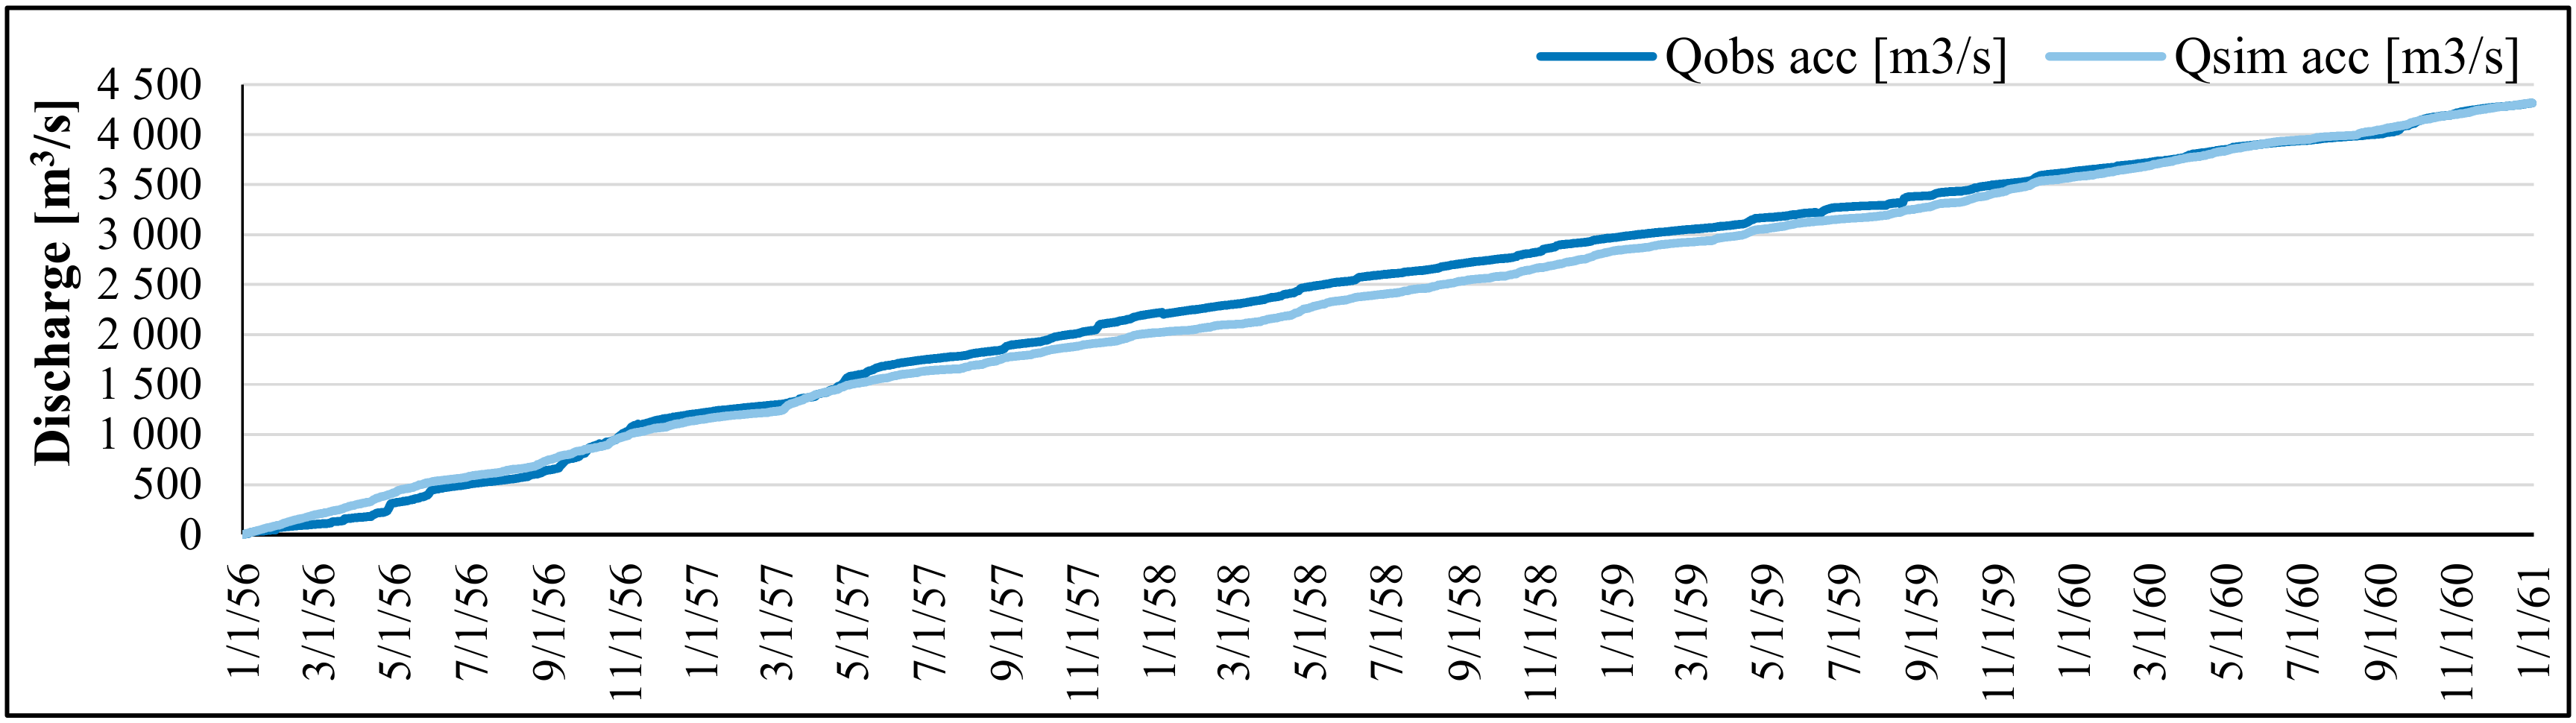
Consequently, the observed (Qobs, acc) and the simulated accumulated discharge daily values (Qsim, acc), over the calibration time-period showed a good estimation of the water balance (Figure 7).
A difference of 2 mm/year was assessed. It can be concluded that the calibration of the model was rather accurate. The model adequately reproduced the patterns of observed discharges and their magnitudes, although simulated flow was underestimated. The underestimation occurred in view of the absence of groundwater content in the model. Therefore, the amount of water supply provided to the irrigation scheme only comprised surface water entering the area.
2.3.2. Model Validation and Gap-Filled
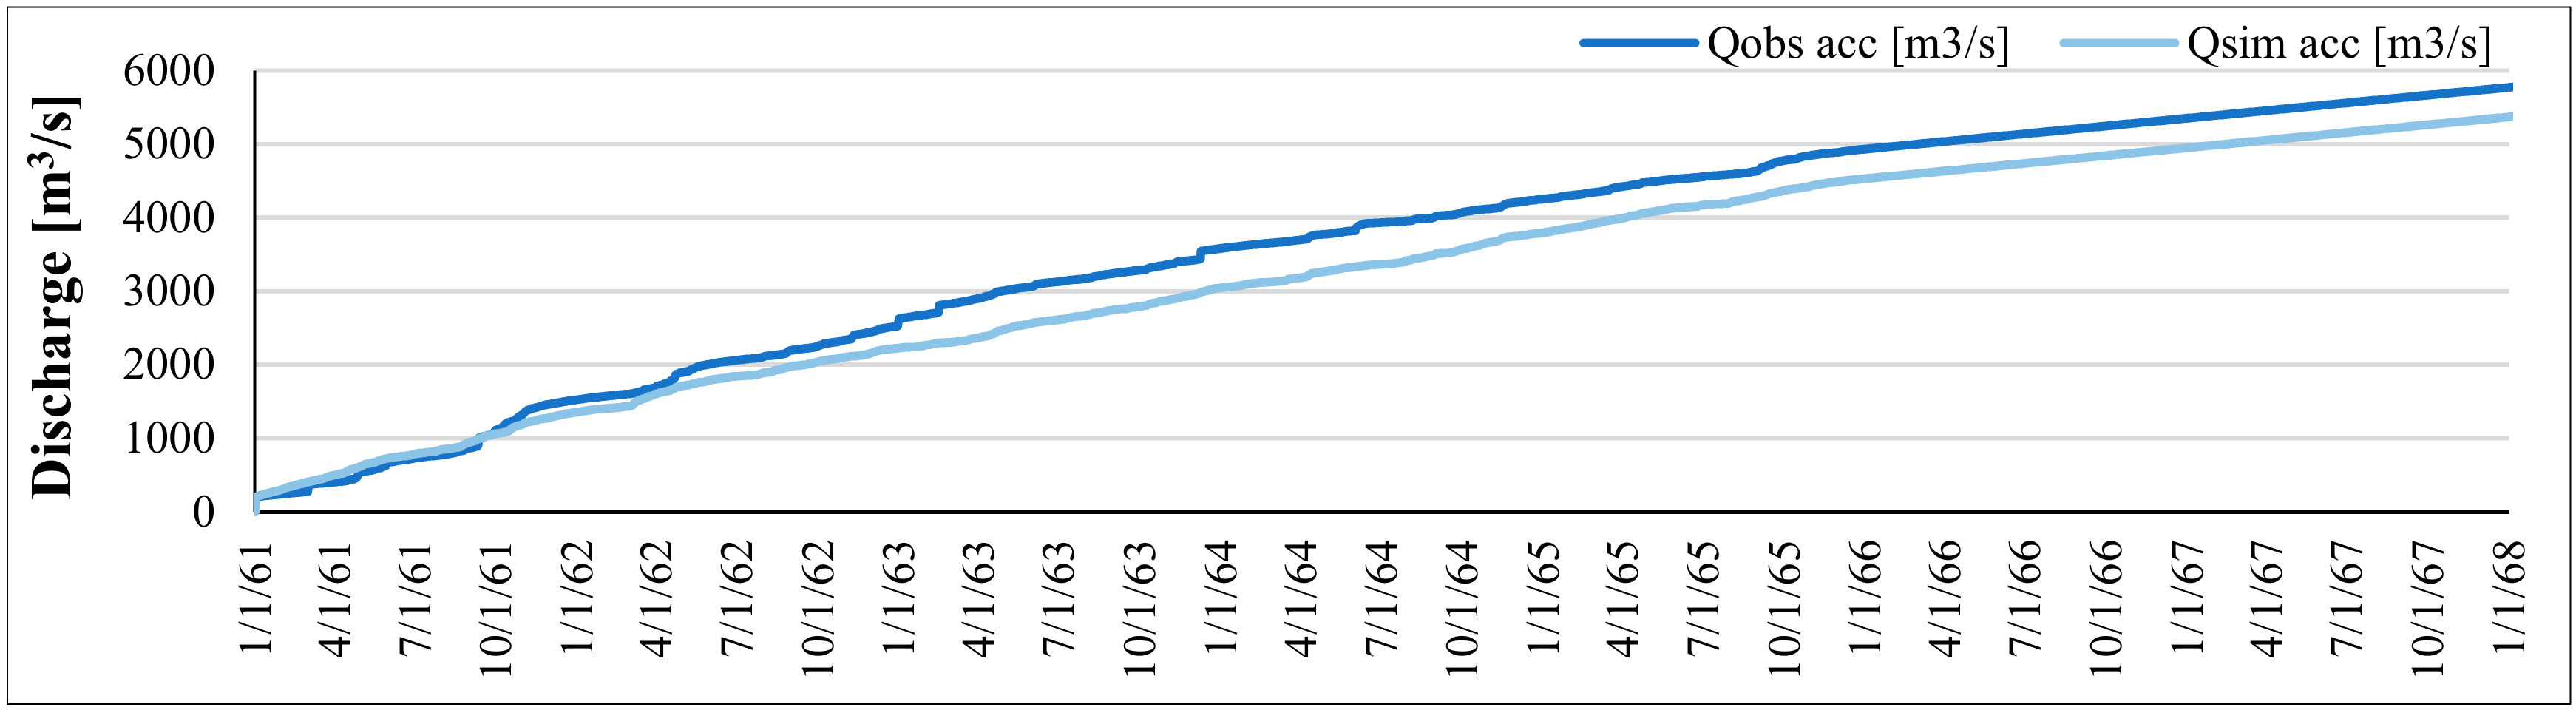
The preliminary analysis of the discharge data proved low peaks within the period from 1961 to 1968, which are significantly far from the local climate conditions. In order to obtain a good fit during the validation period, several attempts of re-calibrating the model have been made. The model was, however, run on a daily time step using the parameter values for the calibration period. Moreover, the water balance for the validation period proved that the amount of water in the river was higher than the observed, as previously shown in the graph in Figure 8.
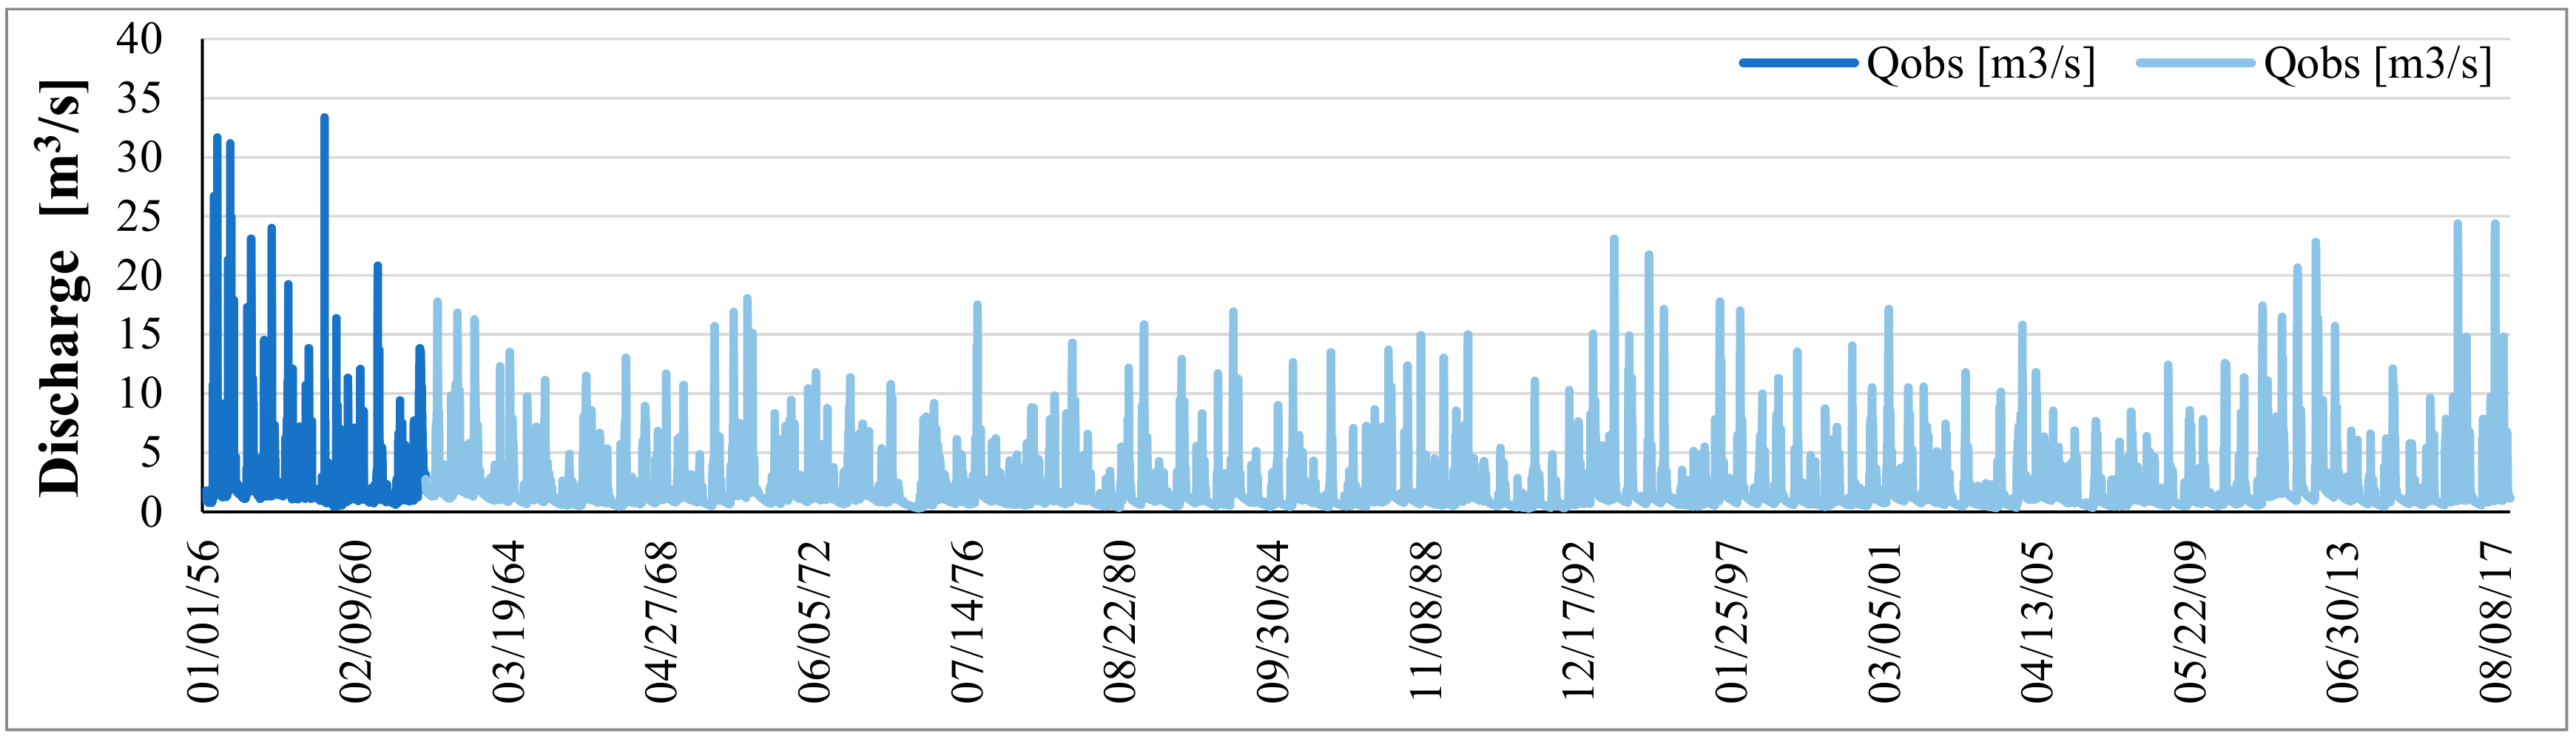
After the calibration of rainfall–runoff model, the gap filled rainfall dataset was used to simulate the discharge for a period up to December 2017. Since the reference evapotranspiration dataset was ending with December 2008, the long term daily average values were computed and forecasted until December 2017 (Figure 9).
The extended record provided an evidence of decent discharge values and verified by the discharge measurement explained previously. A comparison between the amount of water demand and water supply was performed, in order to suitably evaluate and monitor water excesses and deficits [38]. Monthly discharge values are expressed in millions cubic meters per month, [MCM/month]. The amount of water supply on a yearly basis is 4.26 MCM/year (Table 2).
2.3.3. Irrigation Data
In 2017, FAO-led surveying was conducted in the command area of the irrigation scheme in order to collect agricultural data. FAO 56 Model Dual Crop Coefficient is the internationally accepted model inbuilt in the MIKEHydro Basin. Crop water requirements can be defined as the amount of water needed to meet water loss through evapotranspiration of a disease-free crop, growing under non restricting soil water and fertility, and achieving full production potential under given environmental conditions [39]. The model was implemented using more updated data compared to standardized ones. Data were provided for each growing season (Table 3), for the irrigation scheme Phase II. The following parameters are included in the model: Number of sowing days for each crop, root depth (RD), maximum vegetation height (MH) and crop coefficient (Kc), as well as the various lengths of crops at initial growing stage (INI), development stage (DEV), middle stage (MID), and late season (LAT).
Through the FAO-56 Penman-Monteith method reference evapotranspiration (ETo) was computed on the meteorological data basis [36]. Consequently, through the relationship provided by the following equation here below, crop water requirements were computed within MIKEHydro Basin. ETcrop was calculated by the following equation, which was influenced by the determination of crop factors [29].
2.3.4. Soil Properties
Measurements of soil characterization, conducted in the second half of 2017, provided values properties by soil layers: The first two layers of approximately 15 cm each and two deeper layers of almost 30 cm thickness each. Soil tests resulted in textural classification for each crop: Sandy loam/loam for maize, sandy clay loam/clay loam for rice, and sandy clay loam/clay loam for onions. The FAO 56 Soil Water Model was adopted in the MIKEHydro Basin. The model kept track of the soil moisture content in two soil compartments: The top soil layer from which only soil evaporation is drawn and the root zone layer. Average results were adjusted as adopted quantities in the model (Table 4).
In the model, the irrigation starts when the soil moisture content reaches the specified fraction on readily available water (RAW). This parameter is defined as the fraction of the total available water (TAW), which represents the water content that a crop can extract from the root zone without suffering any water stress. The p parameter represents the average fraction of TAW that can be depleted from the root zone before moisture stress occurs [39]:
There were no restrictions regarding changes in terms of single or multiple cropping patterns, if compared to the methodology utilized in the research. The change in cropping patterns affects the command area management, as well as the optimum water resources allocation. The selection of the ideal cropping pattern is strongly dependent on a number of elements: Soil conditions, temperatures, and rainfall distributions, as well as economic factors such as the price structure of different crops [40].
2.4. Data Sources
Numerous variables were adjusted in the model, in terms of cropping patterns, climate data, irrigation time schedule, and soil properties, so that the scenarios can be investigated from different point of view. Manual input data and adjustments allows for sufficient flexibility to address the issue of heterogeneity in small-scale irrigation scheme. In particular, the approach was investigated with reference to a single division of the Mubuku Irrigation Scheme. In the model, the soil attributes (such as the field capacity, the wilting point and the porosity) were distributed on the entire investigated area taking into account the average value of the single soil layer. If considered the DSS applied to a large-scale irrigation scheme, located within the same region (assuming the same average soil properties, soil properties average values, inbuilt in the MIKEHydro Basin model as input data), the results obtained would provide consistent evidence.
The model implemented for the purpose intended requires a significant amount of input data (both provided by the meteorological stations and data directly acquired in the field). Therefore, the limitation of the model was strictly dependent on the quality of input data measurement, particularly the rainfall data, relative humidity, solar radiation, wind speed, temperature, discharge measurements, crop data, and soil properties. Conversely, the approach applied to the irrigation scheme offers the possibility to have a comprehensive overview of the performance assessment of a gravity irrigation system.
Moreover, the approach gives the opportunity to monitor the water balance approach, the optimal water resources allocation, assessing the water deficits/excesses. Furthermore, the approach makes an assessment of the performance of an irrigation scheme, via the monitoring of the major irrigators of a gravity irrigation canal system, starting from the small-scale and systematically proceeding to the large-scale investigations.
3. Results
3.1. Baseline Scenario
Farmers typically produce in multiple cropping system. Phase II covers an area of about 156 ha cropped with maize, rice, onions, beans, mangoes, and tomatoes. Based on the sowing and harvesting dates of each crop, the whole year is divided into two growing seasons. The table below (Table 5) provides the sowing day/month, cropped area [ha], and the amount of crop water requirements, expressed both in cubic meters [m3] and in cubic meters per Hectare [m3/ha] for the first crop growing season.
The same quantities are provided in the table below (Table 6), relative to the second growing season. Mangoes are irrigated all year round, hence have not been included in the CWR table below.
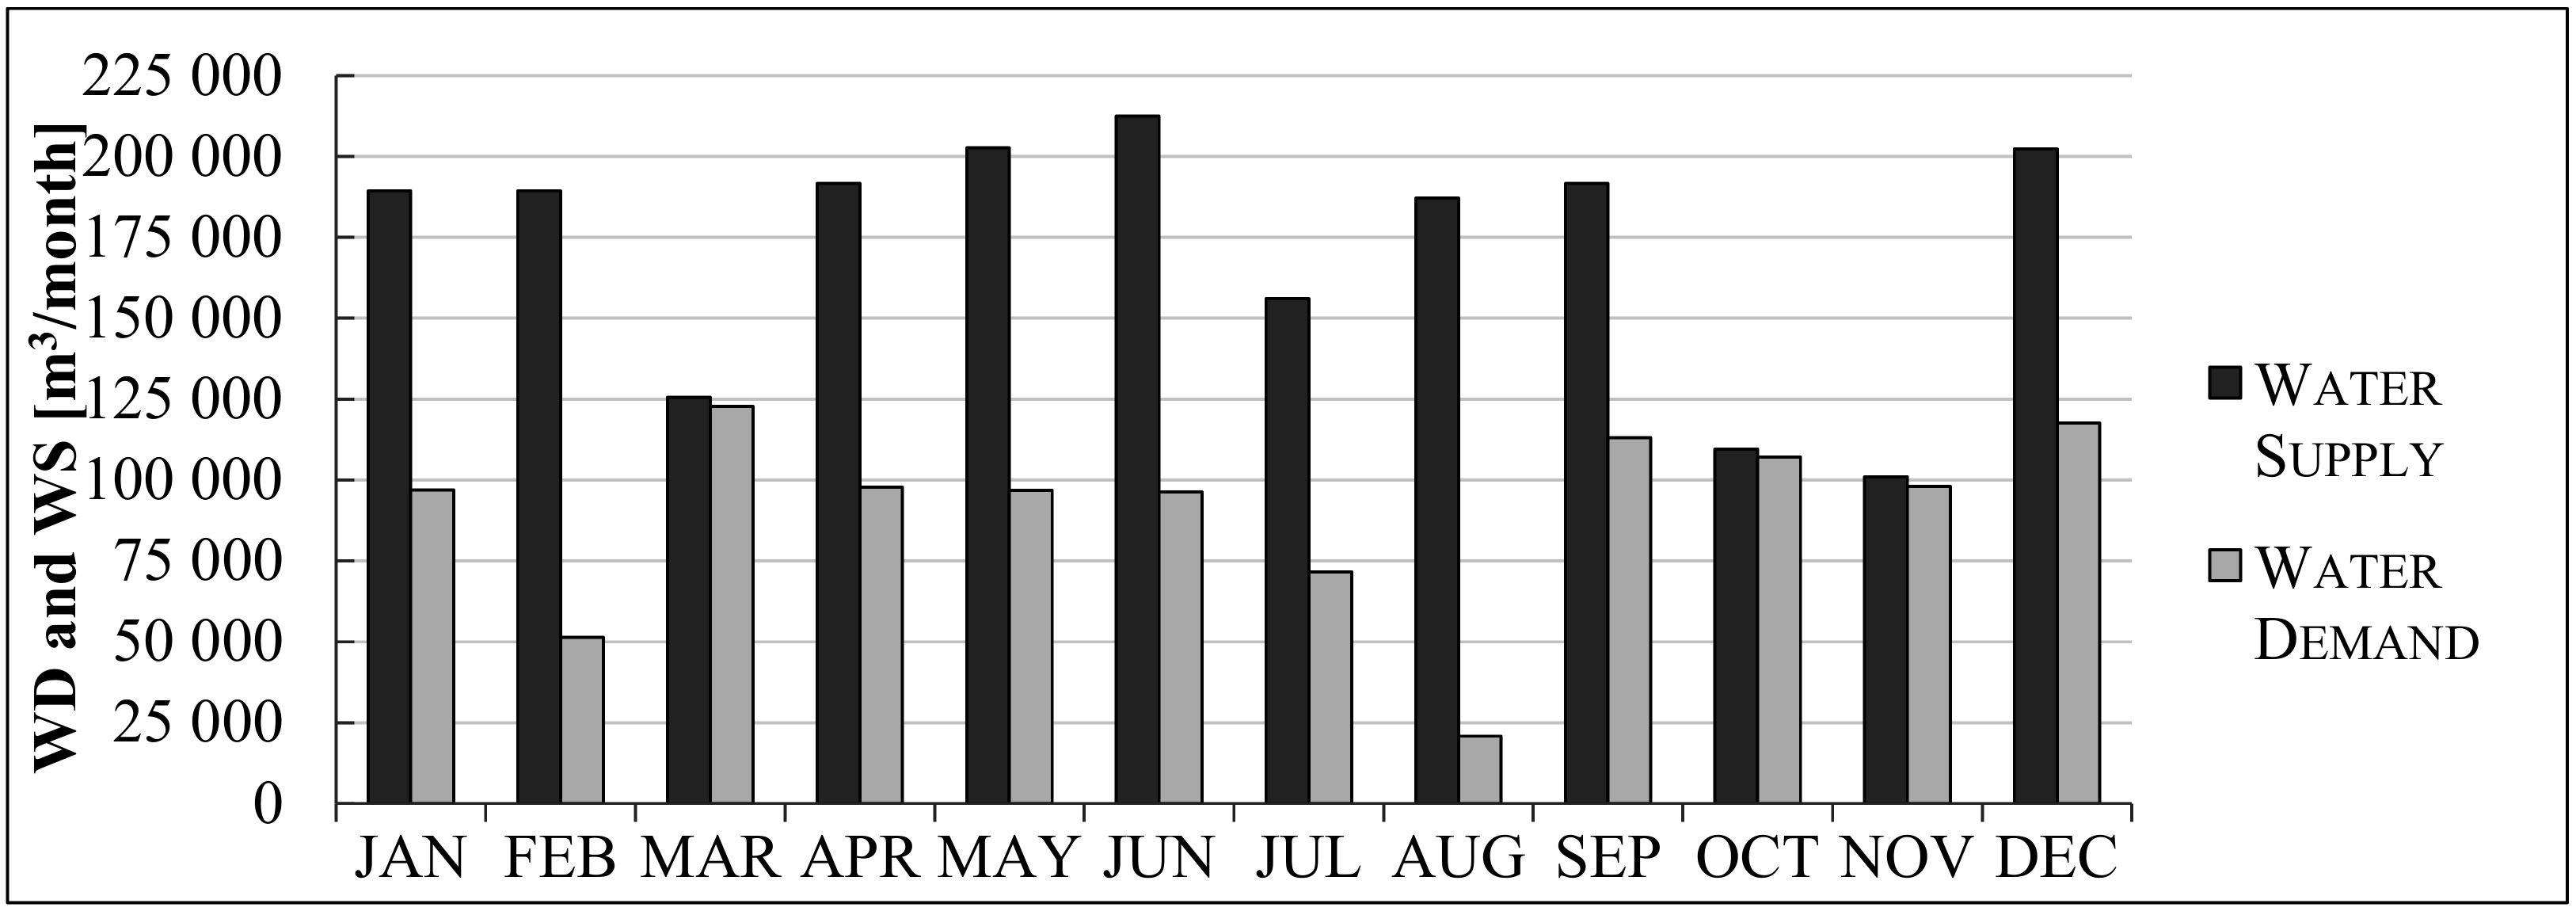
A comparison between the total amount of water demand (WD) and the total amount of water supply (WS) was made and plotted in the graph below (Figure 10). The application of the DSS revealed that there was no water shortage throughout the year while considering the existing cropping pattern and water allocation. Moreover, results proved that water over-supply occurs throughout the year. However, a minimal difference between water supply and water demand discharge exists in the months of March, October, and November, in particular. Large water excesses can be observed in the months of February and August, which represent the months immediately before the start of the two growing seasons. Water oversupply is measured as 73 percent and 89 percent, respectively. The range period between April and July revealed an average water excess of 50 percent. Lastly, in September, December, and January, water supply exceeded water demand by approximately 40 percent. Two water demand peak periods can be observed in the graph below: The first from March to June, associated to the first growing season, and the second from September to December, regarding the second growing season.
The application of the MIKEHydro Basin model enabled the user to conduct a water balance analysis, assessing water excess and water deficits, to optimize the allocation of water resources in a sustainable manner. Irrigation water supply is considered the main factor from the point of view of irrigation system assessment. Hence, the irrigation system’s water supply performance can be assessed, and field irrigation efficiency can be estimated [41]. An approach based on water balance was thus followed. RAP was applied and combined with the MIKEHydro Basin model integrated in the knowledge-based DSS in order to evaluate the baseline efficiency indicator. The field irrigation efficiency was estimated at 14.76 percent due to the demonstrated imbalance between supply and demand. Such a low value indicates that the current water service is not sufficiently flexible, water distribution is not efficient, and the water productivity level is not reached. Consequently, it is necessary to increase the value. While holding criteria of improving efficiency in evidence, the simulation was repeated with the described scenarios: Flexible water service, market stability, and food security. While the flexible water service scenario assumes the optimal allocation of water supply, market stability, and food security scenarios are based on the current irrigation schedule and adjusted cropping pattern. Water balance analysis through DSS helps to understand how the objectives of scenarios affect the irrigation performance.
3.2. Flexible Water Service Scenario
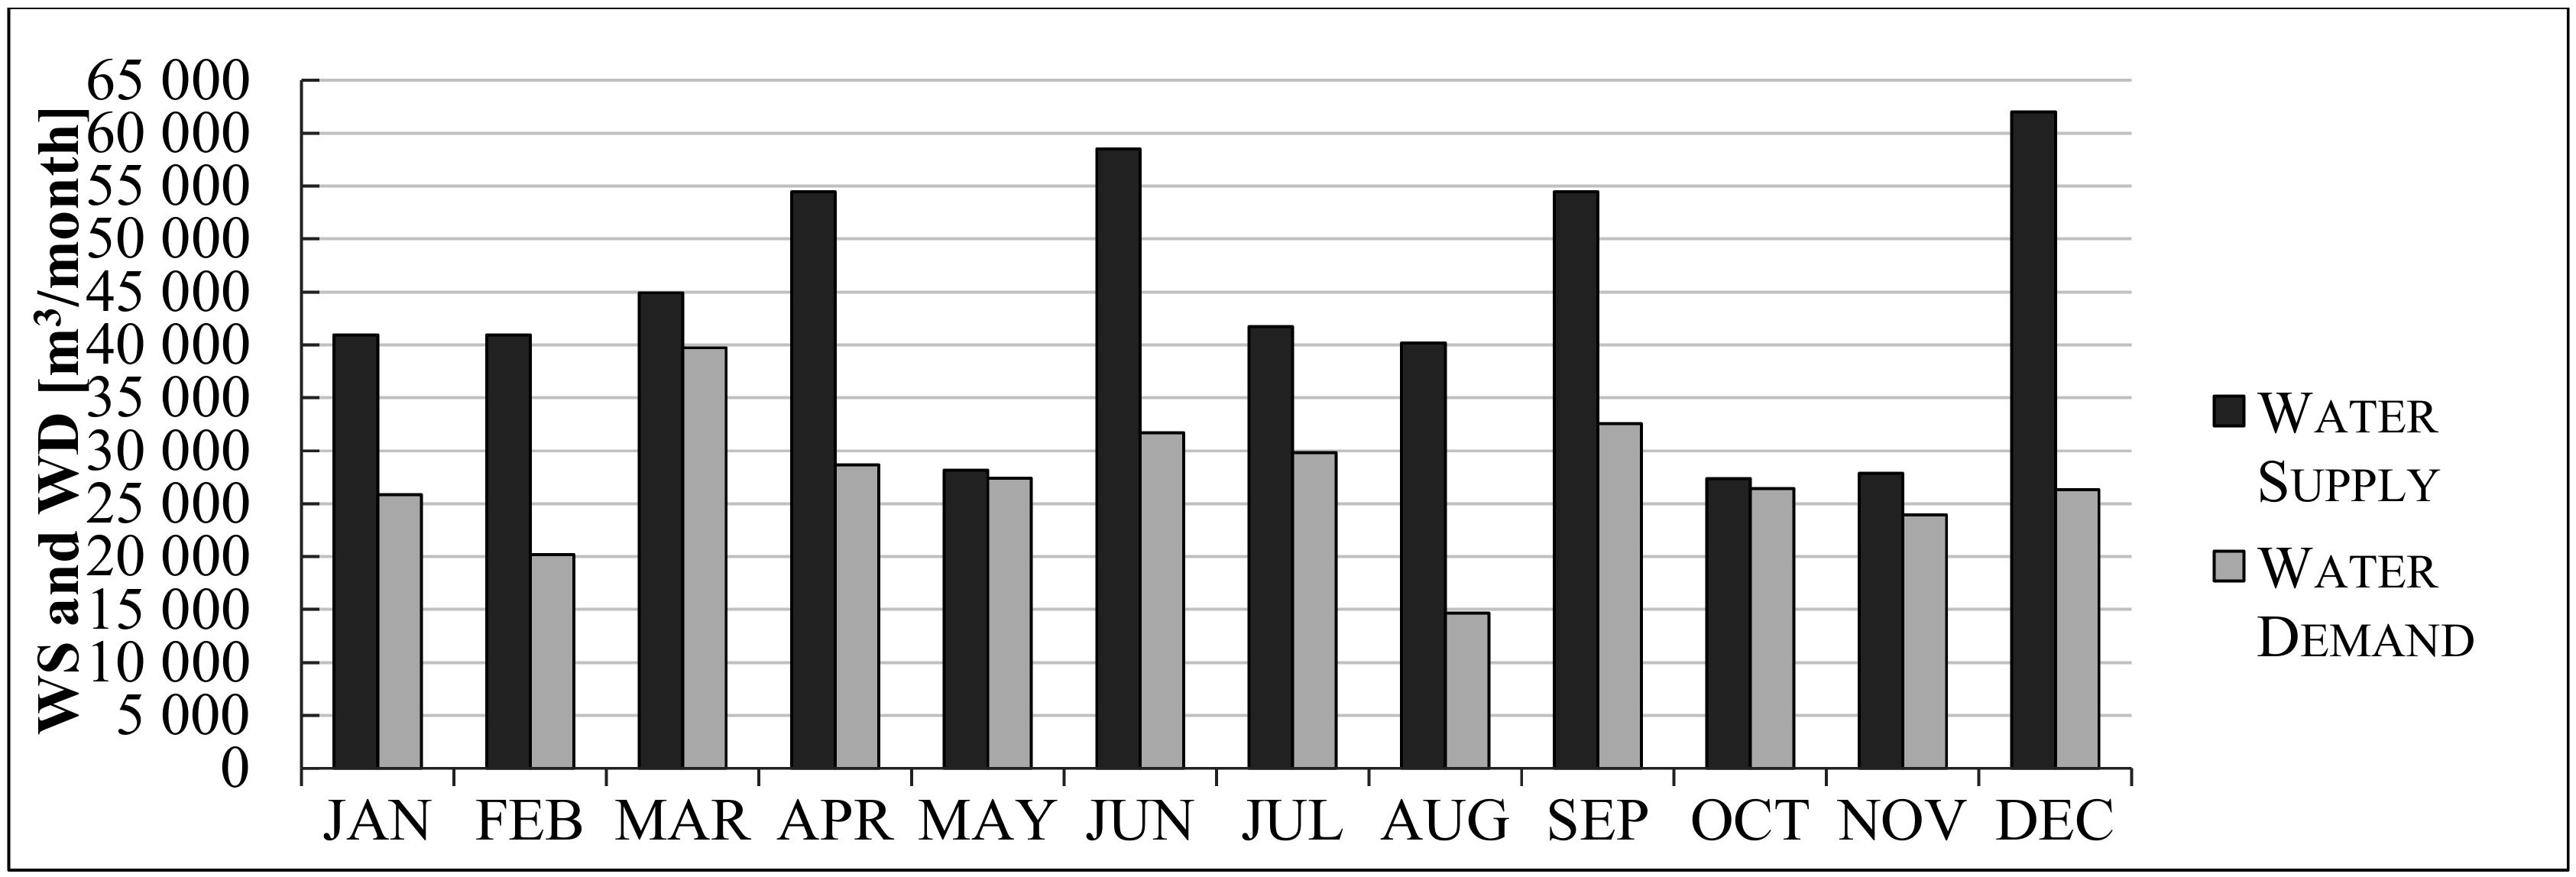
The flexible water service scenario has its objective of improving field irrigation efficiency with better scheduling and distribution rules. The pilot area is further limited to Division 8 to better understand the field-level effect of improved water allocation. Division 8 was investigated as the pilot area with the existing multiple cropping pattern (maize, rice, onions, and mangoes) covering 41 ha. Disadvantages in the current water service were attributed to the lack of flexibility, efficiency, and inadequate distribution of water service among farmers. The current discharge is excessive, reaching 86 L/s in only 4 h of irrigation per tertiary canal. Low water productivity, at farm level, is the final result. Flexibility is provided by reducing the discharge value from 43 L/s to an average value of 26.50 L/s in each holdings. The results of RAP analysis at field level recommends significantly lower discharge demand at around 30 L/s in a schedule of less extended duration and more frequent irrigation turn (Table 7 and Table 8).
In order to improve the indicator of efficiency, the irrigation time is increased from 4 h per irrigation to 6 h. In order to increase flexibility, the irrigation time is decreased from 24 h per day to 18 h. In order to obtain flexible water service through the MIKEHydro Basin, a water balance approach was applied (Figure 11).
The amount of water supply equals 0.40 MCM/year (it previously totaled 1.34 MCM/year). Hence, the value obtained for the field irrigation efficiency indicator is at 51.43 percent, a significantly higher value than the previous one. On this basis, rescheduling existing water service based on crop water demand enhances the Mubuku Irrigation Scheme efficiency level. Moreover, water supply excess and deficit can be easily quantified by utilizing data under a DSS. In order to reach the ideal water service, a maximum allowable threshold can be computed as the relative error between the amount of water supply and water demand. Subsequently, verification is carried out via the application of the MIKEHydro Basin combined with the RAP tool.
3.3. Market Stability Scenario
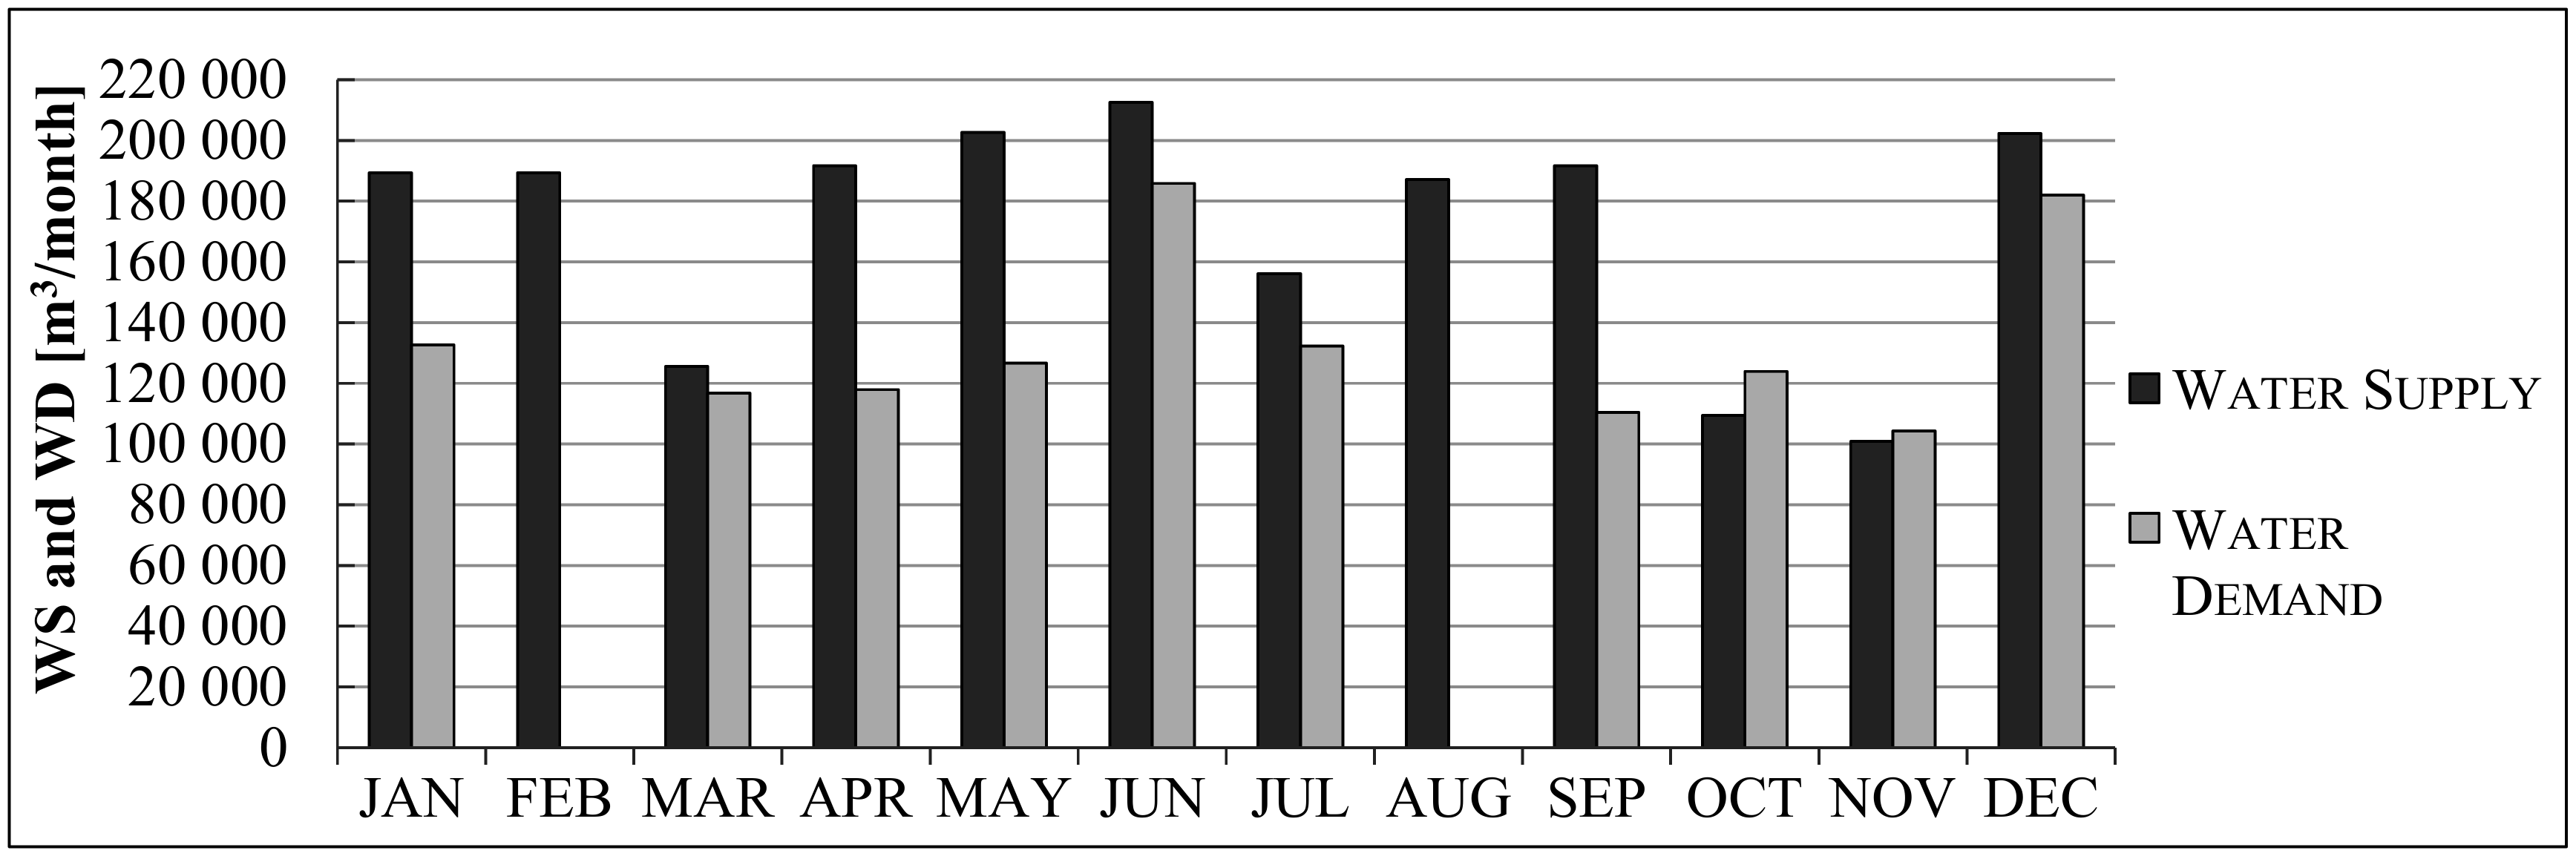
Uganda is a net exporter of maize, which is produced as ‘cash crop’ by smallholder farmers, ranking among the top three crops cultivated in the country in terms of area planted and production volume. Results obtained from primary farmers’ economic data collection revealed the stability of maize prices, with the absence of low-high market range fluctuation. While other crops can reach up to 1400 percent price increase, maize prices are stable with no low-high market range. For this reason, market stability conditions could be driven by only cropping maize. A single cropping pattern, with maize only, is thus considered the suitable scenario towards market stability. In order to obtain the analysis, maize-related data was used to hypothesize potential future scenarios and furthermore to compute the water balance through the implementation of the DSS. Current multi-cropping system was adjusted to a single crop while considering the current water allocation rules. Results show a water deficit of 13 percent in the month of October and three percent in November (Figure 12).
The amount of water supply does not match the water requirements for maize. Throughout the year, water oversupply exceeds 30 percent on average. In this respect, the cropped area cannot be optimized with a single cropping pattern and water should be better allocated. On the contrary, the baseline scenario simulation, which entails a multiple cropping pattern, revealed that the water balance is satisfied.
3.4. Food Security Scenario
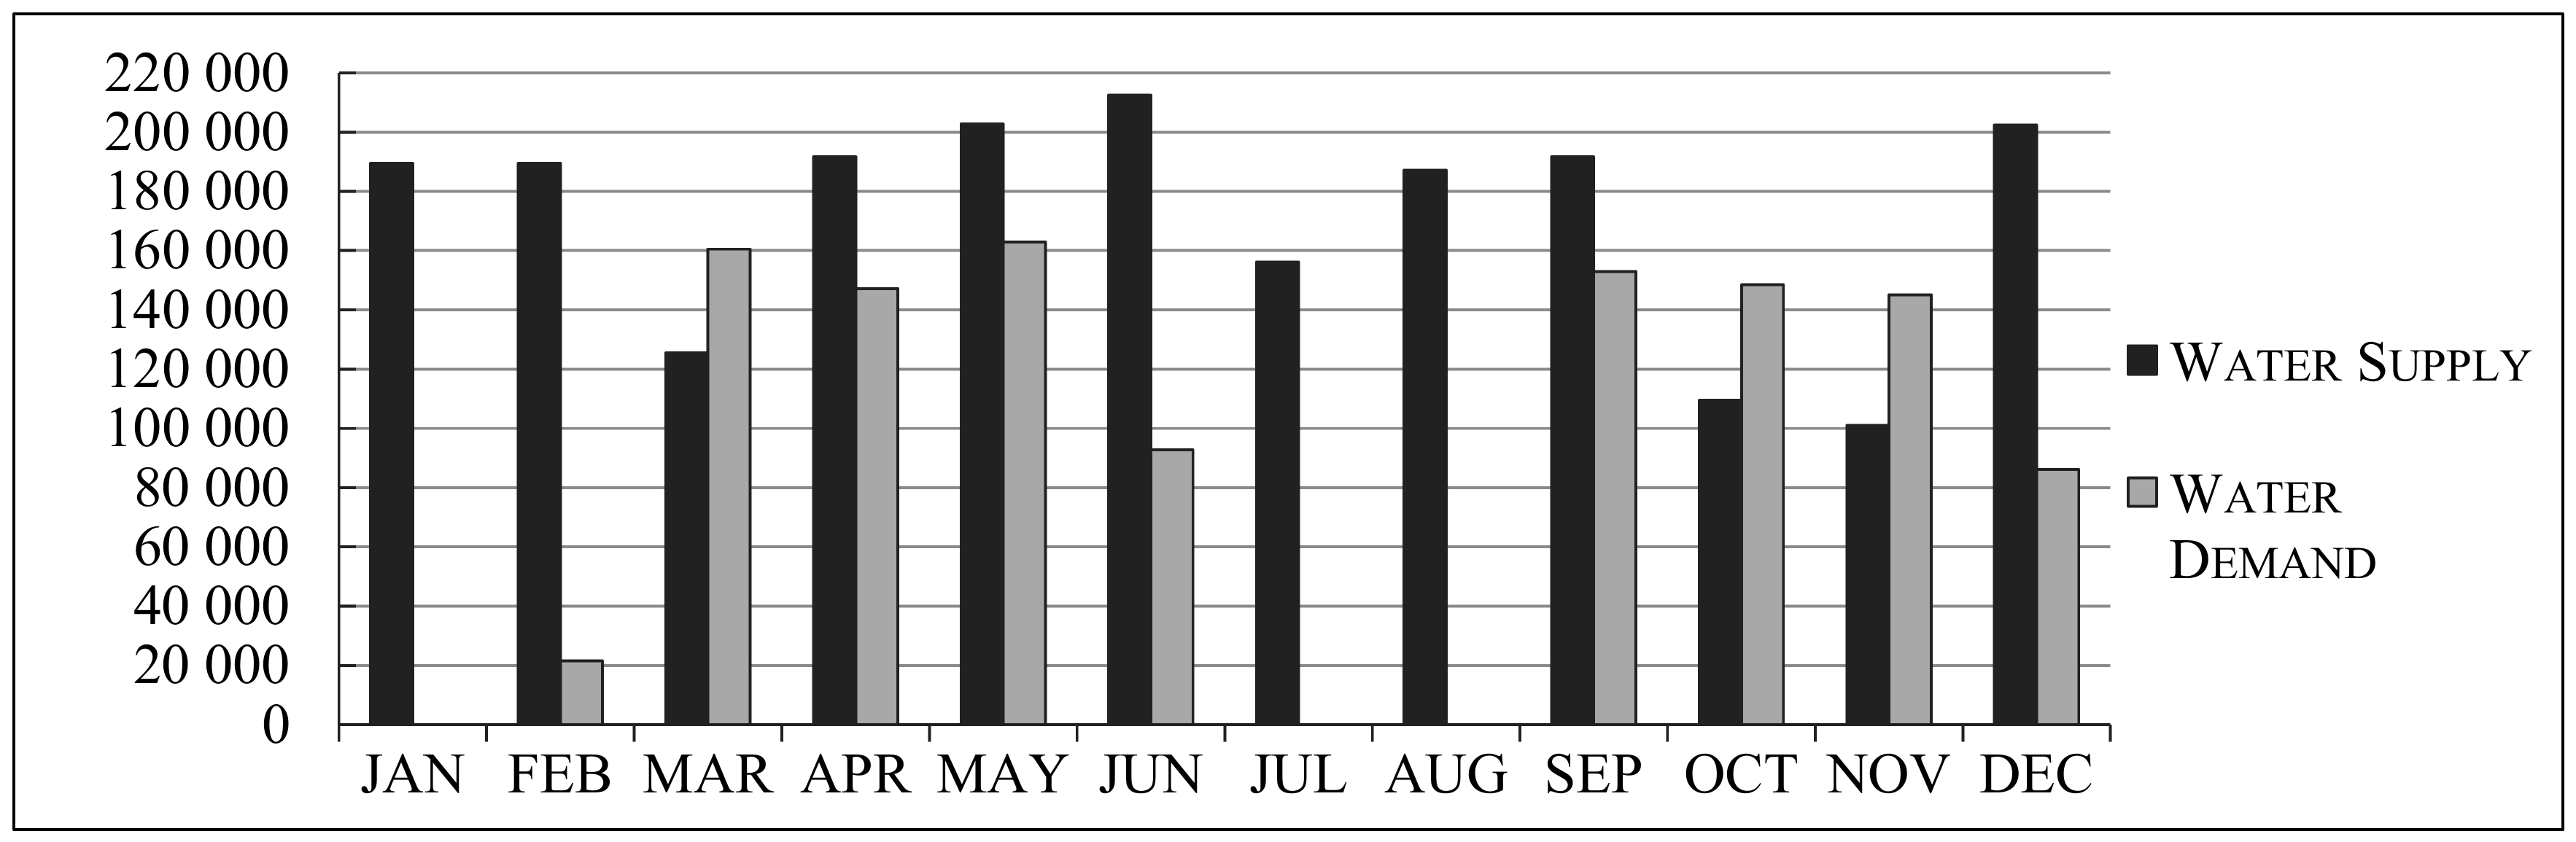
A single cropping pattern with only rice was investigated towards food security conditions (Figure 13). Rice an important food staple and source of cash income for the majority of the farming communities in Uganda. Rice has the potential to improve nutrition and boost food security, towards rural development and sustainable land [42]. However, current rice production is not keeping pace with the growing demand. The scenario adjusted the cropping pattern by considering single crop production to the current water allocation rules.
Results highlight a water deficit of 30 percent in the month of March. Also, in the months of October and November, an average water deficit of 40 percent was detected. During the other months of the year, oversupply conditions can be observed.
4. Discussion
The research study was conducted with the objectives of evaluating the opportunities to develop a knowledge-based DSS in the Mubuku Irrigation Scheme, for the optimal allocation of water resources, to enhance water use efficiency and water productivity in small-scale schemes. The study proved that Mubuku pilot scheme is not an exception from under-performing irrigation schemes. Based on pilot approach, the study confirmed the general conclusion of recent assessments that small-scale schemes underperform in terms of efficiency. Consistently with the sustainability and socio-economic objectives of such schemes, a versatile and highly flexible water framework was established through integrating FAO-Developed MASSCOTE approach and MikeHydro Basin simulation. The RAP-MASSCOTE was used to evaluate the key indicators (i.e., the field irrigation efficiency), computed through a global overview of the irrigation scheme with current and improved conditions. This tool was integrated with the application of the MIKEHydro Basin model, to define the baseline scenario and assess the optimum use of water supply in the surface irrigation canals system. The availability of water resources was monitored through a water balance approach, which compares irrigation water supply excesses and deficits, which concurrently improve land management. The baseline scenario revealed massive water excess throughout the year. The general imbalance resulted in low irrigation performance in terms of efficiency. The distributive issues are due to poor irrigation scheduling and supply-driven water allocation. The water balance approach proved that water resources could be better allocated, and there is a room for optimization of cropping patterns in order to follow the market trends and country needs. Beyond tackling this low efficiency, the study also intended to contribute to the development objectives of the country through evaluating possible alternative scenarios for optimal water distribution and cropping patterns. Therefore, three different scenarios were implemented and simulated: Flexible water services, market stability, and food security. The flexible water service scenario simulated a better allocation rule based on-demand scheduling in the current multicropping system. Results showed that creating on-demand schedule and redistributing the water supply more efficiently on a monthly basis, increased the field irrigation efficiency indicator, from the value of 14.73 percent to the higher value of approximately 50 percent. The flexible water service scenario investigated in Division 8 provided the optimal solution to improve water allocation in the irrigation scheme. Nevertheless, water allocation according to socio-economic objectives of food security and market security implies trading off the efficiency objectives. Single cropping patterns are unsuitable to achieve balance between demand and supply, furthermore, temporary water shortage occurred in both cases. As consequence, multicropping pattern should be preferred to reach overall development objectives of the country to eliminate food insecurity and to help farmers transitioning to commercial agriculture. These results emphasized the importance of establishing optimal water allocation policies to broaden the production possibilities for smallholders while ensuring sustainable water management.
Furthermore, the analysis proved that the development of a DSS is adaptable to the Mubuku case study, in terms of data availability and existing socioeconomic conditions. As a DSS is a dynamic model, policy makers will be supported and guided towards the optimal water management and cropping pattern, preserving existing water resources, utilizing them in a proper and sustainable manner and avoiding any future water shortage problems. Although Uganda has data-scarce environment, particularly in case of small-scale irrigation schemes, the combined approach presents solution to overbridge the data-gaps. The step-by-step approach allows for broad applicability and scalability in different conditions.
Author Contributions
Conceptualization, L.B., E.P. and M.S.; Data curation, L.B.; Formal analysis, L.B. and E.P.; Investigation, L.B. and E.P.; Methodology, L.B. and E.P.; Project administration, E.P. and M.S.; Resources, M.S.; Software, L.B.; Supervision, M.S.; Validation, E.P.; Visualization, L.B.; Writing—original draft, L.B.; Writing—review & editing, E.P. and M.S.
Funding
This research received no external funding.
Acknowledgments
We deeply thank for the colleagues in Mubuku Irrigation Scheme, Uganda to support us in the work. Authors are grateful to the Reviewers for the contribution.
Conflicts of Interest
The authors declare no conflict of interest.
References
- Degirmenci, H.; Buyukcangaz, H.; Kuscu, H. Assessment of Irrigation Schemes with Comparative Indicators in the Southeastern Project. Turk. J. Agric. For. 2003, 27, 299–303. [Google Scholar]
- Kjelds, J.; Jacobsen, T.; Hughes, J.; Krejcik, J. Decision support tools for integrated water resource management. DHI Water Environ. 2007, 513–526. [Google Scholar]
- Giupponi, C.; Sgobbi, A. Decision support systems for water resource management in developing countries: Learning from experiences in Africa. Water 2012, 5, 798–918. [Google Scholar] [CrossRef]
- Scott, C.A.; Vicuna, S.; Blanco-Gutiérrez, I.; Meza, F.; Varela-Ortega, C. Irrigation efficiency and water-policy implications for river basin resilience. Hydrol. Earth Syst. Sci. 2014, 18, 1339–1348. [Google Scholar] [CrossRef] [Green Version]
- Falkenmark, M.; Lannerstad, M. Consumptive water use to feed humanity—curing a blind spot. Hydrol. Earth Syst. Sci. 2005, 9, 15–28. [Google Scholar] [CrossRef]
- The World Bank. Agriculture for Development; The International Bank for Reconstruction and Development/The World Bank: Washington, DC, USA, 2008; pp. 8–12. [Google Scholar]
- Sumberg, J.; Anyidoho, N.A.; Chasukwa, M.; Chinsinga, B.; Leavy, J.; Tadele, G.; Whitfield, S.; Yaro, J.A. Young People, Agriculture and Employment in Rural Africa. In African Youth and the Persistence of Marginalization: Employment, Politics, and Prospects for Change, 1st ed.; Resnick, D., Thurlow, J., Eds.; Routledge: Abingdon, UK, 2005; pp. 111–133. [Google Scholar]
- Fanadzo, M.; Ncube, B. Challenges and opportunities for revitalising smallholder irrigation schemes in South Africa. Afr. J. Online 2018, 44, 1956–1969. [Google Scholar] [CrossRef]
- Fru Fonteh, M. Guidelines for Sustainable Irrigation System Design and Management in Sub-Saharan Africa. Afr. J. Agric. Res. 2017, 12, 1747–1755. [Google Scholar]
- Chri, A.J.; Malongo, R.S.M.; Mahoo, H.; Tumbo, S.D.; Casmir, R. A Decision Support System for enhancing crop productivity of smallholder farmers in semi-arid agriculture. Int. J. Inf. Commun. Technol. Res. 2013, 3, 238–248. [Google Scholar]
- Jagermeyr, J.; Gerten, D.; Heinke, J.; Schaphoff, S.; Kummu, M.; Lucht, W. Water savings potentials and irrigation systems: Global simulation of processes and linkages. Hydrol. Earth Syst. Sci. 2015, 19, 3073–3091. [Google Scholar] [CrossRef]
- Irmak, S.; Odhiambo, L.O.; Kranz, W.L.; Eisenhauer, D.E. Irrigation Efficiency and Uniformity, and Crop Water Use Efficiency. Biol. Syst. Eng. Pap. Publ. 2011, 451, 1–8. [Google Scholar]
- Reinders, F.B. Irrigation methods for efficient water application: 40 years of South-African research excellence. Water SA 2011, 37, 765–770. [Google Scholar] [CrossRef]
- Leliveld, A.; Dietz, T.; Foeken, D.; Klaver, W. Agricultural Dynamics and Food Security Trends in Uganda. In Developmental Regimes in Africa; Overseas Development Institute Research Reports: Leiden, The Netherlands, 2013; pp. 6–17. [Google Scholar]
- Frenken, K. Irrigation in Africa in Figures, AQUASTAT Survey; FAO: Rome, Italy, 2005; Volume 588. [Google Scholar]
- Jakku, E.; Thorburn, P.J. A conceptual framework for guiding the participatory development of agricultural decision support. Agric. Syst. 2010, 103, 675–682. [Google Scholar] [CrossRef]
- Gleick, P.H.; Burns, C.G.W.; Chalecki, E.L.; Cohen, M.; Cushing, K.C.; Mann, A.; Reyes, R.; Wolff, G.H.; Wong, A. The World’s Water 2002–2033—The biennial report on freshwater resources. ECSP Rep. 2003, 9, 124–134. [Google Scholar]
- Flores, C.I.; Holzapfel, E.; Lagos, O. Decision Support System for Conjunctive stream-aquifer management. Chil. J. Agric. Res. 2010, 70, 278–286. [Google Scholar]
- Lilburne, L.; Watt, J.; Vincent, K. A Prototype DSS to Evaluate Irigation Management Plans. Comput. Electron. Agric. 1988, 21, 195–205. [Google Scholar] [CrossRef]
- Ziada, M.E.M.; Abderahman Ajoub, A.M.; Aljack, E.A. Development of a Decision Support System for Irrigation Management at Gezira Scheme in Sudan. Int. J. Comput. Appl. 2013, 65, 32–36. [Google Scholar]
- Billib, M.; Holzapfel, E.; Bardowicks, K. Decision Support System for Sustainable Irrigation in Latin America. In Changes in Water Resources Systems: Methodologies to Mantain Water Security and Ensure Integrated Management; Van de Jun, X., Rosbjerg, D., Fukushima, Y., Eds.; IAHS Press: Wallingford, UK, 2007; Volume 215, pp. 18–24. [Google Scholar]
- Clarke, N.; Bizimana, J.C.; Dile, Y.; Worqlul, A.; Osorio, J.; Herbst, B.; Richardson, J.W.; Srinivasan, R.; Gerik, T.J.; Williams, J.; et al. Evaluation of new farming technologies in Ethiopia using the Integrated Decision Support System (IDSS). Agric. Water Manag. 2017, 180, 267–279. [Google Scholar] [CrossRef]
- Jaiswal, R.K.; Ghosh, N.C.; Guru, P. Devakant: MIKE BASIN Based Decision Support Tool for Water Sharing and Irrigation Management in Rangawan of India; Hindawi Publishing Corporation: London, UK, 2014; pp. 1–10. [Google Scholar]
- Elkassar, G. Establishment of Water Distribution Scheduling and Operation Strategy for Sustainability Management of Pilot Irrigation Scheme Mubuku Area-Uganda, “Application Case Study”. In Twentieth International Water Technology Conference IWTC20, Hurghada, Egypt, 18–20 May 2017; Negm, A.M., Ed.; Springer: Cham, Switzerland, 2019. [Google Scholar]
- Teodosiu, C.; Ardeleanu, C.; Lupu, L. An Overview of Decision Support Systems for Integrated Water Resources Management. Environ. Eng. Manag. 2009, 8, 152–153. [Google Scholar] [CrossRef]
- Renault, D.; Facon, T.; Wahaj, R. Modernizing Irrigation Management—The MASSCOTE Approach; FAO: Rome, Italy, 2007; pp. 33–71. [Google Scholar]
- Burt, C.M.; Clemmens, A.J.; Streflkoff, T.; Solomon, K.; Bliesner, R.; Hardy, L.A.; Howell, T.; Eisenhauer, D. Irrigation performance measures: Efficiency and uniformity. J. Irrig. Drain. Eng. 1997, 125, 423–442. [Google Scholar] [CrossRef]
- Jawale, P.S.; Arora, M.; Vaidya, D.R. Decision Support System for Irrigation Canals. Int. J. Sci. Eng. Res. 2016, 7, 854–858. [Google Scholar]
- Yu, Y.; Disse, M.; Yu, R.; Sun, L. Large-Scale Hydrological Modeling and Decision-Making for Agricultural Water Consumption and Allocation in the Main Stem Tarim River, China. Water J. 2015, 7, 2821–2839. [Google Scholar] [CrossRef] [Green Version]
- Fan, Y.; Gao, Z.; Wang, S.; Chen, H.; Liu, J. Evaluation of Water Allocation and Delivery Performance of Jiamakou Irrigation Scheme, Shanxi China. Water 2018, 5, 654. [Google Scholar] [CrossRef]
- Playàn, E.; Slatni, A.; Castillo, R.; Faci, J.M. A case Study for Irrigation Modernisation: II Scenario Analysis. Agric. Water Manag. 2000, 42, 335–354. [Google Scholar] [CrossRef]
- Osama, S.; Elkholy, M.; Kansoh, R.M. Optimization of the cropping pattern in Egypt. Alex. Eng. J. 2017, 56, 557–566. [Google Scholar] [CrossRef]
- Hyuha, T.; William, E.; Grace, B.K. Determinants of import demand of rice in Uganda. Int. J. Appl. Pure Sci. Agric. 2017, 3, 75–81. [Google Scholar]
- Okoboi, G.; Barungi, M. Constraints to fertiliser use in Uganda: Insights from Uganda Census of Agriculture 2008/9. J. Sustain. Dev. 2012, 5, 99–113. [Google Scholar] [CrossRef]
- Singh, A.; Singh, S.; Nema, A.K.; Gangwar, A. Rainfall-Runoff Modeling Using MIKE 11 NAM Model for Vinayakpur Intercepted Catchment, Chhattisgarh. Indian J. Dryland Agric. Res. Dev. 2014, 29, 01–04. [Google Scholar] [CrossRef]
- Allen, R.G.; Pereira, L.S.; Raes, D.; Smith, M. Crop Evapotranspiration—Guidelines for Computing Crop Water Requirements; FAO: Rome, Italy, 1998; pp. 15–64. [Google Scholar]
- Taechatanasat, P.; Armstrong, L. Decision Support System Data for Farmer Decision Making. In Proceedings of the 9th Conference of the Asian Federation for Information Technology in Agriculture, Perth, Australia, 29 September–2 October 2014. [Google Scholar]
- Home, P.G.; Ngugi, H.N. A comparative evaluation of irrigation efficiencies for smallholder irrigation schemes in Murang South District. In Proceedings of the 7th JKUAT Scientific, Technological and Industrialization Conference, Nairobi, Kenya, 14–15 November 2012. [Google Scholar]
- Doorenbons, J.; Pruitt, W.O. Crop Water Requirements. Irrigation and Drainage Paper; FAO: Rome, Italy, 1996; pp. 3–65. [Google Scholar]
- Mori, P.R.; Lodhs, P.P.; Prakash, I.; Bhura, C.S. Cropping Pattern Scenarios in the Command Area of Karjan Dam Gujarat, India. Int. J. Sci. Res. Dev. 2015, 3, 441–443. [Google Scholar]
- Lakmali, W.A.S.; Gunawardena, E.R.N.; Dayawansa, N.D.K. Comparative Performance Assessment of Major Irrigation Systems in Upper Deduru Oya Basin. Trop. Agric. Res. 2015, 26, 343–354. [Google Scholar] [CrossRef]
- Bua, B.; Ojirot, M. Assessing the importance of rice as Food and Income Security Crop in Puti-puti Sub-country, Pallissa District, Uganda. Am. J. Exp. Agric. 2014, 4, 532–540. [Google Scholar]
Figure 1.
The Mubuku catchment and Sebwe sub-catchment. Source: Strengthening agricultural water efficiency and productivity on the African and global level, Food and Agricultural Organization (FAO).
Figure 1.
The Mubuku catchment and Sebwe sub-catchment. Source: Strengthening agricultural water efficiency and productivity on the African and global level, Food and Agricultural Organization (FAO).

Figure 2.
Steps of the Mapping System and Services for Canal Operation Techniques (MASSCOTE) approach.
Figure 2.
Steps of the Mapping System and Services for Canal Operation Techniques (MASSCOTE) approach.

Figure 3.
Input and output data in the rapid appraisal procedure (RAP) tool.

Figure 4.
MIKEHydro basin modules implementation.

Figure 5.
The knowledge-based decision support system (DSS) applied to the Mubuku Irrigation Scheme.
Figure 5.
The knowledge-based decision support system (DSS) applied to the Mubuku Irrigation Scheme.

Figure 6.
Observed and simulated River Sebwe discharge for the calibration period.

Figure 7.
Total accumulated runoff from the closing section of the catchment.

Figure 8.
The water balance for the validation period (accumulated discharge).

Figure 9.
Gapfilled/extended discharge for river Sebwe (1956–2017).

Figure 10.
Monthly water demand (WD) and water supply (WS), Phase II, Baseline Scenario.

Figure 11.
Monthly WD and WS, Division 8, flexible water service.

Figure 12.
Monthly WD and WS, Phase II, market stability scenario.

Figure 13.
Monthly WD and WS, Phase II, food security scenario.


Table 1.
The Nedbor-Afstromnings Model (NAM) parameters used for the calibration of the model.
| NAM Parameters | Parameters Descriptions | Units | Values Range | Calibrated Values |
|---|---|---|---|---|
| Umax | Maximum Water Content in Surface Storage | mm | 10–20 | 10 |
| Lmax | Maximum Water Content in Root Zone Storage | mm | 100–300 | 100 |
| CQOF | Overland Flow Runoff Coefficient | - | 0.10–1.00 | 0.258 |
| CKIF | Time Constant for Routing Interflow | hours | 200–1000 | 250 |
| CK1 | Time Constant 1 for Routing Overland Flow | hours | 10–50 | 18 |
| CK2 | Time Constant 2 for Routing Overland Flow | hours | 10–50 | Not used |
| TOF | Root Zone Threshold Value for Overland Flow | - | 0–0.99 | 0.60 |
| TIF | Root Zone Threshold Value For Interflow | - | 0–0.99 | 0 |
| TG | Root Zone Threshold Value for Groundwater Recharge | - | 0–0.99 | 0 |
| CKBF | Time Constant for Routing Base Flow | hours | 1000–4000 | 2800 |
| CQLOW | Lower Base Flow, Recharge to Lower Reservoir | percentage | 0–100 | Not used |
| CKLOW | Time Constant for Routing Lower Base Flow | hours | 1000–30,000 | Not used |
Table 2.
Irrigation water entering from outside the command area through the main canal (2017).
| Month | Jan | Feb | Mar | Apr | May | Jun | Jul | Aug | Sep | Oct | Nov | Dec | Annual |
|---|---|---|---|---|---|---|---|---|---|---|---|---|---|
| MCM/month | 0.15 | 0.15 | 0.44 | 0.44 | 0.55 | 0.46 | 0.35 | 0.40 | 0.37 | 0.15 | 0.38 | 0.44 | 4.26 |
Table 3.
Irrigated, crop factors, and growing stages.
| Crops | Length [Days] | RD [mm] | MH [m] | Kc [–] | |||||
|---|---|---|---|---|---|---|---|---|---|
| INI | DEV | MID | LAT | INI | MID | LAT | |||
| Maize | 15 | 30 | 55 | 30 | 30–1000 | 1.80 | 0.70 | 1.10 | 0.40 |
| Rice | 15 | 25 | 45 | 20 | 30–500 | 1.00 | 0.80 | 1.20 | 0.60 |
| Onions | 10 | 15 | 40 | 25 | 10–500 | 0.50 | 0.60 | 1.10 | 0.80 |
| Beans | 15 | 15 | 30 | 30 | 0–1100 | 0.40 | 0.60 | 1.10 | 1.00 |
| Tomatoes | 30 | 60 | 30 | 30 | 0–1100 | 0.60 | 0.40 | 1.00 | 0.80 |
| Mangoes | 60 | 90 | 120 | 95 | 30–1200 | 6.00 | 0.72 | 0.75 | 0.78 |
Table 4.
Soil properties.
| Soil Model: Parameters | |
|---|---|
| Initial [%] | 13.0 |
| Field Capacity [%] | 31.0 |
| Wilting Point [%] | 18.0 |
| Porosity [%] | 48.0 |
| Evaporable Layer [m] | 0.10 |
Table 5.
Crop water requirements in the first growing season (Phase II).
| Crops | Sowing Day/Month | Area [ha] | CWR [m3] | CWR [m3/ha] |
|---|---|---|---|---|
| Maize | 10/03 | 50.00 | 175,492 | 3510 |
| Rice | 01/03 | 33.00 | 119,152 | 3611 |
| Onions | 10/01 | 23.00 | 98,903 | 4300 |
| Beans | 01/03 | 15.00 | 28,879 | 1925 |
| Tomatoes | 15/03 | 8.00 | 31,748 | 3968 |
| Mangoes | 01/01 | 5.00 | 31,472 | 6294 |
Table 6.
Crop water requirements in the second growing season.
| Crops | Sowing Day/Month | Area [ha] | CWR [m3] | CWR [m3/ha] |
|---|---|---|---|---|
| Maize | 10/09 | 69.00 | 23,982 | 3348 |
| Rice | 01/09 | 53.00 | 180,959 | 3414 |
| Onions | 20/06 | 10.00 | 40,404 | 4040 |
| Beans | 01/07 | 3.00 | 10,386 | 3462 |
| Tomatoes | 15/11 | 4.00 | 16,623 | 4156 |
Table 7.
Crop water requirements in the first growing season (Division 8).
| Crops | Sowing Day/Month | Area [ha] | ETcrop [m3] | ETcrop [m3/ha] |
|---|---|---|---|---|
| Maize | 10/03 | 14.87 | 51,637 | 3473 |
| Rice | 01/03 | 14.87 | 53,149 | 3575 |
| Onions | 10/01 | 9.66 | 41,109 | 4256 |
| Mangoes | 01/01 | 2.58 | 16,240 | 6296 |
Table 8.
Crop water requirements in the second growing season (Division 8).
| Crops | Sowing Day/Month | Area [ha] | ETcrop [m3] | ETcrop [m3/ha] |
|---|---|---|---|---|
| Maize | 10/09 | 14.87 | 61,650 | 4146 |
| Rice | 01/09 | 14.87 | 62,779 | 4222 |
| Onions | 20/06 | 9.66 | 38,626 | 3999 |
© 2019 by the authors. Licensee MDPI, Basel, Switzerland. This article is an open access article distributed under the terms and conditions of the Creative Commons Attribution (CC BY) license (http://creativecommons.org/licenses/by/4.0/).
Share and Cite
MDPI and ACS Style
Bettili, L.; Pek, E.; Salman, M. A Decision Support System for Water Resources Management: The Case Study of Mubuku Irrigation Scheme, Uganda. Sustainability 2019, 11, 6260. https://0-doi-org.brum.beds.ac.uk/10.3390/su11226260
AMA Style
Bettili L, Pek E, Salman M. A Decision Support System for Water Resources Management: The Case Study of Mubuku Irrigation Scheme, Uganda. Sustainability. 2019; 11(22):6260. https://0-doi-org.brum.beds.ac.uk/10.3390/su11226260
Chicago/Turabian StyleBettili, Luisa, Eva Pek, and Maher Salman. 2019. "A Decision Support System for Water Resources Management: The Case Study of Mubuku Irrigation Scheme, Uganda" Sustainability 11, no. 22: 6260. https://0-doi-org.brum.beds.ac.uk/10.3390/su11226260
Note that from the first issue of 2016, this journal uses article numbers instead of page numbers. See further details here.