Open-End Funds for Sustainable Economic Growth in China: The Relationship between Load Fees, Performance, and Flows


School of Finance and Statistics, Hunan University, Changsha 410006, China
*
Author to whom correspondence should be addressed.
Sustainability 2019, 11(22), 6514; https://0-doi-org.brum.beds.ac.uk/10.3390/su11226514
Submission received: 23 October 2019
/
Revised: 14 November 2019
/
Accepted: 15 November 2019
/
Published: 19 November 2019
(This article belongs to the Special Issue Sustainability in Asian Emerging Markets)
Abstract
:The financial market, including the fund market, has an increasingly important role in facilitating sustainable economic development. In this study, we examine whether investors react rationally to fund fees through the investigation of the impact of fee structures on investor behavior with open-end funds in China. We aim to determine whether performance influences the effect of the load fee on fund flows. Based on panel data that contained 240 open-end funds for the period of 2008 to 2017, we offer insight into the relationship between fee structure and the flow of open-end funds in China and find that investors react more sensitively to the load fee than operating expenses. Specifically, the coefficients of operating expenses were found to be insignificant in all regression analyses, while almost all the coefficients of load fees were statistically significant. In addition, our findings indicate that the load fee decreases net flow mainly through increasing redemption, and high load fees can make investors more rational to redeem funds with low performance. High load fees can influence investors to sell funds that perform worse in moderately performing funds, where a high load fee can increase investors’ rationality and motivate them to sell funds, resulting in the mitigation of the disposition effect. We also find that investors in larger funds and aggressive growth funds, as well as those who invest with institutional investors and higher liquidity, react more insensitively to load fees, which can be illustrated by the distraction effect.
1. Introduction
The financial market provides increasingly important contributions to sustainable economic growth by efficiently mobilizing economic resources and optimizing fund allocation [1,2]. China has announced that it will largely relax access to its financial market [3]. For foreign-funded financial institutions, this means a new stage of opening up the Chinese financial market. As of 2018, foreign investment only accounts for 2% of the Chinese A-share market and 2.9% of the Chinese bond market. The assets of foreign-invested banks account for 1.6% of all commercial bank assets, foreign-invested insurance companies account for about 5.8%, and few foreign institutions exist in the Chinese fund market, all of which have considerable room to develop.
The limit for public-raising fund investments of foreign institutions has been extended to 51%, which means that foreign institutions can not only jointly operate fund firms with domestic companies but can also gain the operating rights of fund firms. After a three-year implementation period, the investment proportion will be exempt from limits, and foreign institutions will be free to operate in the Chinese fund market. Due to the potential for development and the policies’ advantages, many large foreign fund companies have established fund firms in Shanghai, including the top 10 largest foreign fund companies in the world. The chief executive officer (CEO) of BlackRock stated they would apply their skills and experience to the Chinese market, but they first have to understand the situation of the Chinese fund market.
Over previous decades, the Chinese fund market has developed significantly, with open-end funds having the largest share in the market. The first Chinese open-end fund was established in 2009. Such funds are different from closed-end funds in terms of their freedom to be bought and sold. The popularity of these funds has since grown continuously, accounting for 95% of the Chinese fund market as of the end of 2017 [4]. Researchers have reported that investing in such funds is a wise decision to help diversify the risk of single investments in stocks and bonds [5,6]. In this market, investors often consider the cost and profit of a fund as the most important factor in their decision making. Profits are further determined by a fund’s cost, which indicates the importance of cost in investment decision-making [7]. The cost of a fund includes transaction fees, also called the load fee, and the operating expenses [8,9,10]. The load fee of a fund consists of the front-end fee and the back-end fee [11]. The former is charged before investors buy into the fund, and the latter is charged before investors sell their shares in the fund [12]; these fees are front-face fees and salient for investors [13]. Operating expenses are the other fees charged through the fund holding period and include management, takeover, and advertising fees, which are subtracted directly from income, so they are hidden behind profit and are not easily noticed by investors [9,12,13].
However, how much the two aforementioned types of fees influence investor behavior is debatable [14]. The load fee has been found to strongly and negatively influence the mutual fund flow because it is more salient [12,13,14], whereas some studies have found that the load fee increases the fund flow [15,16,17]. Wang et al. [9] found that the operating expenses, more than the load fee, strongly decrease the fund flow, using evidence from Taiwan, whereas other researchers have found that higher expenses are related to higher flow [18]. Some studies have found that operating expenses are ignored by investors and do not impact the fund flow [19,20]. Generally, researchers have not reached a consensus about the influence of the fees in the mutual fund market. Other studies reported results contrary to those of Houge and Wellman [12], which suggests that operating expenses can be ignored and that sophisticated investors dislike holding funds with high load fees [15,16,18]. Researchers have also considered performance when analyzing the relationship between flow and fees. Some have found that participant costs, mainly including search costs, can substitute performance in affecting the fund flow when exploring the effect of the cost on the flow–performance relationship according to different performance levels [21,22]. Wang et al. [23] studied the impact of the back-end load on flow-performance sensitivity on a full sample. Navone [24] found that fund fees and performance are equally important to investors and investigated the impact of performance on the flow-operating expense relationship across different performance levels. Kim [25] provided evidence that the focus of load fees overweighs that of performance. However, none explored the effect of performance on the flow-load fee relationship in inflow and outflow separately.
The contributions provided in this study are threefold. First, we analyzed how the fee structure influences the fund flow by decomposing the net flow into inflow and outflow. Using data from the China Stock Market Accounting Research (CSMAR) database covering January 2008 to December 2017, we constructed a basic ordinary least squares (OLS) regression similar to that of Barber et al. [13]. The results show that the load fee can increase redemption and that it has a lesser influence on purchase due to its much smaller amount, further decreasing the net flow. The operating expenses have no impact on either the redemption or purchase. These results indicate that the investors in Chinese mutual funds prefer to sell high-cost funds, reacting rationally to high load fees, consistent with the findings reported by Houge and Wellman [12]. Front- and back-end fees should take responsibility for the redemption, which constitute load fees. Front-end fees are paid before purchase and should be regarded as sunk costs. Investors have a “sunk cost fallacy”, which means that the cost also influences their decisions even though it has been paid [13,26]. Investors always prefer low-cost investments [7]. Thus, high front-end fees make investors realize they have invested in a high-cost investment and are likely to find another low-cost investment. Additionally, the back-end fee is a part of fees that are not paid after purchase and will not be paid until redemption. Investors always sell funds due to liquidity demands and poor fund performance [27,28], whereas a high back-end fee increases their shifting cost to own another better quality fund and to receive cash back [26]. Thus, investors are prone to fund redemptions with increasing load fees to stop their losses. Second, we studied how investors behave under different performance levels with varying load fees. Through simulation, Huang et al. [21] and Navone [24] added the interaction term between the market return of the last period and the load fee of the last period (MARt−1 × LFt−1 )to basic regression and segmented the full sample by different performance levels. We found that the performance of moderately well-performing funds weakens the flow–load fee relationship, but this is not necessarily accurate for extremely good or bad funds. As fund performance decreases, high load fees increase the redemption over the moderate performance range, followed by a decrease in net flow. Higher load fees can make investors sell more funds that are performing poorly over the moderate performance range, so they can mitigate the disposition effect—an irrational behavior pervading in the Chinese fund market—which is caused by investors’ preference to hold poorly performing funds and sell funds that are performing well [29,30]. Differing from those who have stated that Chinese investors are unsophisticated [31], we found that high load fees motivate most Chinese investors to sell funds with bad security to avoid greater losses. These results also confirm that the reaction of Chinese investors to load fees is based on knowledge and experience, in line with Houge and Wellman [12]. Third, we investigated how fund characteristics, such as size, liquidity, growth-oriented classification, and proportion of institutional investors, affect the relationship between fee structure and fund flow. We provide evidence that the load fee can motivate the redemption in medium and small funds with low liquidity as well as income funds. We found the impact of load fees on large funds, high liquidity funds, and aggressive growth and growth funds are insignificant due to the distraction effect. Institution investors are so experienced that the load fee has less influence on their investment decisions. We also noticed that inflow peaked in 2015, so a structure break test was considered in a robust test. We found no significant difference between the effect of the load fee on fund flow before and after 2015.
The rest of this paper is structured as follows. Section 2 presents a literature review and hypothesis development. Section 3 highlights the model and research methods. A discussion of the empirical results and a robust test is presented in Section 4. Section 5 presents the conclusion and implications.
2. Literature Review and Hypotheses Development
2.1. Effect of Fund Fees on Mutual Fund Flows
Most of the existing literature are focused on the relationship between flows and profits of funds and have reported that net inflows are positively associated with fund profits [32,33,34]. Some studies have discussed the relationship between the behavior of investors and fund fees, and consumers have been found to be very sensitive to fees [35]. Barber et al. [13] first decomposed fund fees into the load fee and operating expenses, and then separately studied their influences on the net flow. For operating expenses, some researchers have reported that the effect of the operating fee is negligible [13] since the load fee is more salient than operating expenses and is charged before purchase or redemption. Houge and Wellman [12] also stated that the load fee is transparent, whereas only one-fifth of investors know the amount of operating expenses they pay per year. Thus, operating expenses are not easily noted and may not significantly influence the fund flow. Inconsistent conclusions were drawn from a sample of funds in the Taiwan province of China by Barber et al. [13]; a higher operation fee restrains investors’ net purchase behavior [9]. Ivković and Weisbenner [26] and Iannotta and Navone [36] found that investors react more sensitively to operating expenses. For the load fee, in the U.S. market, funds are purchased directly with fund underwriters or indirectly via brokers; the load fee is the fee charged by brokers or advisors for their services [12]. Mixed results suggest that the load fee has a two-sided effect on fund flows: a high load fee reduces the search cost due to its advertising role and increases the net flow [15,36]; a high load fee is regarded as a burden on the return of funds due to its salience and decrease in the net flow [23,37,38]. Barber et al. [13] demonstrated that the negative effect of load fee salience always offsets the advertising role of the fee. Houge and Wellman [12] also documented that sophisticated investors are prone to buying funds directly from fund companies rather than buying indirectly from brokers who charge higher load fees, and those sophisticated investors are unwilling to hold funds with increasing load fees. Ivković and Weisbenner [26] firstly decomposed the net flow into inflow and outflow, and investigated how different fees influence purchase and redemption. They provided evidence that the front- and back-end load fees do not influence the purchase but both can restrain redemption because investors regard the fee as a marginal cost instead of a sunk cost. The same results were reported by Christoffersen et al. [15], Iannotta and Navone [36], and Navone [24]. However, those results are inconsistent with those of Houge and Wellman [12], who found that sophisticated investors are averse to load fees and less prone to holding funds with high load fees.
We postulated that investors in China prefer mutual funds with a lower load fee and treat funds with a high load fee intellectually, as described by Houge and Wellman [12]. Note that Houge and Wellman [12] did not examine the effect of the load fee on inflow and outflow separately. Thus, we addressed a further question: whether investors react negatively and wisely to load fees in terms of purchase and redemption. We assumed that investors react more sensitively to the load fee than the operating fee due to their salience [12,13]. Therefore, the first set of hypotheses is as follows:
Hypothesis 1a (H1a):
Net repurchase, net redemption, and net fund flow are insignificantly related to operating expenses.
Hypothesis 1b (H1b):
Net fund flows are negatively related to the load fee.
Hypothesis 1c (H1c):
The net repurchase value (inflow) is negatively related to the load fee.
Hypothesis 1d (H1d):
The net redemption value (outflow) is positively related to the load fee.
2.2. Effect of Performance on the Flow–Fee Relationship
Profit and cost are two main factors affecting investment decision-making [7]. Many researchers have documented that the performance of a fund signals the ability of fund managers and cannot be ignored in investment decisions [39]. The performance can also indicate the time and selection ability of managers [40,41]. Wilcox [42] found that fund fees and performance can be substituted for each other’s roles in fund flow by exploring the effects of fund fees and performance on fund flow separately. So, performance must be considered when exploring the flow–fee relationship. Even though many researchers have investigated the relationship between fund fees and fund flow, few have considered performance in this case. Huang et al. [21] explored the effect of participant cost on the net flow–performance relationship. Unlike Wilcox [42], they constructed an interaction term of participant cost and past performance and found that the participant cost weakens the flow–performance relationship in high-performance funds, whereas it strengthens the relationship in median performance funds. Inverse conclusions about well- and moderately-performing funds have been reported by Ferreira et al. [22]. Wang et al. [23] found that a back-end load will shrink net flow–performance sensitivity. Differing from those studies, Navone [24] firstly stated that investors consider operating expenses and performance to be equally important and explored the effect of performance on the relationship between fund flow and operating expenses. However, the above researchers did not provide insights into inflow and outflow separately, even though purchase and redemption react differently to fund fees [26]. Most research has focused on participant cost, which is dominated by search costs, operating expenses, and only the back-end load fee, and the influence of performance on the flow–load fee relationship was not considered. We postulate that Chinese investors are sophisticated and averse to load fees [12] and will be attracted by low-cost funds with increasing performance [22]. Thus, for purchase, high performance will dampen the flow–fee relationship; for redemption, since investors are unwilling to hold funds with increasing load fees and chase performance [12], they sell more funds with higher load fees as the performance decreases, where performance also diminishes the effect of the load fee on the outflow. Combining inflow and outflow, we assumed that the performance also weakens the relationship between net flow and fund fees, as shown by Navone [24]. Since we postulated that investors react less sensitively to operating expenses in the first set of hypotheses, we did not further examine the effect of performance on flow–operating expense sensitivity. Thus, we present the second set of hypotheses:
Hypothesis 2a (H2a):
Fund performance weakens the relationship between the inflow and load fees.
Hypothesis 2b (H2b):
Fund performance weakens the relationship between the outflow and load fees.
Hypothesis 2c (H2c):
Fund performance weakens the relationship between the net flow and load fees.
Participant cost does not have the same effect on the flow–performance relationship across different performance levels [21], and Navone [24] also investigated how performance influences the flow–operating expense relationship under different performance levels, which incentivized us to further study the influence on the flow–load fee relationship under different performance levels. Thus, we divided the funds into three groups sorted by fund performance, which are the lowest quintile, three mid-range quintiles, and highest quintile, respectively, as previously reported by [21,22]. In the highest quintile, Huang et al. [21] demonstrated that participant cost reduces the reliance of performance on fund flow, but Ferreira et al. [22] reported a strengthening effect of the load fee. In the median group, Ferreira et al. [22] found that fund fees can be substituted for the effect of performance on flows, whereas an opposite result was reported by Huang et al. [21]. However, because of the convex flow–performance relationship, investors react less sensitively to poorly performing funds, and the load fee further has no influence on the flow–performance sensitivity in the poor performance group, as previously documented [21,22]. From Navone’s [24] perspective, the fund performance influences the net flow–fee sensitivity. By estimating the effects of performance on the inflow–fee and outflow–fee relationships, we hypothesized that investors may buy funds with high performance and a low load fee or sell funds with poor performance and a high load fee regardless of whether the funds are in the high or moderately performing ranges, since investors prefer higher performance and a lower load fee [12]. The performance does not influence the flow–fee relationship in poorly performing funds because the researchers reached a consensus that any kind of fee cannot be a substitute for the role of performance in flows in inferior-performing funds [21,22,24]. Thus, we formulated a third set of hypotheses:
Hypothesis 3a (H3a):
Fund performance weakens the relationship between the flow and load fees in high-performance funds.
Hypothesis 3b (H3b):
Fund performance weakens the relationship between the flow and load fees in median performance funds.
Hypothesis 3c (H3c):
Fund performance has no impact on the flow–load fee relationship in poorly performing funds.
2.3. Effect of Funds’ Characteristics on the Relationship between Fund Flow and Fund Fees
As for the types of investors, mature investors have a strong ability to bargain, so fund marketing has little influence on their purchase and redemption decisions [43]. Institutional investors are usually better than individual investors in terms of information acquisition, information analysis, and rational decision-making, and their responses to fund costs are more rational than those of individual investors. Compared with individual investors, institutional investors generally prefer to invest over the long term, and the load fee is a one-time cost that is diluted with the increase in the investment period. Thus, institutional investors react less sensitively to the load fee than individual investors. We divided the full sample into three groups based on proportions of institutional investors, which are the lowest quintile, three middle quintiles, and the highest quintile, and examined the influence of the load fee on fund flow in these groups. Investors react differently across different growth-oriented classifications, including the aggressive growth funds, growth funds, and income funds, since these three categories of funds have different levels of return and risk. Aggressive growth funds have the highest return and risk since this mainly refers to investment in aggressive growth stocks. Income funds have the lowest return and risk, which predominantly include investment in bonds. Growth funds have a median level of return and risk. The investment of funds with different levels of return and risk reflect different characteristics of investors, which further induces different reactions to the load fee [44]. The size and liquidity of funds also affect the relationship between fund fees and fund performance [43,45]. Thus, we classified the full sample into three groups sorted by the total net assets (TNA) and the turnover rate of funds (TR), which are the largest quintile, three middle quintiles, and smallest quintile, respectively, and examined the influences of the load fee on the fund flow in the three groups.
3. Data, Model, and Methodology
3.1. Data
The China Stock Market Accounting Research (CSMAR) database provided the market-adjusted return (MAR), return of volatility (RV), total net asset (TNA), share of redemption, share of purchase, net value of per share (NAV), and operating year (AGE) monthly data for our research. CSMAR also offers the classification of growth-oriented funds and explains the standard of classification in detail. Repurchase fees, redemption fees, and turnover ratio data were obtained from the websites of the Shanghai and Shenzhen Stock Exchanges. We computed the inflow and outflow by multiplying the net value per share with the share of the purchase and share of the redemption, respectively. The sample included all open-end funds that are marketed in China. We restricted analyses to open-end funds for two reasons. First, open-end funds have demonstrated considerable progress in China in recent years and have received increasing attention from academics. Second, few scholars have explored the relationship between open-end fund flows and fees in China. At the end of 2007, Chinese governments strengthened their open-end fund monitoring, the development of open-end funds reached a mature stage, and the number of funds has grown rapidly since 2018. We removed the open-end funds with missing data and the funds of the financial industry. So, the sample included 240 open-end funds from January 2008 to December 2017. After deleting missing and extreme values, we obtained 1655 observations.
3.2. Model and Methods
We applied the ordinary least squares (OLS) model to test the above hypotheses. Firstly, we constructed inflow, outflow, and net flow following the literature [9,12], where NRPVt is the semi-annual purchases of a fund scaled by the end of-semi-annual TNAt, NRDVt is the semi-annual redemptions of a fund scaled by the end of-semi-annual TNAt, and NFFt is the value of purchases minus the value of redemptions scaled by TNAt:
where NRPVi,t is the inflow for fund i for each semi-annual period t, NRDVi,t is the outflow for fund i for each semi-annual period t, NFFi,t is the net flow for fund i for each semi-annual t, and TNAi,t is the net total assets of fund i at time t.
Secondly, to measure the load fee, operating expenses, and total fee, we used the following equations constructed by Ivković and Weisbenner [26]:
Thirdly, excess returns were constructed following Fama and French [46], who showed that the three-factor model provides better estimates compared with the capital asset price model (CAPM). The Fama–French α is the intercept from the three-factor model developed by Fama and French [46]:
where Rft is the monthly return on T-bills, Rmt is the return of the monthly a value-weighted market index, α is the CAPM intercept (Jensen’s α), β is the market β, SMBt is the return on a value-weighted portfolio of small stocks minus the return on a value-weighted portfolio of big stocks, and HMLt is the return on a value-weighted portfolio of high book-to-market stocks minus the return on a value-weighted portfolio of low book-to-market stocks. The regression yields parameter estimates of α, β, s, and h. The error term in the regression is denoted by εt. Finally, we ran OLS regressions for each semi-annual year of the chosen sample period:
where TFi,t −1 is the sum of load fee and operating expense of fund i at time (t − 1); LF is load fee of fund i at time (t − 1); EXPi,t−1 is operating expense of fund i at time (t − 1); MARi,t−1, MARi,t−2, and MARi,t−3 are half-year market-adjusted returns of fund i at times (t – 1), (t – 2), and (t – 3), respectively, calculated by Equation (7), which is used to control the effects of past performance and i; TRt is the turnover ratio-the rate at which a fund buys and sells an investment at time t; RVi,t is the return volatility, which is the amount of uncertainty or risk related to the return of fund i at time t, which is likely to have an impact on fund flow; and ∆TNAi,t is the change rate of the total net assets for fund i at time t.
We also concentrated on how performance and load fee affect the roles of the other on the fund flow. First, we replicated the previously reported regression [21,22], and one more explanatory variable was added: interaction terms (LFi,t−1 × MARi,t−1) Then, substituting Model (5) into Model (8), the modified empirical model is outlined as follows:
where MARi,t−1, MARi,t−2, and MARi,t−3 are the half-year market-adjusted return of fund i at times (t – 1), (t – 2), and (t – 3), respectively, and are used to control the effect of past performance.
Previous literature have documented that mutual fund flows asymmetrically react to past performance [47]; Huang et al. [21] and Ferreira et al. [22] documented that participant cost affects investors’ reactions to performance at different performance levels. To differentiate the different performance levels, we replicated Huang et al. [21] to divide the sample into quintiles based on the market risk return, and the results for the highest and lowest quintiles were defined as high performance and low performance, respectively. The median was defined as the high–low. To test how fund performance affects investors’ sensitivity to the load fee at the different performance levels, we ran the regressions for the three groups separately for each semi-annual period.
To test the effects of other fund characteristics on the relationship between the load fee and fund flow, such as size, liquidity, and percentage of institutional investors, we also divided the sample into quintiles based on these characteristics, and the results for the highest and the lowest quintiles were classified into high and low groups. The median was defined as high-low. According to each characteristic, we ran the regressions for the funds in the three groups based on Models (9) to (11) separately for each semi-annual period. To test the investors’ reactions to the load fees of funds with different levels of return and risk in different growth-oriented classifications, we ran separate regressions based on aggressive growth, growth, and income funds.
4. Empirical Results
4.1. Descriptive Statistics
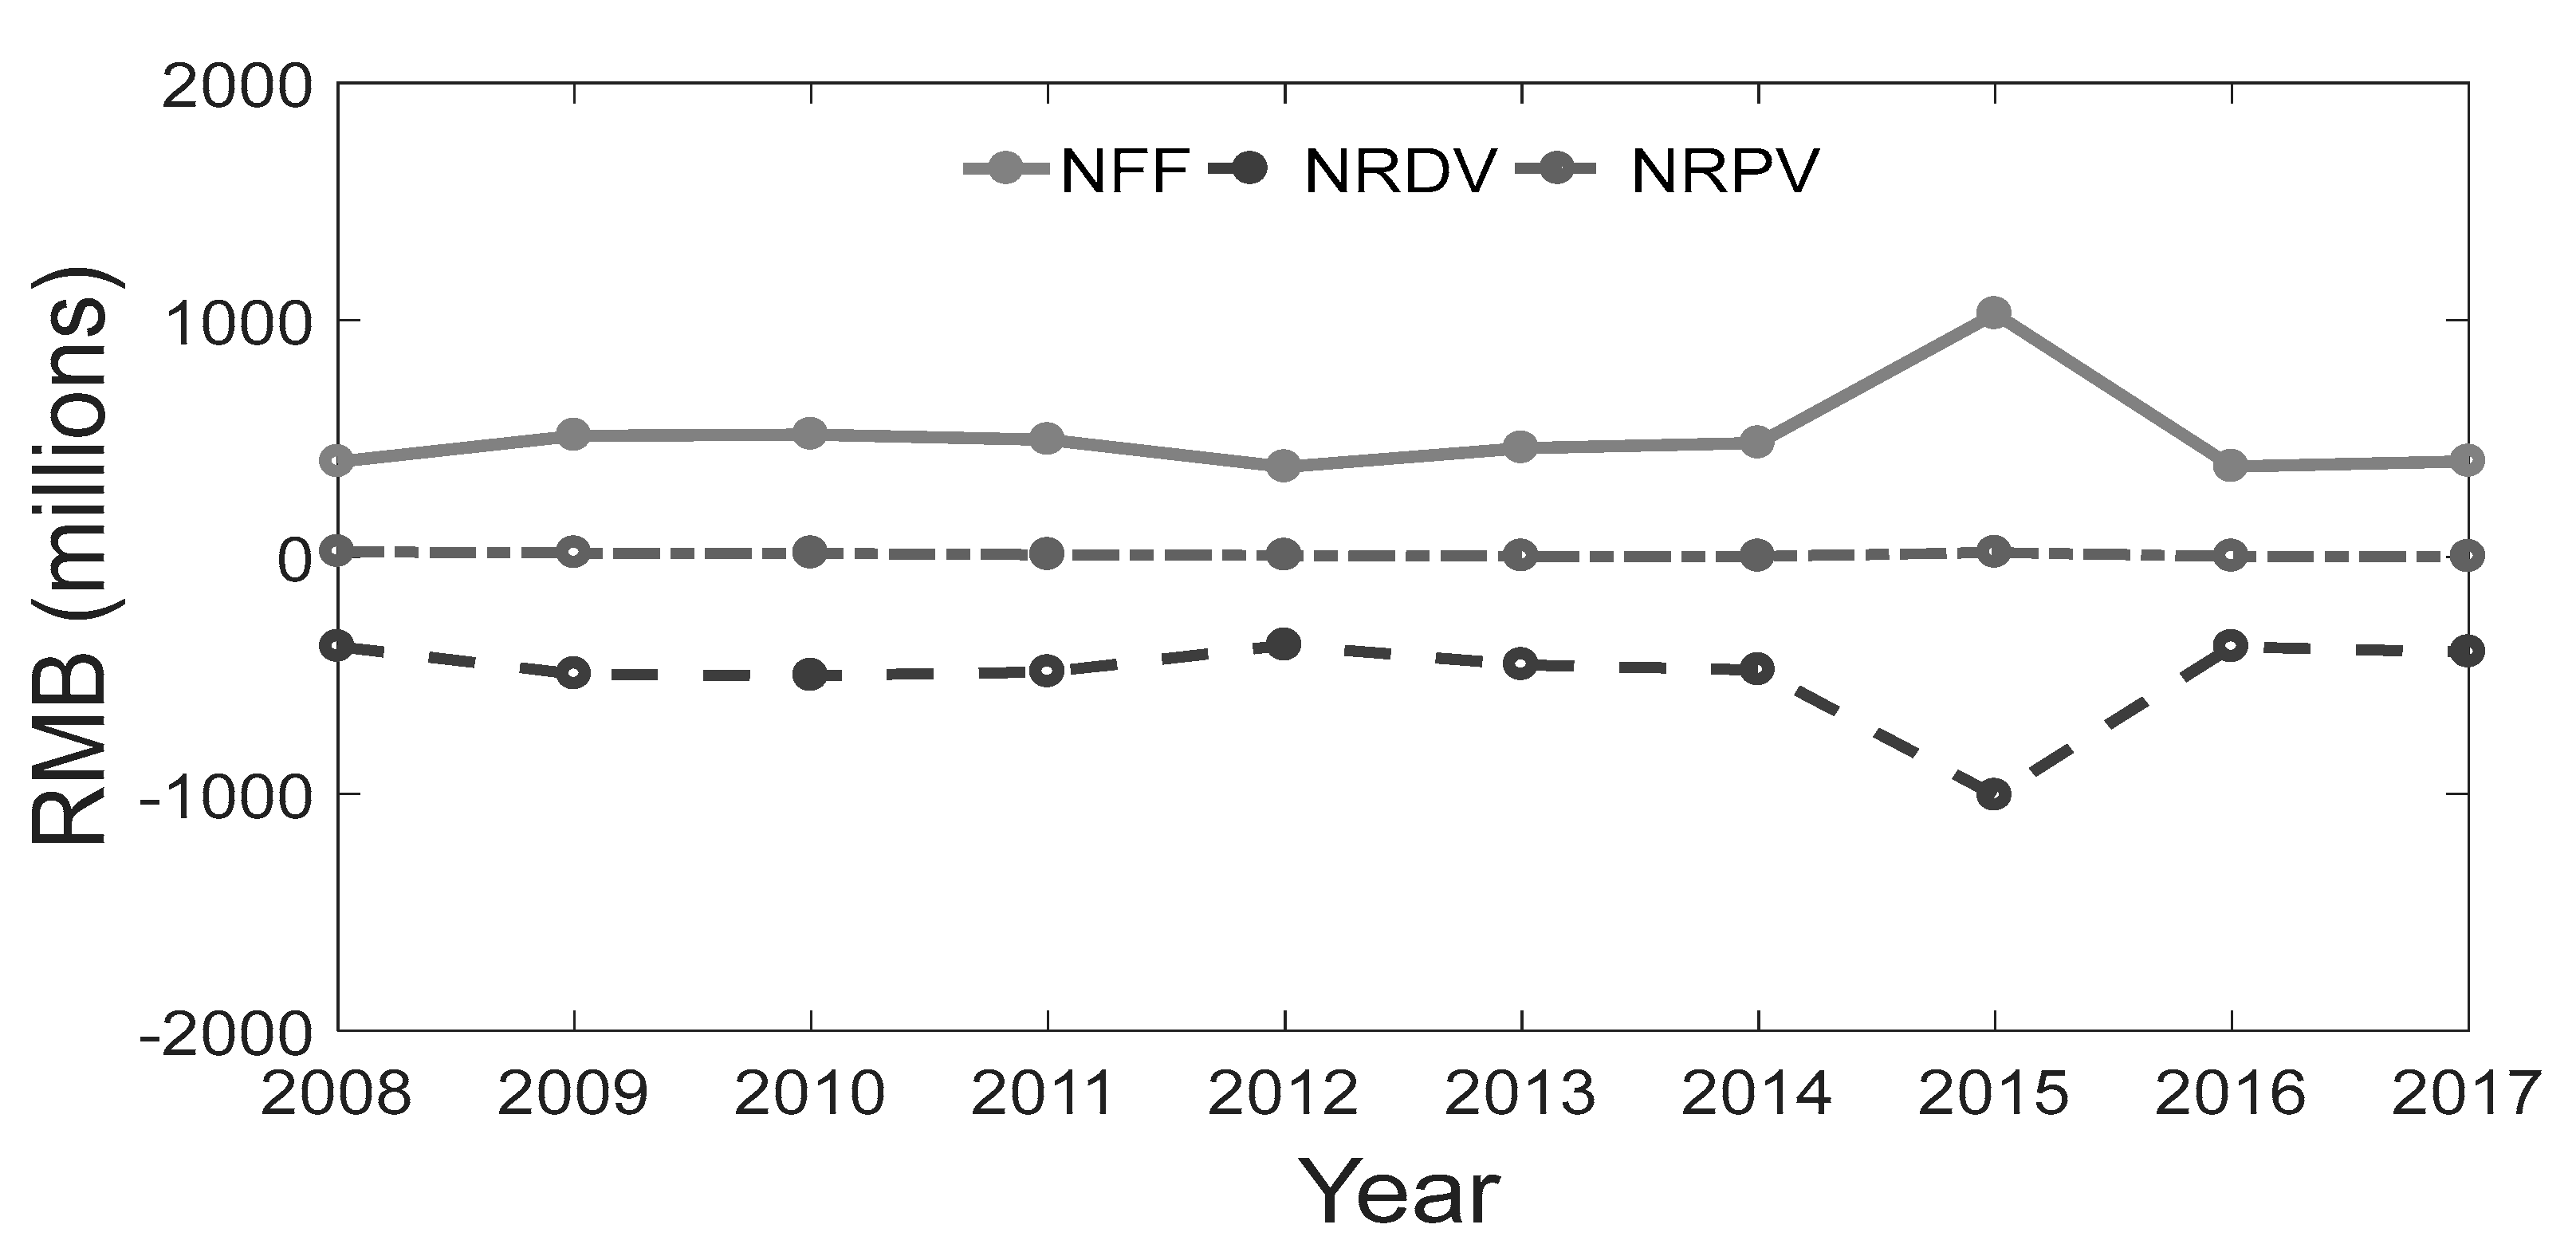
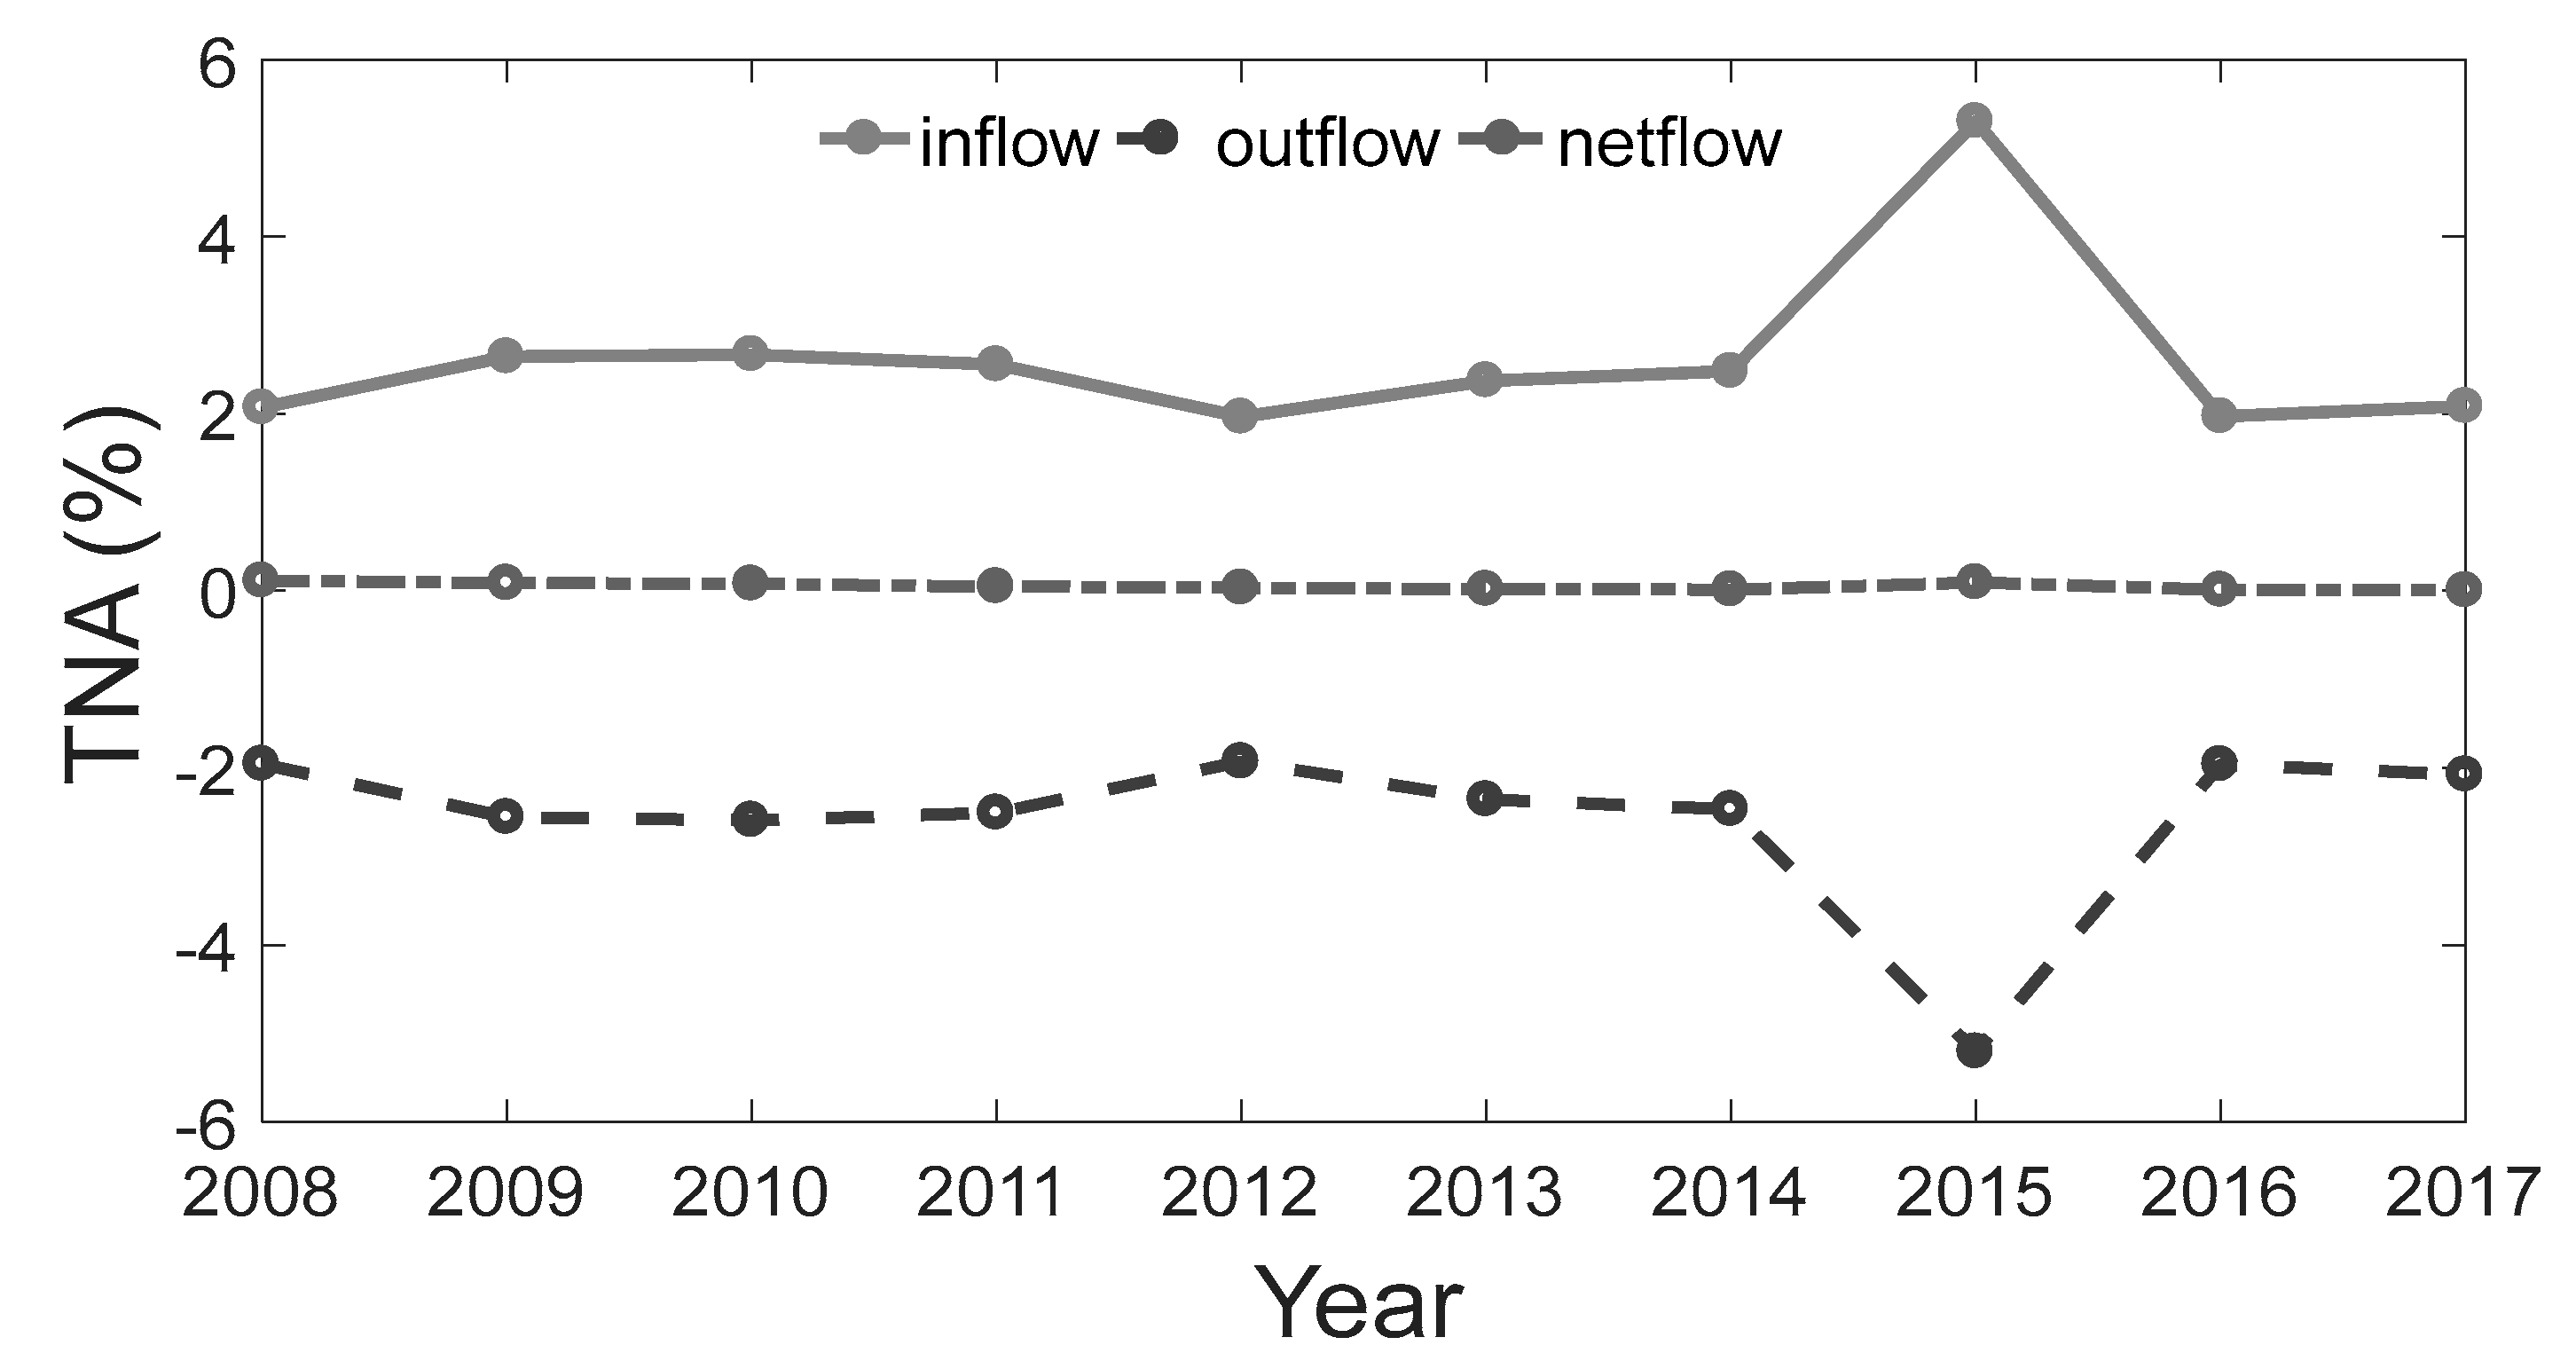
Table 1 provides the statistical descriptions of all variables in the model, and Table 2 presents the average fund flows across our sample for each year. Table 2 indicates that the outflows were negative throughout 2008–2017. Net fund flows increased over time from the beginning year to reach their peak in 2015, equivalent to 1026.046 million RMB. After that, the flows drastically dropped by roughly 63% in the consecutive year and slightly increased again in the last year (2017). These results shows that many factors affected the ups and downs of this flow in the 10-year period. Figure 1 and Figure 2, respectively, illustrate the fund flows in RMB and percentages of total net assets. They show a similar shape with a peak in 2015.
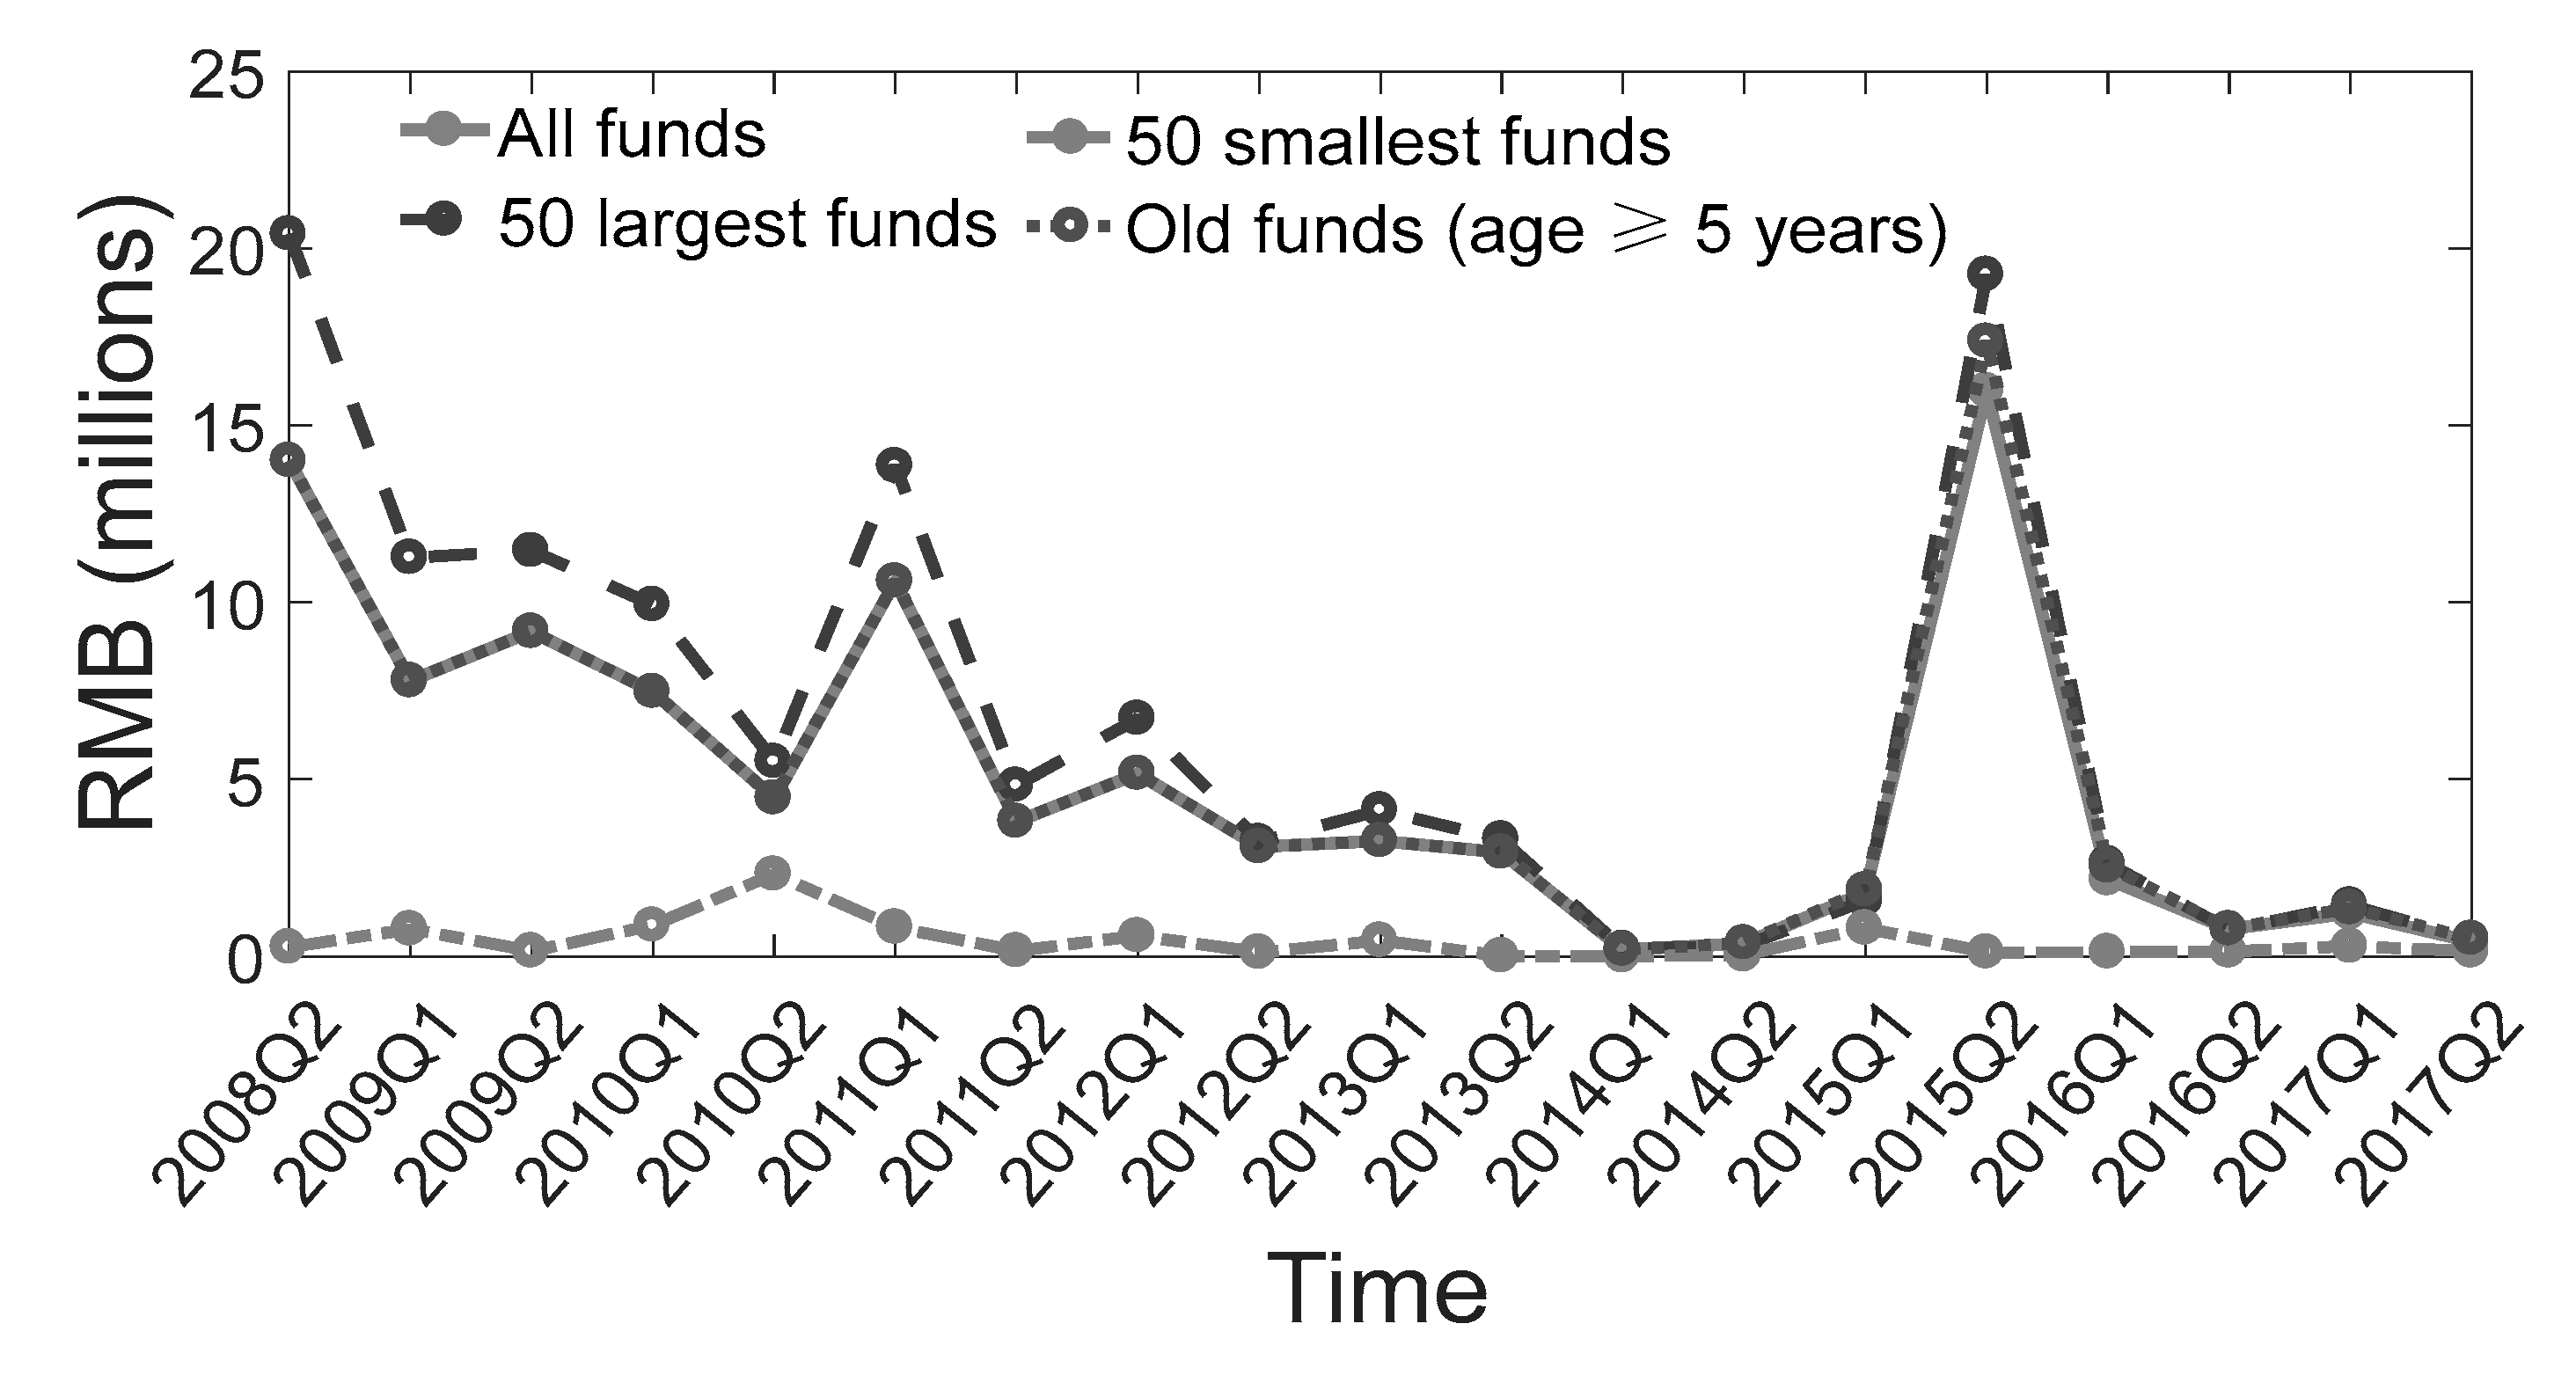
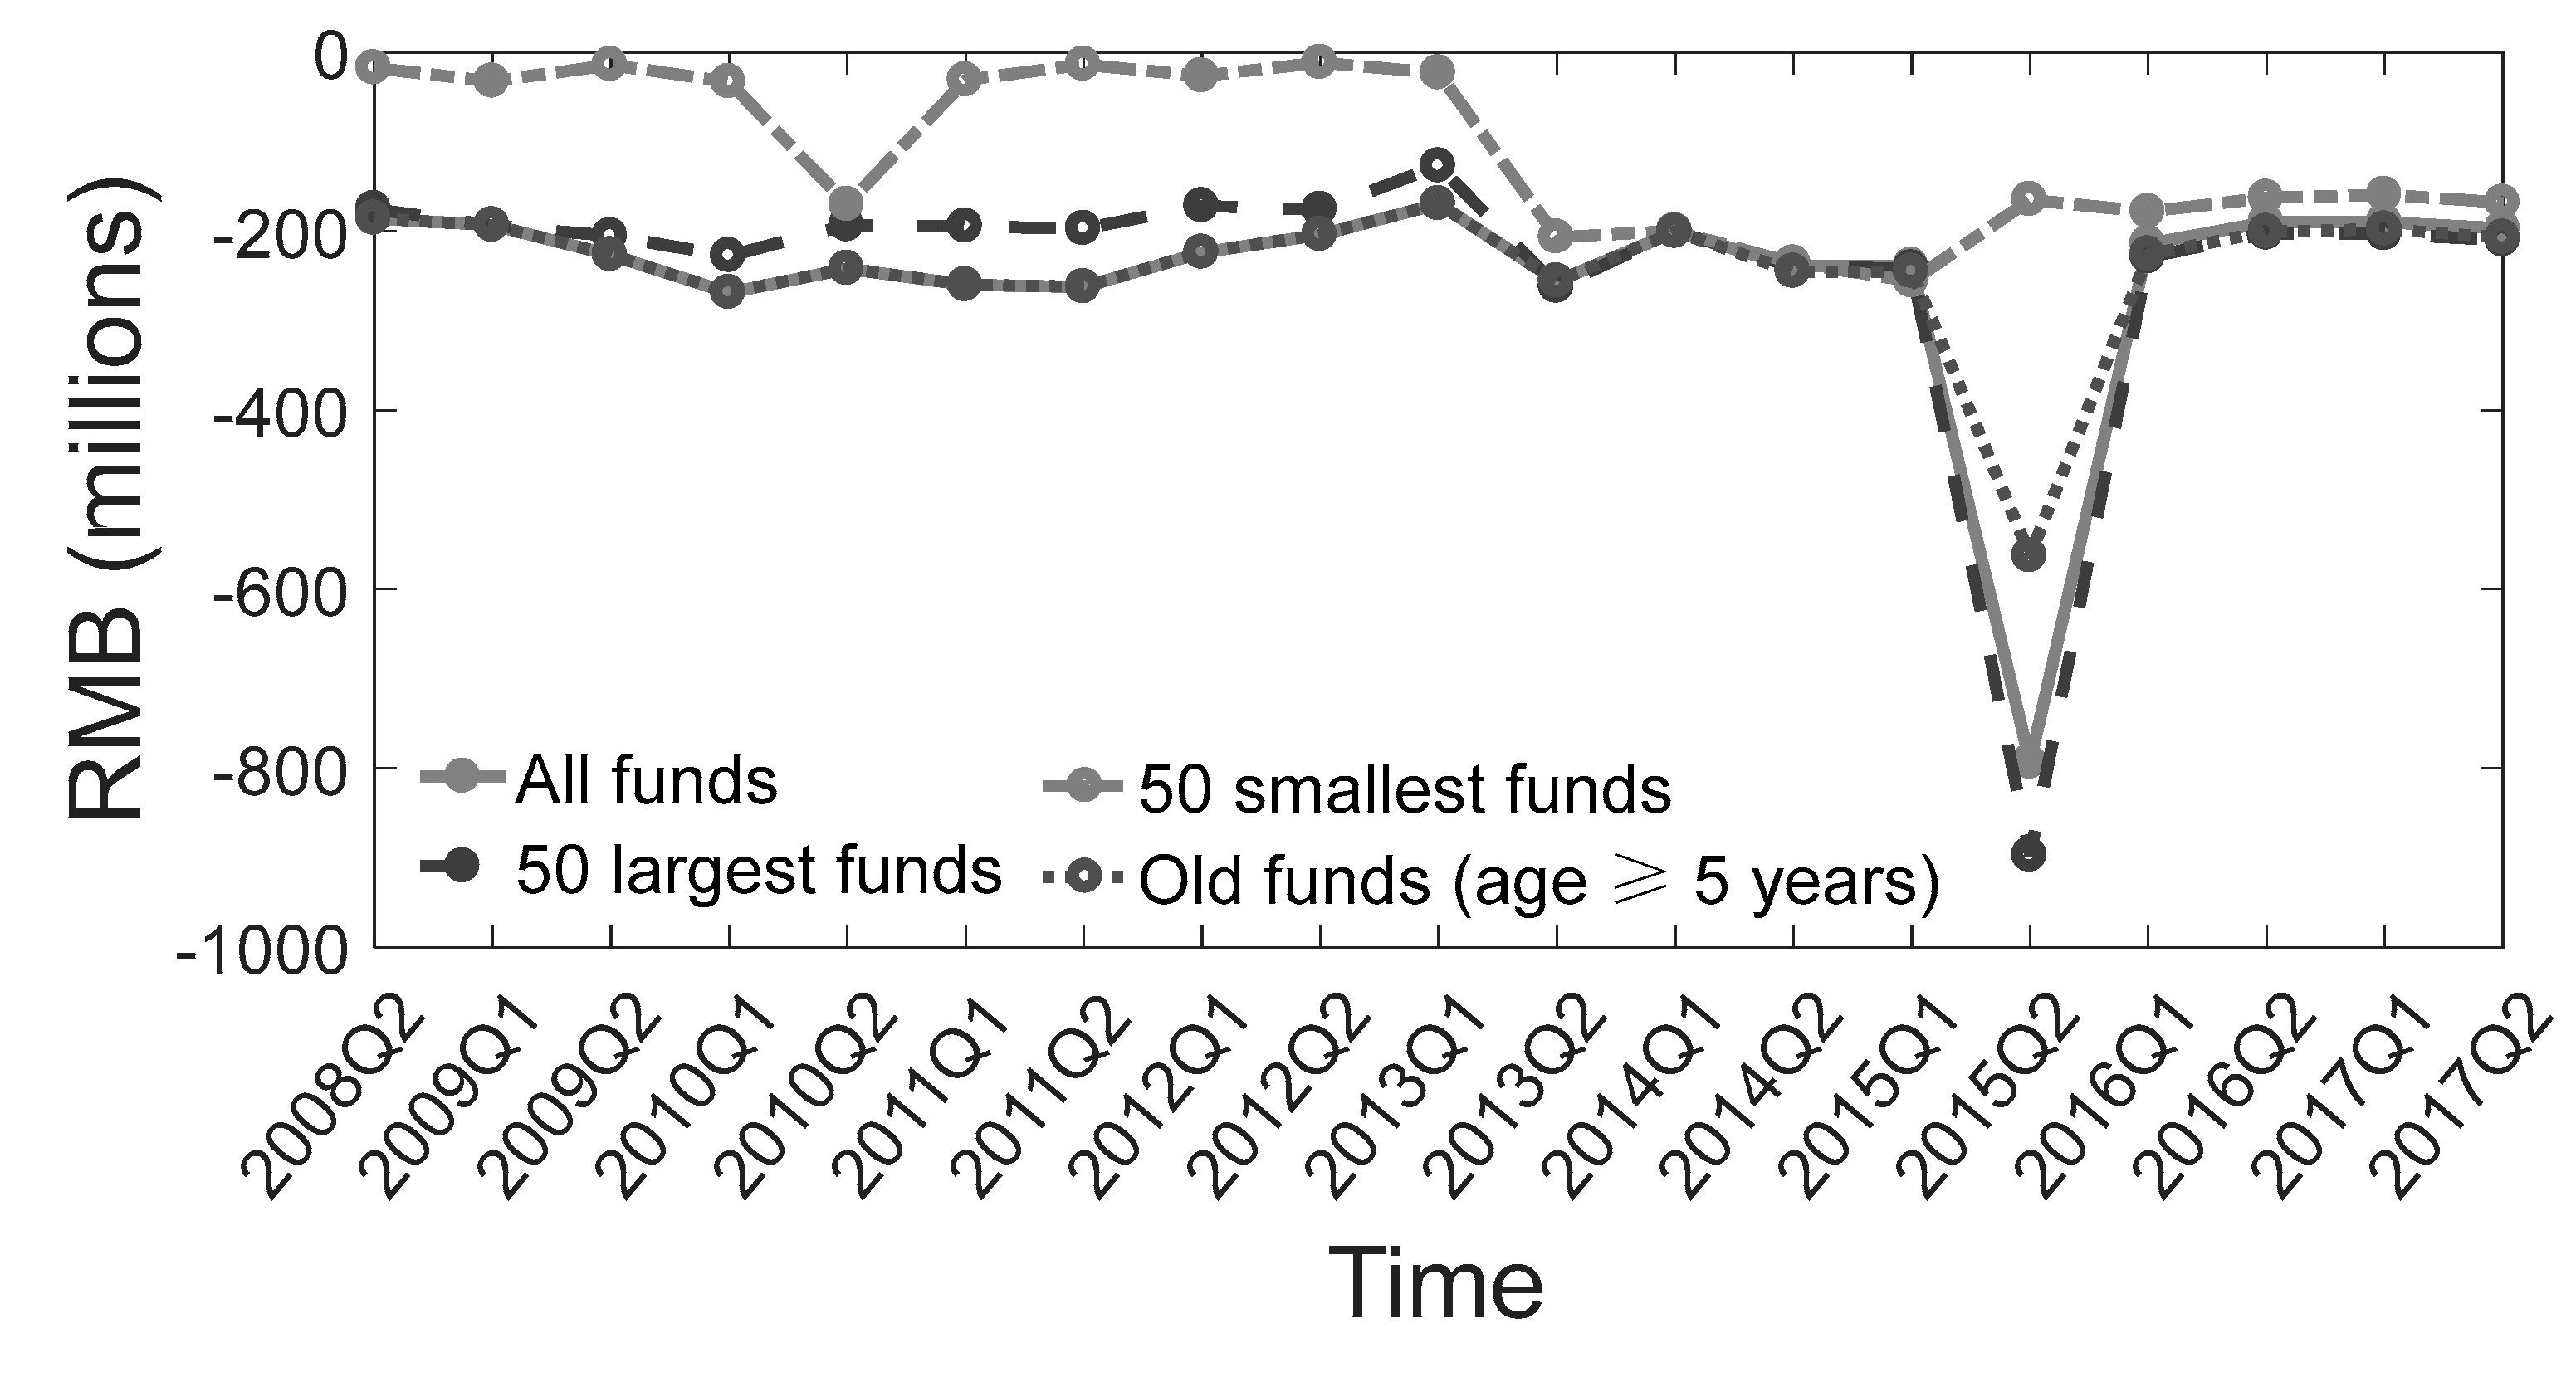
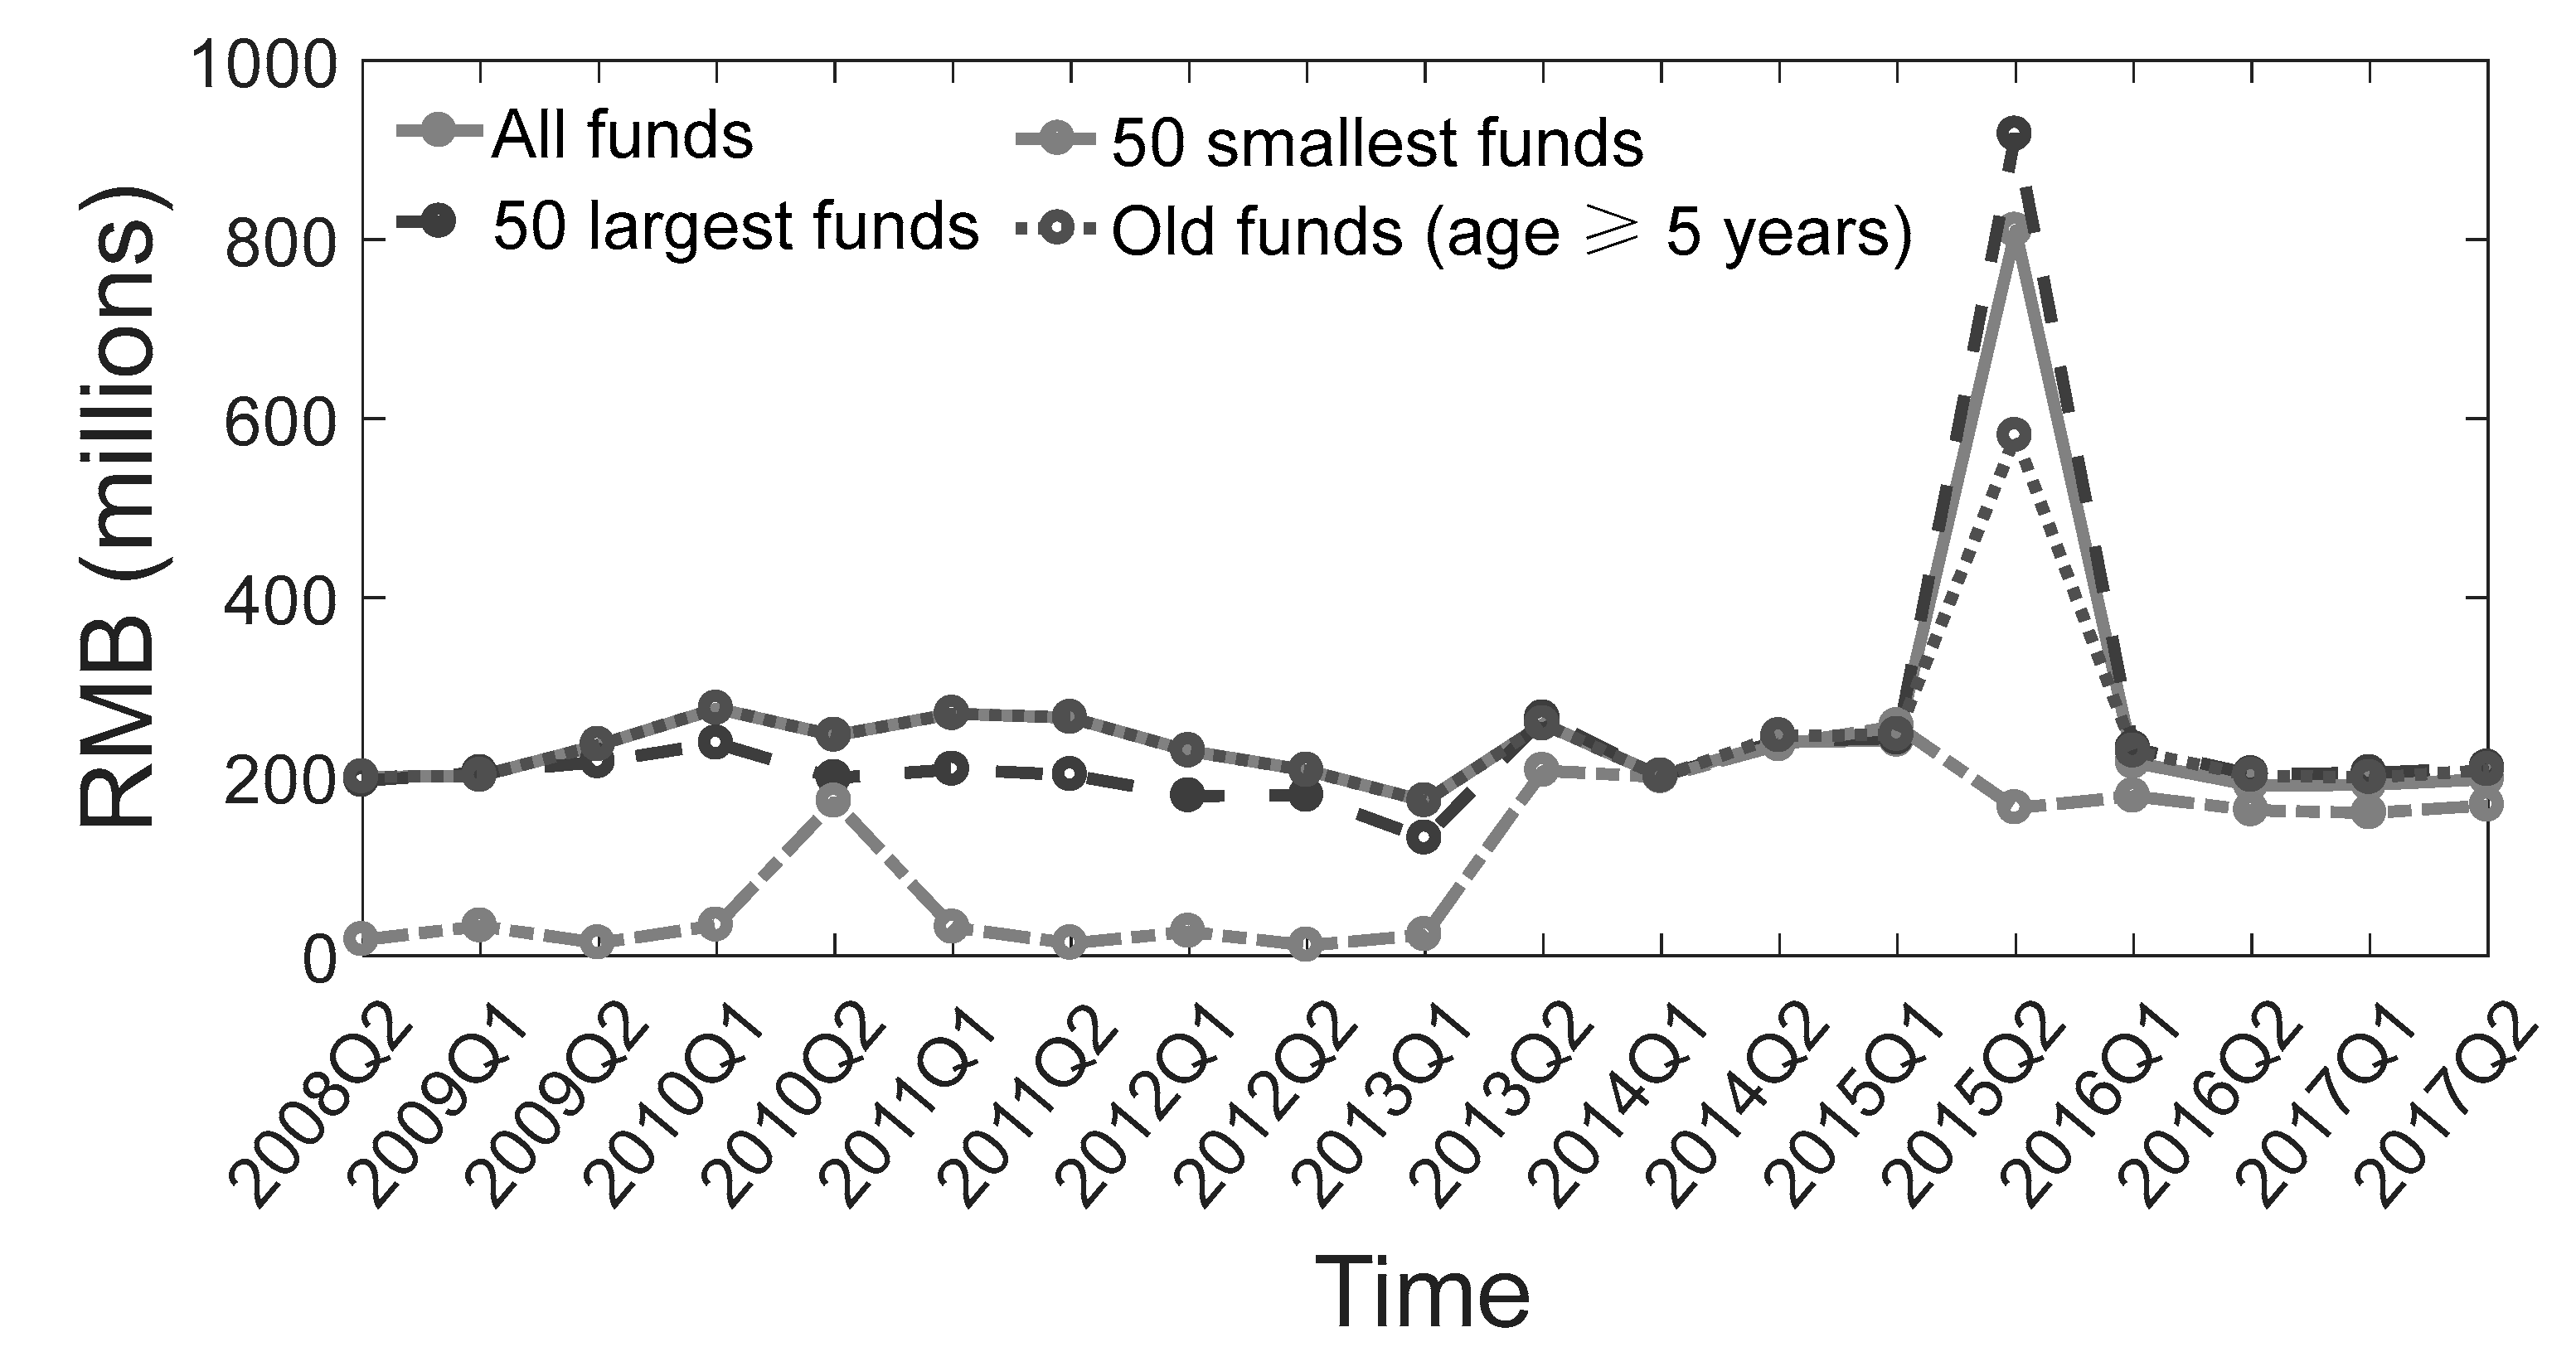
Figure 3, Figure 4 and Figure 5 describe the trends in average inflows, outflows, and net flows (in million RMB) on fund characteristics, respectively, in which Q1 and Q2 are the first and second halves of the year, respectively. A correlation matrix of all variables is presented in Table 3. As shown, the highest coefficient shows the relationship between the load fee and net fund flows; the coefficient of total fees with inflows is roughly 35%. Variance inflation factor tests were conducted, and all the results were lower than 10, demonstrating that multi-collinearity did not exist.
4.2. Regression Results
We ran an OLS regression. The results are presented in Table 4. Sirri and Tufano [8] investigated how the total fees, including operating expenses and load fees, influence the fund flow, and we re-estimated the influence. In Column 1 of Table 4, the results show that the total fees are significant negatively related to the net flow, in line with Sirri and Tufano [8]. A percentage increase in TFt is associated with a 0.041 percentage decrease in NFFt. This decrease in net flow may be contributed by the following reasons documented by researchers: (1) higher operating expenses associated with higher advertising fees or the unreasonable compensation of fund managers [48]; (2) a higher load fee, related to more salient fees charged before purchase or redemption [12,13,48]; (3) a higher load fee, related to higher unreasonable compensation for brokers and advisors [12]; and (4) a higher load fee, related to higher sunk costs. Theoretically, the coefficients of TNAi,t−1, MARt−1, and AGEt are positively significant, which means that investors prefer large, high performing, and old funds, consistent with findings reported by Barber et al. [13].
Then, we decomposed the total fees into operating expenses and load fees, as also performed by Barber et al. [13]. The results represented in Column 2 of Table 4 show that operating expenses have no influence on net flow, as also reported by Barber et al. [13], partially supporting H1a. The results imply that a high load fee impedes investment. Concretely, a percentage increase in the load fee is associated with a 0.041 percentage decrease in net flow, which supports H1b. A load fee is usually regarded as a marketing fee and distribution fee, whereas the positive effects of advertising and distribution are partially offset by the negative effect of the load fee being salient to investors [12,13], so investors rationally prefer low-cost funds [12]. Other variables indicate the same relationship with net flow, as shown in Column 1 of Table 4.
Ivković and Weisbenner [26] stated that aggregating inflow and outflow may induce a biased result, so it is necessary to decompose the net flow into inflow and outflow. Columns 3 and 4 of Table 4 exhibit the effect of fund fees on inflow and outflow. The coefficients of the load fee and operating expenses are significant but are close to zero in Column 3, implying that both fees have less influence on inflow. These results partially support H1a that the purchase of fund reacts less sensitively to operating expenses. This finding implies that investors sell more funds with an increasing load fee, which supports H1d. Opposite but similar values of the coefficients of the load fee in net flow and outflow indicate that the load fee decreases the net flow mainly through increasing the outflow. The increase in outflow is contributed by the salience featured by the load fee, whose negative effect always outweighs the marketing role of the fee [12,13]. Thus, investors are less prone to hold the fund with a higher load fee [12]. However, the relationship between operating expenses and outflow remains small and even becomes insignificant, which indicates that investor redemption is not sensitive to operating expenses. Overall, operating expenses have less impact on the fund inflow and outflow, which is the same as the impact on net flow, supporting H1a. Control variables are mostly insignificantly (or less) related to the inflow and outflow, and only AGEt and TNAt−1 are significantly and negatively related to the outflow.
Table 4 indicates that neither the load fee nor operating expenses significantly influence inflow because the amount of inflow is smaller than the amount of outflow. The insignificant relationship between the load fee and inflow was also documented by Ivković and Weisbenner [26]. They only found that the load fee impacts the outflow, and attributed the difference to the much lower amount of inflow than outflow. We also tried to explain the insignificant relationship between the load fee and inflow by comparing the scales of inflow and outflow, as did Ivković and Weisbenner [26]. A t-test was implemented, and the results are presented in Table 5.
Table 5 reports the t-test results for the mean values of inflow and outflow from 2008 to 2017. The mean value of the inflow is significantly smaller than the outflow crosses for all years except for 2008. The degree of significance increased since 2008, and the difference became significant at the 1% level after 2013. The average mean value of inflow is 0.314 million, but this outflow value is 387.294 million. The difference is so large that it cannot be ignored when analyzing the investors’ sensitivity to fees. Rea and Marcis [49] explained that large outflow always occurs except in markets in the rapid development stage. Huang et al. [21] observed that the inflow is only larger than outflow in a bull market and explored the impact of the fund fee on the inflow, but they did not find any relationship between the fund fee and redemption since the amount of outflow is so small. Many researchers have found that the outflow always exceeds the inflow, and the net flow has been less than zero in recent years [9,37,50].
The results of the effect of performance on the fund flow–load fee relationship are reported in Table 6. Operating expenses decrease the net flow and increase the outflow, but their coefficients are not significant. Even though the expenses are significantly associated with the inflow, their coefficient is so small that it does not imply that operating expenses increase purchasing, confirming H1a. Generally, investors react less sensitively to operating expenses, consistent with the findings reported Barber et al. [13]. We found no significant coefficients of MARt−1 × LFt−1, which means that performance does not affect the fund flow–load fee relationship for the full sample, since investors may consider the performance and load fee separately [24], so no evidence supports H2a, H2b, and H2c. The coefficients of MARt−1 are positive and significant regarding net flow and inflow, which means that higher performance attracts more investors [12], whereas the insignificant coefficient of MARt−1 regarding outflow implies that investors are not sensitive to the performance when they redeem funds. The coefficient of LFt−1 in inflow is so small that it does not indicate whether the load fee influences purchasing, which can be explained by the much smaller amount of purchasing, and it does not support H1c. Thus, the negative and significant coefficient of LFt−1 in net flow contributes to the opposite coefficient in outflow. For outflow, an increasing load fee increases redemption; a percentage increase in LFt−1 leads to a 0.042 percentage increase in outflow, and these results confirm H1b and H1d. The results show that Chinese investors are sophisticated, and will hold funds with lower load fees and directly purchase funds through fund companies [12].
We followed Huang et al. [21] by dividing the sample into quintiles based on their performance, and the results for the highest and the lowest quintiles were defined as high performance and low performance, respectively. The median was defined as high–low. The results are shown in Table 7. The coefficients of the load fee are not significant for the net flow, inflow, and outflow over the high performance range. This implies that the load fee does not influence the flow of the high performance fund due to the distraction effect, which indicates that investors make decisions based on other factors instead of the load fee in well-performing funds. Ferreira et al. [22] also found an insignificant relationship between participant costs and fund flow in the high performance funds of developed countries where investors are sophisticated. Huang et al. [21] found that low load fees cannot bring a new money increase with incremental performance because investors have already overcome participant costs to buy high performance funds. In this case, high load fees do not influence investors to sell funds with decreasing performance due to the distraction effect [11]. These findings explain the insignificant coefficients of the interaction term over an extremely good performance range. However, the coefficient of MARt−1 is positively significant to the inflow over a high performance range, which confirms that higher performance can attract more investment [8,51]. For the outflow of the mid-range performance funds, the coefficient of MARt−1 indicates that higher performance always accompanies higher redemption, which can be explained by the disposition effect—higher performance makes investors sell more funds to obtain short-term profits, whereas they sell less of the poorly performing funds [47,52]. This unsophisticated behavior is commonly observed in China [29,30]. Higher load fees result in more redemption, as inferred from the negative coefficient of LFt−1 in the outflow, confirming H1d. The negative coefficient of the interaction variable in the outflow indicates that performance decreases the outflow–load fee sensitivity in the median performance group, partially supporting H3b. In other words, a higher load fee induces incremental redemption as the performance decreases in a moderately performing fund. In this case, the disposition effect is mitigated by the high load fee because a high load fee with worse performance influences investors to sell the relatively poorly performing funds. The coefficient of LFt−1 becomes insignificant in the inflow, which means that the load fee will not affect the fund purchase, as illustrated by the much smaller inflow. For the net flow, the negative and significant coefficients of LFt−1 and MARt−1 indicate a higher load fee, and a higher performance means fewer investors hold the fund due to their aversion to load fees and the disposition effect, respectively. However, since the performance strengthens the net flow–load fee relationship, indicated by the positive coefficient of LFt−1 × MARt−1 in the net flow, the result does not support H3b. A reason for results contrary to the hypothesis is that investors prefer to hold a fund with decreasing performance with a lower load fee rather than buying a better-performance fund with a low load fee according to the insignificant coefficient of the interaction term in the inflow. Once the performance drops to a low performance level, the performance, load fee, and their interaction variable are no longer significantly related to the inflow and net flow, which supports H3c. The insignificant coefficients of LFt−1, MARt−1, and their interaction term imply that a higher load fee and higher performance do not lead to more purchases over an extremely poorly performing range, and the two factors will not influence the flow mutually, as also reported by Huang et al. [21] and Ferreira et al. [22]. A disposition effect also exists because a poorly performing fund cannot significantly influence investors to sell funds [11]. Unfortunately, according to the insignificant coefficients of LFt−1 and LFt−1 × MARt−1 in the outflow, a higher load fee does not influence investors to sell more funds, even if the fund performance is decreasing.
Generally, we reached three conclusions. Even though performance does not dampen the flow–load fee sensitivity in the full sample, it still influences the sensitivity to different degrees across performance levels. (1) As performance exceeds the superior level, the insignificant coefficients of the load fee do not affect the net flow, inflow, and outflow due to the distraction effect, as also shown by Ferreira et al. [22]. The significant coefficient of MARt−1 in the inflow confirms that higher performance can attract more investment in the high performance group [8,51]. Huang et al. [21] found that enough investors have already overcome the participant cost to invest in high performance, so a lower cost does not attract more investors with increasing performance, and Iannotta and Navone [36] documented that a higher fund fee does not result in more sales of relatively poorly performing funds. This can explain the insignificant coefficients of the interaction term in the high performance group. (2) For investors in moderately performing funds, both higher performance and a higher load fee increase their redemption, and a higher load fee influences them to sell more funds with decreasing performance. In this case, a higher load fee will support investors’ rationale to sell more poorly performing funds and mitigate the disposition effect. Both lower performance and a lower load fee can increase the net flow by reducing the redemption, and a lower load fee can influence investors to hold funds with decreasing performance, which further increases the net flow. (3) As the performance drops below a certain level, the load fee and performance do not affect the fund flow. The disposition effect is observable but it cannot be relieved by a high load fee, as inferred by the insignificant coefficient of the interaction term in the outflow. The insignificance of the interaction term in the inflow and net flow are in line with those previously reported [21,22], indicating that purchase is also not influenced by the participant cost and performance over an extremely poor performance range, and it is impossible for investors to be further affected by their interaction term.
Generally, even though investors in moderate performance funds decrease redemption with decreasing performance, which is widespread irrational investor behavior, a higher load fee will increase the redemption instead, which is a symbol of sophisticated investment [12,13]. Thus, investors in median performance funds are relatively rational, since a high load fee increases sales as performance decreases. The load fee can recall investor rationality and mitigate the disposition effect in moderately performing funds. Differing from previous studies, which mostly found significant coefficients of either the interaction term between the performance and participant cost or the interaction terms between the performance and operating expenses in net flow under different performance levels [12,22,24], we found that the interaction term between performance and load fee is negatively related to the outflow across different performance levels, which enriches the related literature.
Table 8 shows how the fund fee influences fund flows in different fund sizes, as demonstrated by Alves and Mendes [53]. We divided the sample into quintiles by TNA, and the results for the highest and the lowest quintiles are defined as large and small funds, respectively. The median was defined as large–small. None of the coefficients documenting operating expenses influenced the fund flow, similar to the results reported by Barber et al. [13]. The load fee does not affect the inflow regardless of its size. For both the outflow and net flow, coefficients of the load fee were found to be significant but small in the large group. However, the load fee has a stronger positive influence on the outflow in the median and small funds. In small funds, a percentage increase in the load fee results in a 0.094 percentage increase in the outflow and a 0.094 percentage decrease in the net flow. The influences are similar in the small and median funds, and the only difference is that the magnitude of change in the load fee for the median fund group is smaller than in the small fund group, which affects the outflow and net flow (0.002% and −0.002%, respectively). The results shown in Table 7 confirm the findings in Table 5: most investors react negatively to the load fee in the net flow and positively to the outflow, except for investors in large funds. The distraction effect can be used to illustrate the insignificant influence of the load fee on large funds. Investors in large funds pay more attention to the other characteristics of funds, such as risk variance, so they may not be influenced by the load fee, whereas investors of medium and small funds pay more attention to the load fee. This explanation is confirmed by the results showing that the coefficients of RVi,t−1 are significant and positive in large funds but become insignificant in the medium and small funds, which indicates that investors of large funds can be attracted by other fund characteristics beyond the load fee.
Table 9 shows how the fund fee influences fund flows for different ratios of institutional investors. We divided the sample into quintiles by share of institutional investors (institution), and the results for the highest and the lowest quintiles are defined as high and low institutions, respectively. The median is defined as the large−small. None of the operating expense coefficients were found to influence the fund flow. The load fee was shown to increase redemption in the low institution group. Due to inexperience and natural instinct, researchers view individual investors as more responsive to up-front expenses [9,11,12,13]. The results shown in Table 8 confirm this finding because only low ratio institution investors increase their redemption with an increasing load fee. A percentage increase in load fee is associated with a 0.094 percentage increase in redemption, which implies that individual investors are more sensitive to the fund flow.
Table 10 shows how the fund fee influences the fund flow in aggressive growth funds, growth funds, and income growth funds. We divided the sample according to this classification since these three categories of funds have different levels of risk and return [44], which may have different influences on the relationship between the fund fee and fund flow. The classification data can be found in CSMAR, and the standard of classification is explicitly described in CSMAR as follows: (1) The funds that invest in stocks with high return and aggressive growth are classified as aggressive growth funds, (2) the funds which invest in stocks with above-average growth are grouped into growth funds, and (3) the funds that invest in bond or preferred stocks are categorized as income funds. Aggressive growth stocks and above-average growth stocks, in which aggressive growth funds and growth funds mainly invest, have high returns even though they sometimes do not pay a dividend. Table 10 shows that none of the operating expenses influence the fund flow, confirming H1a, which is consistent with a previous finding [13]. The load fee does not impact the inflow across the three kinds of funds. The coefficients of the load fee are only negatively significant in terms of net flow and positively significant in terms of outflow in income growth funds. A percentage increase in load fee leads to a 0.083 percentage decrease in net flow and a 0.083 percentage increase in outflow. These results can also be explained by the distraction effect, where investors in aggressive growth funds and growth funds may pay much more attention to the high return of their fund instead of the load fee.
Table 11 presents how the fund fee influences the fund flow at different levels of liquidity. We divided the sample into quintiles by turnover (TR), and the results for the highest and lowest quintiles are defined as high and low liquidity funds, respectively. The median is defined as high–low. Consistent with the above results, the operating expenses do not influence the fund flow, and the load fee does not impact the inflow. The load fee only significantly decreases the net flow and significantly increases the outflow in the median liquidity group. The investors of high liquidity funds may be more interested in high liquidity rather than load fees because high liquidity always indicates good performance [45]. Low liquidity funds cannot attract more investors and load fees cannot further influence investor behavior [5,6].
4.3. Robustness Tests
The segment of the full sample based on structural break tests coincides with the Chinese financial situation. In Figure 3, a peak of total assets can be observed in 2015 since Chinese security markets encountered a huge financial crisis in 2015. The trade volume developed rapidly in the first half of 2015 and peaked in June 2015, after which it dropped dramatically. The financial crisis may have resulted in structural shifts in marketing costs and other control variables and further influenced the fund flow [5,6], so we tested whether a structure break occurred in 2015. The significant changes in the slopes of the load fee and other control variables, such as the fund flow, indicates a structure shift in 2015. We used the Chow test to examine the structural break, which Oh et al. [38] used to investigate the effect of regulated caps on the load fee peak in 2000. The results are shown in Table 12. The Chow [54] F-statistic and p-value were calculated for the year 2015, which indicated the existence of a structural break of the regression on the net flow (F-value = 5.56, p-value = −0.004) and outflow (F-value = 5.56, p-value < 0.004) in 2015. We did not find a structure break in the coefficients of load fees because none of the p-values of the coefficients were less than 0.05. Thus, the break in 2015 did not influence the estimation of load fees.
5. Conclusions and Implications
The central purpose of this study was to gain a deeper understanding of the relationship between the fees and flows of open-end funds in an emerging market, i.e., China. We provide fresh insights into the behavior of investors in Chinese open-ended fund markets. Our findings can, therefore, be valuable to key stakeholders, such as foreign investors and institutions, who want to enter the Chinese financial market, which are important contributors to sustainable economic growth in China. The findings can help guide managers of funds and Chinese governments to attract more foreign investment for sustainable development in China.
We found that the load fee is positively and significantly related to the outflow and insignificantly related to the inflow, which indicates a negative relationship with the net flow. However, operating expenses have no significant influence on the inflow, outflow, or net flow, since the coefficients of operating expenses are not significant in all of the regression models. These results indicate that investors are more sensitive to the load fee than operating expenses, which is consistent with Barber et al. [13], and investors act intelligently by selling high-load-fee funds in China, consistent with the results reported by Houge and Wellman [12]. We also examined whether the role of fund performance in fund flow can be substituted by load fees and found that the load fee can be substituted for the role of outflow in moderately performing funds. In other words, a higher load fee increases redemption with decreasing performance in moderately performing funds, where the disposition effect is mitigated by the load fee. This also indicates that most Chinese investors react negatively to load fees. Dividing the 240 open-ended funds into several sub-samples based on their TNA, growth-oriented classification, turnover rate, and institutional investors’ proportion, we offer insight into investor behavior in investment decisions. Especially, we confirm that investors of medium and small funds react more sensitively to fund fees than investors in large finds, and investors in funds with median liquidity are more sensitive to load fees. Investors in income funds, who are prone to sacrificing higher returns for lower risk, react more sensitively to load fees. These results all support the distraction effect. Institutional investors are not affected by load fees, unlike individual investors. The robustness test showed no significant differences between the effect of load fees on fund flows before and after 2015. This test confirmed that the load fee decreases the net flow by increasing the outflow.
Our findings provide guidelines for managers, investors, and governments under sustainable economic growth in China. Managers need to continue to pay attention to this type of fee since the empirical results indicated that investors in China are sensitive to load fees. In reality, management methods should be applied so the load fee is as low as possible; as such, the inflows increase and the outflows decrease. The declining tendency of the load fee will produce some positive effects: first, it directly decreases the barrier for investors to buy funds; second, it creates a positive impact by restraining the investors from selling the funds.
Investors in the open-end funds in China need to draw attention to load fees before selling funds. Higher load fees make investors in moderately performing funds sell their worst-performing funds. However, the load fee does not play a significant role in poorly performing funds, which need to be sold. This indicates that investors should pay more attention to the load fee, not only in relatively funds that are performing well but also in poorly performing funds.
The formal financial sector has played a crucial role in financing the growth-driven engines of the economy. To sustainable develop of open-end funds in China, and according to our result that the negative effect of salience always outweighs the positive effect of the advertising role of the load fee, we suggest that the government encourage more efficient methods to distribute funds and efficiently use the load fee as an advertising or distribution fee.
A limitation of our study is that we were unable to segment the load fees into front-end and back-end fees since the data of these two fees were not presented separately in the relevant database or on websites. Thus, future research should try to split the two kinds of fees and explores their influence on investor behavior. This would provide fresh insights into the influence of the composition of load fees on fund performance and fund flow.
Author Contributions
Conceptualization, Y.X.; methodology, Y.X.; software, Y.X.; validation, Y.X.; formal analysis, Y.X.; investigation, Y.X.; resources, H.Q.; data curation, Y.X. and T.X.; writing—original draft preparation, Y.X.; writing—review and editing, H.Q.; visualization, H.Q.; supervision, H.Q.; funding acquisition, H.Q.
Funding
This research received no external funding.
Conflicts of Interest
The authors declare no conflict of interest.
References
- Qamruzzaman, M.; Wei, J. Financial Innovation, Stock Market Development, and Economic Growth: An Application of ARDL Model. Int. J. Financ. Stud. 2018, 6, 69. [Google Scholar] [CrossRef]
- Paun, C.V.; Musetescu, R.C.; Topan, V.M.; Danuletiu, D.C. The Impact of Financial Sector Development and Sophistication on Sustainable Economic Growth. Sustainability 2019, 11, 1713. [Google Scholar] [CrossRef]
- Meng, S.; Yan, J.; Cao, X. Heterogeneity in top management teams and outward foreign direct investment: Evidence from Chinese listed companies. Front. Bus. Res. China 2019, 13, 16. [Google Scholar] [CrossRef]
- Huang, Y.; Liang, B.; Wu, K. Does Mutual Fund Working Experience Affect Private Fund Performance? Available SSRN 2019. [Google Scholar] [CrossRef]
- Bogle, J.C. Common Sense on Mutual Funds: New Imperatives for the Intelligent Investor; John Wiley & Sons: Hoboken, NJ, USA, 1999. [Google Scholar]
- Bogle, J.C. Common Sense on Mutual Funds, Fully updated 10th Anniversary Edition; Wiley: Hoboken, NJ, USA, 2010. [Google Scholar]
- Williamson, O.E. Markets and Hierarchies; Free Press: New York, NY, USA, 1975; Volume 2630. [Google Scholar]
- Sirri, E.R.; Tufano, P. Costly search and mutual fund flows. J. Financ. 1998, 53, 1589–1622. [Google Scholar] [CrossRef]
- Wang, J.Y.; Gao, M.; Liu, Y.J. Out of sight, not out of mind: The evidence from Taiwan mutual funds. Int. Rev. Econ. Financ. 2015, 37, 138–156. [Google Scholar] [CrossRef]
- Barber, B.M.; Huang, X.; Odean, T. Which Factors Matter to Investors? Evidence from Mutual Fund Flows. Rev. Financ. Stud. 2016, 29, 2600–2642. [Google Scholar] [CrossRef]
- Barber, B.M.; Odean, T.; Zheng, L. The behavior of mutual fund investors. Unpublished working paper. 2000. [Google Scholar]
- Houge, T.; Wellman, J. The use and abuse of mutual fund expenses. J. Bus. Ethics 2007, 70, 23–32. [Google Scholar] [CrossRef]
- Barber, B.M.; Odean, T.; Zheng, L. Out of sight, out of mind: The effects of expenses on mutual fund flows. J. Bus. 2005, 78, 2095–2120. [Google Scholar] [CrossRef]
- Anufriev, I.S.; Sharypov, O.V.; Dekterev, A.A.; Shadrin, E.Y.; Papulov, A.P. Study of flow structure in a four-vortex furnace model. Thermophys. Aeromech. 2017, 24, 849–855. [Google Scholar] [CrossRef]
- Christoffersen, S.E.; Evans, R.; Musto, D.K. What do consumers’ fund flows maximize? Evidence from their brokers’ incentives. J. Financ. 2013, 68, 201–235. [Google Scholar] [CrossRef]
- Hoberg, G.; Kumar, N.; Prabhala, N. Mutual Fund Competition, Managerial Skill, and Alpha Persistence. Rev. Financ. Stud. 2017, 31, 1896–1929. [Google Scholar] [CrossRef]
- Bergstresser, D.; Chalmers, J.M.; Tufano, P. Assessing the costs and benefits of brokers in the mutual fund industry. Rev. Financ. Stud. 2008, 22, 4129–4156. [Google Scholar] [CrossRef]
- Cremers, M.; Ferreira, M.A.; Matos, P.; Starks, L. Indexing and active fund management: International evidence. J. Financ. Econ. 2016, 120, 539–560. [Google Scholar] [CrossRef]
- Cox, J.D.; Payne, J.W. Mutual Fund Expense Disclosures: A Behavioral Perspective F. Hodge O’Neal Corporate and Securities Law Symposium: Mutual Funds, Hedge Funds, and Institutional Investors. Wash. Univ. Law Q. 2005, 83, 907–938. [Google Scholar]
- Hou, K.; Moskowitz, T.J. Market Frictions, Price Delay, and the Cross-Section of Expected Returns. Rev. Financ. Stud. 2005, 18, 981–1020. [Google Scholar] [CrossRef]
- Huang, J.; Wei, K.D.; Yan, H. Participation costs and the sensitivity of fund flows to past performance. J. Financ. 2007, 62, 1273–1311. [Google Scholar] [CrossRef]
- Ferreira, M.A.; Keswani, A.; Miguel, A.F.; Ramos, S.B. The flow-performance relationship around the world. J. Bank. Financ. 2012, 36, 1759–1780. [Google Scholar] [CrossRef]
- Wang, Y.; Watson, J.; Wickramanayake, J. The global financial crisis and the mutual fund flow–performance relationship. World Econ. 2018, 41, 3172–3193. [Google Scholar] [CrossRef]
- Navone, M. Investors’ distraction and strategic repricing decisions. J. Bank. Financ. 2012, 36, 1291–1303. [Google Scholar] [CrossRef]
- Kim, M.S. Changes in mutual fund flows and managerial incentives. Available SSRN 2018. [Google Scholar] [CrossRef]
- Ivković, Z.; Weisbenner, S. Individual investor mutual fund flows. J. Financ. Econ. 2009, 92, 223–237. [Google Scholar] [CrossRef]
- Bergstresser, D.; Poterba, J. Do after-tax returns affect mutual fund inflows? J. Financ. Econ. 2002, 63, 381–414. [Google Scholar] [CrossRef]
- Hersey, P.; Blanchard, K.H.; Johnson, D.E. Management of Organizational Behavior; Prentice Hall: Upper Saddle River, NJ, USA, 2007; Volume 9. [Google Scholar]
- Chen, R.; Gao, Z.N.; Zhang, X.Y.; Zhu, M. Mutual Fund Managers’ Prior Work Experience and Their Investment Skill. Financ. Manag. 2018, 47, 3–24. [Google Scholar] [CrossRef]
- Qureshi, F.; Kutan, A.M.; Khan, H.H.; Qureshi, S. Equity fund flows, market returns, and market risk: Evidence from China. Risk Manag. 2019, 21, 48–71. [Google Scholar] [CrossRef]
- Hu, J.W.S.; Yen-Hsien, L.; Ying-Chuang, C. Mutual fund herding behavior and investment strategies in Chinese stock market. Investig. Manag. Financ. Innov. 2018, 15, 87. [Google Scholar]
- Ippolito, R.A. Consumer reaction to measures of poor quality: Evidence from the mutual fund industry. J. Law Econ. 1992, 35, 45–70. [Google Scholar] [CrossRef]
- Friesen, G.C.; Sapp, T.R.A. Mutual fund flows and investor returns: An empirical examination of fund investor timing ability. Soc. Sci. Electron. Publ. 2007, 31, 2796–2816. [Google Scholar] [CrossRef]
- Guercio, D.D.; Reuter, J. Mutual fund performance and the incentive to generate alpha. J. Financ. 2014, 69, 1673–1704. [Google Scholar] [CrossRef]
- Apap, A.; Griffith, J.M. The impact of expenses on equity mutual fund performance. J. Financ. Plan. 1998, 11, 76. [Google Scholar]
- Iannotta, G.; Navone, M. The cross-section of mutual fund fee dispersion. J. Bank. Financ. 2012, 36, 846–856. [Google Scholar] [CrossRef]
- Goldstein, I.; Jiang, H.; Ng, D.T. Investor flows and fragility in corporate bond funds. J. Financ. Econ. 2017, 126, 592–613. [Google Scholar] [CrossRef]
- Oh, N.Y.; Parwada, J.T.; Tan, E.K. Should indirect brokerage fees be capped? Lessons from mutual fund marketing and distribution expenses. J. Financ. Quant. Anal. 2017, 52, 781–809. [Google Scholar] [CrossRef]
- Kosowski, R.; Timmermann, A.; Wermers, R.; White, H. Can mutual fund “stars” really pick stocks? New evidence from a bootstrap analysis. J. Financ. 2006, 61, 2551–2595. [Google Scholar] [CrossRef]
- Lee, C.F.; Rahman, S. Market timing, selectivity, and mutual fund performance: An empirical investigation. J. Bus. 1990, 63, 261–278. [Google Scholar] [CrossRef]
- Lee, C.-f.; Lee, A.C.; Liu, N. Alternative model to evaluate selectivity and timing performance of mutual fund managers: Theory and evidence. In Handbook of Portfolio Construction; Springer: Boston, MA, USA, 2010; pp. 583–599. [Google Scholar]
- Wilcox, R.T. Bargain hunting or star gazing? Investors’ preferences for stock mutual funds. J. Bus. 2003, 76, 645–663. [Google Scholar] [CrossRef]
- Khorana, A.; Servaes, H. What drives market share in the mutual fund industry? Rev. Financ. 2011, 16, 81–113. [Google Scholar] [CrossRef]
- Wermers, R. Mutual fund herding and the impact on stock prices. J. Financ. 1999, 54, 581–622. [Google Scholar] [CrossRef]
- Wei, K.D.; Wermers, R.; Yao, T. Uncommon value: The characteristics and investment performance of contrarian funds. Manag. Sci. 2014, 61, 2394–2414. [Google Scholar] [CrossRef] [Green Version]
- Fama, E.F.; French, K.R. Common risk factors in the returns on stocks and bonds. J. Financ. Econ. 1993, 33, 3–56. [Google Scholar] [CrossRef]
- Feng, L.; Seasholes, M.S. Do investor sophistication and trading experience eliminate behavioral biases in financial markets? Rev. Financ. 2005, 9, 305–351. [Google Scholar] [CrossRef]
- Drago, D.; Lazzari, V.; Navone, M. Mutual fund incentive fees: Determinants and effects. Financ. Manag. 2010, 39, 365–392. [Google Scholar] [CrossRef]
- Rea, J.; Marcis, R. Mutual fund shareholder activity during US stock market cycles. Perspective 1996, 2, 1–16. [Google Scholar]
- Ha, Y.; Ko, K. Misspecifications in the fund flow-performance relationship. J. Financ. Intermed. 2019, 38, 69–81. [Google Scholar] [CrossRef]
- Spiegel, M.; Zhang, H. Mutual fund risk and market share-adjusted fund flows. J. Financ. Econ. 2013, 108, 506–528. [Google Scholar] [CrossRef]
- Locke, P.R.; Mann, S.C. Professional trader discipline and trade disposition. J. Financ. Econ. 2005, 76, 401–444. [Google Scholar] [CrossRef]
- Alves, C.; Mendes, V. Are mutual fund investors in jail? Appl. Financ. Econ. 2007, 17, 1301–1312. [Google Scholar] [CrossRef]
- Chow, G.C. Tests of equality between sets of coefficients in two linear regressions. Econom. J. Econom. Soc. 1960, 28, 591–605. [Google Scholar] [CrossRef]
Figure 1.
Average fund flows in RMB (millions).

Figure 2.
Average fund flow as a percentage of total net assets (TNA).

Figure 3.
Average inflow (in million RMB) and fund characteristics.

Figure 4.
Average outflow (in million RMB) and fund characteristics.

Figure 5.
Average net flow (in million RMB) and fund characteristics. Notes: Q1 and Q2 are the first and second halves of the year, respectively.
Figure 5.
Average net flow (in million RMB) and fund characteristics. Notes: Q1 and Q2 are the first and second halves of the year, respectively.


Table 1.
Descriptive statistics of the variables.
| Variable | Mean | SD | Min | Max |
|---|---|---|---|---|
| NFF | 262.659 | 1205.608 | 11.619 | 40,554.04 |
| TF | 2347.074 | 5676.442 | 30.593 | 75,372.45 |
| EXP | 19.02214 | 52.347 | 0.030 | 751.801 |
| LF | 263.155 | 1218.7.4 | 11.581 | 40559.91 |
| MAR | 0.019 | 0.081 | −0.418 | 0.376 |
| RV | 0.523 | 0.576 | 0.016 | 3.728 |
| TNA | 13.243 | 31.963 | 0 | 272.87 |
| TR | 0.866 | 1.795 | 0 | 25.610 |
| AGE | 1.822 | 1.759 | 0 | 15 |
| ∆TNA | 124.874 | 4425.688 | −1 | 179,575.5 |
Notes: NFF is the net flow. TF is the sum of LF and EXP, LF is load fee, EXP is operating expense, MAR is the market-adjusted return, RV is the return of volatility, TNA is the net total assets; TR is the turnover ratio-the rate at which a fund buys and sells an investment, AGE is operating year, ∆TNA is the change rate of the total net assets.
Table 2.
Descriptive statistics for open-end funds by year.
| Year | Average Volume of Inflows (Million RMB) | Average Volume of Outflows (Million RMB) | Average Volume of Net Flows (Million RMB) | Total Net Assets-TNA (Million RMB) | Average Inflow (% of TNA) | Average Outflow (% of TNA) | Average Net Flows (% of TNA) |
|---|---|---|---|---|---|---|---|
| 2008 | 21.788 | −378.958 | 400.746 | 19,354.89 | 0.112 | −1.958 | 2.070 |
| 2009 | 16.657 | −495.06 | 511.717 | 21,862.09 | 0.086 | −2.558 | 2.643 |
| 2010 | 15.076 | −501.466 | 516.542 | 19,272.25 | 0.077 | −2.591 | 2.668 |
| 2011 | 8.984 | −485.589 | 494.573 | 16,771.33 | 0.046 | −2.509 | 2.555 |
| 2012 | 6.363 | −373.402 | 379.765 | 14,387.0 | 0.032 | −1.929 | 1.962 |
| 2013 | 3.144 | −456.147 | 459.291 | 2354.667 | 0.016 | −2.356 | 2.373 |
| 2014 | 2.180 | −477.714 | 479.894 | 837.793 | 0.011 | −2.468 | 2.479 |
| 2015 | 18.164 | −1007.44 | 1026.046 | 36.00.678 | 0.093 | −5.205 | 5.301 |
| 2016 | 2.012 | −379.542 | 381.419 | 1198.771 | 0.010 | −1.960 | 1.971 |
| 2017 | 0.913 | −402.394 | 403.372 | 889.305 | 0.005 | −2.079 | 2.084 |
Table 3.
Correlation matrix.
| NFFt | NRPVt | NRDVt | TFt−1 | LFt−1 | EXPt−1 | MARt−1 | MARt−2 | MARt−3 | RVt | RVt−1 | TNAt−1 | TRt | AGEi | ∆TNAt | |
|---|---|---|---|---|---|---|---|---|---|---|---|---|---|---|---|
| NFFt | 1 | ||||||||||||||
| NRPVt | 0.013 | 1 | |||||||||||||
| NRDVt | −0.980 | 0.015 | 1 | ||||||||||||
| TFt−1 | 0.009 | 0.348 | 0.001 | 1 | |||||||||||
| LFt−1 | −0.017 | 0.347 | 0.027 | 0.999 | 1 | ||||||||||
| EXPt−1 | 0.979 | 0.013 | −0.978 | 0.035 | 0.009 | 1 | |||||||||
| MARt−1 | 0.042 | −0.098 | −0.045 | 0.159 | 0.158 | 0.041 | 1 | ||||||||
| MARt−2 | −0.055 | 0.056 | 0.057 | −0.1279 | −0.126 | −0.054 | −0.214 | 1 | |||||||
| MARt−3 | −0.099 | −0.009 | 0.099 | −0.113 | −0.110 | −0.111 | −0.017 | 0.324 | 1 | ||||||
| RVt | −0.058 | 0.132 | 0.062 | 0.253 | 0.255 | −0.053 | −0.071 | −0.075 | −0.114 | 1 | |||||
| RVt−1 | −0.050 | 0.157 | 0.055 | 0.293 | 0.294 | −0.025 | −0.068 | 0.107 | 0.074 | 0.764 | 1 | ||||
| TNAt−1 | 0.019 | 0.533 | −0.004 | 0.805 | 0.805 | 0.042 | 0.091 | −0.095 | −0.165 | 0.241 | 0.252 | 1 | |||
| TRt | −0.038 | −0.040 | 0.037 | −0.038 | −0.0377 | −0.042 | −0.005 | 0.050 | −0.020 | 0.354 | 0.339 | −0.060 | 1 | ||
| AGE | 0.117 | 0.077 | −0.115 | 0.444 | 0.441 | 0.147 | 0.059 | −0.335 | −0.2987 | 0.086 | 0.057 | 0.302 | −0.093 | 1 | |
| ∆TNAt | −0.019 | 0.105 | 0.023 | −0.027 | −0.027 | −0.034 | 0.050 | −0.026 | 0.077 | 0.078 | 0.037 | −0.028 | 0.007 | −0.040 | 1 |
Note: Net fund flows (NEFt) of the current periof, net repurchase values (NRPVt) of the current period, and net redemption values of the current period (NRDVt) are presented as absolute values (in million RMB); TFt−1, EXPt−1, and LFt−1 are the total, operating expense, and load fee of the last period, respectively; MARt−1, MARt−2, and MARt−3 are the market-adjusted return of the 1, 2, and 3 lag periods, respectively; RVt and RVt−1 are the return volatility of the t and t−1 periods, respectively; TNAt−1 is the total net assets of the last period; TRt is the turnover ratio of period t; AGE is the age of the fund; and ∆TNAt is the change rate of total net asset of period t.
Table 4.
Effect of the fund fee on the flow.
| (1) | (2) | (3) | (4) | |
|---|---|---|---|---|
| Net Flow | Net Flow | Inflow | Outflow | |
| TFt−1 | −0.041 *** | |||
| (0.003) | ||||
| LFt−1 | −0.041 *** | −0.000 ** | 0.041 *** | |
| (0.003) | (0.000) | (0.003) | ||
| EXPt−1 | −0.022 | 0.000 *** | 0.022 | |
| (0.017) | (0.000) | (0.017) | ||
| MARt−1 | 19.124 * | 17.070 | 0.005 * | −17.066 |
| (11.573) | (11.708) | (0.003) | (11.708) | |
| MARt−2 | 7.973 | 7.894 | 0.006 *** | −7.888 |
| (7.573) | (7.571) | (0.002) | (7.571) | |
| MARt−3 | −1.855 | −2.732 | −0.001 | 2.730 |
| (6.137) | (6.183) | (0.002) | (6.183) | |
| RVt | 1.250 | 1.226 | 0.002 *** | −1.224 |
| (1.733) | (1.732) | (0.000) | (1.732) | |
| RVt−1 | −0.546 | −0.748 | 0.000 | 0.749 |
| (1.653) | (1.662) | (0.000) | (1.662) | |
| TNAt−1 | 0.001 *** | 0.001 *** | −0.000 *** | −0.001 *** |
| (0.000) | (0.000) | (0.000) | (0.000) | |
| TRt | −0.115 | −0.112 | −0.000 ** | 0.112 |
| (0.261) | (0.261) | (0.000) | (0.261) | |
| AGEt | 1.016 *** | 0.872 ** | 0.000 *** | −0.872 ** |
| (0.345) | (0.367) | (0.000) | (0.367) | |
| ∆TNAt | 0.007 * | 0.007 * | 0.000 *** | −0.007 * |
| (0.004) | (0.004) | (0.000) | (0.004) | |
| _cons | 0.673 | 1.217 | 0.001 ** | −1.216 |
| (1.485) | (1.559) | (0.000) | (1.559) | |
| Obs. | 705 | 705 | 753 | 705 |
| R2 | 0.190 | 0.191 | 0.163 | 0.191 |
Note: Standard errors are provided in parentheses; *** p < 0.01, ** p < 0.05, * p < 0.1.
Table 5.
Difference between the mean of the inflow and outflow.
| Year | Obs. | Mean Inflow | Mean Outflow | Dif | SE | t-Value | p-Value |
|---|---|---|---|---|---|---|---|
| 2017 | 419 | 0.18 | 536.927 | −536.747 | 86.761 | −6.2 | 0 |
| 2016 | 415 | 0.431 | 397.327 | −396.896 | 52.327 | −7.6 | 0 |
| 2015 | 287 | 0.457 | 288.06 | −287.603 | 34.377 | −8.4 | 0 |
| 2014 | 58 | 0.295 | 192.84 | −192.545 | 51.858 | −3.7 | 0.001 |
| 2013 | 18 | 0.119 | 36.344 | −36.225 | 8.792 | −4.15 | 0.001 |
| 2012 | 24 | 0.18 | 15.167 | −14.987 | 5.986 | −2.55 | 0.018 |
| 2011 | 24 | 0.178 | 13.251 | −13.073 | 5.872 | −2.3 | 0.032 |
| 2010 | 24 | 0.243 | 13.678 | −13.435 | 6.667 | −2.1 | 0.048 |
| 2009 | 22 | 0.267 | 14.598 | −14.331 | 7.469 | −2.1 | 0.048 |
| 2008 | 18 | 0.366 | 17.453 | −17.087 | 9.924 | −1.8 | 0.09 |
| Average | 1458 | 0.314 | 387.294 | −386.98 | 32.925 | −11.7 | 0 |
Notes: SE is standard deviation; Dif is the difference between mean inflow and mean outflow.
Table 6.
Effect of performance on the fund flow–load fee relationship.
| (1) | (2) | (3) | |
|---|---|---|---|
| Net Flow | Inflow | Outflow | |
| EXPt−1 | −0.022 | 0.000 *** | 0.022 |
| (0.017) | (0.000) | (0.017) | |
| LFt−1 | −0.042 *** | −0.000 ** | 0.042 *** |
| (0.003) | (0.000) | (0.003) | |
| MARt−1 | 1.430 | 0.010 ** | −1.422 |
| (16.801) | (0.004) | (16.801) | |
| MARt−2 | 7.330 | 0.006 *** | −7.324 |
| (7.580) | (0.002) | (7.580) | |
| MARt−3 | −2.251 | −0.001 | 2.248 |
| (6.191) | (0.002) | (6.191) | |
| RVt | 1.146 | 0.002 *** | −1.144 |
| (1.733) | (0.000) | (1.733) | |
| RVt−1 | −0.746 | 0.000 | 0.747 |
| (1.661) | (0.000) | (1.661) | |
| TNAt−1 | 0.001 *** | −0.000 *** | −0.001 *** |
| (0.000) | (0.000) | (0.000) | |
| TRt | −0.107 | −0.000 ** | 0.107 |
| (0.261) | (0.000) | (0.261) | |
| AGEt | 0.894 ** | 0.000 *** | −0.894 ** |
| (0.368) | (0.000) | (0.368) | |
| ∆TNAt | 0.007 * | 0.000 *** | −0.007 * |
| (0.004) | (0.000) | (0.004) | |
| LFt−1*MARt−1 | 0.074 | −0.000 | −0.074 |
| (0.057) | (0.000) | (0.057) | |
| _cons | 1.314 | 0.001 ** | −1.313 |
| (1.560) | (0.000) | (1.560) | |
| Obs. | 705 | 753 | 705 |
| R2 | 0.193 | 0.166 | 0.193 |
Note: Standard errors are indicated in parentheses; *** p < 0.01, ** p < 0.05, * p < 0.1.
Table 7.
Effect of performance on the fund flow–load fee relationship at different performance levels.
Table 7.
Effect of performance on the fund flow–load fee relationship at different performance levels.
| (1) | (2) | (3) | (4) | (5) | (6) | (7) | (8) | (9) | |
|---|---|---|---|---|---|---|---|---|---|
| Net flow | Inflow | Outflow | |||||||
| High | Median | Low | High | Median | Low | High | Median | Low | |
| EXPt−1 | −0.002 | 0.018 | 0.001 | 0.000 | 0.000 | 0.000 | 0.002 | −0.018 | −0.001 |
| (0.012) | (0.068) | (0.027) | (0.000) | (0.000) | (0.000) | (0.012) | (0.068) | (0.027) | |
| LFt−1 | 0.003 | −0.100 *** | −0.001 | −0.000 *** | −0.000 | −0.000 *** | −0.003 | 0.100 *** | 0.001 |
| (0.003) | (0.005) | (0.008) | (0.000) | (0.000) | (0.000) | (0.003) | (0.005) | (0.008) | |
| MARt−1 | −10.037 | −1318.322 *** | 5.926 | 0.026 ** | 0.059 | −0.003 | 10.064 | 1318.400 *** | −5.931 |
| (10.991) | (182.094) | (47.628) | (0.011) | (0.042) | (0.012) | (10.991) | (182.092) | (47.628) | |
| MARt−2 | −13.407 | −52.120 * | 5.380 | 0.028 ** | 0.021 *** | 0.009 * | 13.435 | 52.140 * | −5.372 |
| (12.117) | (27.431) | (20.156) | (0.012) | (0.007) | (0.005) | (12.117) | (27.430) | (20.156) | |
| MARt−3 | 0.018 | −0.237 | 4.949 | 0.004 | −0.017 *** | 0.004 | −0.014 | 0.223 | −4.946 |
| (12.892) | (17.720) | (15.689) | (0.013) | (0.004) | (0.004) | (12.892) | (17.719) | (15.689) | |
| RVt | −1.903 | −0.894 | 7.267 *** | 0.010 *** | 0.002 *** | 0.002 *** | 1.913 | 0.895 | −7.265 *** |
| (3.281) | (2.389) | (2.772) | (0.003) | (0.001) | (0.001) | (3.281) | (2.389) | (2.772) | |
| RVt−1 | −2.291 | −0.083 | −7.043 ** | −0.002 | −0.000 | 0.001 | 2.289 | 0.084 | 7.044 ** |
| (2.059) | (2.145) | (3.131) | (0.002) | (0.001) | (0.001) | (2.059) | (2.145) | (3.131) | |
| TNAt−1 | 0.000 | 0.002 ** | 0.000 | −0.000 *** | −0.000 * | −0.000 *** | −0.000 | −0.002 ** | −0.000 |
| (0.000) | (0.001) | (0.000) | (0.000) | (0.000) | (0.000) | (0.000) | (0.001) | (0.000) | |
| TRt | 1.185 ** | 0.891 | −0.183 | −0.000 | −0.000 * | −0.000 | −1.186 ** | −0.891 | 0.183 |
| (0.515) | (0.542) | (0.281) | (0.001) | (0.000) | (0.000) | (0.515) | (0.542) | (0.281) | |
| AGEt | 0.141 | 0.323 | 0.305 | 0.002 *** | −0.000 ** | 0.000 ** | −0.140 | −0.323 | −0.304 |
| (0.391) | (0.451) | (0.801) | (0.000) | (0.000) | (0.000) | (0.391) | (0.451) | (0.801) | |
| ∆TNAt | 0.021 | 0.012 | 0.004 | 0.000 * | 0.000 *** | 0.000 *** | −0.021 | −0.012 | −0.004 |
| (0.031) | (0.007) | (0.004) | (0.000) | (0.000) | (0.000) | (0.031) | (0.007) | (0.004) | |
| LFt−1*MARt−1 | −0.007 | 5.913 *** | −0.000 | −0.000 | −0.000 | −0.000 | 0.007 | −5.913 *** | 0.000 |
| (0.024) | (0.629) | (0.099) | (0.000) | (0.000) | (0.000) | (0.024) | (0.629) | (0.099) | |
| _cons | −0.429 | 17.550 *** | −7.054 *** | −0.009 ** | 0.003 *** | −0.000 | 0.419 | −17.548 *** | 7.054 *** |
| (3.994) | (2.649) | (2.689) | (0.004) | (0.001) | (0.001) | (3.994) | (2.649) | (2.689) | |
| Obs. | 66 | 332 | 307 | 66 | 344 | 343 | 66 | 332 | 307 |
| R2 | 0.337 | 0.576 | 0.045 | 0.529 | 0.182 | 0.266 | 0.338 | 0.576 | 0.045 |
Note: Standard errors are indicated in parentheses; *** p < 0.01, ** p < 0.05, * p < 0.1.
Table 8.
Effect of size of fund on the flow–load fee relationship.
| (1) | (2) | (3) | (4) | (5) | (6) | (7) | (8) | (9) | |
|---|---|---|---|---|---|---|---|---|---|
| Net flow | Inflow | Outflow | |||||||
| Large | Median | Small | Large | Median | Small | Large | Median | Small | |
| EXPt−1 | −0.000 | −0.002 | -0.092 | 0.000 | −0.000 | −0.000 | 0.000 | 0.002 | 0.092 |
| (0.000) | (0.002) | (0.081) | (0.000) | (0.000) | (0.000) | (0.000) | (0.000) | (0.081) | |
| LFt−1 | −0.000 *** | −0.002 *** | -0.094 *** | 0.000 | 0.000 * | 0.000 *** | 0.000 *** | 0.002 *** | 0.094 *** |
| (0.000) | (0.000) | (0.007) | (0.000) | (0.000) | (0.000) | (0.000) | (0.002) | (0.007) | |
| MARt−1 | 0.021 | −2.260 * | 33.918 | −0.002 | 0.018 ** | 0.029 *** | −0.023 | 2.276 * | −33.893 |
| (0.053) | (1.173) | (52.158) | (0.002) | (0.007) | (0.011) | (0.053) | (1.173) | (52.158) | |
| MARt−2 | 0.036 | 0.215 | 16.661 | 0.002 | 0.011 *** | 0.019 *** | −0.034 | −0.204 | −16.643 |
| (0.038) | (0.534) | (24.708) | (0.001) | (0.003) | (0.005) | (0.038) | (0.534) | (24.708) | |
| MARt−3 | −0.018 | 0.632 | −5.088 | −0.000 | −0.004 | −0.009 ** | 0.018 | −0.639 | 5.079 |
| (0.039) | (0.426) | (16.633) | (0.001) | (0.003) | (0.004) | (0.039) | (0.426) | (16.633) | |
| RVt | −0.019 | −0.133 | 2.230 | −0.001 | 0.003 *** | 0.003 *** | 0.019 | 0.136 | −2.227 |
| (0.016) | (0.095) | (3.924) | (0.001) | (0.001) | (0.001) | (0.016) | (0.095) | (3.924) | |
| RVt−1 | 0.039 ** | 0.210 ** | 1.076 | −0.000 | −0.000 | 0.000 | −0.039 ** | −0.210 ** | −1.075 |
| (0.017) | (0.094) | (3.581) | (0.001) | (0.001) | (0.001) | (0.017) | (0.094) | (3.581) | |
| TNAt−1 | 0.000 *** | 0.000 *** | 0.027 *** | 0.000 | −0.000 *** | −0.000 | −0.000 *** | −0.000 *** | −0.027 *** |
| (0.000) | (0.000) | (0.010) | (0.000) | (0.000) | (0.000) | (0.000) | (0.000) | (0.010) | |
| TRt | 0.001 | −0.041 *** | 0.068 | 0.000 | −0.000 *** | −0.000 | −0.001 | 0.041 *** | −0.069 |
| (0.005) | (0.014) | (0.474) | (0.000) | (0.000) | (0.000) | (0.005) | (0.014) | (0.474) | |
| AGEt | 0.003 * | 0.018 | 1.846 | −0.000 | −0.000 | 0.001 *** | −0.003 * | −0.018 | −1.845 |
| (0.002) | (0.023) | (1.627) | (0.000) | (0.000) | (0.000) | (0.002) | (0.023) | (1.627) | |
| ∆TNAt | 0.000 ** | 0.000 | 0.095 *** | 0.000 *** | 0.000 *** | 0.000 *** | −0.000 ** | −0.000 | −0.095 *** |
| (0.000) | (0.000) | (0.032) | (0.000) | (0.000) | (0.000) | (0.000) | (0.000) | (0.032) | |
| _cons | −0.108 *** | −0.562 *** | −2.490 | 0.001 *** | 0.002 *** | −0.001 | 0.110 *** | 0.564 *** | 2.489 |
| (0.011) | (0.092) | (4.846) | (0.000) | (0.001) | (0.001) | (0.011) | (0.092) | (4.846) | |
| Obs. | 155 | 343 | 207 | 159 | 370 | 224 | 155 | 343 | 207 |
| R2 | 0.588 | 0.341 | 0.521 | 0.367 | 0.229 | 0.412 | 0.589 | 0.341 | 0.521 |
Note: Standard errors are indicated in parentheses; *** p < 0.01, ** p < 0.05, * p < 0.1.
Table 9.
Effect of proportion of institutional investors on the flow–load fee relationship.
| (1) | (2) | (3) | (4) | (5) | (6) | (7) | (8) | (9) | |
|---|---|---|---|---|---|---|---|---|---|
| Net Flow | Inflow | Outflow | |||||||
| High | Median | Low | High | Median | Low | High | Median | Low | |
| EXPt−1 | 0.132 | −0.006 | −0.021 | −0.000 | 0.000 * | 0.000 | −0.132 | 0.006 | 0.021 |
| (0.136) | (0.016) | (0.031) | (0.000) | (0.000) | (0.000) | (0.136) | (0.016) | (0.031) | |
| LFt−1 | −0.004 | 0.001 | −0.094 *** | −0.000 | −0.000 ** | −0.000 | 0.004 | −0.001 | 0.094 *** |
| (0.016) | (0.002) | (0.007) | (0.000) | (0.000) | (0.000) | (0.016) | (0.002) | (0.007) | |
| MARt−1 | −53.275 | 8.859 | 28.333 | 0.004 | 0.013 *** | −0.007 | 53.277 | −8.847 | −28.340 |
| (36.809) | (9.548) | (24.557) | (0.015) | (0.004) | (0.006) | (36.808) | (9.548) | (24.558) | |
| MARt−2 | −3.627 | 3.333 | 11.329 | 0.008 | 0.003 | 0.004 | 3.630 | −3.330 | −11.325 |
| (14.193) | (5.494) | (16.852) | (0.006) | (0.002) | (0.004) | (14.193) | (5.494) | (16.852) | |
| MARt−3 | 3.161 | −2.286 | 13.240 | 0.012 ** | −0.004 ** | −0.003 | −3.154 | 2.282 | −13.243 |
| (12.580) | (4.330) | (14.604) | (0.005) | (0.002) | (0.003) | (12.580) | (4.330) | (14.605) | |
| RVt | −34.360 *** | −0.349 | 6.814 | −0.002 | 0.001 ** | 0.001 | 34.361 *** | 0.350 | −6.812 |
| (6.602) | (1.082) | (4.155) | (0.002) | (0.000) | (0.001) | (6.602) | (1.082) | (4.155) | |
| RVt−1 | 17.581 ** | −0.871 | −2.997 | 0.001 | 0.001 *** | 0.000 | −17.582 ** | 0.872 | 2.997 |
| (6.731) | (1.042) | (3.854) | (0.003) | (0.000) | (0.001) | (6.731) | (1.042) | (3.855) | |
| TNAt−1 | 0.000 | 0.000 | 0.001 | 0.000 | −0.000 *** | −0.000 *** | −0.000 | −0.000 | −0.001 |
| (0.001) | (0.000) | (0.000) | (0.000) | (0.000) | (0.000) | (0.001) | (0.000) | (0.000) | |
| TRt | 2.123 * | 0.220 | −0.148 | −0.000 | −0.000 * | −0.000 | −2.123 * | −0.220 | 0.148 |
| (1.089) | (0.204) | (0.457) | (0.000) | (0.000) | (0.000) | (1.089) | (0.204) | (0.457) | |
| AGEt | 0.090 | 0.536 ** | 0.239 | 0.000 | −0.000 | 0.001 *** | −0.090 | −0.536 ** | −0.238 |
| (0.864) | (0.229) | (0.903) | (0.000) | (0.000) | (0.000) | (0.864) | (0.229) | (0.903) | |
| ∆TNAt | 0.003 | 0.007 * | 0.065 ** | 0.000 *** | 0.000 *** | 0.000 *** | −0.003 | −0.007 * | −0.065 ** |
| (0.002) | (0.004) | (0.030) | (0.000) | (0.000) | (0.000) | (0.002) | (0.004) | (0.030) | |
| _cons | 1.895 | −4.715 *** | 5.048 | 0.002 | 0.002 *** | −0.000 | −1.894 | 4.717 *** | −5.049 |
| (3.560) | (0.999) | (4.210) | (0.001) | (0.000) | (0.001) | (3.560) | (0.999) | (4.210) | |
| Obs. | 86 | 420 | 197 | 120 | 428 | 203 | 86 | 420 | 197 |
| R2 | 0.290 | 0.057 | 0.566 | 0.274 | 0.304 | 0.327 | 0.290 | 0.057 | 0.566 |
Note: Standard errors are indicated in parentheses; *** p < 0.01, ** p < 0.05, * p < 0.1.
Table 10.
Flow–load fee relationship in aggressive growth, growth, and income funds.
| (1) | (2) | (3) | (4) | (5) | (6) | (7) | (8) | (9) | |
|---|---|---|---|---|---|---|---|---|---|
| Net Flow | Inflow | Outflow | |||||||
| Aggressive Growth | Growth | Income | Aggressive Growth | Growth | Income | Aggressive Growth | Growth | Income | |
| EXPt−1 | 0.004 | −0.009 | 0.214 | 0.000 | −0.000 | −0.000 | −0.004 | 0.009 | −0.214 |
| (0.010) | (0.011) | (0.147) | (0.000) | (0.000) | (0.000) | (0.010) | (0.011) | (0.147) | |
| LFt−1 | 0.003 | 0.001 | −0.087 *** | −0.000 *** | −0.000 | −0.000 | −0.003 | −0.001 | 0.087 *** |
| (0.003) | (0.003) | (0.008) | (0.000) | (0.000) | (0.000) | (0.003) | (0.003) | (0.008) | |
| MARt−1 | 2.873 | 9.874 | 108.614 * | 0.006 | 0.001 | 0.004 | −2.870 | −9.872 | −108.610 * |
| (5.437) | (8.505) | (61.828) | (0.007) | (0.002) | (0.010) | (5.438) | (8.505) | (61.827) | |
| MARt−2 | 6.998 * | 2.729 | 0.317 | 0.014 *** | 0.003 * | 0.002 | −6.983 * | −2.727 | −0.316 |
| (4.215) | (4.832) | (33.744) | (0.005) | (0.001) | (0.006) | (4.215) | (4.832) | (33.743) | |
| MARt−3 | −6.670 ** | 2.105 | −17.694 | −0.004 | 0.001 | −0.002 | 6.662 ** | −2.104 | 17.692 |
| (2.876) | (4.420) | (26.170) | (0.004) | (0.001) | (0.004) | (2.877) | (4.420) | (26.169) | |
| RVt | −0.170 | 1.558 | 6.403 | 0.003 *** | 0.001 *** | −0.000 | 0.173 | −1.557 | −6.403 |
| (0.666) | (1.334) | (7.342) | (0.001) | (0.000) | (0.001) | (0.666) | (1.334) | (7.342) | |
| RVt−1 | 0.013 | −2.718 * | −5.559 | −0.000 | 0.000 | 0.002 | −0.014 | 2.718 * | 5.561 |
| (0.603) | (1.393) | (6.489) | (0.001) | (0.000) | (0.001) | (0.603) | (1.393) | (6.489) | |
| TNAt−1 | 0.000 | 0.000 ** | 0.000 | −0.000 *** | −0.000 | 0.000 | −0.000 | −0.000 ** | −0.000 |
| (0.000) | (0.000) | (0.002) | (0.000) | (0.000) | (0.000) | (0.000) | (0.000) | (0.002) | |
| TRt | −1.041 *** | 0.166 | −0.222 | −0.000 | −0.000 ** | −0.000 | 1.040 *** | −0.167 | 0.222 |
| (0.130) | (0.169) | (1.081) | (0.000) | (0.000) | (0.000) | (0.130) | (0.169) | (1.081) | |
| AGEt | 0.205 | 0.373 | 1.508 | 0.001 ** | −0.000 | −0.000 | −0.204 | −0.373 | −1.508 |
| (0.203) | (0.251) | (1.429) | (0.000) | (0.000) | (0.000) | (0.203) | (0.251) | (1.429) | |
| ∆TNAt | 0.001 | 0.022 | 0.182 ** | 0.000 ** | 0.000 *** | 0.000 | −0.001 | −0.022 | −0.182 ** |
| (0.001) | (0.075) | (0.075) | (0.000) | (0.000) | (0.000) | (0.001) | (0.075) | (0.075) | |
| _cons | −2.149 ** | −4.319 *** | 10.895 * | 0.004 *** | 0.001 *** | 0.002 ** | 2.154 ** | 4.320 *** | −10.893 * |
| (0.991) | (1.153) | (5.578) | (0.001) | (0.000) | (0.001) | (0.991) | (1.153) | (5.577) | |
| Obs. | 147 | 390 | 168 | 155 | 430 | 168 | 147 | 390 | 168 |
| R2 | 0.402 | 0.053 | 0.508 | 0.381 | 0.126 | 0.047 | 0.402 | 0.053 | 0.508 |
Note: Standard errors are indicated in parentheses; *** p < 0.01, ** p < 0.05, * p < 0.1.
Table 11.
Effect of liquidity on the flow–load fee relationship.
| (1) | (2) | (3) | (4) | (5) | (6) | (7) | (8) | (9) | |
|---|---|---|---|---|---|---|---|---|---|
| Net Flow | Inflow | Outflow | |||||||
| High | Median | Low | High | Median | Low | High | Median | Low | |
| EXPt−1 | −0.001 | −0.024 | 0.027 | 0.000 | 0.000 | 0.000 | 0.001 | 0.024 | −0.027 |
| (0.017) | (0.022) | (0.160) | (0.000) | (0.000) | (0.000) | (0.017) | (0.022) | (0.160) | |
| LFt−1 | 0.000 | −0.071 *** | −0.043 | −0.000 *** | −0.000 | 0.000 | −0.000 | 0.071 *** | 0.043 |
| (0.002) | (0.005) | (0.034) | (0.000) | (0.000) | (0.000) | (0.002) | (0.005) | (0.034) | |
| MARt−1 | 4.983 | 44.447 ** | 62.648 | 0.005 | 0.004 | 0.007 | −4.978 | −44.445 ** | −62.642 |
| (7.342) | (19.275) | (81.910) | (0.005) | (0.004) | (0.012) | (7.342) | (19.274) | (81.910) | |
| MARt−2 | 4.906 | 4.499 | −3.917 | 0.010 ** | 0.002 | 0.007 | −4.896 | −4.498 | 3.922 |
| (6.534) | (10.800) | (40.245) | (0.004) | (0.002) | (0.006) | (6.534) | (10.800) | (40.245) | |
| MARt−3 | −1.697 | −12.687 | −4.054 | −0.003 | 0.001 | −0.003 | 1.694 | 12.688 | 4.052 |
| (4.211) | (9.740) | (45.672) | (0.003) | (0.002) | (0.006) | (4.211) | (9.740) | (45.672) | |
| RVt | 0.987 | 0.590 | −0.737 | 0.002 ** | 0.001 | 0.002 | −0.985 | −0.590 | 0.739 |
| (1.271) | (2.791) | (10.967) | (0.001) | (0.001) | (0.002) | (1.271) | (2.791) | (10.967) | |
| RVt−1 | 0.302 | −0.708 | −7.481 | 0.000 | 0.001 * | −0.001 | −0.302 | 0.709 | 7.481 |
| (1.358) | (2.375) | (9.684) | (0.001) | (0.000) | (0.001) | (1.358) | (2.375) | (9.684) | |
| TNAt−1 | 0.000 | 0.001 ** | 0.004 * | −0.000 *** | −0.000 ** | −0.000 | −0.000 | −0.001 ** | −0.004 * |
| (0.000) | (0.000) | (0.002) | (0.000) | (0.000) | (0.000) | (0.000) | (0.000) | (0.002) | |
| TRt | −0.230 * | 0.658 | 75.013 | −0.000 ** | −0.000 | −0.007 | 0.230 * | −0.658 | −75.025 |
| (0.130) | (3.820) | (60.779) | (0.000) | (0.001) | (0.009) | (0.130) | (3.820) | (60.779) | |
| AGEt | 0.420 | 0.777 | −0.236 | 0.001 *** | −0.000 | −0.000 | −0.419 | −0.777 | 0.236 |
| (0.363) | (0.543) | (1.119) | (0.000) | (0.000) | (0.000) | (0.363) | (0.543) | (1.119) | |
| ∆TNAt | 0.002 | 0.017 ** | 0.065 * | 0.000 *** | 0.000 *** | 0.000 *** | −0.002 | −0.017 ** | −0.065 * |
| (0.002) | (0.009) | (0.037) | (0.000) | (0.000) | (0.000) | (0.002) | (0.009) | (0.037) | |
| _cons | −5.698 *** | 8.835 *** | −2.750 | −0.000 | 0.001 ** | 0.002 | 5.698 *** | −8.833 *** | 2.752 |
| (1.427) | (2.544) | (9.431) | (0.001) | (0.000) | (0.001) | (1.427) | (2.544) | (9.431) | |
| Obs. | 241 | 356 | 108 | 249 | 388 | 116 | 241 | 356 | 108 |
| R2 | 0.079 | 0.412 | 0.119 | 0.338 | 0.087 | 0.184 | 0.079 | 0.412 | 0.119 |
Note: Standard errors are indicated in parentheses; *** p < 0.01, ** p < 0.05, * p < 0.1.
Table 12.
Chow test.
| Known Breaks in 2015 | |||
|---|---|---|---|
| Break Structure of the Regression | Break Structure of Load Fees | ||
| Net flow | F | 5.56 | 0.01 |
| p-value | 0.004 | 0.942 | |
| Inflow | F | 0.25 | 0.46 |
| p-value | 0.777 | 0.500 | |
| Outflow | F | 5.56 | 0.01 |
| p-value | 0.004 | 0.943 | |
© 2019 by the authors. Licensee MDPI, Basel, Switzerland. This article is an open access article distributed under the terms and conditions of the Creative Commons Attribution (CC BY) license (http://creativecommons.org/licenses/by/4.0/).
Share and Cite
MDPI and ACS Style
Xiao, Y.; Qiao, H.; Xie, T. Open-End Funds for Sustainable Economic Growth in China: The Relationship between Load Fees, Performance, and Flows. Sustainability 2019, 11, 6514. https://0-doi-org.brum.beds.ac.uk/10.3390/su11226514
AMA Style
Xiao Y, Qiao H, Xie T. Open-End Funds for Sustainable Economic Growth in China: The Relationship between Load Fees, Performance, and Flows. Sustainability. 2019; 11(22):6514. https://0-doi-org.brum.beds.ac.uk/10.3390/su11226514
Chicago/Turabian StyleXiao, Yaping, Haishu Qiao, and Ting Xie. 2019. "Open-End Funds for Sustainable Economic Growth in China: The Relationship between Load Fees, Performance, and Flows" Sustainability 11, no. 22: 6514. https://0-doi-org.brum.beds.ac.uk/10.3390/su11226514
Note that from the first issue of 2016, this journal uses article numbers instead of page numbers. See further details here.