Postgraduate Education of Board Members and R&D Investment—Evidence from China


1
Institute of Education, Tsinghua University, Beijing 100084, China
2
School of Library and Information Science, University of Iowa, Iowa City, IA 52242, USA
*
Authors to whom correspondence should be addressed.
Sustainability 2019, 11(22), 6524; https://0-doi-org.brum.beds.ac.uk/10.3390/su11226524
Submission received: 19 October 2019
/
Revised: 12 November 2019
/
Accepted: 18 November 2019
/
Published: 19 November 2019
(This article belongs to the Collection Higher Education in Innovation Ecosystems)
Abstract
:Increasing research and development (R&D) investment has been a common strategy to advance the sustainable development of economy and competitiveness across the world. Instead of external determinants, exploring the influence of internal factors such as the characteristics of board members is an important topic, yet under-researched. This article aims to reveal whether a firm’s R&D investment is related to the directors’ postgraduate education experience. Further, we want to explore whether this relationship shows heterogeneity in different industrial environments. We analyzed information from a sample of 1374 listed companies in China using descriptive statistics, ordinary least square (OLS) regression and instrumental variable (IV) estimation, and came to the following conclusions: First, the percentage of directors with doctorates significantly increases the chance of investing R&D activities. Second, in the second industry, the higher the proportion of postgraduate education degree holder as directors in a firm, the more expenditure the firm invests in R&D activities. Yet, there is no such association in the third industry. Finally, if a capital-driven strategy is adopted, directors with a master’s degree tend to reduce R&D investment in IT companies. Findings from this research not only enrich innovation management theory, upper echelon theory, and human capital theory, but also provide insights for corporate governance and national sustainable innovation.
1. Introduction
Under the background of new scientific and technical revolution and accelerated advancement of industrial reform around the world, innovation, as the first driving force leading social and economic development, is pivotal to a country’s sustainable development and rebuilding world competition pattern [1,2,3]. As a result, increasing research and development (R&D) investment and advancing innovation have been common strategies of the world’s main economies, especially those emerging markets [4,5,6]. According to Science & Engineering Indicators (2018 Digest) issued by National Science Foundation of the United States, R&D investment in the USA, Japan, Germany, France, China, UK, and South Korea tended to rise generally after 2000, and the rising tendency in China was remarkable. China, within ten years, successively surpassed France (2001), Germany (2004), and Japan (2009) and developed into the world’s second-largest county in R&D investment following the USA [7]. Enterprises are the main driving forces for research and development. By 2017, the proportion of enterprises’ R&D investment in total investments of China reached 77.6% [8], which was significant for China to promote a development strategy driven by innovation and build an innovative county. However, in China, enterprises typically invested less in R&D activities than those in the USA. In 2017, average R&D investment of enterprises in China was less than 3%, far lower than 6% of the USA [9]. In particular, as current Sino-US trade friction aggravates, strengthening the function of enterprises in research and development and national scientific and technical innovation will be a key strategy to tackle new challenges in the new era.
What factors will influence enterprises’ innovation on research and development? Previous research has found that influential factors of research and development include external economic and political environments [10], such as macroeconomic volatility [11], interest rate marketization [12], political instability [13], judicial system [14], and the nature of business [15]. However, according to many studies since the innovation theory was proposed by Joseph Schumpeter, enterprises do not focus on external influencing factors only. Instead, internal factors are also be considered [16,17,18]. Especially, the upper echelons theory proposed in 1984 brought the influence of observable and unobservable features into the view of researchers [19,20,21]. The former includes cognitive bases and values of senior management. The latter involves factors such as the level of education, age, and professional experience on corporate strategy. Postgraduate education is the main channel for cultivating advanced innovative talents [22]. Compared to employees with senior high school education or undergraduate education background only, staff with master’s or doctoral degrees may have higher innovative awareness and stronger capacities in research and development due to their scientific research experience. When working in an enterprise or being promoted to directors, they may apply their postgraduate education to practical scenarios. This will prominently advance R&D activities of the enterprise and can be regarded as an important representation of social functions of postgraduate education.
In this view, the relationship between directors’ postgraduate education experience and R&D activities of their companies has been a significant topic yet, under-researched. Our paper aims to fulfill this gap. The detailed objective of this paper is twofold. First, we aim to reveal whether a firm’s R&D investment is significantly related to its directors’ postgraduate education experience. Second, we aim to explore whether this relationship shows heterogeneity in different industrial environments. Based on a sample of 1374 companies in China, we examined the overall influence of directors’ postgraduate education characteristics on their firm’s R&D investment. We further investigated this correlation in the second industry and the third industry, respectively. Moreover, IT industry attracted particular attention during the analysis due to its massive R&D investment activities compared to other industries. This study contributes to related research both theoretically and practically
In terms of theoretical contribution, this paper enriches innovation management theory, upper echelon theory, and human capital theory. In contrast to prior innovation management research highlighting external determinants of corporate R&D innovation, our research finds that the higher the percentage of directors with a doctoral degree is, the more investment in R&D activities, providing the empirical evidence that internal factors from board of directors also matters. In line with the research from the perspective upper echelon theory, this paper pays attention to director’s individual characteristics as well, especially educational characteristics. Our research findings indicate the association between a director’s postgraduate education characteristics and a firm’s R&D investment varies in different industry environments. In the second industry that mainly consists of industrial companies, the higher the proportion of postgraduate education degree holder as directors, the more expenditure in R&D activities. However, this correlation is not statistically significant in the third industry, which involves commercial, financial and real estate, public utilities, culture, education, sports, and IT companies. Through the lens of human capital theory, there is economic value embedded in the postgraduate education, which is justified in this paper in the respect of R&D investment. In addition to the positive impact of human capital on economic growth and R&D innovation that has been studied thoroughly, our contribution lies in unpacking the complexity in reality due to the certain attributes of both board directors and corporate developing strategies. Findings in IT companies confirm that if a capital-driven strategy is adopted, directors with master’s degrees and economics and management background tend to reduce R&D investment.
In terms of practical contribution, research findings of this paper provide insights for the corporate governance at the institutional level and the sustainable innovation strategy at the national level. Enterprises should realize the correlations between directors’ postgraduate education characteristics and R&D investment, then adopt targeting innovative strategies, and through board staffing and configuring. National policy should also encourage universities to increase the availability of innovation and entrepreneurship education in the curricula system of postgraduate education for the achievement of sustainable innovation of a state.
The rest of this paper is organized as follows. The second part briefly reviews the relevant literature and several corresponding hypotheses drawn from previous research. The third part introduces the research methods, which include information about data used in this study and operationalization of variables. Results of descriptive statistics of variables are also presented in this part. The fourth section documents the research findings based on the ordinary least square (OLS) regression analysis and the endogeneity problem is treated through different methods. Apart from the overall influence, regression between different industries and within the IT industry are also employed. The next section shows the related discussion and conclusions emerging from this study. Possible implications, limitations, as well as future research directions are discussed in the last section.
2. Literature Review and Research Hypothesis
A large number of empirical studies have identified that highly educated top management teams, for instance CEOs, hold more of an open attitude toward innovation [23] and thus have a tendency to invest more in R&D activities [24]. Following this line of reasoning, directors, as the core decision-makers of a firm, may also play a central role in the innovative strategies of a corporate. Therefore, their characteristics may exert a profound influence on a firm’s R&D activities as well. The relationship between directors’ characteristics and a firm’s R&D investment has attracted attention from several scholars so far. For example, the following studies identified that directors’ gender affected the firm’s R&D investment. Despite the common sense that women tend to be risk-averted, researchers have found that female directors in the boardroom actually invest more in R&D activities compared with their male counterparts [25,26,27]. Age is another determinant. Based on the data from the IT listed firms in China from 2007 to 2010, it was found that directors’ age had a negative effect on the company’s R&D investment [28]. Others claimed that positions which directors used to take also shaped the strategic decisions regarding R&D investment in a company [29,30]. For example, entrepreneurial finance experience and technical experience of directors in publicly traded biotech/pharmaceutical enterprises could significantly affect R&D investment [31]. Moreover, an increasing line of literature also provides empirical evidence that directors’ educational background, a predominate indicator representing human capital, is associated with a firm’s R&D investment [32]. Given the fact that directors in Chinese listed firms are basically master’s degree holders [33], the director’s postgraduate education experience deserves more attention. However, prior literature primarily captures directors’ level of education, while their disciplinary background and graduation institution characteristics are largely ignored. This paper aims to fill this gap.
Although directors’ postgraduate education experience has natural correlation to R&D activities of their companies, conclusions of existing related empirical research are not consistent. According to some studies, higher levels of education of directors will promote R&D investment in high-tech industries such as chemical, pharmaceuticals, and astronavigation. Furthermore, directors with a master’s or a doctoral degree may lead their partners to focus on research and development [34]. However, according to a study based on 225 listed companies in the USA in the biotechnology and pharmaceuticals industry, not all directors with doctoral degrees focus on research and development [31]. One possible reason for their findings is that they count not only PhDs as doctorates, but also JD (Doctor of Jurisprudence), and MD (Doctor of Medicine). JD and MD are mainly practice-based instead of research-based, which may interfere the causality to a certain extent. Studies base on Taiwan companies found that the higher the level of director’s education is, the more R&D investment will be made [32,35]. Therefore, the following research hypotheses are proposed regarding the education levels of board directors and their relationship with R&D investment in a firm:
H1a:
The higher the proportion of directors with master’s degrees is, the more R&D investment will be made.
H1b:
The higher the proportion of directors with doctoral degrees is, the more investment in corporate research and development will be made.
In addition to levels of education, the disciplinary background of directors may have influence on corporate R&D investment. Students may form different cognitive bases, depending on their training received from fields of engineering, science, arts and humanities, and social sciences [19]. Directors with degrees in science or engineering fields focus more on technical advancement, research and development innovation, and add more investment to R&D activities [36,37]. In addition, directors with background in economics and management may see economic values from innovation for research and development easier and focus more on R&D activities, depending on their knowledge of effectively controlling risks of innovation investment. Therefore, for the discipline background of directors with a postgraduate degree, research hypotheses have been proposed as follows:
H2a:
The higher the proportion of directors with degrees in science and engineering is, the more R&D investment will be made.
H2b:
The higher the proportion of directors with degrees in economics and management is, the more R&D investment will be made.
Institution of graduation is another possible factor that might have influence on directors’ attitudes towards R&D investment. A study [31] based on listed companies in the United States indicated that directors graduating from Ivy League institutions are more likely to increase investment in corporate R&D activities as compared with those graduating from non-Ivy League institutions, likely due to more exposure to leading research and active communication with elite scholars during their graduate programs.
In China, more and more research-intensive universities are making efforts to integrate scientific research while cultivating students. In some top universities, postgraduate students are provided with opportunities to participate in scientific research, even achieving some world-level research results. Therefore, it is necessary to empirically examine whether directors who graduated from China’s well-known universities pay more attention to corporate research and development. In addition, some studies also argue that entrepreneurs who graduated from institutions overseas will present the ‘knowledge spillover effect’ after returning to China and are likely to value innovative entrepreneurship, and research and development higher [38]. With more and more overseas postgraduate education degree holders returning, further empirical evidence is needed for the claim that directors with degrees granted by institutions outside of China are more likely to invest more on R&D activities. Therefore, for directors with master’s or doctoral degrees, research hypotheses have been proposed as below:
H3a:
The higher the proportion of directors graduating from elite colleges and universities is, the more investment on research and development will be made.
H3b:
The higher the proportion of directors graduating from overseas institutions is, the more investment on research and development will be made.
3. Methods
3.1. Data
Data used in this research were collected from two sub-databases of the China Stock Market and Accounting Research (CSMAR), Shenzhen, China database, which contains comprehensive information of all listed companies in China in its 38 sub-databases. This project collected data from two sub-databases: role characteristics database for detailed information about board directors, and research and development sub-database for detailed expenditure on R&D activities in those companies. The data utilized in this paper were collected through the following steps: 1) We extracted the education characteristics of board directors for the 3752 listed companies in China from the role characteristics subset of the CSMAR database. 2) We extracted the R&D expenditure, board size, and asset-liability ratio for the 3752 listed companies in China from the research and development subset of CSMAR database. 3) We matched data from the first two steps and removed companies that miss information for core variables that we are interested in, including R&D investment, industry type, asset and liability of enterprises, educational level, disciplinary background, graduation institution, and working experience of directors, which fields a final list of 1374 companies.
In the first step, we gathered original data from two CSMAR sun-databases, and 3752 companies was included. One is the role characteristics of listed company sub-database, from which we extracted directors’ postgraduate education characteristics. The other is the research and development innovation sub-database, from which we extracted the firm’s R&D investment, board size, asset-liability ratio, etc. The expiration date of data collection was 31 December 2017. In the second step, we matched the director’s individual characteristics with the firm’s financial data. In the third step, deleting observations if the core variables were missed. Finally, 1374 companies consisted of our sample. Table 1 reports the comparison between sample and population in terms of asset-liability ratio and industry distribution. Chi-squared test suggests there is no significant difference between sample and population. Therefore, there are reasons to believe that our sample represents well. ‘GB/T 4754—2017’ in China classifies industry into 20 categories. According to research needs, this paper recombines them into 7 groups. There are commercial companies, financial and real estate companies, public utility companies, companies in agriculture, forestry, animal husbandry, and fishery, industrial companies, cultural, educational and sports companies, and IT companies, respectively. In general, our sample includes 24 commercial companies, 16 financial and real estate companies, 67 public utility companies, 11 companies in agriculture, forestry, animal husbandry, and fishery, 1066 industrial companies, 42 cultural, educational, and sports companies, and 148 IT companies.
3.2. Definition of Variables and Statistical Techniques
CSMAR uses absolute value and relative value to quantify the investment in research and development. The absolute value refers to the total amount of R&D investment within a certain time range, while relative value refers to the ratio between the total amount of R&D investment and the total sales [38,39,40], total assets [41,42,43], or the employees’ number [44,45] within a certain time range. This study mainly focuses on the relative degree of attention paid to innovation for research and development by listed companies. Taking into account the availability of data, and the various sizes of companies, this project operationalized R&D investment as the proportion of total amount of R&D investment normalized by total sales.
This paper examines the postgraduate education of directors from the perspectives of education level, discipline background, and graduation institution. This paper uses the proportion of directors with master’s degrees and proportion of directors with doctoral degrees as the two indicators of education level. Discipline background is quantified using: the proportion of directors with degrees from science and engineering field and the proportion of directors with degrees from economics and management. Graduation institution of directors is measured upon: the percentage of directors graduated from C9 universities and the percentage of directors graduated from overseas institutions. The C9 is China’s first collegiate league among elite universities. It was launched in October 2009. The alliance members include Peking University, Tsinghua University, Fudan University, Shanghai Jiaotong University, Nanjing University, Zhejiang University, University of Science and Technology of China, Harbin Institute of Technology, and Xi ‘an Jiaotong University. The postgraduate education characteristics of directors is not the only potential factor of R&D investment. Directors’ working experience, corporate asset-liability ratio, industry type, and total assets are adopted as control variables in this study.
All the variables in this paper and its definition are listed in the Table 2.
This paper uses basic descriptive statistics to explore the data first. OLS regression is used to test the influence of directors’ postgraduate education characteristics on the firm’s R&D investment overall and by industry. Taking into account potential endogeneity issues, more control variables were added and IV2SLS regression was employed to ensure the robustness of the result.
3.3. Descriptive Statistics
Table 3 shows the descriptive statistics for all variables of interest in this paper. In 2017, the average proportion of R&D investment in listed companies of China reached 5.10% and the maximum proportion of R&D investment reached 76.35%. In terms of directors’ postgraduate education level, nearly half (48%) of directors in listed companies have master’s degrees and 24% have doctoral degrees as their highest degrees. In terms of discipline background, approximately 46% of directors got degrees from economics and management and 15% from science and engineering. In terms of graduation institutions, about 18% of directors graduated from C9 institutions in China and 15% from overseas institutions. In addition, roughly 24% of directors were engaged in research and development positions once.
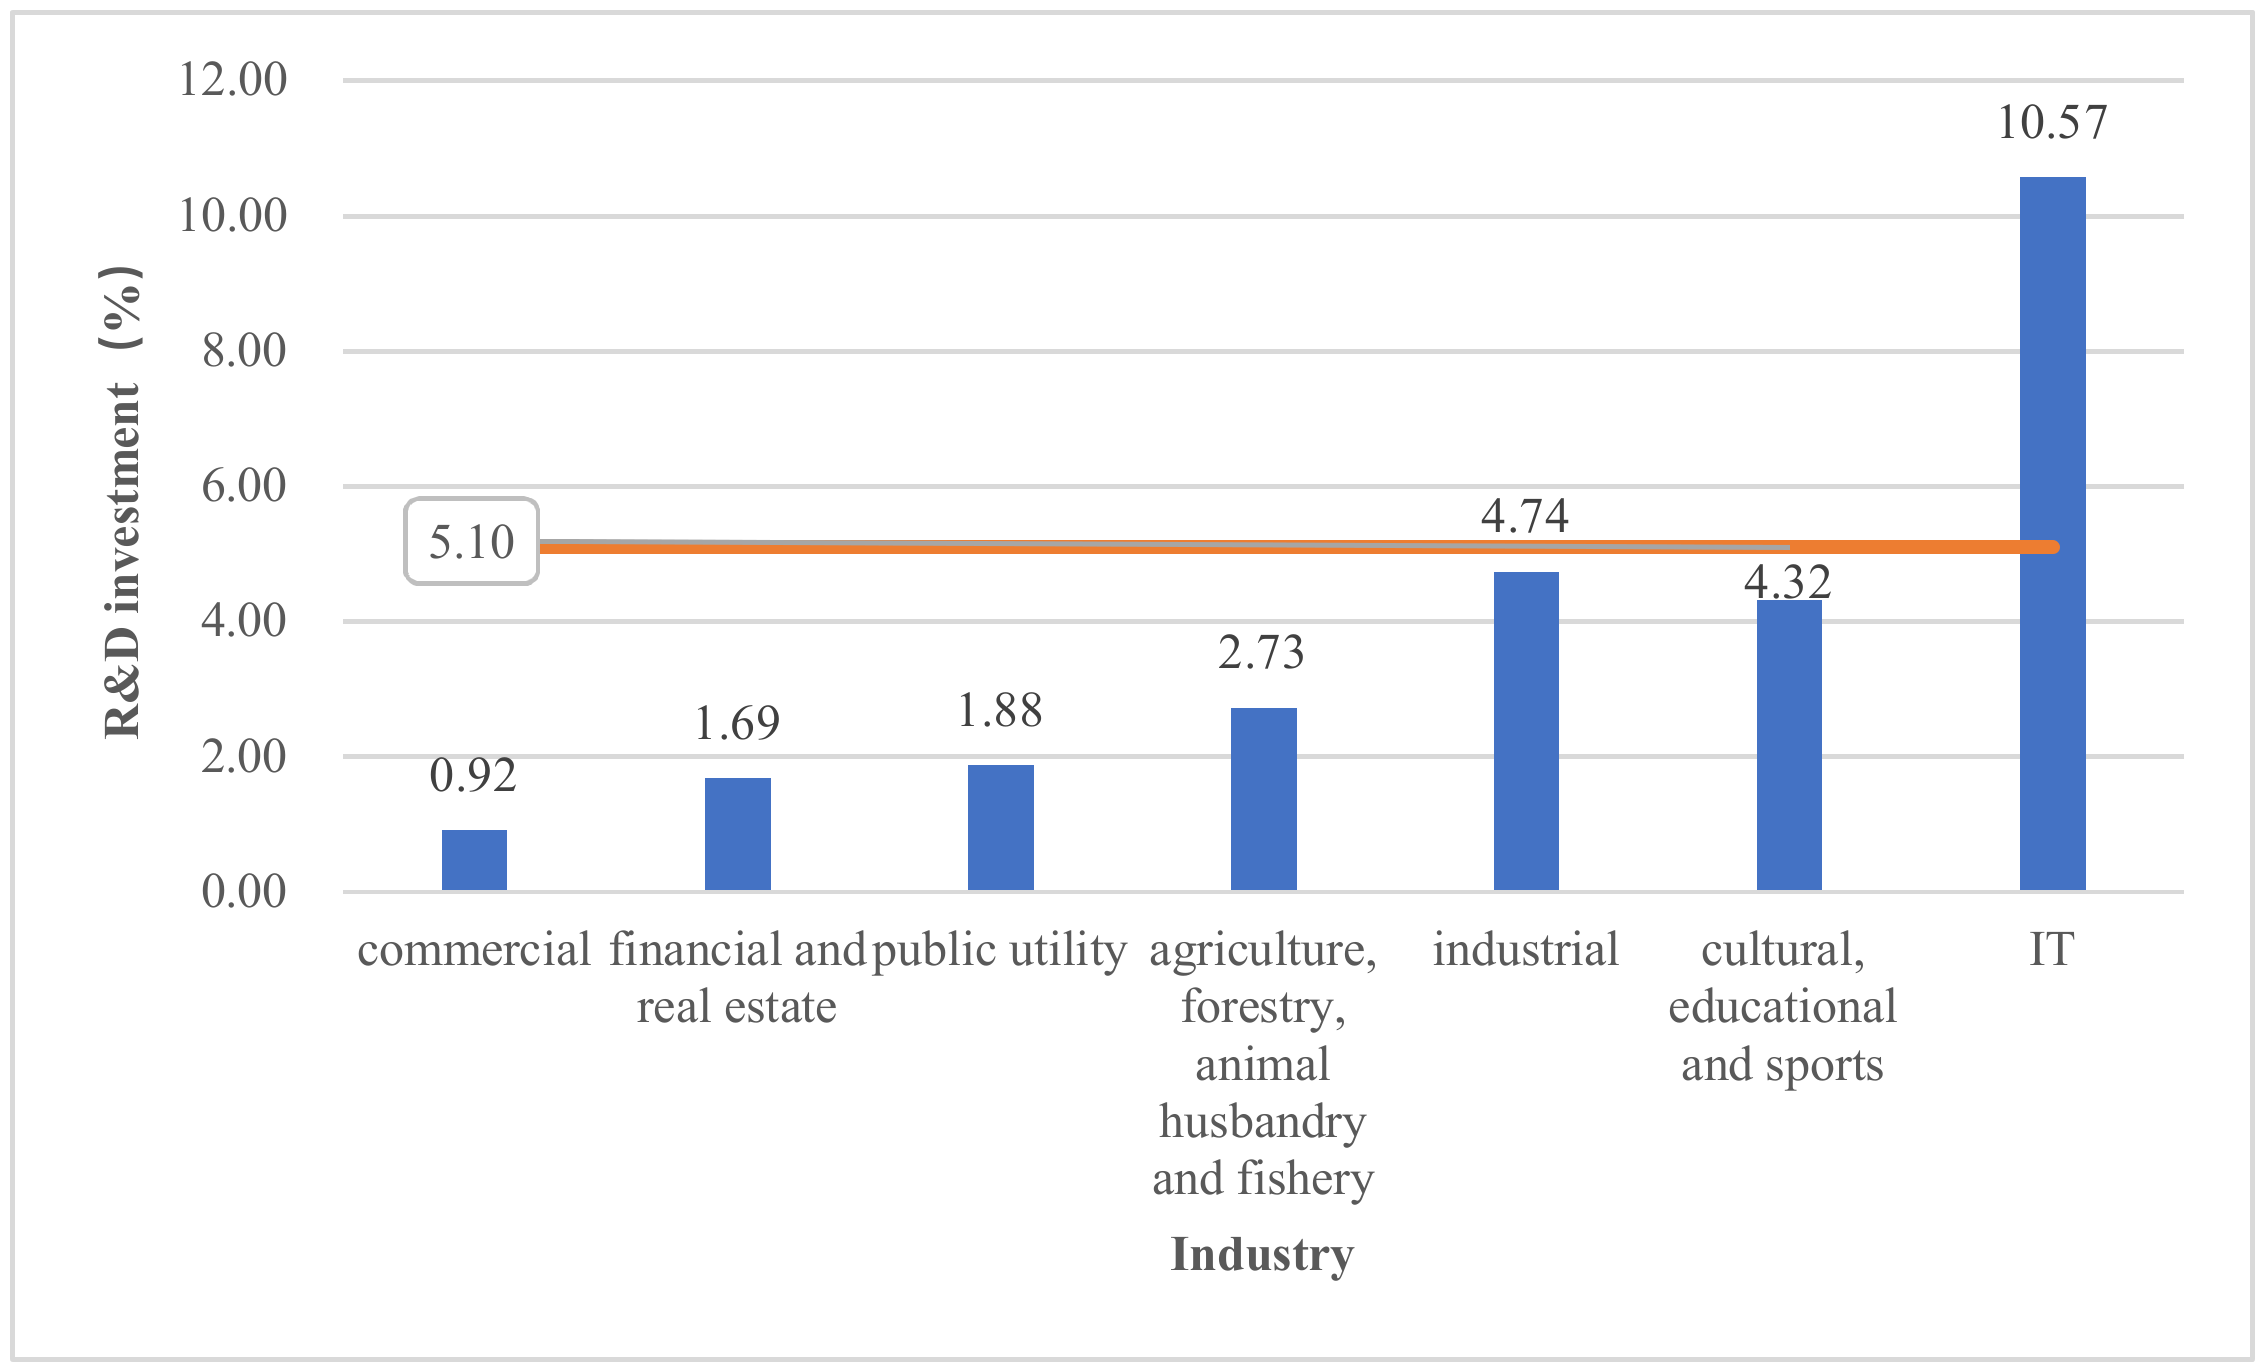
R&D investment amount varies by industry. As shown in Figure 1, the selected companies on average invested about 5.10% of the total sales on R&D activities. The IT industry has the highest (10.57%) R&D investment ratio among all industries, followed by industrial companies (4.74%) and cultural, educational, and sports companies (4.32%). Commercial companies spent the least (0.92%) among all industries on R&D activities.
Table 4 presents the distribution of directors’ postgraduate education characteristics in listed companies by industry. In term of education level, the proportion of directors with master’s degrees in listed companies is higher than that with doctoral degrees across industries. The largest gap of this exists in agriculture, forestry, animal husbandry, and fishery companies: where the proportion of directors with doctoral degrees is the lowest and the proportion of directors with master’s degrees is the highest among all industries. The proportion of directors with doctoral degrees in public utility companies is the highest. In term of discipline background, the proportion of directors majoring in economics and management in each industry is far higher than that in science and engineering, which is most prominent in agriculture, forestry, animal husbandry, and fishery companies. In term of graduation institution, the percentage of directors graduating from C9 universities and overseas institutions in agriculture, forestry, animal husbandry, and fishery companies is the highest. The lowest figure for directors graduating from C9 universities and graduating from overseas institutions appears in industrial and commercial companies, respectively.
4. Results
4.1. Overall Influence of Directors’ Postgraduate Education Characteristics on a Firm’s R&D Investment
The OLS regression is applied to explore the influence of directors’ postgraduate education characteristics on R&D investment in the listed companies. Model 1, model 3, and model 5 are benchmark models that only include independent variables to reflect net influence of directors’ education level, discipline background, and graduation institutions on a firm’s R&D investment, respectively. Model 2, model 4, and model 6 include three control variables, i.e., corporate asset-liability ratio, industry, and the proportion of directors with work experience in R&D positions. Model 7 involves all the independent and control variables. Table 5 documents the OLS regression results.
As the regression results show, when control variables are introduced based on the benchmark model, the F value and R-value increase prominently, and the F value is statistically significant (p = 0.00). This indicates that the fitting and explanation degree of the model enhances significantly after the introduction of control variables. According to model 2, model 4, model 6, and model 7, the higher the proportion of directors with doctoral degrees is, the more investment in research and development will be made. This result fails to reject the hypothesis 1b. However, proportions of directors with master’s degrees, director’s discipline background, and graduation institution do not show significant impact on the amount of R&D investment in companies.
The regression coefficient of control variables also manifests the director’s R&D working experience, a significantly positive relationship with the firm’s R&D investment. However, asset-liability ratio exerts a significantly negative effect on R&D investment. In addition, regression results shown in Table 3 also indicate the industrial heterogeneity of the influence of directors’ postgraduate education characteristics on R&D investment in listed companies. Therefore, it is necessary to further run additional regressions by industry.
4.2. The Influence of Directors’ Postgraduate Education Characteristics on a Firm’s R&D Investment by Industry
Giroud and Mueller have justified that the product market competition should be considered in order to determine the relationship between corporate governance and R&D policy [46]. Therefore, it is necessary to explore the relationship between directors’ postgraduate education characteristics and a firm’s R&D investment by individual industry since each industry may face different competitions. Due to the limited number of companies in some industries, this study further recategorized industries into the first industry (11 companies, including agriculture, forestry, animal husbandry, and fishery industry), the second industry (1066 companies, including industrial industry), and the third industry (297 companies, including commercial, financial and real estate, public utilities, culture, education, sports, and IT industry). The first industry was excluded from further analysis due to its small sample size.
The model settings for analyzing the second and the third industry are similar to that shown in Table 5. As shown in Table 6, in the second industry, the higher the percentage of directors with master’s degrees and doctoral degrees, the more investment to corporate research and development, controlling directors’ work experience in R&D positions, and corporate asset-liability ratio. However, the landscape in the third industry shows substantial distinctions: with the same variables controlled, no significant relationship between board directors’ education characteristic and the RD investment of a firm was observed.
4.3. Influence of Directors’ Postgraduate Education Characteristics on IT Companies’ R&D Investment
The R&D expenditure in the IT industry is almost two times the average level (seen in Figure 1), which plays a decisive role in the overall level of corporate R&D investment in China. Although the previous analysis on all companies indicates that directors’ postgraduate education has no significant impact on R&D investment efforts in a company, it is still necessary to analyze this relationship for IT companies due to the large amount of R&D expenditure and distinctive business feature.
According to the regression results in Table 7, the percentage of directors with master’s degrees has a negative correlation with R&D investment in the IT industry. That is, the higher the percentage of directors with master’s degrees, the less money a company spends on R&D activities. Additionally, the percentage of doctoral degree holders on board, discipline background, graduation institutions, and previous work experience in R&D positions has no significant influence on R&D investment expenditure.
4.4. Robustness Test
Endogeneity is a common plague in research involving corporate governance, firm policy, and performance [47]. There are many unobservable factors that may affect the hiring decision and R&D policy simultaneously, such as board directors’ capacity, the firm culture, and so on. Coles and Li [48,49] identified that unobserved attributes of managers have a strong empirical association with riskier corporate policies, such as a higher R&D investment amount. Capacity of board directors can also lead to endogeneity problems. It is common that board directors’ capacity is not only associated with their probability of attending postgraduate education, but also has a relationship with the firm’s policy in terms of R&D investment. Thus, it will be biased to quantify the relationship between the director’s postgraduate education characteristics and the firm’s R&D investment without considering these variables. To address the endogeneity problem, Li suggested an extensive range of statistical methods and compared both the advantages and disadvantages of each method [50]. This paper chose to use control variables and the IV method to treat endogeneity issues, considering the nature and the availability of the data.
Corporate asset is directly associated with board members’ capacity. Thus, we further added corporate asset into the statistic model as a control variable. Regression results reported in Table 8 suggest our estimation is robust after controlling additional firm attributes.
IV estimation is commonly used to mitigate the endogeneity problem caused by omitted variables. Using the IV approach needs to meet two conditions, i.e., IV must related to the endogenous explanatory variable and unrelated to the disturbing term. Previous engagement in R&D work is highly related with postgraduate education experience. The data from the Chinese Science and Technology Statistics Yearbook shows: 35.62% and 17.73% of people employed by R&D institutions are master’s and doctoral degree holders [51]. Nonetheless, previous engagement in R&D work is usually not the requirement of being a board director. Additionally, we found the proportion of directors with master’s degrees is significantly negatively related to a firm’s R&D investment in the IT industry, which is different from the rest of the industries. Therefore, we used engagement in R&D work as the IV to test the robustness of our research results. IV 2SLS regression results are presented in Table 9. The first stage regression shows IV is highly related to the endogenous variable (p = 0.00). F statistics (F = 24.80) is greater than the normal threshold of 10, indicating our IV passes the weak IV test and has strong explanatory power to the endogenous variable. The second stage regression results are consistent with Table 5. Therefore, the robustness of our regression results can be confirmed here.
5. Discussion and Conclusion
Based on a sample of 1374 listed companies in China, this study analyzed the influence of directors’ postgraduate education characteristics on R&D investment.
First, the R&D investment of China’s listed companies needs further improvement and its distribution among different industries is highly uneven. The average proportion of a Chinese firm’s R&D expenditure was 5.10% in 2017, which indicates a considerable R&D gap between China and the United States since the average R&D spending of American firms reached 14.5% from 1995 to 2015 [52]. Enterprise is the main driving force of a national innovation system. With the intention of building an innovative country, corporations should be encouraged to increase their R&D investment. When they are broken down to different industries, listed companies could be classified into four tiers, where IT industry was in the first tier, with R&D investment exceeding 10%. The second tier covered industrial (4.74$) and culture, education, and sports (4.32%). The next tier included agriculture, forestry, animal husbandry, and fishery (2.73%), public utilities (1.88%), and financial and real estate industry (1.69%). Commercial industry was classified into the fourth tier since its R&D expenditure was less than 1% (0.92%).
Second, the proportion of doctorates contributes significantly to the amount of R&D investment in firms, with the corporate asset-liability ratio, industry, and director’s working experience being controlled. This finding helps to confirm the hypothesis that highly-educated directors are likely to increase the firm’s R&D investment. As Wally and Baum noted, higher levels of education usually means greater cognitive ability [53], which allows for higher ambiguity toleration [36], better understanding of new ideas [37], more creative solutions to tackle complicated situations [54], all of which pave the way to increasing R&D investment. In respect to discipline background, science and engineering education experience may equip directors with innovation management knowledge and skills so that they gain more confidence to invest more on R&D activities [55]. But the graduation institution does not seem to have impact on directors’ decision towards R&D investment. On one hand, this finding confirmed the important role of doctoral education in promoting a firm’s R&D investment. On the other hand, the ‘Top End Effect’ shall not be excessively emphasized, and overseas returners may not bring in more R&D investment. The influence from the non-elite postgraduate education institutions are essential to the improvement of a firm’s R&D investment as well.
Third, the influence of directors’ postgraduate education characteristics on their firm’s R&D investment generally occurs in the second industry. The higher the percentage of directors with postgraduate education degrees is, the more R&D investment will be. This is consistent with previous research conclusions based on the data from China’s manufacturing industry [56]. Compared with other industries, the percentage of directors with master’s degrees in industrial companies is relatively lower and has space for improvement. Therefore, enhancing the postgraduate education level for directors in industrial enterprises, especially increasing the percentage of directors with master’s degrees on the board, may be one of the strategies to enlarge R&D investment for this industry.
Fourth, the high proportion of directors with master’s degrees in the IT industry prevents corporate R&D investment. After employing the IV approach, the result is still robust. To find out the possible explanation, we checked the original data of the IT company with the lowest R&D investment (code = 300226). Results show it only invested 0.06% of total sales in R&D activities and its asset-liability ratio was up to 78%. As for its board configuration, all the directors are master’s degree holders and majored in economics and management. This typical case indicates some IT companies tend to develop through raising capital instead of R&D innovation. Descriptive statistics reveal that nearly half (48%) of directors in this industry hold master’s degrees, whereas the percentage of doctorate holders is only 24 percent. In terms of discipline background, 42% of directors majored in economics and management and only 20% majored in science and engineering. This may explain the negative coefficient between the percentage of master’s degree holders and R&D investment in the IT industry.
6. Implication and Limitation
To summarize, this paper contributes to related research both theoretically and practically. In term of theoretical contribution, our findings extend the streams of literature concerning innovation management theory, upper echelon theory, and human capital theory by examining how the firm’s R&D investment is affected by postgraduate education experience of directors, such as their education level, discipline background, and graduation institution. In contrast to prior innovation management research highlighting external determinants of corporate R&D innovation, our research finds the higher the percentage of directors with doctoral degrees, the more investment in R&D activities. This provides empirical evidence that internal factors from the board of directors also play an important role in R&D activities. In line with the research from the perspective upper echelon theory, this paper pays attention to a director’s individual characteristics as well, especially educational characteristics. Our research findings indicate the association between a director’s postgraduate education characteristics and a firm’s R&D investment varies in different industry environments. In the second industry, which mainly consists of industrial companies, the higher proportion of postgraduate education degree holders as directors, the more expenditure in R&D activities. However, this correlation is not statistically significant in the third industry, which involves commercial, financial and real estate, public utilities, culture, education, sports, and IT companies. Through the lens of the human capital theory, there is economic value embedded in postgraduate education, which is justified in this paper in respect to R&D investment. In addition to the positive impact of human capital on economic growth and R&D innovation that has been studied thoroughly, our contribution lies in unpacking the complexity in reality due to certain attributes of both board directors and corporate developing strategies. Findings from IT companies confirm that, if a capital-driven strategy is adopted, directors with master’s degrees and an economics and management background tend to reduce R&D investment. In term of practical contribution, our research findings lead to several prominent implications for enhancing the whole R&D investment of China’s listed companies. Enterprises should realize the correlations between directors’ postgraduate education characteristics and R&D investment, and then adopt targeting innovative strategies through board staffing and configuring. For the achievement of sustainable innovation of a state, national policy should also encourage universities to increase the availability of innovation and entrepreneurship education in the curricula system of postgraduate education.
Limitations of this paper and further research directions mainly lie in the following two aspects. First, R&D activities are highly risky and demand long-term investment [57]. Due to the fact that a firm’s R&D investment has path-dependent inertia to some extent, tracking and analyzing synchronic rules of an enterprise’s R&D investment will be the next research emphases. What’s more, other factors like firm culture and technical advancement may also affect R&D investment and board hiring decisions. Limited by the availability of data in the CSMAR database, these factors are not considered in this paper. Future research may collect additional companies, and also extra variables to better model their contributions to R&D investment.
Author Contributions
Conceptualization, C.W. and C.N.; methodology, C.W., J.Y. and Z.C.; writing—original draft preparation, C.W. and J.Y.; writing—review and editing, C.W., J.Y., Z.C. and C.N.
Funding
This research received no external funding.
Conflicts of Interest
The authors declare no conflict of interest.
References
- Pradhan, R.P.; Arvin, M.B.; Nair, M.; Bennett, S.E.; Hall, J.H. The information revolution, innovation diffusion and economic growth: An examination of causal links in European countries (report). Qual. Quant. 2019, 53, 1529. [Google Scholar] [CrossRef]
- Andergassen, R.; Nardini, F.; Ricottilli, M. Innovation diffusion, general purpose technologies and economic growth. Struct. Chang. Econ. Dyn. 2017, 40, 72–80. [Google Scholar] [CrossRef]
- Liu, C.; Xia, G. Research on the dynamic interrelationship among R&D investment, technological innovation, and economic growth in China. Sustainability 2018, 10, 4260. [Google Scholar]
- Alam, A.; Uddin, M.; Yazdifar, H. Financing behaviour of R&D investment in the emerging markets: The role of alliance and financial system. R D Manag. 2019, 49, 21–32. [Google Scholar] [CrossRef]
- Xu, J.; Sim, J.W. Characteristics of corporate R&D investment in emerging markets: Evidence from manufacturing industry in China and South Korea. Sustainability 2018, 10, 3002. [Google Scholar]
- Jin, S.H.; Choi, S.O. The effect of innovation capability on business performance: A focus on IT and business service companies. Sustainability 2019, 11, 5246. [Google Scholar] [CrossRef]
- National Science Board. Science and Engineering Indicators (2018 Digest); National Science Foundation: Alexandria, VA, USA, 2018; p. 5. [Google Scholar]
- National Statistics Bureau; Ministry of Science and Technology; Ministry of Finance. 2017 National Science and Technology Funding Statistical Bulletin. Available online: http://www.stats.gov.cn/tjsj/zxfb/201810/t20181009_1626716.html (accessed on 26 June 2019).
- Hernández, H.; Grassano, N.; Tübke, A.; Potters, L.; Gkotsis, P.; Vezzani, A. EU R&D Scoreboard the 2018 EU Industrial R&D Investment Scoreboard; Publications Office of the EU: Luxembourg, 2018. [Google Scholar]
- Alam, A.; Uddin, M.; Yazdifar, H. Institutional determinants of R&D investment: Evidence from emerging markets. Technol. Forecast. Soc. Chang. 2019, 138, 34–44. [Google Scholar] [CrossRef]
- Masino, S. Macroeconomic volatility, institutional instability and the incentive to innovate. Rev. Dev. Econ. 2015, 19, 116–131. [Google Scholar] [CrossRef]
- Zhao, X.; Wang, Z.; Deng, M. Interest rate marketization, financing constraints and R&D investments: Evidence from China. Sustainability 2019, 11, 2311. [Google Scholar]
- Allard, G.; Martinez, C.A.; Williams, C. Political instability, pro-business market reforms and their impacts on national systems of innovation. Res. Policy 2012, 41, 638–651. [Google Scholar] [CrossRef]
- Seitz, M.; Watzinger, M. Contract enforcement and R&D investment. Res. Policy 2017, 46, 182–195. [Google Scholar] [CrossRef]
- Srholec, M. A multilevel analysis of innovation in developing countries. Ind. Corp. Chang. 2011, 20, 1539–1569. [Google Scholar] [CrossRef]
- Lai, Y.-L.; Lin, F.-J.; Lin, Y.-H. Factors affecting firm’s R&D investment decisions. J. Bus. Res. 2015, 68, 840–844. [Google Scholar] [CrossRef]
- Galende, J.; de La Fuente, J.M. Internal factors determining a firm’s innovative behaviour. Res. Policy 2003, 32, 715–736. [Google Scholar] [CrossRef]
- Fishman, A.; Rob, R. The size of firms and R&D investment. Int. Econ. Rev. 1999, 40, 915–931. [Google Scholar]
- Hambrick, D.C.; Mason, P.A. Upper echelons: The organization as a reflection of its top managers. Acad. Manag. Rev. 1984, 9, 193–206. [Google Scholar] [CrossRef]
- Wang, G.; Holmes, R.M.; Oh, I.S.; Zhu, W. Do CEOs matter to firm strategic actions and firm performance? A meta-analytic investigation based on upper echelons theory. Pers. Psychol. 2016, 69, 775–862. [Google Scholar] [CrossRef]
- Hambrick, D. Upper echelons theory: An update. Acad. Manag. Rev. 2007, 32, 334–343. [Google Scholar] [CrossRef]
- Wendler, C.; Bridgeman, B.; Cline, F.; Millett, C.; Rock, J.; Bell, N.; McAllister, P. The Path Forward: The Future of Graduate Education in the United States; Educational Testing Service: Princeton, NJ, USA, 2010. [Google Scholar]
- Kimberly, J.R.; Evanisko, M.J. Organizational innovation: The influence of individual, organizational, and contextual factors on hospital adoption of technological and administrative innovations. Acad. Manag. J. 1981, 24, 689. [Google Scholar] [CrossRef]
- Chen, H.-L.; Hsu, W.-T.; Huang, Y.-S. Top management team characteristics, R&D investment and capital structure in the IT industry. Entrep. J. 2010, 35, 319–333. [Google Scholar] [CrossRef]
- Torchia, M.; Calabrò, A.; Huse, M. Women directors on corporate boards: From tokenism to critical mass. J. Bus. Ethics 2011, 102, 299–317. [Google Scholar] [CrossRef]
- Rossi, F.; Hu, C.; Foley, M. Women in the boardroom and corporate decisions of Italian listed companies. Manag. Decis. 2017, 55, 1578–1595. [Google Scholar] [CrossRef]
- Yin, X.; Hai, B.L.; Chen, J. Financial constraints and R&D investment: The moderating role of CEO characteristics. Sustainability 2019, 11, 4153. [Google Scholar]
- Zhu, Z.; Wang, D. The Board Structure and R&D Investment—A Study on the Chinese Listed IT Companies. In Proceedings of the ISMOT 2012 International Symposium on Management of Technology (ISMOT), Hangzhou, China, 8–9 November 2012; pp. 226–229. [Google Scholar]
- Balsmeier, B.; Buchwald, A.; Stiebale, J. Outside directors on the board and innovative firm performance. Res. Policy 2014, 43, 1800–1815. [Google Scholar] [CrossRef]
- Guldiken, O.; Darendeli, I.S. Too much of a good thing: Board monitoring and R&D investments. J. Bus. Res. 2016, 69, 2931–2938. [Google Scholar] [CrossRef]
- Dalziel, T.; Gentry, R.J.; Bowerman, M. An integrated agency–Resource dependence view of the influence of directors’ human and relational capital on firms’ R&D spending. J. Manag. Stud. 2011, 48, 1217–1242. [Google Scholar] [CrossRef]
- Kuo, H.-C.; Wang, L.-H.; Yeh, L.-J. The role of education of directors in influencing firm R&D investment. Asia Pac. Manag. Rev. 2018, 23, 108–120. [Google Scholar] [CrossRef]
- Zhou, J.; Jin, Y.-Y.; Shang-Hua, R. Why do R&D Investments Differ in Different High-Tech Enterprises? The Role of Board Background. In Proceedings of the 2012 International Conference on Management Science & Engineering 19th Annual Conference, Dallas, TX, USA, 20–22 September 2012; pp. 671–678. [Google Scholar]
- Midavaine, J.; Dolfsma, W.; Aalbers, R. Board diversity and R&D investment. Manag. Decis. 2016, 54, 558–569. [Google Scholar] [CrossRef]
- Chen, H.-L. Board characteristics and R&D investment: Evidence from Taiwan’s electronics industry (report). Adv. Manag. Appl. Econ. 2012, 2, 161. [Google Scholar]
- Wiersema, M.F.; Bantel, K.A. Top management team demography and corporate strategic chang. Acad. Manag. J. 1992, 35, 91. [Google Scholar] [CrossRef]
- Barker, V.L.; Mueller, G.C. CEO characteristics and firm R&D spending. Manag. Sci. 2002, 48, 782–801. [Google Scholar] [CrossRef]
- Liu, X.; Wright, M.; Filatotchev, I.; Dai, O.; Lu, J. Human mobility and international knowledge spillovers: Evidence from high-tech small and medium enterprises in an emerging market. Strateg. Entrep. J. 2010, 4, 340–355. [Google Scholar] [CrossRef]
- Lee, P.M.; O’Neill, H.M. Ownership structures and R&D investments of U.S. and Japanese firms: Agency and stewardship perspectives. Acad. Manag. J. 2003, 46, 212–225. [Google Scholar]
- Tribo, J.A.; Berrone, P.; Surroca, J. Do the type and number of blockholders influence R&D investments? New evidence from Spain. Corp. Gov. Int. Rev. 2007, 15, 828–842. [Google Scholar] [CrossRef]
- Hosono, K.; Tomiyama, M.; Miyagawa, T. Corporate governance and research and development: Evidence from Japan. Econ. Innov. New Technol. 2004, 13, 141–164. [Google Scholar] [CrossRef]
- Lin, B.-W.; Lee, Y.; Hung, S.-C. R&D intensity and commercialization orientation effects on financial performance. J. Bus. Res. 2006, 59, 679–685. [Google Scholar] [CrossRef]
- Kor, Y.Y. Direct and interaction effects of top management team and board compositions on R&D investment strategy. Strateg. Manag. J. 2006, 27, 1081–1099. [Google Scholar] [CrossRef]
- Hill, C.W.L.; Snell, S.A. External control, corporate strategy, and firm performance in research-intensive industries. Strateg. Manag. J. 1988, 9, 577–590. [Google Scholar] [CrossRef]
- Graves, S. Institutional ownership and corporate R&D in the computer I. Acad. Manag. J. 1988, 31, 417. [Google Scholar] [CrossRef]
- Giroud, X.; Mueller, H.M. Corporate governance, product market competition, and equity prices. J. Financ. 2011, 66, 563–600. [Google Scholar] [CrossRef] [Green Version]
- Gippel, J.; Smith, T.; Zhu, Y. Endogeneity in accounting and finance research: Natural experiments as a state-of-the-art solution. Abacus 2015, 51, 143–168. [Google Scholar] [CrossRef]
- Coles, J.L.; Li, Z.F. Managerial attributes, incentives, and performance. SSRN 2019. [Google Scholar] [CrossRef]
- Coles, J.L.; Li, Z.F. An empirical assessment of empirical corporate finance. SSRN 2019. [Google Scholar] [CrossRef] [Green Version]
- Li, F. Endogeneity in CEO power: A survey and experiment. Invest. Anal. J. 2016, 45, 149–162. [Google Scholar] [CrossRef]
- Chinese Science and Technology Statistics Yearbook. Available online: http://tongji.oversea.cnki.net/chn/navi/YearBook.aspx?id=N2019030267&floor=1 (accessed on 7 November 2019).
- Yu, H.C.; Phan, T.T. Debt maturity and corporate R&D investment—The empirical study of US listed firms. Banks Bank Syst. 2018, 13, 1–16. [Google Scholar] [CrossRef] [Green Version]
- Wally, S.; Baum, J.R. Personal and structural determinants of the pace of strategic decision making. (includes appendices). Acad. Manag. J. 1994, 932. [Google Scholar] [CrossRef]
- Bantel, K.A.; Jackson, S.E. Top management and innovations in banking: Does the composition of the top team make a difference? Strateg. Manag. J. 1989, 10, 107–124. [Google Scholar] [CrossRef]
- Collins, G.; Paul, G.; Anne, H.; Keith, M.; Joyce, T. The management of technology: An essential part of training for engineers and scientists. Int. J. Technol. Manag. 1991, 6, 568–593. [Google Scholar]
- Qiang, H.; Song, C. Board education level distribution and R&D investment: Empirical study based on listed manufacturing firms. Soft Sci. 2011, 25, 121–126. [Google Scholar] [CrossRef]
- Baysinger, B.; Kosnik, R.; Turk, T. Effects on board and ownership structure on corporate R&D strategy. Acad. Manag. J. 1991, 34, 205–214. [Google Scholar]
Figure 1.
Distribution of R&D investment for listed companies by industry.


Table 1.
Comparison between sample and population (%).
| Asset-Liability Ratio | Industry | R&D Investment | ||||||
|---|---|---|---|---|---|---|---|---|
| Sample | Population | Sample | Population | Sample | Population | |||
| < 0.01 | 0.00 | 0.00 | CC | 1.75 | 4.92 | 0.01–10.00 | 91.35 | 89.52 |
| 0.01–0.20 | 21.62 | 17.77 | FR | 1.16 | 6.21 | 10.01–20.00 | 6.60 | 8.08 |
| 0.21–0.40 | 34.43 | 31.93 | PU | 4.88 | 9.78 | 20.01–30.00 | 1.47 | 1.67 |
| 0.41–0.60 | 30.13 | 29.68 | AFAF | 0.8 | 1.15 | 30.01–40.00 | 0.34 | 0.51 |
| 0.61–0.80 | 12.30 | 15.55 | IC | 77.58 | 67.55 | 40.01–50.00 | 0.10 | 0.07 |
| 0.81–1.00 | 1.09 | 4.64 | CES | 3.06 | 3.1 | 50.01–60.00 | 0.07 | 0.07 |
| ≥ 1.01 | 0.44 | 0.43 | IT | 10.77 | 7.28 | 60.01+ | 0.07 | 0.07 |
| χ2 = 3.68, p = 0.596 | χ2 = 8.09, p = 0.231 | χ2 = 1.39, p = 0.967 | ||||||
Note: CC: commercial companies; FR: financial and real estate companies; PU: public utility companies; AFAF: companies in agriculture, forestry, animal husbandry, and fishery; IC: industrial companies; CES: cultural, educational, and sports companies; and IT: IT companies.
Table 2.
Variable definition.
| Variable | Definition | Scale of Measurement |
|---|---|---|
| Dependent variable | ||
| R&D investment (%) | R&D expenditure normalized by total sales | continuous variable |
| Independent variables | ||
| PMD | proportion of directors with master’s degrees | continuous variable |
| PDD | proportion of directors with doctoral degrees | continuous variable |
| PEM | proportion of directors with degrees from economics and management | continuous variable |
| PSE | proportion of directors with degrees from science and engineering | continuous variable |
| PC9 | percentage of directors graduated from C9 universities | continuous variable |
| POI | percentage of directors graduated from overseas institutions | continuous variable |
| Control variables | ||
| RDE | percentage of director who has R&D work experience | continuous variable |
| ALR | asset-liability ratio | continuous variable |
| Industry | industry type | categorical variable, CC = 1, FR = 2, PU = 3, AFAF = 4, IC = 5, CES = 6, IT = 7 |
| Asset | natural logarithm of total asset | continuous variable |
| Instrumental variable | ||
| IFRD | if board members have engaged in R&D work | dummy variable, 1 if directors have engaged in R&D work |
Note: CC: commercial companies; FR: financial and real estate companies; PU: public utility companies; AFAF: companies in agriculture, forestry, animal husbandry, and fishery; IC: industrial companies; CES: cultural, educational, and sports companies; and IT: IT companies.
Table 3.
Results of descriptive statistics for each variable.
| Variable | N | Mean | Standard Deviation | Min. Value | Max. Value |
|---|---|---|---|---|---|
| Dependent variable | |||||
| R&D investment (%) | 1374 | 5.10 | 5.29 | 0 | 76.35 |
| Independent variables | |||||
| PMD | 1374 | 0.48 | 0.37 | 0 | 1 |
| PDD | 1374 | 0.24 | 0.32 | 0 | 1 |
| PEM | 1374 | 0.46 | 0.38 | 0 | 1 |
| PSE | 1374 | 0.15 | 0.26 | 0 | 1 |
| PC9 | 1374 | 0.18 | 0.29 | 0 | 1 |
| POI | 1374 | 0.15 | 0.28 | 0 | 1 |
| Other variables | |||||
| RDE | 1374 | 0.24 | 0.31 | 0 | 1 |
| ALR | 1374 | 0.38 | 0.20 | 0.02 | 1.63 |
| Industry | 1374 | 5.04 | 1.02 | 1 | 7 |
| Asset | 1374 | 22.05 | 1.31 | 18.11 | 28.51 |
| IFRD | 1374 | 0.49 | 0.50 | 0 | 1 |
Table 4.
Distribution of directors’ postgraduate education characteristics in listed companies by industry.
Table 4.
Distribution of directors’ postgraduate education characteristics in listed companies by industry.
| Total | CC | FR | PU | AFAF | IC | CES | IT | |
|---|---|---|---|---|---|---|---|---|
| PMD | 0.48 | 0.55 | 0.62 | 0.46 | 0.73 | 0.47 | 0.43 | 0.53 |
| PDD | 0.24 | 0.24 | 0.19 | 0.29 | 0.18 | 0.24 | 0.25 | 0.19 |
| PEM | 0.46 | 0.65 | 0.58 | 0.49 | 0.79 | 0.46 | 0.36 | 0.42 |
| PSE | 0.15 | 0.05 | 0.14 | 0.11 | 0.09 | 0.15 | 0.19 | 0.20 |
| PC9 | 0.18 | 0.23 | 0.23 | 0.19 | 0.24 | 0.17 | 0.20 | 0.19 |
| POI | 0.15 | 0.13 | 0.20 | 0.17 | 0.24 | 0.16 | 0.16 | 0.13 |
Note: CC: commercial companies; FR: financial and real estate companies; PU: public utility companies; AFAF: companies in agriculture, forestry, animal husbandry, and fishery; IC: industrial companies; CES: cultural, educational, and sports companies; and IT: IT companies.
Table 5.
OLS regression results of the influence of directors’ postgraduate education characteristics on a firm’s R&D investment.
Table 5.
OLS regression results of the influence of directors’ postgraduate education characteristics on a firm’s R&D investment.
| Model 1 | Model 2 | Model 3 | Model 4 | Model 5 | Model 6 | Model 7 | |
|---|---|---|---|---|---|---|---|
| PMD | 0.31 | 0.17 | 0.14 | ||||
| (1.04) | (0.65) | (0.53) | |||||
| PDD | 0.49 * | 0.59 ** | 0.53 * | ||||
| (1.70) | (2.28) | (1.95) | |||||
| PEM | −0.33 | 0.12 | 0.00 | ||||
| (−0.88) | (0.36) | (0.00) | |||||
| PSE | 2.14 *** | 1.01 * | 0.74 | ||||
| (3.46) | (1.87) | (1.36) | |||||
| PC9 | 0.25 | 0.18 | 0.01 | ||||
| (0.52) | (0.45) | (0.02) | |||||
| POI | −0.31 | 0.01 | −0.18 | ||||
| (−0.63) | (0.03) | (−0.41) | |||||
| Industry (CC as the reference group) | |||||||
| ALR | −4.99 *** | −4.76 *** | −4.83 *** | −4.90 *** | |||
| (−5.01) | (−4.64) | (−4.71) | (−4.94) | ||||
| FR | 1.38 ** | 1.38 * | 1.48 ** | ||||
| (1.98) | (1.89) | (2.07) | |||||
| PU | 0.70 * | 0.82 ** | 0.84 ** | ||||
| (1.69) | (1.98) | (2.05) | |||||
| AFAF | 1.86 * | 1.67 * | 1.74* | ||||
| (1.89) | (1.72) | (1.77) | |||||
| IC | 3.02 *** | 3.02 *** | 3.07 *** | ||||
| (7.92) | (7.61) | (7.85) | |||||
| CES | 2.38 *** | 2.44 *** | 2.54 *** | ||||
| (3.78) | (3.90) | (3.98) | |||||
| IT | 8.54 *** | 8.54 *** | 8.63 *** | ||||
| (11.50) | (11.52) | (11.74) | |||||
| RDE | 1.40 *** | 1.27 *** | 1.50 *** | 1.21 *** | |||
| (3.23) | (2.99) | (3.48) | (2.85) | ||||
| Constant | 4.67 *** | 2.87 *** | 4.92 *** | 2.99 *** | 5.10 *** | 3.08 *** | 2.88 *** |
| (17.51) | (4.32) | (18.93) | (4.55) | (27.09) | (4.99) | (4.15) | |
| N | 1374 | 1374 | 1374 | 1374 | 1374 | 1374 | 1374 |
| r2 | 0.00 | 0.20 | 0.01 | 0.20 | 0.00 | 0.19 | 0.20 |
| F | 1.84 | 35.79 | 8.56 | 34.33 | 0.36 | 34.09 | 25.77 |
Note: CC: commercial companies; FR: financial and real estate companies; PU: public utility companies; AFAF: companies in agriculture, forestry, animal husbandry, and fishery; IC: industrial companies; CES: cultural, educational, and sports companies; and IT: IT companies. t statistics in parentheses. * p < 0.1, ** p < 0.05, *** p < 0.01.
Table 6.
OLS regression results of the influence of directors’ postgraduate education characteristics on a firm’s R&D investment by industry.
Table 6.
OLS regression results of the influence of directors’ postgraduate education characteristics on a firm’s R&D investment by industry.
| Model 1 | Model 2 | Model 3 | Model 4 | Model 5 | Model 6 | Model 7 | |
|---|---|---|---|---|---|---|---|
| The second industry | |||||||
| PMD | 0.56 ** | 0.69 ** | 0.68** | ||||
| (2.00) | (2.51) | (2.39) | |||||
| PDD | 0.57 ** | 0.62 ** | 0.56 ** | ||||
| (2.09) | (2.26) | (1.98) | |||||
| PEM | −0.05 | 0.23 | 0.05 | ||||
| (−0.13) | (0.59) | (0.11) | |||||
| PSE | 1.67 *** | 1.07 * | 0.69 | ||||
| (3.01) | (1.88) | (1.12) | |||||
| PC9 | 0.08 | −0.02 | −0.29 | ||||
| (0.17) | (−0.04) | (−0.60) | |||||
| POI | 0.02 | 0.11 | −0.23 | ||||
| (0.05) | (0.22) | (−0.46) | |||||
| ALR | −4.20 *** | −3.85 *** | −3.90 *** | −4.13 *** | |||
| (−6.02) | (−5.53) | (−5.62) | (−5.89) | ||||
| RDE | 1.52 *** | 1.41 *** | 1.64 *** | 1.36 *** | |||
| (3.62) | (3.16) | (3.93) | (3.04) | ||||
| Constant | 4.12 *** | 5.22 *** | 4.51 *** | 5.57 *** | 4.72 *** | 5.79 *** | 5.23 *** |
| (15.98) | (14.51) | (17.18) | (14.72) | (25.78) | (17.27) | (13.09) | |
| The third industry | |||||||
| PMD | −1.54 | −0.98 | −1.13 | ||||
| (−1.58) | (−1.09) | (−1.23) | |||||
| PDD | −0.14 | −0.16 | −0.19 | ||||
| (−0.16) | (−0.20) | (−0.23) | |||||
| PEM | −1.48 | −0.96 | −0.10 | ||||
| (−1.10) | (−0.78) | (−0.26) | |||||
| PSE | 3.89 ** | 1.81 | −0.77 | ||||
| (2.05) | (0.99) | (−0.58) | |||||
| PC9 | 0.57 | 0.49 | 2.46 | ||||
| (0.37) | (0.35) | (1.25) | |||||
| POI | −1.86 | −1.10 | 0.38 | ||||
| (−1.04) | (−0.67) | (0.25) | |||||
| ALR (%) | −13.84 *** | −13.72 *** | −14.02 *** | −13.34 *** | |||
| (−7.21) | (−7.16) | (−7.33) | (−6.87) | ||||
| RDE | 3.10 ** | 2.38 * | 2.91 ** | 2.30 | |||
| (2.24) | (1.65) | (2.10) | (1.59) | ||||
| Constant | 7.67 *** | 12.07 *** | 6.49 *** | 11.52 *** | 6.63 *** | 11.45 *** | 12.21 *** |
| (8.31) | (10.68) | (7.33) | (10.02) | (10.87) | (11.63) | (9.59) | |
Note: t statistics in parentheses. * p < 0.1, ** p < 0.05, *** p < 0.01.
Table 7.
Regression results of the influence of directors’ postgraduate education characteristics on R&D investment in the IT industry.
Table 7.
Regression results of the influence of directors’ postgraduate education characteristics on R&D investment in the IT industry.
| Model 1 | Model 2 | Model 3 | Model 4 | Model 5 | Model 6 | Model 7 | |
|---|---|---|---|---|---|---|---|
| PMD | −4.80 ** | −3.87 ** | −3.91 ** | ||||
| (−2.29) | (−2.07) | (−2.38) | |||||
| PDD | 0.92 | 0.42 | 0.33 | ||||
| (0.70) | (0.32) | (0.25) | |||||
| PEM | −1.02 | −0.68 | −1.02 | ||||
| (−0.38) | (−0.27) | (−0.46) | |||||
| PSE | 0.13 | −0.46 | −0.01 | ||||
| (0.04) | (−0.16) | (−0.00) | |||||
| PC9 | 1.35 | 2.82 | 2.98 | ||||
| (0.57) | (1.15) | (1.19) | |||||
| POI | −1.67 | 0.05 | 1.26 | ||||
| (−0.61) | (0.02) | (0.40) | |||||
| ALR | −13.09 *** | −14.77 *** | −15.41 *** | −13.83 *** | |||
| (−2.98) | (−3.17) | (−3.53) | (−3.65) | ||||
| RDE | 0.81 | 0.24 | 0.13 | 0.54 | |||
| (0.38) | (0.11) | (0.05) | (0.23) | ||||
| Constant | 13.84 *** | 17.47 *** | 10.97 *** | 15.76 *** | 10.52 *** | 15.07 *** | 17.55 *** |
| (6.41) | (5.50) | (6.10) | (5.44) | (10.17) | (6.32) | (8.25) | |
| N | 148 | 148 | 148 | 148 | 148 | 148 | 148 |
| r2 | 0.06 | 0.14 | 0.00 | 0.11 | 0.00 | 0.11 | 0.15 |
| F | 2.97 | 3.53 | 0.12 | 3.18 | 0.44 | 4.67 | 3.12 |
Note: t statistics in parentheses. * p < 0.1, ** p < 0.05, *** p < 0.01.
Table 8.
OLS regression results before and after adding firm asset.
| Before | After | |
|---|---|---|
| PMD | 0.14 | 0.18 |
| (0.53) | (0.67) | |
| PDD | 0.53 * | 0.65 ** |
| (1.95) | (2.35) | |
| PEM | 0.00 | 0.07 |
| (0.00) | (0.19) | |
| PSE | 0.74 | 0.73 |
| (1.36) | (1.33) | |
| PC9 | 0.01 | −0.02 |
| (0.02) | (−0.06) | |
| POI | −0.18 | −0.13 |
| (−0.41) | (−0.30) | |
| Firm asset | −0.47 *** | |
| (−4.67) | ||
| ALR | controlled | |
| RDE | controlled | |
| Industry | controlled | |
| Constant | 2.88 *** | 12.81 *** |
| (4.15) | (6.28) | |
| N | 1374 | 1374 |
| r2 | 0.20 | 0.21 |
| F | 25.77 | 27.99 |
Note: t statistics in parentheses. * p < 0.1, ** p < 0.05, *** p < 0.01.
Table 9.
IV 2SLS regression results.
| First Stage | Second Stage | |
|---|---|---|
| IFRD | 0.27 *** | |
| (0.03) | ||
| PDD | 2.44 ** | |
| (2.30) | ||
| PMD | −0.11 | 0.23 |
| (−0.03) | (0.88) | |
| PEM | 0.27 *** | −0.52 |
| (0.04) | (−1.16) | |
| PSE | 0.43 *** | 0.15 |
| (0.05) | (0.20) | |
| PC9 | −0.01 | 0.05 |
| (0.05) | (0.11) | |
| POI | 0.07 | −0.30 |
| (0.05) | (−0.68) | |
| ALR | 0.21 | −5.33 *** |
| (0.07) | (−4.84) | |
| Industry | controlled | |
| Constant | 0.09 | 2.78 *** |
| (0.10) | (4.11) | |
| N | 1374 | 1374 |
| r2 | 0.15 | 0.17 |
| F | 24.80 | |
Note: t statistics in parentheses. * p < 0.1, ** p < 0.05, *** p < 0.01.
© 2019 by the authors. Licensee MDPI, Basel, Switzerland. This article is an open access article distributed under the terms and conditions of the Creative Commons Attribution (CC BY) license (http://creativecommons.org/licenses/by/4.0/).
Share and Cite
MDPI and ACS Style
Wang, C.; Yang, J.; Cheng, Z.; Ni, C. Postgraduate Education of Board Members and R&D Investment—Evidence from China. Sustainability 2019, 11, 6524. https://0-doi-org.brum.beds.ac.uk/10.3390/su11226524
AMA Style
Wang C, Yang J, Cheng Z, Ni C. Postgraduate Education of Board Members and R&D Investment—Evidence from China. Sustainability. 2019; 11(22):6524. https://0-doi-org.brum.beds.ac.uk/10.3390/su11226524
Chicago/Turabian StyleWang, Chuanyi, Jiale Yang, Zhe Cheng, and Chaoqun Ni. 2019. "Postgraduate Education of Board Members and R&D Investment—Evidence from China" Sustainability 11, no. 22: 6524. https://0-doi-org.brum.beds.ac.uk/10.3390/su11226524
Note that from the first issue of 2016, this journal uses article numbers instead of page numbers. See further details here.