Coupling and Coordination Development of Australian Energy, Economy, and Ecological Environment Systems from 2007 to 2016


1
College of Science, The Australian National University, Canberra 2600, Australia
2
Academy of Financial Research, Wenzhou University, Wenzhou 325035, China
3
School of Economics and Management, Zhejiang University of Science and Technology, Hangzhou 310023, China
4
Department of Business Administration, National Central University, Taoyuan City 32001, Taiwan
5
Department of Information Management, National Taichung University of Science and Technology, Taichung 404, Taiwan
*
Authors to whom correspondence should be addressed.
Sustainability 2019, 11(23), 6568; https://0-doi-org.brum.beds.ac.uk/10.3390/su11236568
Submission received: 6 November 2019
/
Revised: 15 November 2019
/
Accepted: 18 November 2019
/
Published: 21 November 2019
(This article belongs to the Section Environmental Sustainability and Applications)
Abstract
:Energy, economy and ecological environment complement each other. The coupling and coordination development of them would provide basis for the rational use of energy, economic development, and the protection and restoration of the ecological environment. In this study, the coupling and coordination development of the Australian energy, economy, and ecological environment from 2007 to 2016 were quantitatively investigated by constructing a coupling coordination model based on coupling theory. Results showed that: (1) Australia’s comprehensive evaluation index of energy, economy, and ecological environment exhibited an increasing trend. The rising trend of the energy index was obvious, the economy was relatively stable, and the comprehensive evaluation index of the ecological environment strongly fluctuated. (2) The development of energy and the economy, and that of energy and the ecological environment were gradually coordinated, and many unbalanced development patterns were found between the economy and the ecological environment. (3) Four types of coordination were observed in the three subsystems, among them, the barely coordinated categories repeated most often and the coordination degree of the three subsystems tended to grow from the global perspective. Energy, economy, and ecological environment interacted, limited, and promoted one another to form a complex system, through proper coordination, these three subsystems can jointly promote the sustainable development of society in Australia.
1. Introduction
Energy is an indispensable basic element in social and economic systems. With the acceleration of global industrialization, the contradiction between increasing energy demand and energy scarcity has become increasingly prominent in economic development [1]. The overloading of energy systems will inevitably bring tremendous pressure to the construction of the ecological environment [2]. Energy supply, economic development, and ecological environment construction complement one another and promote the sustainable development of society through proper coordination to create a coordinated effect. Therefore, the coupling and coordination development of energy, the economy, and the ecological environment should be investigated to provide basis for the rational use of energy, economic development, and the protection and restoration of the ecological environment.
The academic community’s research on energy, the economy, and the environment has experienced the process of “single system–binary system–ternary system.” Kraft and Kraft [3] first investigated the relationship between economic growth and energy consumption. Grossman and Krueger [4] observed that economic growth and environment quality exhibit an inverted U-shaped curve, which Panayotou [5] called the Environmental Kuznets Curve (EKC) relationship. These studies mainly focused on the binary systems of energy–economy, economy–environment, and environment–energy. With the increasing awareness on energy, the economy, and the ecological environment, people have realized that these binary systems are insufficient to comprehensively and systematically investigate the coordinated development of energy, the economy, and the environment. Therefore, many energy research and environmental protection institutes have cooperated with economists to construct a research framework of the three subsystems and conduct comprehensive research on their coordinated development. In 1995, Hawdon and Pearson [6] investigated the complex relationship between energy, the environment, and economic welfare by using input–output simulations. Oliveira and Antunes presented a multi objective model [7] and a multisectoral energy–economy–environment model [8] and used them to evaluate the effects of economic structure and energy system changes on the environment. Since then, the study of the relationship between the three subsystems has become a new research focus and hot spot. Although these studies embedded the three systems into the same framework, the research on energy, the economy, and the ecological environment is generally lacking because of insufficient comprehensive indicators and data. The analysis of the coupling and coordination development of energy, economic, and ecological environment systems should be strengthened to obtain a deep understanding.
As the sixth largest country in the world, Australia is one of the most important mining and agricultural exporting countries. Its sparse population, rich resources, and short development history provide favourable conditions for development [9]. However, Australia has encountered serious challenges in energy exploration, economic development, and ecological environment protection. Examples include the promotion of industrialization, animal husbandry development, and mineral resource mining. Australia has also experienced serious ecological crisis and excruciating historical lessons, such as grassland degradation, river drought, sharp species decline, water pollution, and land salinization [10,11,12].The fragility of the natural ecology and the dominance of the energy economy objectively require Australia to focus on the sustainable development of energy, the economy, and ecological environment construction. Nowadays, Australia is in urgent need of those articles that explore the relationship between energy, economy and the ecological environment as a reference and theoretical guidance, but due to the difficulty and complexity of this topic, few articles have been written. Most of them are about greenhouse gas emissions, biomass energy, food and economic growth [13]. In order to create a coordinated effect among energy supply, economic development, and ecological environment construction, and promote the sustainable development of society in Australia, as well as provide guidance for Australia government, the present study quantitatively evaluates the coupling and coordination development of Australia’s energy, economy, and ecological environment from 2007 to 2016 through the coupling and coordination model to provide a theoretical basis for the unification and coordinated development of the three subsystems. The research objectives after calculation and discussion are the product of the comprehensive evaluation indexes of energy, the economy, and the ecological environment in Australia, as well as their trends in the period of study time, and the contrastive relations between each of the two subsystems. Finally, the coordination degree of Australia’s energy, economy, and ecological environment and their coordinated types are also obtained, with these objectives, so that the Australian Government can be more effective in coordinating the relationship between energy, economy and environment, making them interacted, limited, and promoted to form a sustainable development system in Australia.
2. Index Selection and Model Construction
2.1. Index Selection and Dimensionless Method
A scientific and reasonable evaluation index system should be established on the basis of the correlation and complexity of the three subsystems of energy, economy, and the ecological environment. A comprehensive evaluation index system is constructed by combining the geographical location of Australia and the characteristics of economic resources (Table 1). Six key indicators are selected from each subsystem of energy, economy, and the ecological environment from 2007 to 2016. Among them, the selected indicators of energy mainly reflect the production, consumption, import and export of energy, with data from the Australian Bureau of Statistics, YearBook Australia 2007–2016, and Australian Government Department of the Environment and Energy. The economic indicators are mainly about the country’s economic situation and the proportion of various industries in GDP. These data are from the Australian Bureau of Statistics, YearBook Australia 2007–2016 and the Word Bank. The indicators of ecology mainly reflect the utilization rate of various resources, the frequency of extreme climate and the degree of air pollution. The data are from the Australia Government of Meteorology, Australian Government Department of the Environment and Energy. These selected indicators are the most representative and best reflect the development degree of each subsystem. If they are changed, it may lead to incomplete research on the subsystems, thus affecting the overall coupling results. For example, when discussing the economic development of Australia, per capita GDP will definitely represent the current economic situation more comprehensively than the income of the rural population. In the indicators, Xij refers to jth index in I year for each index, where i = 1, 2, …, 10; j = 1, 2, …, 6.
As the units of each index are different, and the positive and negative indicators are favourable to large and small indexes, respectively, a dimensionless method should be constructed by using Formulas (1) and (2) [14].
Xij’ = (Xij − Xmin)/(Xmax − Xmin),
Xij’ = (Xmax − Xij)/(Xmax − Xmin),
Formulas (1) and (2) are for different characters in the indicators, (1) is used for positive data and (2) for negative. Where Xij’ is the index value after reducing the dimension of the original data, Xij is the actual value of the original index, and Xmax, Xmin are the maximum and minimum values of the jth index in 2007–2016 for each subsystem, respectively.
2.2. Weight
The coefficient of variation is used to obtain the index weight for avoiding the influence of subjective preference on the evaluation results [15]. In the evaluation index system, the greater the difference in index value, the better its reflection of the gap of the evaluated unit will be. The formula is expressed as follows:
where Wj is the weight of the jth index, as shown in Table 1.
,
, Vj are the standard deviation, average value, and variable coefficient for the jth indicator, respectively.
2.3. Comprehensive Evaluation Index
The comprehensive evaluation index can be used to measure the development level of each subsystem and explain the proportion and importance of the index in the entire system. It can be obtained through linear weighting as follows [16]:
where fn(x) is the comprehensive evaluation index for each subsystem, where n = 1,2,3.
2.4. Model of Coupling and Coordination
Coupling is a physical concept that refers to the phenomenon in which systems interact with one another. Coupling is widely used to investigate the relationship between energy, economic, and ecological environment subsystems because of the objective existence of a causal and mutually reinforcing relationship.
2.4.1. Contrastive Relation for Coupling and Coordination
The contrastive relation for coupling and coordination is the comparison of the comprehensive evaluation indexes of the two subsystems. The result can be used to analyse the relationship between energy and the economy, energy and the ecological environment, and the economy and the ecological environment in Australia. The formula is expressed as follows [17]:
where L is the contrast factor and f1(x), f2(x), f3(x) are the comprehensive evaluation indexes for energy, the economy, and the ecological environment, respectively.
L(energy/economy) = f1(x)/f2(x)
L(energy/ecological environment) = f1(x)/f3(x)
L(economy/ ecological environment) = f2(x)/f3(x)
2.4.2. Coupling, Coordination Degree, and Types
Many modules are used to calculate the coupling degree. In this study, the following model was based on the actual situation of Australia and the research of Yang [19] is selected as (9) and given three subsystems, n = 3, the coupling formulas are expressed as (10) where C denotes coupling.
The value of coupling can represent strong and weak relationships between subsystems. A coordination degree model is constructed on the basis of the coupling model to reflect the level of coordinated development between energy, the economy, and the ecological environment in Australia [20]. The calculation formula is expressed as follows:
where D is the coordination degree; T is the comprehensive evaluation index of the entire system; and . are undetermined coefficients.
The total coefficient of the energy, economic, and ecological environment subsystems is 1. We set n = 3 to ensure the coordinated development of the three subsystems. Thus, , and the formula of T can be expressed as
To comprehensively and intuitively reflect the degree of coupling development, we divide the coordination degree into seven levels on the basis of the value of coordination degree D [20]. The specific criteria are provided as follows (Table 3).
This method helps the three subsystems in Australia to shift a large system from disordered status to ordered status, and through a certain mechanism, it can explore the characteristics and connections among energy, economy and the ecological environment in Australia. However, this method still has some limitations. First, for the convenience of calculation, the coupling method limits the value of coordination degree between 0 and 1, which may reduce the accuracy of the calculation to a certain extent. In addition, in order to ensure the coordinated development of energy, economy and the ecological environment, it is assumed that the development degree of the three subsystems is equal to three, n = 3, which is not in line with the actual situation. Therefore, in order to fully reflect the relationship between the three subsystems, some other methods, for example, a new environmental sustainability assessment tool by using dynamic Autoregressive-Distributed Lag (ARDL) simulations [13] can be used; the relationships between energy, economy and the ecological environment in Australia can also be applied to future research.
3. Result Analysis
3.1. Trend of Comprehensive Evaluation Index
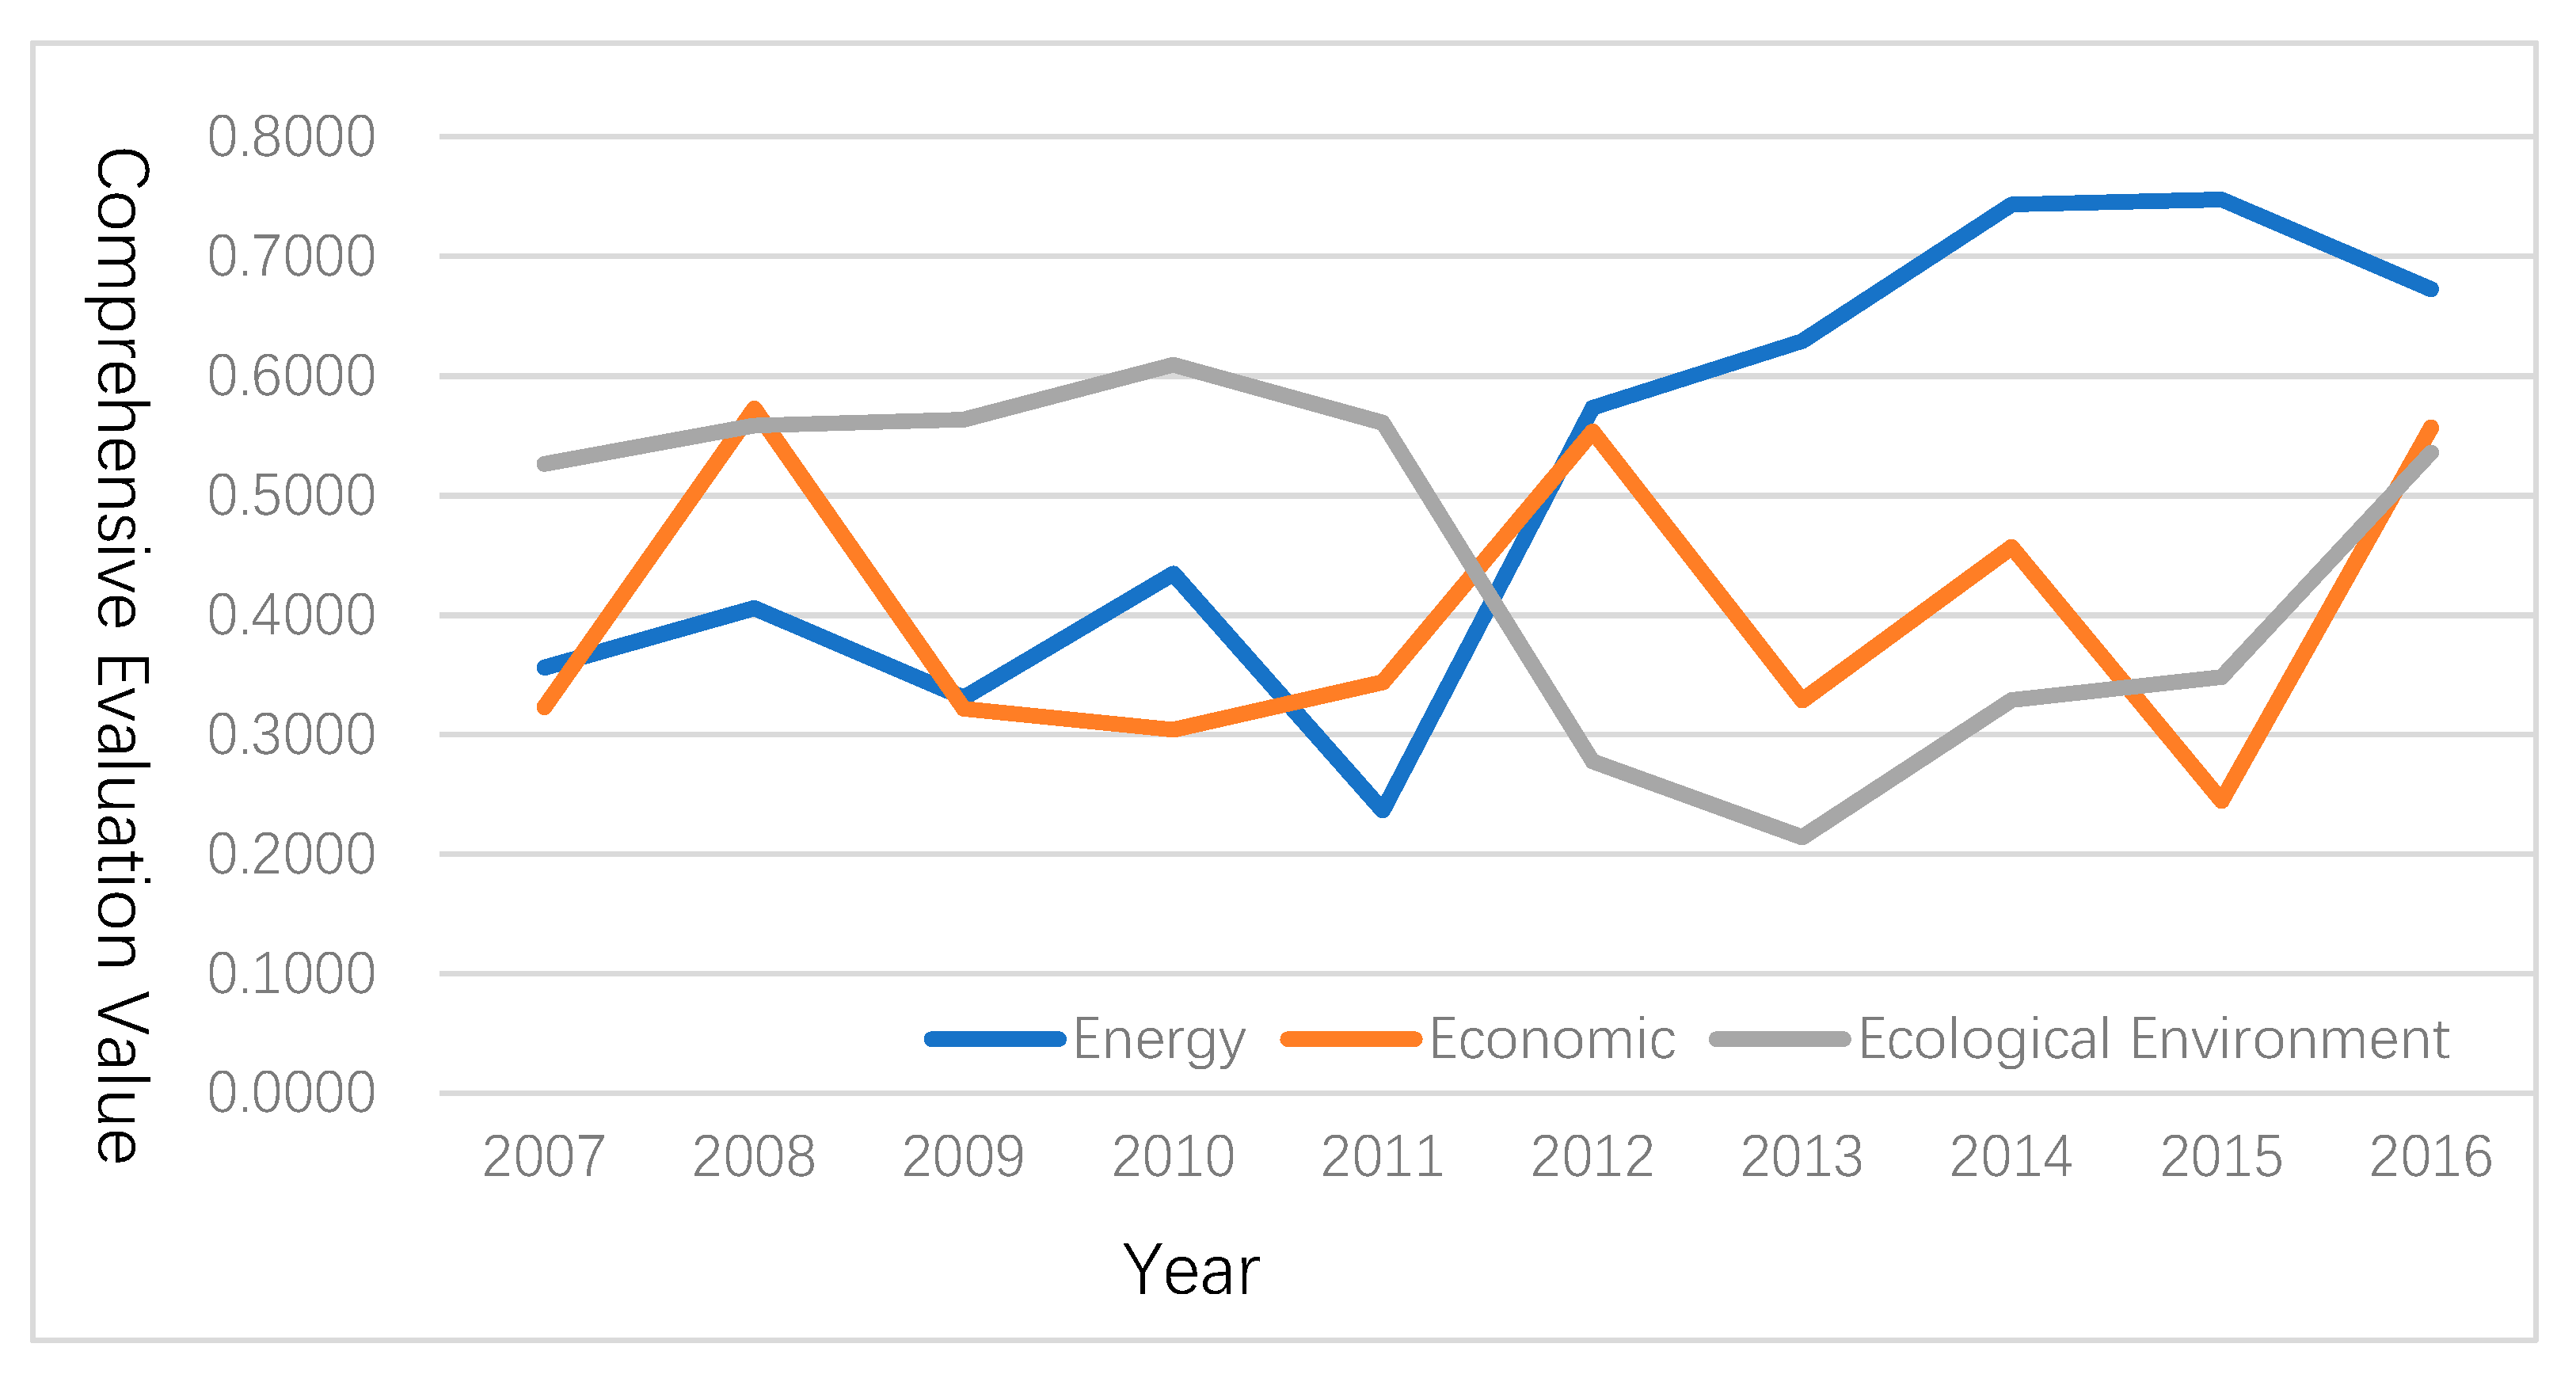
As shown in Formula (5) and the weight of each index, the comprehensive evaluation indexes of the three subsystems of energy, the economy, and the ecological environment in Australia from 2007 to 2016 are calculated, and the results are shown in Table 4. Their variation trend is shown in Figure 1.
From 2007 to 2016, the overall value of comprehensive evaluation indexes of energy (0.3563 to 0.6724), the economy (0.3232 to 0.5567), and the ecological environment (0.5265 to 0.5359) in Australia exhibited an increasing trend. The overall upward trend of energy was obvious. After 2011, the comprehensive evaluation index of energy sharply increased. The value of the comprehensive evaluation index in 2016 was approximately two times that in 2007. This difference was mainly due to the publication of the National Energy Security Assessment 2009, Energy White Paper by the Australian Government in recent years. Such relevant documents made strategic adjustments to policies to cope with the new changes in the current international and domestic energy [21]. The economic index increased and decreased in the past decade, thus showing a fluctuating trend. The output of mining, financial services, and professional services increased higher than the average rate, whereas that of manufacturing was lower than the average rate. Approximately three-quarters of the economy was related to services rather than the mining economy, thereby reflecting that Australia’s economy gradually transformed into a service-oriented economy [22,23]. For the ecological environment, although the comprehensive evaluation index in 2016 was slightly higher than that in 2007, the fluctuation during the decade was intense, especially in 2011. It then showed a turning point and reached its lowest point in 2013, which is basically consistent with the trend of the ecological environment pressure calculated by Zander et al. in 2019 [24]. In recent years, the Australian Government has integrated the protection of the ecological environment into its national strategy. Other environmental protection measures, such as the comprehensive utilization of water resources and protection of biodiversity, have also been gradually promoted and implemented in Australia [25]. The impact of global climate change and Australia’s huge carbon emission base, which is an important cause of extreme climate that leads to sea level rise, high temperatures, and drought, has seriously damaged Australia’s ecological environment [26].
3.2. Contrastive Relation for Coupling and Coordination
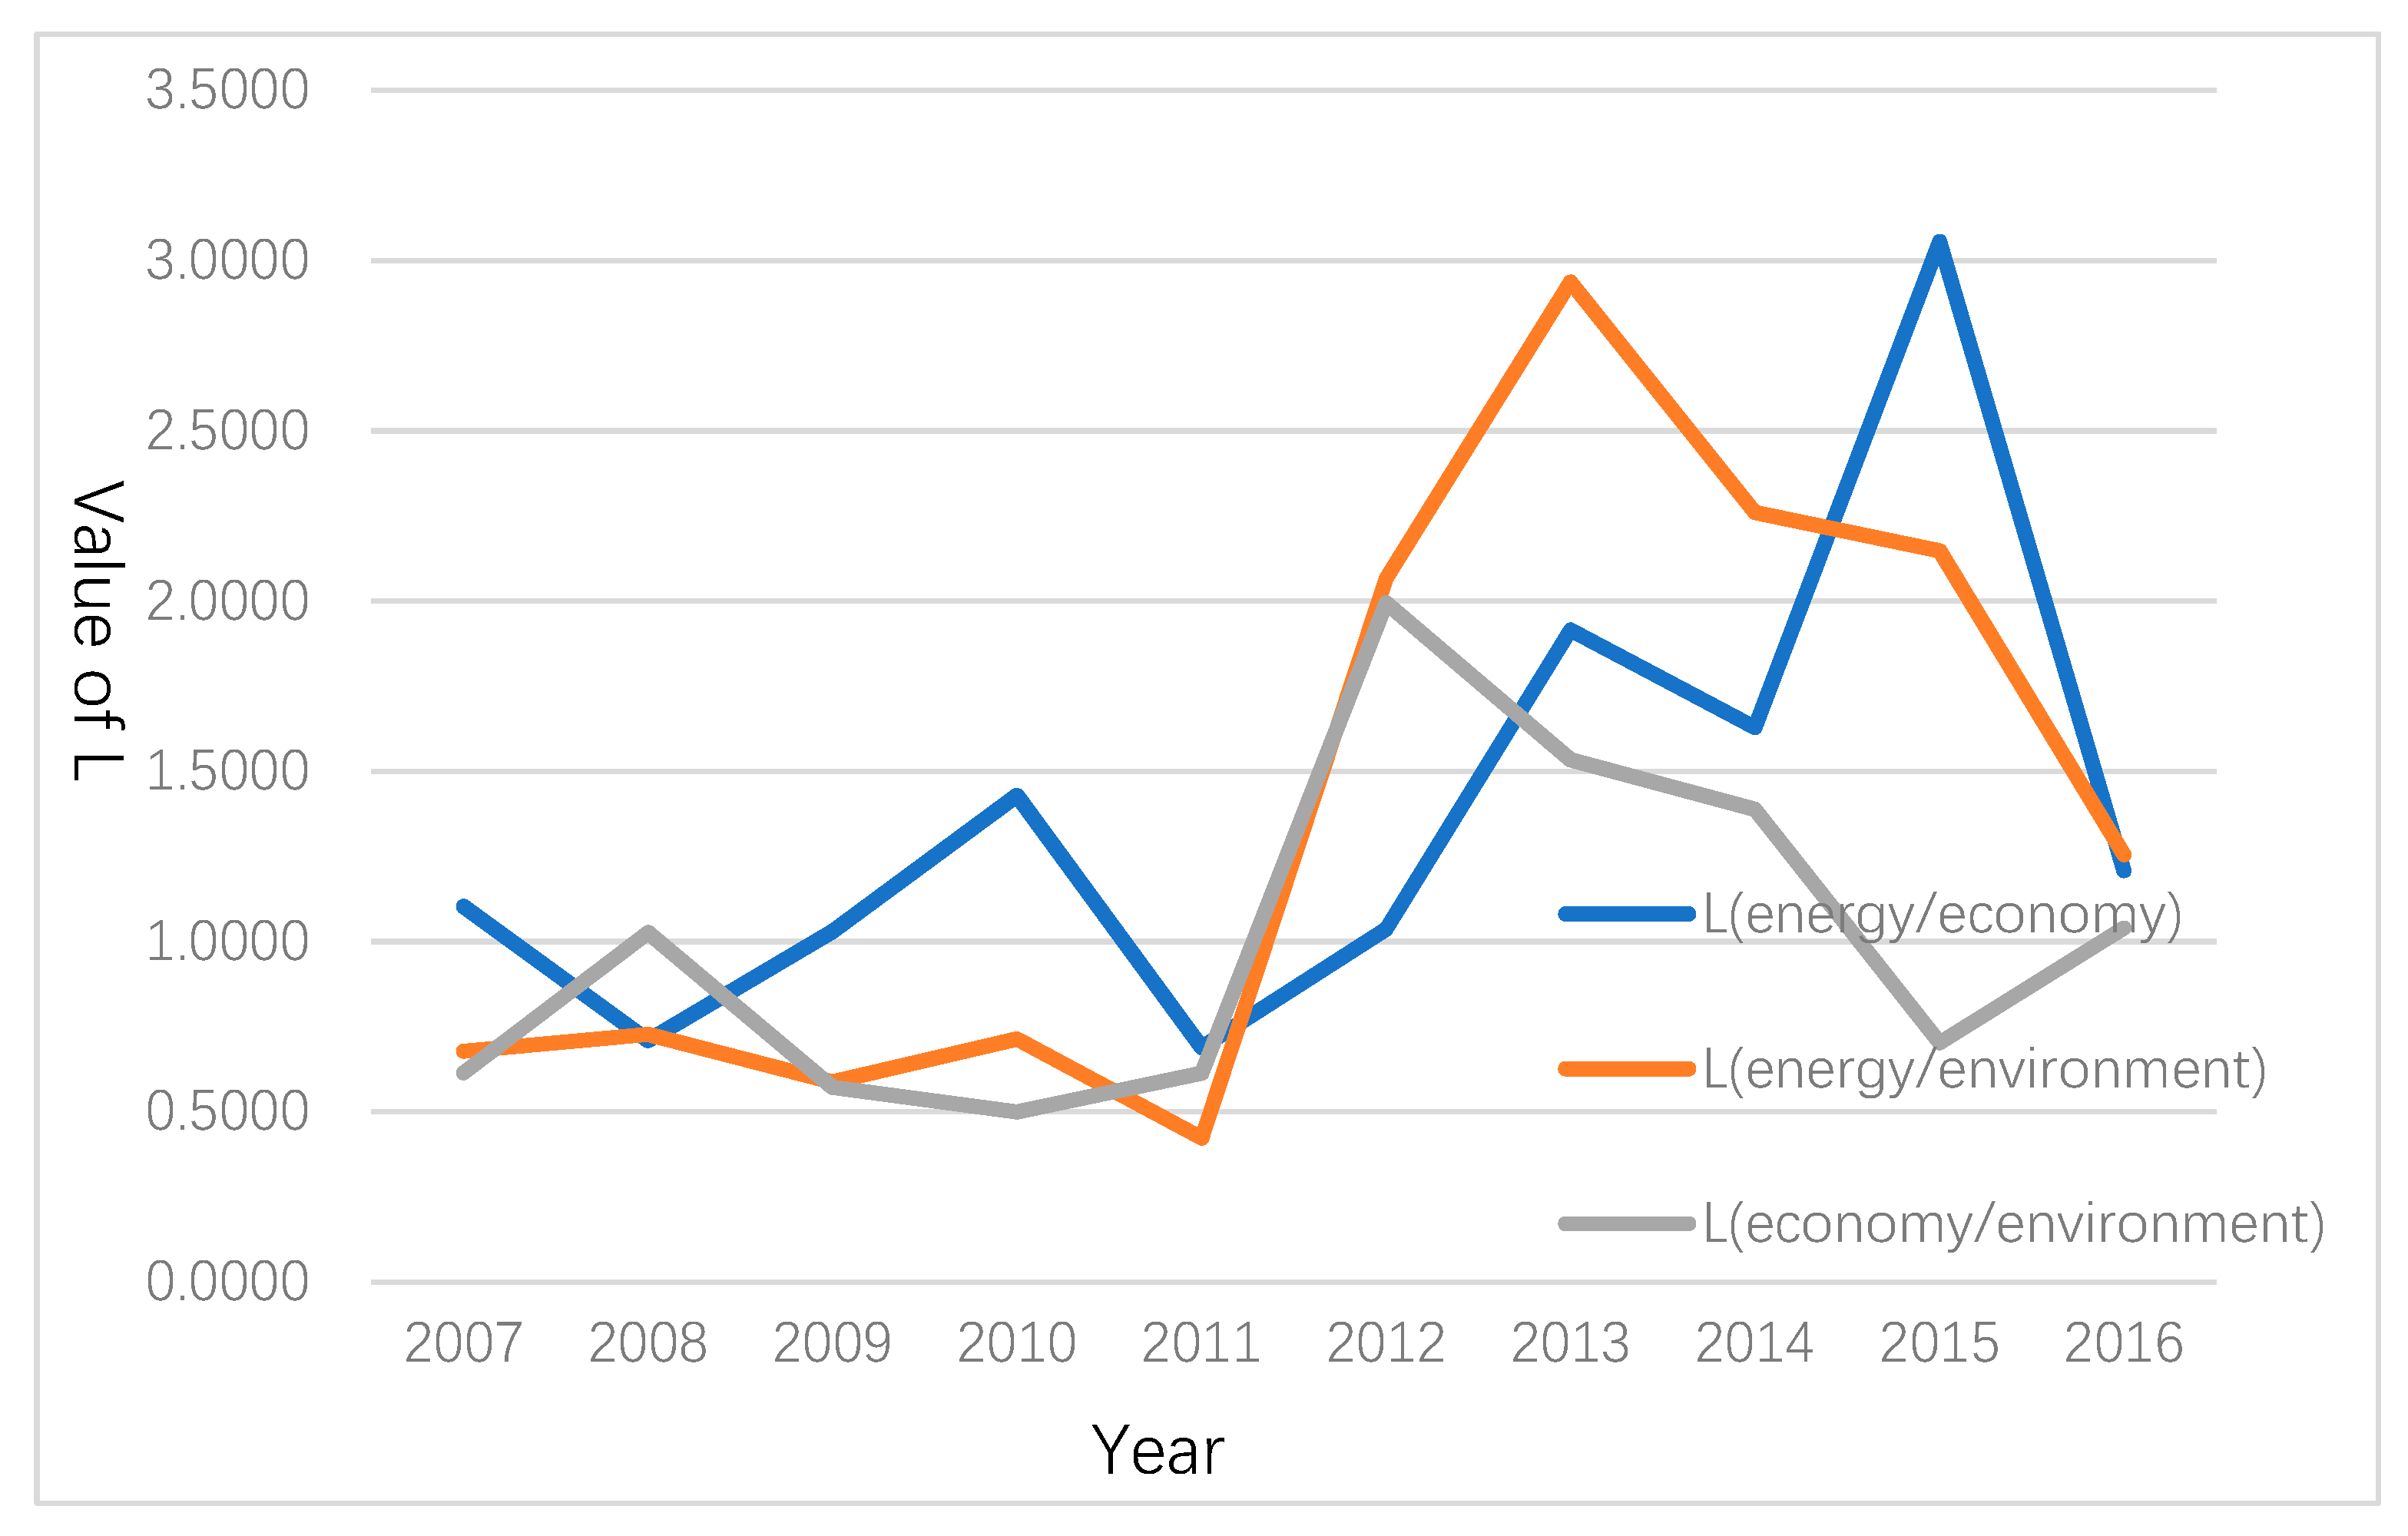
The contrast factor for each of the two subsystems can be obtained by using Formulas (6)-(8), as shown in Figure 2.
The comparison of the comprehensive evaluation indexes of energy and economy in Australia showed that the values of L were low from 2007 to 2012, fluctuated from 0.60 to 1.00 many times, and then reached the minimum value of 0.6883 in 2011; the latter value indicated serious damage. This condition was mainly because the excessive development of traditional and unreasonable energy had seriously hindered economic development. After 2012, all the values of L were higher than 1.6, especially in 2010, the expanded Renewable Energy Target (RET) promulgated by the Australian Government had promoted the production, operation and consumption of clean energy through the implementation of fiscal and tax incentives [27]. Meanwhile, the export of natural gas and other new energy sources had also increased the huge revenue of the Australian Government [28], which showed that the development of Australia’s energy and economy was relatively balanced and harmonious.
For the contrast factors of energy and the ecological environment in Australia, the values of L were low at approximately 0.6 in 2007–2011, and most of them indicated serious damage. In 2011, the L value was only 0.4218, which indicated extreme damage. This finding showed that the excessive exploitation of resources caused a sharp decline in environmental quality during this period. After 2012, the L value sharply increased. Especially in 2016, it remained higher than 2.0, which indicated a sufficient type. This finding showed that Australia’s energy had been rationally exploited and utilized for the benefit of the construction of the ecological environment [29].
The comparison of the comprehensive indexes of Australia’s economy and ecological environment in 2007–2011 showed that the L value hovered between 0.5 and 1.0 and that severe types of extreme damage, serious damage, and shortage alternately occurred. This finding showed that unreasonable economic development led to the destruction of the ecological environment during this period and that the Australian Government was continuously adjusting the relationship between them [30]. From 2012 to 2014, the contrasting relationship between energy and the ecological environment exhibited an enhanced and abundant development trend [31]. However, in 2015, the L value reduced to 0.7, which indicated serious damage. This finding showed that Australia’s re-emergence of economic development model at the expense of the environment was not conducive to sustainable development [32].
3.3. Coordination Degree
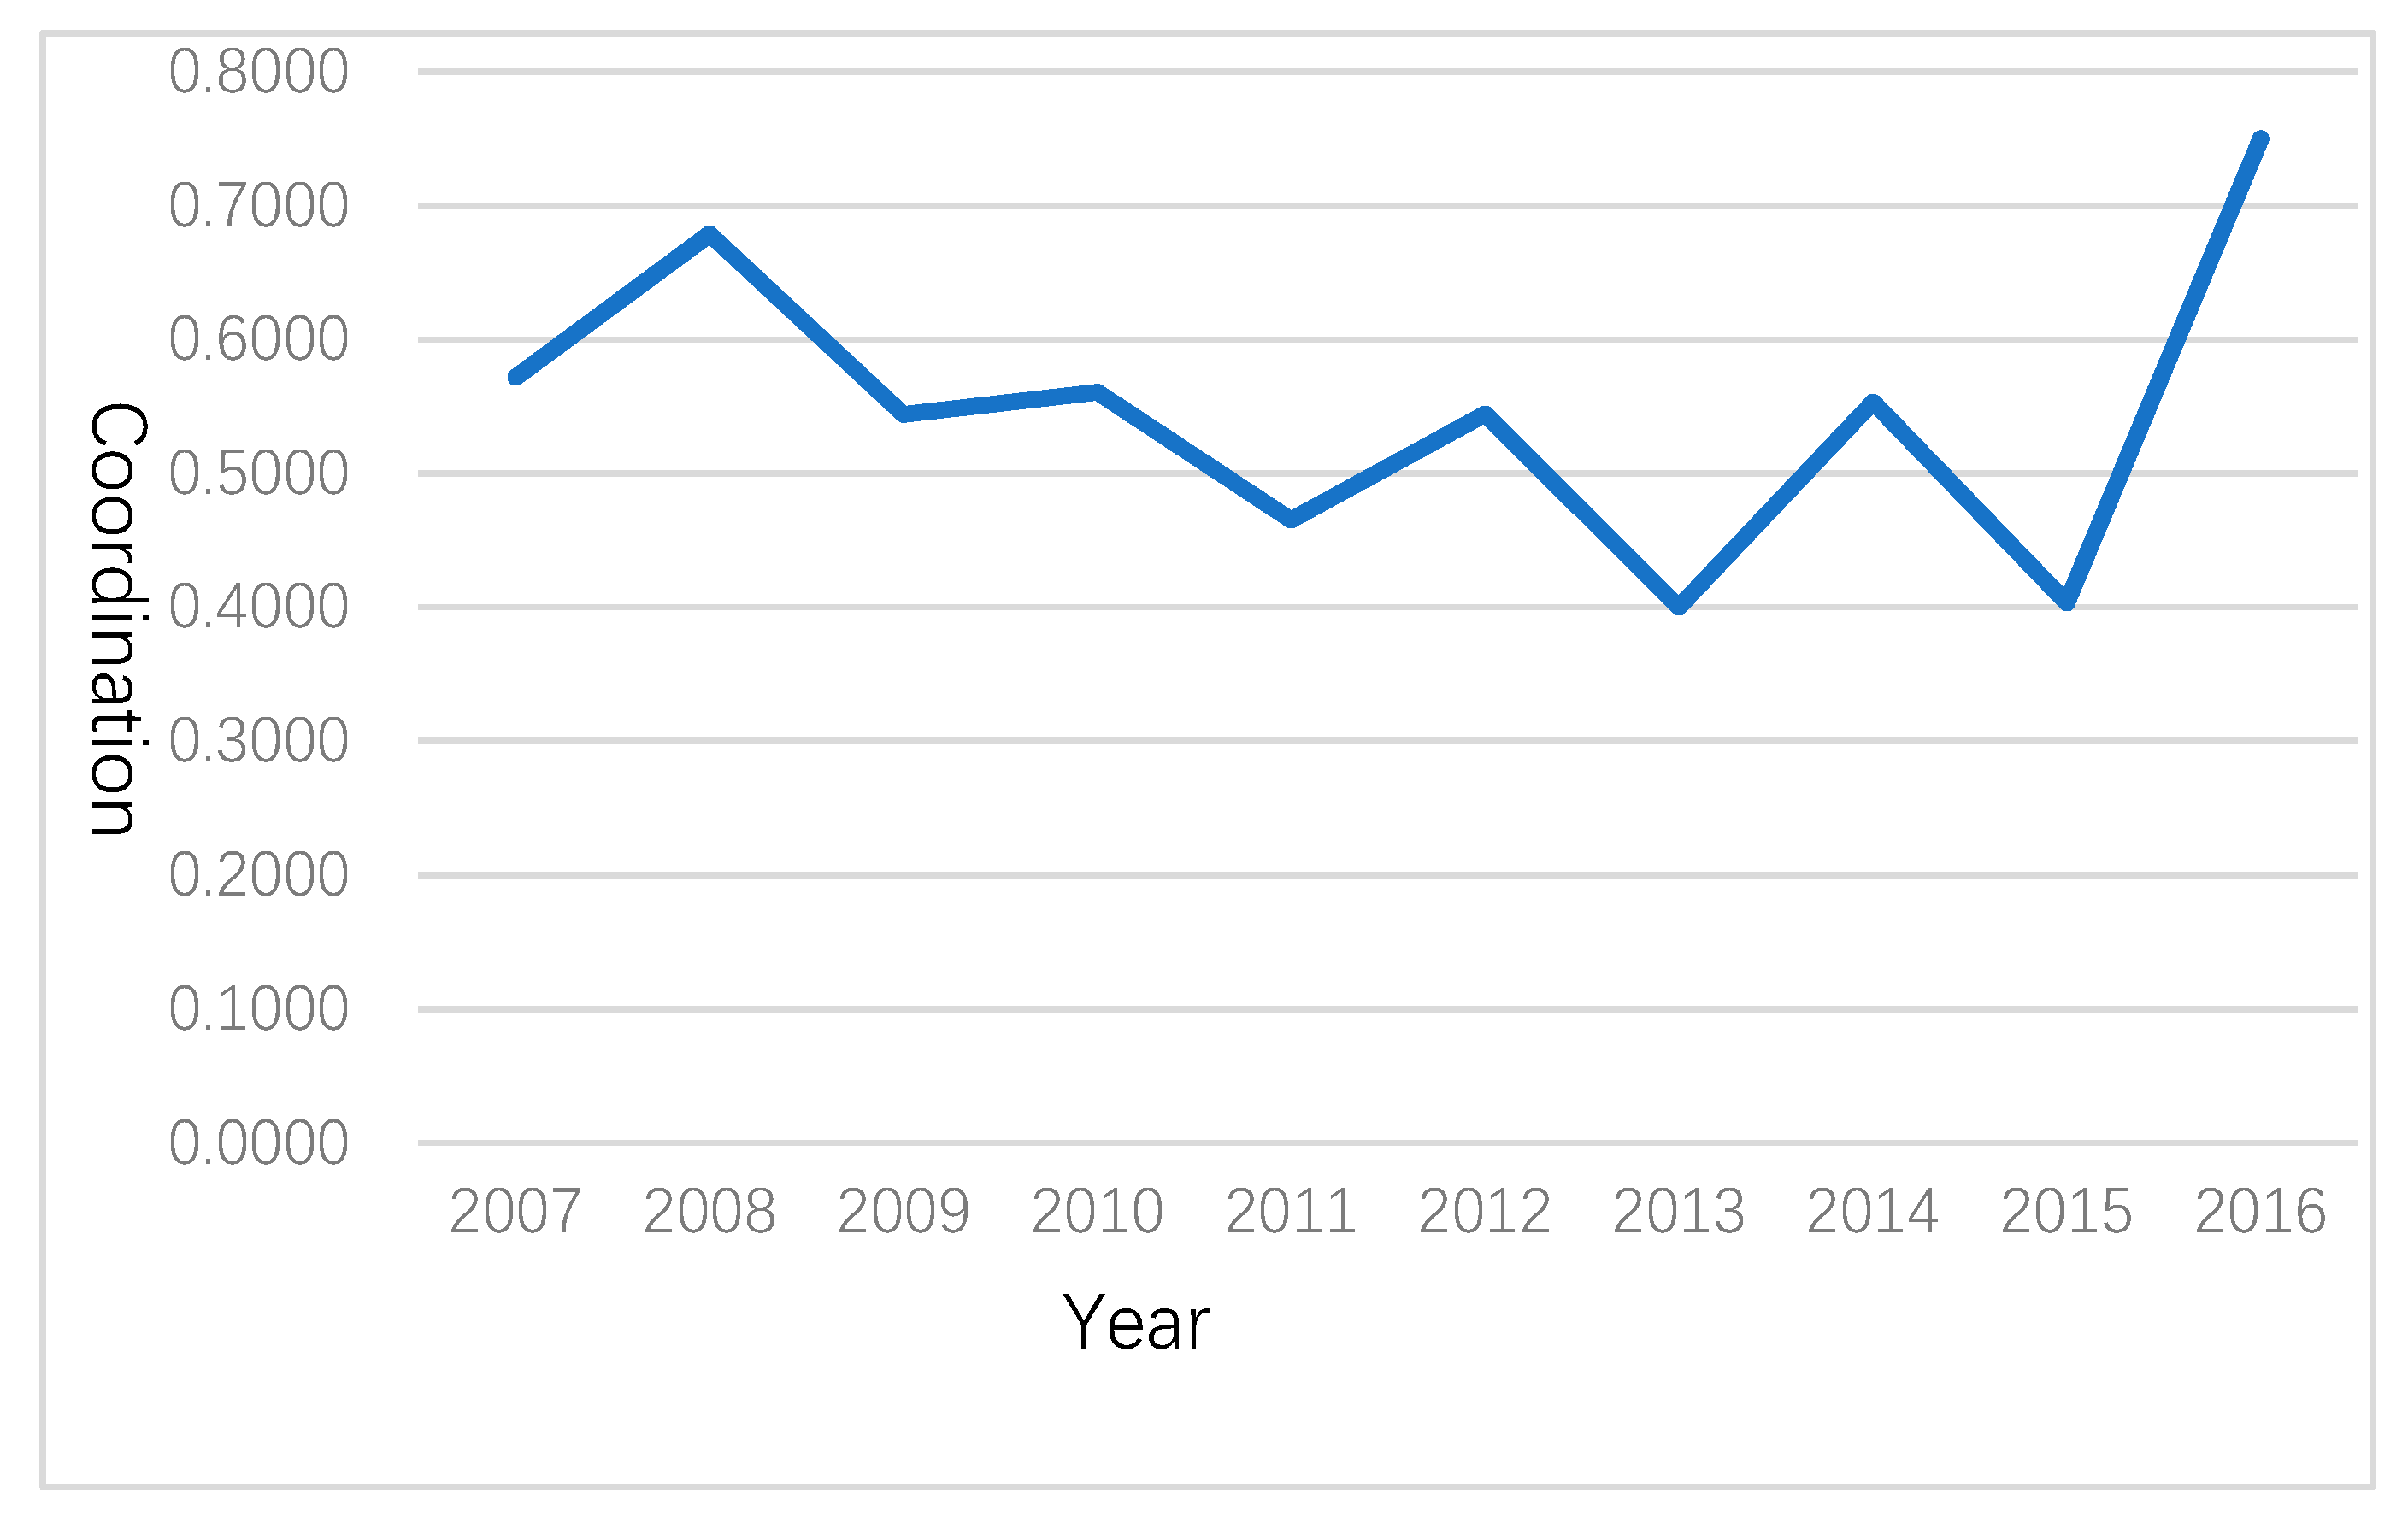
The coupling and coordination degree can be calculated by using Formulas (7), (8) and (10), as shown in Table 4. The types of coordination degree are divided on the basis of the criteria in Table 3.
In 2007–2016, the coordination degree of the three subsystems of energy, the economy, and the ecological environment in Australia came in four types, five barely coordinated categories (2007, 2009, 2010, 2012, and 2014), one moderately coordinated category (2008), three slightly maladjusted categories (2011, 2013, and 2015), and one good coordinated category (2016).
In 2011, 2013, and 2015, the coordination of energy, the economy, and the ecological environment in Australia was not ideal. On the basis of the comprehensive evaluation index, the main turning point in 2011 was caused by the energy index, comparing with the study from Azad et al., same change can be observed, which sharply declined and then increased. Net energy imports, and ore and metal exports sharply increased because of the rising of resource and energy prices. Australia’s resource and energy exports increased by 15%, accounting for 72% of Australia’s total exports in 2011 [33]. Although energy exports led to a small increase in economic income, they posed a serious threat to the ecological environment. In 2011, the index of PM2.5 and the particulate emission damage index changed and aggravated the ecological environment.
In 2013 and 2015, the low coordination state of the three subsystems was mainly determined by the uneven change of the economic and ecological comprehensive evaluation indexes. In 2013, the economic comprehensive index showed a downward trend because of global economic growth rate reduction, decline of Australia’s industrial investment, and depreciation of the Australian dollar [34,35]. Although the original energy ecological scale was not affected, the reduction of investment scale and expansion speed in mining led to a decrease in temperature and extreme precipitation frequency in extreme climate. The comprehensive evaluation index of the ecological environment decreased and was not synchronized with the changes of the two other subsystems. In 2015, the Australian economy experienced a severe test, and the country’s economy faced huge challenges. Similar to the conditions in 2013, commodity prices plummeted, mining investment sharply decreased, and fiscal policy re-tightened [36], although the index for energy slightly declined. Significant changes were observed in the comprehensive evaluation index of the ecological environment during the bottleneck period of economic development. The quality of the ecological environment showed a trend of continuous improvement, and bare coordination occurred among the three subsystems.
As revealed by the measurement of coordination, the best performance was observed in 2016. This result was due to the healthy and positive development of energy, the economy, and the ecological environment. The growth rate of the Australian economy in 2016–2017 as 2.0%. In particular, the rapid development of agriculture largely contributed to Australia’s economic growth [37,38]. In the energy industry, local mining was the beneficiary of rising commodity prices [39]. Given the requirements of environmental protection and sustainable economic development, the utilization of renewable energy emerged as a new energy development strategy in Australia. For example, it plans that, in 2040, aging coal and natural gas power plants will gradually fade out of Australia and will be replaced by lower-cost wind and solar power generation plant which will account for about 59 percent of energy production [40,41]. Moreover, the ecological environment showed a high coupling relationship with the two other subsystems under the strategic adjustment of the economy and energy. The forest cover in Australia increased, and the mean temperature decreased. Rainfall PM2.5 and particulate emission damage equated to a fundamental improvement in the quality of Australia’s ecological environment [42,43].
As shown in Figure 3, although the coordination degree of energy, the economy, and the ecological environment in Australia from 2007 to 2016 was uneven, the trend moved upward. Such a trend indicated people’s focus on the coordinated development of energy, the economy, and the ecological environment with time. It also revealed a high coupling and coordination degree for the three subsystems. Energy, the economy, and the ecological environment have a sensitive coupling relationship, and are closely related and indispensable.
4. Conclusions
Energy, the economy, and the ecological environment interact, restrict, and promote one another as components of a complex system. The coefficient of variation is used to determine the weight of each evaluation index. After calculating the comprehensive evaluation index, the coordinated development level of the three subsystems is systematically evaluated by constructing a coupling coordination model in Australia from 2007 to 2016. The conclusions based on the empirical analysis results are summarized as follows:
1. During 2007–2016, the comprehensive evaluation indexes of energy, the economy, and the ecological environment in Australia showed an upward trend. The overall upward trend of energy was obvious because the Australian Government reassessed its energy structure and adjusted its policy strategy. Australia’s comprehensive evaluation index for its economy increased and decreased in the past decade, showing a fluctuating trend. During this period, Australia gradually transformed into a service-oriented economy. For the ecological environment, the comprehensive evaluation index of the ecological environment aggressively fluctuated. Although the Australian Government enhanced the protection of the ecological environment, global climate change and Australia’s huge carbon emission base posed a threat to the Australian ecological environment.
2. The comparison of the contrastive relations of energy, the economy, and the ecological environment showed that energy and the economy and energy and the ecological environment experienced the same changing trend, which indicated serious damage before 2011. Australia’s energy was reasonably exploited and utilized for the benefit of the construction of the ecological environment. Especially in 2016, the energy and economy developed well, indicating that they are of sufficient types. In 2007–2016, many uneven development patterns were observed between the economy and the ecological environment. These patterns were not conducive to their healthy development, and the Australian government continuously adjusted the relationship between them.
3. In 2007–2016, the coordination degree of Australia’s energy, economy, and ecological environment exhibited four types, five barely coordinated categories, one moderately coordinated category, three slightly maladjusted categories, and one good coordinated category. The slightly maladjusted categories in 2011 were due to excessive energy exploitation, leading to the fragility of the ecological environment. For the two other categories, the quality of the ecological environment showed a continuous improvement trend during the economic downturn in 2013 and 2015. In 2016, Australia’s energy, economy, and ecological environment showed good coordinated development. This condition was due to the quality of Australia’s ecological environment fundamentally improving under the new strategic adjustment of the economy and energy. Although the coupling degree of Australia’s energy, economy, and ecological environment from 2007 to 2016 was uneven, the level of coupling and coordination development of the three subsystems exhibited an increasing trend.
Author Contributions
Conceptualization, X.Y.; methodology, X.Y.; software, X.Y.; validation, X.Y., M.C. and M.-Y.C.; formal analysis, X.Y.; investigation, X.Y.; resources, X.Y.; data curation, X.Y.; writing—original draft preparation, X.Y.; writing—review and editing, X.Y., M.C. and M.-Y.C.; visualization, X.Y.; supervision, M.C. and M.-Y.C.
Funding
This research received no external funding.
Conflicts of Interest
The authors declare no conflict of interest.
References
- Kim, M.S.; Chung, J.Y. Sustainable growth and token economy design: The case of steemit. Sustainability 2018, 11, 167. [Google Scholar] [CrossRef]
- Benatar, S.; Poland, B. Lessons for health from insights into environmental crises. Int. J. Health Serv. 2016, 46, 825–842. [Google Scholar] [CrossRef] [PubMed]
- Shahiduzzaman, M.; Alam, K. A reassessment of energy and GDP relationship: The case of Australia. Environ. Dev. Sustain. 2014, 16, 323–344. [Google Scholar] [CrossRef]
- Jing, Z. Literature Review on EKC and the Effects of FDI on the Environment. In Foreign Direct Investment, Governance, and the Environment in China; The Nottingham China Policy Institute Series; Palgrave Macmillan: London, UK, 2013. [Google Scholar]
- Zhang, X.; Davidson, E.A.; Mauzerall, D.L.; Searchinger, T.D.; Dumas, P.; Shen, Y. Managing nitrogen for sustainable development. Nature 2015, 528, 51–59. [Google Scholar] [CrossRef]
- Minihan, E.S.; Wu, Z. Economic structure and strategies for greenhouse gas mitigation. Energy Econ. 2012, 34, 350–357. [Google Scholar] [CrossRef]
- Oliveira, C.; Coelho, D.; Antunes, C.H. Coupling input-output analysis with multiobjective linear programming models for the study of economy-energy-environment-social (e3s) trade-offs: A review. Ann. Oper. Res. 2016, 247, 471–502. [Google Scholar] [CrossRef]
- Oliveira, C.; Antunes, C.H. A multi-objective multi-sectoral economy-energy-environment model: Application to Portugal. Energy 2011, 36, 2856–2866. [Google Scholar] [CrossRef]
- Zhou, Q.; Llewellyn, G.; Stancliffe, R.; Fortune, N. Working-age people with disability and labour force participation: Geographic variations in Australia. Aust. J. Soc. Issues 2019, 54, 323–340. [Google Scholar] [CrossRef]
- Stougie, L.; Giustozzi, N.; van der Kooi, H.; Stoppato, A. Environmental, economic and exergetic sustainability assessment of power generation from fossil and renewable energy sources. Int. J. Energy Res. 2018, 42, 2916–2926. [Google Scholar] [CrossRef]
- Long-de, H.E. Practical measures of australian ecological environmental protection and reference of their experience. J. Chang. Univ. Sci. Technol. 2014, 29, 48–52. [Google Scholar]
- Lydon, A.; Barry, M.; Paul, M.; Oliver, J. A new method for the fast analysis of trihalomethanes in tap and recycled waters using headspace gas chromatography with micro-electron capture detection. Int. J. Environ. Res. Public Health 2017, 14, 527. [Google Scholar]
- Sarkodie, S.A.; Strezov, V.; Weldekidan, H.; Asamoah, E.F.; Owusu, P.A.; Doyi, I.N.Y. Environmental sustainability assessment using dynamic autoregressive-distributed lag simulations—Nexus between greenhouse gas emissions, biomass energy, food and economic growth. Sci. Total Environ. 2019, 668, 318–332. [Google Scholar] [CrossRef]
- Geng, Z.; Yang, K.; Han, Y.; Gu, X. Fault detection of large-scale process control system with higher-order statistical and interpretative structural model. Chin. J. Chem. Eng. 2015, 23, 146–153. [Google Scholar] [CrossRef]
- Guo, Q.; Zhou, Z.; Huang, G.; Dou, Z. Variations of Groundwater Quality in the Multi-Layered Aquifer System near the Luanhe River, China. Sustainability 2019, 11, 994. [Google Scholar] [CrossRef]
- Pirnia, P.; Duhaime, F.; Ethier, Y.; Jean-Sébastien, D. Drag force calculations in polydisperse dem simulations with the coarse-grid method: Influence of the weighting method and improved predictions through artificial neural networks. Transp. Porous Media 2019, 129, 837–853. [Google Scholar] [CrossRef]
- Du, Y.; Yang, W.; Qi, W.; Hu, G.; Yin, Y.; Xie, P. Analysis of the coupling characteristics of multi-channel electromyography. In Proceedings of the 2017 Chinese Automation Congress (CAC), Jinan, China, 20–22 October 2017. [Google Scholar]
- Ka, Z.; Ben-Liang, Q.U.; Mei, G. Analyzing coupled regional economic development and land-water resource—A case study of liaoning province. Resour. Dev. Mark. 2015, 31, 316–320. [Google Scholar]
- Shi, H.; Al-Rubaiai, M.; Holbrook, C.M.; Miao, J.; Pinto, T.; Wang, C.; Tan, X. Screen printed soft capacitive sensors for spatial mapping of both positive and negative pressures. Adv. Funct. Mater. 2019, 29, 1809116. [Google Scholar] [CrossRef]
- Li, Y.; Wang, J.; Liu, Y.; Long, H. Problem regions and regional problems of socioeconomic development in China: A perspective from the coordinated development of industrialization, informatization, urbanization and agricultural modernization. J. Geogr. Sci. 2014, 24, 1115–1130. [Google Scholar] [CrossRef]
- Han, R.; Tong, L.; Zhu, S.; Lu, Z. The Coordinated Development of Economy and Environment Based on ARMA Model in Shenyang Economic Zone. Sci. Geogr. Sin. 2014, 34, 32–39. [Google Scholar]
- Gardner, A.; Bartlett, R.; Gray, J.; Nelson, R. Water Resources Law; LexisNexis Butterworths: Chatswood, Australia, 2017. [Google Scholar]
- Coenen, L.; Campbell, S.; Wiseman, J. Regional Innovation Systems and Transformative Dynamics: Transitions in Coal Regions in Australia and Germany. In New Avenues for Regional Innovation Systems—Theoretical Advances, Empirical Cases and Policy Lessons; Isaksen, A., Martin, R., Trippl, M., Eds.; Springer: Cham, Switzerland, 2018. [Google Scholar]
- Zander, K.K.; Moss, S.; Garnett, S.T. Climate Change—Related Heat Stress and Subjective Well-Being in Australia. Weather Clim. Soc. 2019, 11, 505–520. [Google Scholar] [CrossRef]
- Azadi, M.; Edraki, M.; Farhang, F.; Ahn, J. Opportunities for mineral carbonation in Australia’s mining industry. Sustainability 2019, 11, 1250. [Google Scholar] [CrossRef]
- Wang, B.; Liu, D.L.; Evans, J.P.; Ji, F.; Beyer, K. Modelling and evaluating the impacts of climate change on three major crops in south-eastern Australia using regional climate model simulations. Theor. Appl. Climatol. 2019, 138, 509–526. [Google Scholar] [CrossRef]
- Bo, B.C.; Lee, D.; Psaros, J. An analysis of Australian company carbon emission disclosures. Pac. Account. Rev. 2013, 25, 58–79. [Google Scholar]
- Poruschi, L.; Ambrey, C.L. Energy justice, the built environment, and solar photovoltaic (PV) energy transitions in urban Australia: A dynamic panel data analysis. Energy Res. Soc. Sci. 2019, 48, 22–32. [Google Scholar] [CrossRef]
- Chapman, A.J.; Tezuka, T.; McLellan, B. Renewable energy policy efficacy and sustainability: The role of equity in improving energy policy outcomes. In Sustainability through Innovation in Product Life Cycle Design; Matsumoto, M., Masui, K., Fukushige, S., Kondoh, S., Eds.; Springer: Singapore, 2017; pp. 747–763. [Google Scholar]
- Khalaj, A.H.; Scherer, T.; Halgamuge, S.K. Energy, Environmental and Economical Saving Potential of Data Centers with Various Economizers across Australia. Appl. Energy 2016, 183, 1528–1549. [Google Scholar] [CrossRef]
- Bernhardt, E.S.; Rosi, E.J.; Gessner, M.O. Synthetic chemicals as agents of global change. Front. Ecol. Environ. 2017, 15, 84–90. [Google Scholar] [CrossRef]
- Ayangbenro, A.S.; Babalola, O.O. A new strategy for heavy metal polluted environments: A review of microbial biosorbents. Int. J. Environ. Res. Public Health 2017, 14, 94. [Google Scholar] [CrossRef]
- Azad, A.K.; Rasul, M.G.; Khan, M.M.K.; Sharma, S.C.; Bhuiya, M.M.K. Study on Australian energy policy, socio-economic, and environment issues. J. Renew. Sustain. Energy 2015, 7, 063131. [Google Scholar] [CrossRef]
- Maslyuk, S.; Dharmaratna, D. Impact of Shocks on Australian Coal Mining. In Global Energy Policy and Security; Springer: London, UK, 2013. [Google Scholar]
- Dungey, M.; Matei, M.; Luciani, M.; Veredas, D. Surfing through the GFC: Systemic risk in Australia. Econ. Rec. 2017, 93, 1–19. [Google Scholar] [CrossRef]
- McNeill, J.; Meng, S.; Siriwardana, M. The environmental and economic impact of the carbon tax in Australia. Environ. Resour. Econ. 2013, 54, 313–332. [Google Scholar]
- Manalo, J.; Perera, D.; Rees, D.M. Exchange Rate Movements and the Australian Economy. Econ. Model. 2015, 47, 53–62. [Google Scholar] [CrossRef]
- Bennett, J.M.; McBratney, A.; Field, D.; Kidd, D.; Stockmann, U.; Liddicoat, C.; Grover, S. Soil Security for Australia. Sustainability 2019, 11, 3416. [Google Scholar] [CrossRef]
- Robinson, T.; Nguyen, V.H.; Wang, J. The Australian economy in 2016–2017: Looking beyond the apartment construction boom. Aust. Econ. Rev. 2017, 50, 5–20. [Google Scholar] [CrossRef]
- Leal, P.H.; Marques, A.C.; Fuinhas, J.A. How economic growth in Australia reacts to CO2 emissions, fossil fuels and renewable energy consumption. Int. J. Sect. Manag. 2018, 12, 696–713. [Google Scholar] [CrossRef]
- Dahal, S.; Nadarajah, M. Renewable energy development in Australia: Regulatory to technical challenges. In Proceedings of the 2015 IEEE PES Asia-Pacific Power Engineering Conference (APPEEC), Brisbane, Australia, 15–18 November 2015. [Google Scholar]
- Cheng, Y.; Shao, T.; Lai, H.; Shen, M.; Li, Y. Total-Factor Eco-Efficiency and Its Influencing Factors in the Yangtze River Delta Urban Agglomeration, China. Int. J. Environ. Res. Public Health 2019, 16, 3814. [Google Scholar] [CrossRef]
- Long, Y.; Wang, J.; Wu, K.; Zhang, J. Population exposure to ambient PM2.5 at the subdistrict level in China. Int. J. Environ. Res. Public Health 2018, 15, 2683. [Google Scholar] [CrossRef] [Green Version]
Figure 1.
Comprehensive evaluation index of energy, economy and ecological environment in Australia from 2007 to 2016.
Figure 1.
Comprehensive evaluation index of energy, economy and ecological environment in Australia from 2007 to 2016.

Figure 2.
Contrast factor of energy and economy, energy and ecological environment, economy and ecological environment.
Figure 2.
Contrast factor of energy and economy, energy and ecological environment, economy and ecological environment.

Figure 3.
Coordination degree of energy, economy and ecological environment in Australia from 2007 to 2016.
Figure 3.
Coordination degree of energy, economy and ecological environment in Australia from 2007 to 2016.


Table 1.
The index of energy, economic and ecological environment in Australia from 2007–2016.
| System Layers | Index Layers | Unit | Index Character | Weights |
|---|---|---|---|---|
| Energy subsystem | Primary energy production | Quadrillion Btu | + | 0.1825 |
| Primary energy consumption | Quadrillion Btu | − | 0.1349 | |
| Energy intensity index | MJ per dollar of GDP | − | 0.2360 | |
| Net energy imports (as a percentage of energy consumption) | % | − | 0.1754 | |
| Ores and metals exports (% of merchandise exports) | % | − | 0.1648 | |
| Carbon dioxide emissions from energy consumption | Million Metric Tons | − | 0.1064 | |
| Economic subsystem | Per capita GDP | USD | + | 0.1394 |
| government final consumption expenditure | USD | − | 0.1352 | |
| Imports (Inflow of goods and services) | USD | + | 0.1998 | |
| exports (inflow of goods and services) | USD | − | 0.1196 | |
| Agriculture, forestry, and fishing, value added (% of GDP) | % | + | 0.3105 | |
| Industry (including construction), value added (% of GDP) | % | + | 0.0955 | |
| Ecological environment subsystem | water resources use | KL per capita | − | 0.1101 |
| forest area (% of land area) | % | + | 0.1497 | |
| Australian mean temperature anomaly (based on 2011) | °C | − | 0.1494 | |
| Australian annual mean rainfall | MM | + | 0.2368 | |
| PM2.5 air pollution, mean annual exposure | Micrograms Per Cubic Meter | − | 0.1331 | |
| particulate emission damage (% of GNI) | % | − | 0.2209 |
Table 2.
The classification and distinguishing criterion of contrast factor.
| L Level | Classifying Criterion | Types |
|---|---|---|
| I | 0.00–0.59 | Extreme damage |
| II | 0.60–0.79 | Serious damage |
| III | 0.80–0.99 | Shortage |
| IV | 1.00–1.49 | More adequate |
| V | 1.50 and over | Sufficient |
Table 3.
The classification and distinguishing criterion of coordination type.
| Coordination Level | Classifying Criterion | Types |
|---|---|---|
| I | 0.00–0.19 | Severely maladjusted |
| II | 0.20–0.39 | Moderately maladjusted, |
| III | 0.40–0.49 | Slightly maladjusted |
| IV | 0.50–0.59 | Barely coordinated |
| V | 0.60–0.69 | Moderately coordinated |
| VI | 0.70–0.79 | Good coordinated |
| VII | 0.80–1.00 | Pre-eminently coordinated |
Table 4.
Coupling and coordination degree of energy, economy and the ecological environment in Australia from 2007 to 2016.
Table 4.
Coupling and coordination degree of energy, economy and the ecological environment in Australia from 2007 to 2016.
| Year | Energy f(x) | Economy f(x) | Ecological Environment f(x) | C | T | D | Types |
|---|---|---|---|---|---|---|---|
| 2007 | 0.3563 | 0.3232 | 0.5265 | 0.8129 | 0.4020 | 0.5716 | Barely coordinated |
| 2008 | 0.4059 | 0.5727 | 0.5584 | 0.8992 | 0.5123 | 0.6787 | Moderately coordinated |
| 2009 | 0.3308 | 0.3216 | 0.5634 | 0.7301 | 0.4053 | 0.5440 | Barely coordinated |
| 2010 | 0.4345 | 0.3043 | 0.6094 | 0.6996 | 0.4494 | 0.5607 | Barely coordinated |
| 2011 | 0.2366 | 0.3438 | 0.5610 | 0.5689 | 0.3805 | 0.4652 | slightly maladjusted |
| 2012 | 0.5736 | 0.5536 | 0.2776 | 0.6328 | 0.4683 | 0.5444 | Barely coordinated |
| 2013 | 0.6290 | 0.3286 | 0.2142 | 0.4100 | 0.3906 | 0.4002 | slightly maladjusted |
| 2014 | 0.7435 | 0.4567 | 0.3290 | 0.6001 | 0.5098 | 0.5531 | Barely coordinated |
| 2015 | 0.7476 | 0.2446 | 0.3483 | 0.3639 | 0.4468 | 0.4033 | slightly maladjusted |
| 2016 | 0.6725 | 0.5567 | 0.5359 | 0.9558 | 0.5884 | 0.7499 | Good coordinated |
© 2019 by the authors. Licensee MDPI, Basel, Switzerland. This article is an open access article distributed under the terms and conditions of the Creative Commons Attribution (CC BY) license (http://creativecommons.org/licenses/by/4.0/).
Share and Cite
MDPI and ACS Style
Yan, X.; Chen, M.; Chen, M.-Y. Coupling and Coordination Development of Australian Energy, Economy, and Ecological Environment Systems from 2007 to 2016. Sustainability 2019, 11, 6568. https://0-doi-org.brum.beds.ac.uk/10.3390/su11236568
AMA Style
Yan X, Chen M, Chen M-Y. Coupling and Coordination Development of Australian Energy, Economy, and Ecological Environment Systems from 2007 to 2016. Sustainability. 2019; 11(23):6568. https://0-doi-org.brum.beds.ac.uk/10.3390/su11236568
Chicago/Turabian StyleYan, Xin, Min Chen, and Mu-Yen Chen. 2019. "Coupling and Coordination Development of Australian Energy, Economy, and Ecological Environment Systems from 2007 to 2016" Sustainability 11, no. 23: 6568. https://0-doi-org.brum.beds.ac.uk/10.3390/su11236568
Note that from the first issue of 2016, this journal uses article numbers instead of page numbers. See further details here.