Study on Urbanization Level, Urban Primacy and Industrial Water Utilization Efficiency in the Yangtze River Economic Belt


1
School of Finance and Economics, Institute of Industrial Economics, Jiangsu University, Zhenjiang 212013, China
2
School of Economics and Management, Jiangsu University of Science and Technology, Zhenjiang 212003, China
3
School of Economics, Lanzhou University, Lanzhou 730000, China
*
Author to whom correspondence should be addressed.
Sustainability 2019, 11(23), 6571; https://0-doi-org.brum.beds.ac.uk/10.3390/su11236571
Submission received: 14 September 2019
/
Revised: 10 November 2019
/
Accepted: 17 November 2019
/
Published: 21 November 2019
(This article belongs to the Special Issue Sustainability of Water Resources in the Developing Cities)
Abstract
:Considering the undesirable output, this paper adopted the data envelopment analysis (DEA) model with the slack variable and super efficiency improvement, to measure industrial water utilization efficiency in the Yangtze River Economic Belt. The paper also creatively introduces urbanization level and urban primacy into driver factors’ estimation by stochastic and fixed Tobit models, exploring how urbanization characteristics affected the water utilization in regional industrial production. The results showed that industrial water efficiency has maintained an upward trend during the whole period, while most central and western provinces have shown a U-shaped trend of decreasing first and then rising. However, the industrial water utilization efficiency of central regions is the lowest, and the eastern regions are the highest, catching up with western regions. Utilization efficiency shows an overall convergence during the research period from 2005 to 2017. Regarding the factors’ estimation, both population urbanization and land urbanization negatively affected industrial water utilization efficiency, particularly blind expansion and disorderly development. The urban primacy meant the unbalance of urbanization, which would lead to urban diseases and pollution transfer, while the effects of urban primacy depended on the urbanization level. However, the utilization efficiency of industrial water did not become better automatically along with urbanization development; therefore, the scale and speed of urbanization should be scientifically formulated. The effects of the level of economic development, the advanced industrial structure, and the level of foreign investment are significantly negative.
1. Introduction
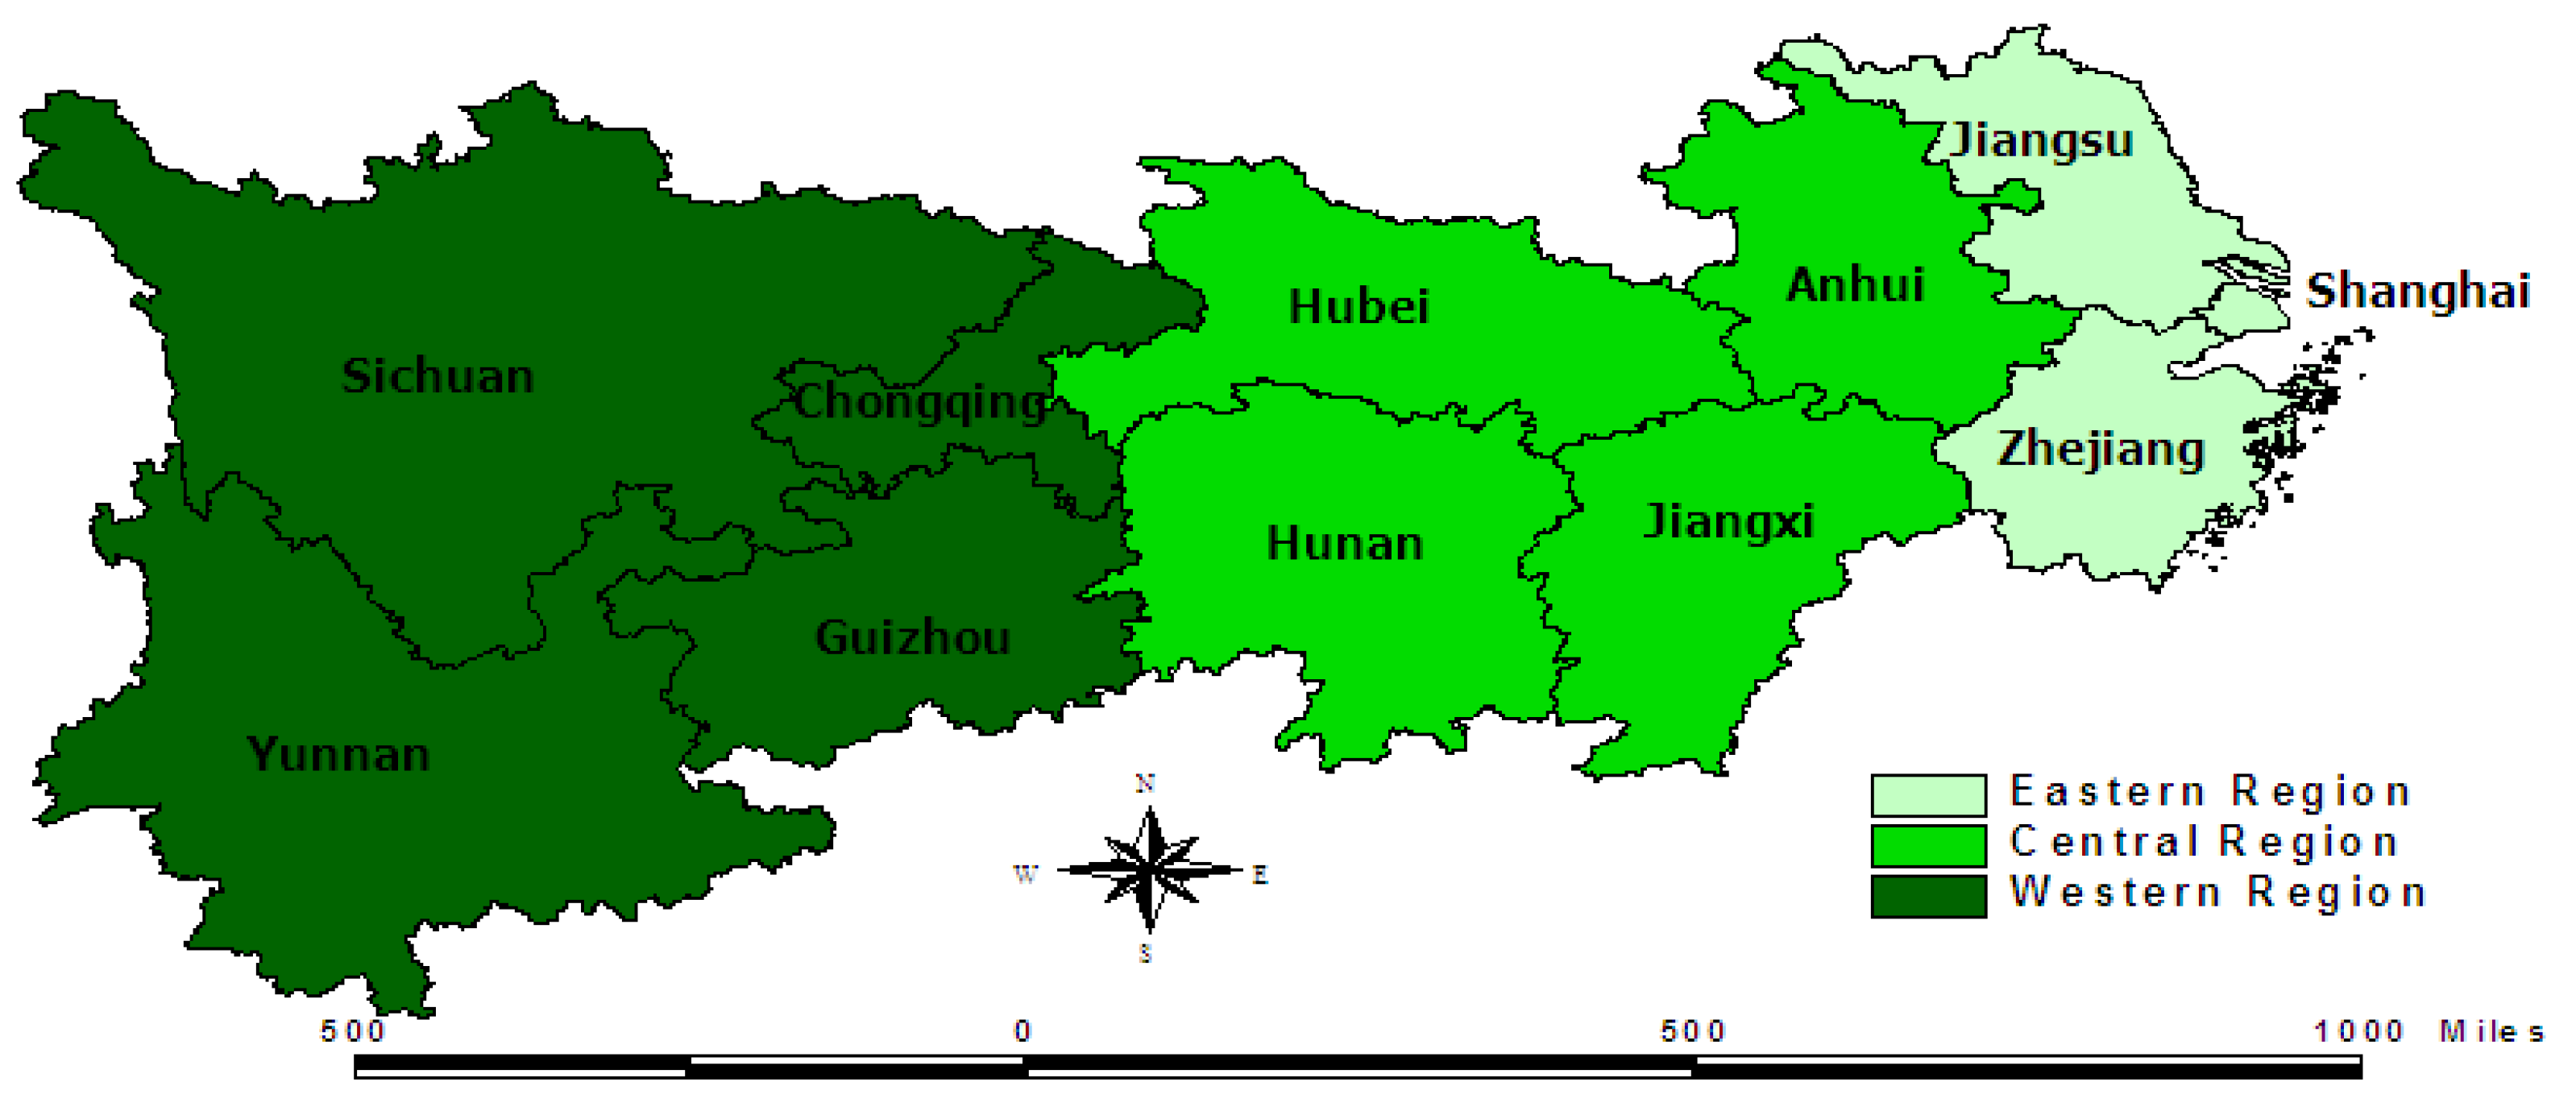
As the most important inland economic belt in China, the Yangtze River Economic Belt spans across 11 provinces and three economic regions as shown in Figure 1, supporting nearly 45% of the total economic output and over 40% of the population with less than a quarter of the country’s land area [1,2]. However, water consumption and water pollution, which have been standing behind the rapid economic growth and urbanization, are prominent. The industrial water consumption of the Yangtze River Economic Belt in 2018 is about 80.9 billion cubic meters, accounting for 64.12% of China’s total industrial water consumption, especially in Jiangsu, Shanghai and Chongqing. Industrial water consumption in these provinces has respectively accounted for 59.82%, 42.29%, and 39.27% of the total regional water consumption. As a densely populated urban belt in China, the population urbanization rate has increased from 14.08% in 1978 to 58.28% in 2017. The average rate of water quality qualification was only 73.2% in 2017, while the rate of water quality qualification lower than Class III was 16.1% [2]. The Class III water was mainly suitable for centralized drinking water, fishing and swimming, while the water of Class IV was mainly for industrial production and was not suitable for direct human contact. The built-up urban area was 22,182 square kilometers in 2017 and had been doubled from 12,122 square kilometers in 2005. Urbanization is always accompanied by industrialization and the transfer of rural populations, which also leads to the continuously optimization of the allocation of production factors. However, the industry cluster, the rapid growth of the urban population and the rapid expansion of construction land are also likely to cause irreversible water resources crises and water environment problems [3]. Moreover, water management and allocation, apart from the current competing demands, such as industrial water, urban water supply, agricultural irrigation, and ecosystems preservation, will be further affected, mainly by demographic and climatic changes drivers that increase the stress on water resources [4]. Against the background of ecological priority and green development in the Yangtze River Economic Belt, it is necessary to understand the internal mechanism of urbanization and industrial water utilization efficiency, to control the total industrial water consumption and industrial wastewater discharge, and promote the high-quality green development of the Yangtze River Economic Belt.
Water utilization efficiency generally refers to the economic value of the products produced by the unit consumption of water resources, but the utilization of water resources must be combined with labor and capital. From the research, the Data Envelopment Analysis (DEA) and Stochastic Frontier Approach (SFA) models, with multiple inputs and multiple outputs, are generally used to measure industrial water utilization efficiency [5,6]. The method of water efficiency evaluation based on data envelopment analysis does not need to clarify the functional relationship between variables or the dimension problem, because the advantages are widely used in the measurement of water utilization efficiency [7,8]. However, some of the initial studies did not consider the undesired output of water utilization, i.e., wastewater discharge, and only included regional GDP or other indicators as a desirable output. The later relevant research began to introduce this green development concept into water efficiency measurement [9,10]. In addition, the environmental Kuznets curve has also been applied to explore the relationship of industrial water utilization and economic development, while Logarithmic Mean Divisia Index (LMDI) decomposition methods, fuzzy comprehensive evaluation and grey correlation models have also been introduced into industrial water utilization efficiency analysis [11,12]. Some experts have also begun to pay attention to the spatial correlation and spillover effects of water utilization efficiency, and used the global Moran index, local Moran index and spatial models to test their spatial interactions [13,14]. With the help of the inter-regional, input–output table and the extended MRIO (Multi-Region Input–Output Analysis) model, the implied virtual water transfer of inter-regional trade can be measured. Thus, the trade implied virtual water transfer has two transfer paths, moving from north to south and from west to east, which also depend on the current unreasonable, inter-regional trade structure in China [15,16].
Due to the inter-regional differences between the natural environment and economic development, the driving factors of water utilization efficiency are also complicated. Domestic and foreign scholars have carried out a large number of theoretical and empirical studies around this topic. According to the existing researches, in some specific regions, resource endowment, industrial structure, technological innovation, foreign investment, opening up, and industry cluster will all affect regional water use efficiency. Of course, the factors of climate change also affect the water utilization efficiency, such as precipitation and evaporation, etc. [17]. In particular, there is still a certain threshold effect between the economic development level and water utilization efficiency in some research areas [18,19,20,21]. Some experts also confirmed that, by means of the environmental Kuznets curve, pollutant emissions will also experience an inverted U-shaped path that rises first and then falls with the urbanization process [22]. Some experts stated that this nonlinear influence relationship depended on the threshold regression model verification. Of course, the heterogeneity of natural environment or economic development in various regions would also lead to different types of nonlinear relationships [23,24]. A few scholars have also considered the spatial effect of water utilization efficiency with the urbanization process, and have verified that the spatial spillover of urbanization level was the primary influencing factor for improving water utilization efficiency [25]. As it is the main body of China’s new urbanization development and the future high-density urbanization cluster, the limited water resources and fragile water ecological environment will become a serious obstacle to the urbanization process of the Yangtze River Economic Belt [26,27]. Controlling the total amount of industrial water and industrial wastewater discharge has therefore become an unavoidable issue.
Thus, this paper has innovatively estimated the water utilization efficiency in the industrial production of Yangtze River Economic Belt, considering the undesirable output and slack variable improvement. In order to effectively grasp the temporal and spatial variation of industrial water utilization efficiency, this paper also distinguished the effective decision units with the superefficiency model [28]. Few previous researches considered the water utilization efficiency in the urbanization process, however, industrialization and urbanization were not separated, which affected water utilization efficiency [29]. Besides, urbanization is also a comprehensive concept, not only in population urbanization but also in land urbanization. The balance of urbanization development would affect the spatial distribution of industry and population in one province, which would further affect the utilization of water resources. Regarding the level and balance of urbanization development in various provinces in the economic belt, it is of great practical significance to examine the dynamic impact of urbanization characteristics on industrial water use efficiency. This research proposed that the mechanism of how urban primacy affects water utilization may also depend on urbanization level, providing a new research perspective for other scholars. A more scientific and reasonable path of urbanization is suggested, to help the local government promote water-saving and wastewater discharge reduction in the Yangtze River Economic Belt. More targeted policy measures are proposed to promote the double control of water resources and high-quality, green, coordinated development.
2. Model Construction
2.1. Undesirable SE–SBM Model
Data Envelopment Analysis (DEA) model is a non-parametric technical efficiency analysis method based on the relative comparison between the evaluated objects, which is different from the previous model. Compared with Stochastic Frontier Analysis, it could ignore the specific function forms and the data standardization, and didn’t need to make a correct prior assumption about the distribution of efficiency terms [30]. However, Stochastic Frontier Approach (SFA) defined the functional form of cost, profit or production function, while both inefficiency and randomness could be captured in this method [31]. By contrast, DEA method was more widely used than SFA method, while the DEA method relaxed a lot of settings. DEA model was firstly proposed by Charnes et al. (1978), and Tone Kaoru (2001) further proposed a Slack Based Measure (SBM) model considering relaxation variables. The SE–SBM model considering unsatisfactory output would solve the problem of the radial model not containing relaxation variables in its efficiency measurement, and would solve the problem of distinguishing the efficiency of the effective DMU. Besides, the "bad" output was included in the measurement system, which could more truly and comprehensively reflect the regional water utilization efficiency [32]. In Formula (1), it is assumed that the production system has n decision-making units, m inputs (x), expected outputs () and non-expected outputs () and the matrices X, , are defined as , , . is the relaxation of input and output, λ is the weight vector, is the objective function of , , and its value is between 0 and 1. is the input of item i of the DMU and is the output of item r of the DMU. When, and only if its value is 1, that is, when , and are equal, the decision-making unit is effective, otherwise it is ineffective or inefficient.
2.2. Tobit Model
The industrial water utilization efficiency with unsatisfactory output has the lowest limit value and also should be a discrete distribution variable, which belongs to truncated data. If the least squares regression is carried out directly with a super-efficiency value as the dependent variable, the linear regression estimation in the case of deletion would include the additional computational complexity. The parameter estimation would be biased and inconsistent, so Tobit model using maximum likelihood method would be selected to effectively solve this problem [33]. Tobit model should be selected to test the driving factors of water use efficiency, and was proposed by Tobin in 1958. The measurement model can solve the problem of model construction with restricted or truncated dependent variables. It consists of two kinds of equations; one is the selection equation expressing the constraints, and the other is the continuous variable selection equation satisfying the constraints [34]. Tobit model has been gradually applied to the estimation of driving factors such as innovation efficiency, carbon emission efficiency and water utilization efficiency. The specific form of Tobit model can be found in Formula (2). In the formula, is the efficiency of industrial water utilization, is the factors that include the core explanatory variables and control variables, and is the individual effect in panel model estimation. In addition, the panel Tobit model can further distinguish the stochastic effect model from the fixed effect model, depending on whether is related to the explanatory variable [35]. But the sufficient statistics of individual heterogeneity cannot be found in Tobit model with fixed effects, so conditional maximum likelihood estimation cannot be carried out as Logit model or Count model with fixed effects. If the virtual variable of the research unit is added into mixed Tobit regression, the estimated fixed effects are also inconsistent. So the Tobit models with mixed effects and random effects are adopted.
3. Empirical Estimation
3.1. Efficiency Estimation of Industrial Water Utilization
For the input–output relationship of water resources in industrial economic growth, water resource needs to utilize other production factors to achieve the economic benefits. The utilization efficiency of industrial water should a technical efficiency and should be expressed as the ratio of the actual input to the optimal input in water, when industrial output, undesirable output and other inputs are fixed. So input factors include labor, fixed assets investment and industrial water consumption, while output factors include industrial added value and wastewater discharge [7,13]. Firstly, the paper used the fixed assets investment of secondary industry to represent capital investment. This research only selected its current value, instead of considering the fixed capital stock. Secondly, the number of employees in the secondary industry was selected to represent labor input. The quality of the labor force has been improved in the manufacturing industry, so labor quality wasn’t considered in the research. Thirdly, the total amount of industrial water consumption could be separated into agricultural water consumption, domestic water consumption, industrial water consumption and ecological water compensation, etc. This paper would select the industrial water consumption as water resource input, which was more than half of the total water consumption in some provinces. Fourthly, the industrial added value had deleted the added value of the construction industry, while the capital and labor data adopted the data of the secondary industry, considering these data missing in the manufacturing industry. Finally, the total amount of wastewater discharge was selected, which includes lead, mercury, cadmium, arsenic, nitrogen, phosphorus and other pollutants.
The relevant data were derived from the China Statistical Yearbook of 2006–2018, the statistical yearbooks of various provinces, and relevant statistical bulletin. The DEA model, considering the undesired output, which was the industrial wastewater discharge, was adopted. The water utilization efficiency was estimated by the software of MAXDEA Pro 6.6; the results also could be estimated by the software of Matlab. The problem of slack variables and super efficiency were further improved. The weight of desired output and undesired output was set to 1:1, while the control of pollution discharge was regarded as important as economic output. The panel window period was set as 13 years, so the dynamic development of utilization efficiency could be seen clearly from 2005 to 2017. The results can be seen in Table 1.
3.2. Estimation Results of Tobit Model
In the selection of the driving factors of industrial water utilization efficiency in the Yangtze River Economic Belt, we mainly considered the population urbanization and land urbanization as the index of urbanization level. This paper also selected the city priority or urban primary ratio to represent the equilibrium degree of urbanization development within each province. The industrial structure, development level, technology innovation, environmental regulation, and foreign investment are used as control variables. Firstly, the proportion of non-agricultural population in each province was used to represent the standard of population urbanization, while the urban permanent population represents the degree of population concentration in urban areas. Secondly, the proportion of the city’s built-up area was represented as land urbanization, which meant the expansion of existing cities and the transformation from agricultural land to construction land [36]. Thirdly, the ratio of the first city to the second city in terms of urban population represented the urban primary ratio, which is helpful to grasp the balance of urbanization development in the province [37]. Fourthly, the cross-term of urbanization and urban primacy ratio was also selected, as the balance of urbanization development may have different effects on industrial water utilization efficiency in different urbanization stages. Fifthly, compared with the secondary industry, the proportion of the tertiary industry was more representative of the evolution of industrial structure and more suitable for the actual development of industrial upgrading [38]. Sixthly, the per capita GDP was selected as the regional economic development, as many experts have confirmed that water utilization efficiency will change with economic development [39]. Seventhly, the number of three kinds of patent granted per 10,000 people was adopted to represent the level of technological innovation. Eighthly, the ratio of the completed investment of industrial pollution governance to regional industrial added value represented the environmental regulation level, because higher environmental regulation forced companies to make efforts to save water and reduce emissions. Finally, the ratio of the total registered investment of foreign-invested enterprises to GDP was used as the foreign investment stock, which may bring the pollution shelter or pollution halo effect. The relevant data came from the statistical yearbooks of China and that of provinces in the period 2006–2018. The driving factors were estimated by the software of STATA, and the results can be seen in Table 2. The stochastic panel regression model was more significant than the mixed panel regression model, while the value of LR was 87.22, which meant rejecting the hypothesis that “”, and there were individual effects.
4. Results Discussion
4.1. Law of Industrial Water Utilization Efficiency
From the perspective of development trends, the industrial water utilization efficiency has increased from 0.39 to 0.93 in the Yangtze River Economic Belt, especially in the period from 2010 to 2017. The industrial water utilization efficiency was relatively stable and had declined slightly in individual years. The efficiency experienced a U-shaped trend of decline first and then rise in some central provinces and most western provinces, such as Anhui, Chongqing, Guizhou, Jiangxi, and Yunnan. The industrial water utilization efficiency of all eastern provinces maintained an upward trend, which was also consistent with the environmental Kuznets curve, so economic development should be a fundamental way to solve the problems of water pollution and water consumption [40,41]. Of course, there provinces also had a significant decline in their history, while the government relaxed environmental regulations in order to pursue economic growth and industrial agglomeration. The government formulated the strictest management system of water resources, so utilization efficiency started to be improved greatly.
From the perspective of spatial differentiation, the whole research period could be divided into two periods. In particular, the industrial water utilization efficiency of western provinces was the highest, and the utilization efficiency of central provinces was the lowest in the period from 2005 to 2010. But the utilization efficiency of eastern provinces was the highest and the utilization efficiency of central provinces was the lowest in the period from 2011 to 2017. During the whole period, the utilization efficiency of Guizhou was excellent. For example, the green economy of Guizhou accounted for more than 40% of GDP in 2017, and industrial wastewater discharge remained at a low level during this period. However, the industrial water utilization efficiency of Anhui and Jiangxi provinces was significantly lower in the years from 2012 to 2017. These provinces have become the valley floor and landslide area of Yangtze River Economic Belt, because of the idling of pollution treatment plants and direct discharge of industrial sewage [42]. The industrial water utilization efficiency of Jiangsu, Zhejiang, Shanghai and Chongqing were higher, while these governments proposed stricter environmental regulations and a stronger technical innovation level, with a higher economic development level.
From the perspective of interregional convergence, the inter-regional efficiency of industrial water utilization has converged during the research period. The variation coefficient of utilization efficiency showed an overall downwards trend, from 0.69 in 2005 to 0.26 in 2017. The spatial spillover effect of industrial water utilization has been verified by some experts, as mentioned in Table 2. The industrial water utilization would spread across the economic belt by industrial transfer and technology exchange, and the high-quality coordinated development of Yangtze River Economic Belt would strengthen this convergence. Regionally, the western provinces showed a convergence trend, the eastern provinces also showed a convergence trend after a slight diffusion, and the central provinces showed a diffusion trend after a slight convergence. The industrial water utilization efficiency varied in different economic regions [43]. Compared with the surrounding provinces, the provinces of Anhui and Jiangxi had a different water utilization efficiency, though these regions were adjacent to the eastern provinces, such as Jiangsu, Zhejiang and Shanghai. Because these regions undertook excessive industrial transfer with high water consumption and discharge, efficiency was not improved consistently.
4.2. Driving Factors of Industrial Water Utilization Efficiency
As been seen in Table 2, population urbanization had a significant negative effect on industrial water utilization efficiency. Though the significance level was 0.11, the paper still thought that the estimated result reluctantly passed the 0.10 significance test. This result was contrary with the theoretical or empirical conclusions of many experts. Xiong Y. (2018) proposed that urbanization had promoted water resource utilization potential in the Changsha–Zhuzhou–Xiangtan city group [44]. In this period, the urban population increased from 229.81 billion to 346.86 billion, and the urbanization rate has increased more than 15 percentage points. Urbanization always started from large-scale industrialization and agricultural population industrialization, but the population transfer from rural to urban areas would increase the discharge of waste water and lead to a decline in industrial water utilization efficiency [45]. In the government-led model, low-skilled farmers transferred to the city and were employed in low-end manufacturing, which was conducive for the improvement of industrial water utilization [46]. The urbanization rate of the population was generally calculated by the permanent population, and it was very difficult for peasant-workers to integrate into civil society. The management system of household registration also made the peasant-workers promote themselves at a technical and cultural level, so HouY.C. (2011) already proposed the citizenization of migrant workers [47].
As can be seen in Table 2, land urbanization also had a significant negative effect on industrial water utilization efficiency, and the negative effect was greater than that of population urbanization. Compared with the gradual urbanization in western developed countries, China’s urbanization process was more accelerated and uncontrolled in terms of space expansion, and the excessive urbanization also became a heavy burden on regional resources and environment [48,49,50]. So, Guo X.F. (2019) became aware of the problems of “land quick access to city” and proposed green urbanization to achieve a sustainable development of urbanization [51]. In the research period, the built-up area of cities increased from 12,122.01 square kilometers to 22,181.89 square kilometers, which was far ahead of the population urbanization. Qin T. (2017) proved that the effect of urbanization had the obvious stage characteristic, while government-led and extensive expanding urbanization didn’t promote the transfer of water resources from inefficient agriculture to efficient manufacturing [52]. However, some industrial estates occupied a lot of land, and the industrial restructuring of these areas was far from high-quality development, with high water consumption and wastewater emissions [53,54]. Zhang H.Q. (2019) also proposed that land urbanization and population urbanization would increase the industrial wastewater discharge, while economic urbanization would restrain the wastewater discharge in the Yangtze River Economic Belt [55].
As can be seen in Table 2, urban primacy had a significant negative effect on industrial water utilization efficiency, so the unbalanced development of urbanization wasn’t conducive to the improvement in industrial water utilization efficiency. In this period, the average urban primacy of the Yangtze River Economic Belt dropped slightly from 1.63 to 1.59, while the indexes of Hubei, Sichuan, Yunnan and Anhui all exceeded 1.7. However, Wei H.K. (2014) proposed that the polarization of urbanization in China was obvious; big cities over-expanded and small cities relatively shrank [56]. The urbanization structure layout of “one city alone”, with industry and population agglomeration, has brought urban diseases such as water consumption and pollution discharge [57]. Besides, the super-large central cities partly occupied the resources of technological innovation and environmental governance in other cities [58,59]. The high-tech and green industries needed more professional talents and innovation funds, rather than the simple growing size and population of central cities [60]. Zhu X.G. (2017) also proved that the imbalance of population between cities had been weakened, while the imbalance of land urbanization had been strengthened [61], so the urban primacy of the Yangtze River Economic Belt should be taken seriously.
As seen in Table 2, the cross-term of urban primacy and urbanization had a significant positive effect on industrial water utilization efficiency, in other words, whether urban primacy was positive depended on the stage of urbanization development. Zhou Z.P. (2014) also proposed that the urbanization pattern of leading strategy had a different role in the short term and in the long run [62]. In this period, the urbanization level of Jiangsu and Zhejiang increased from about 50% to more than 65% and the urbanization development was more balanced. However, in the central regions, the urban primacy was more than 1.6 where urbanization level was relatively low, while urbanization was seriously unbalanced in Yunan–Guizhou–Sichuan, where the urbanization level was lowest. Chen W.Z. (2017) proved that urban primacy ratio should have reasonable upper and lower limits [63], and urban primacy should be consistent with the level of regional economic development and urbanization level. The "trickle-drop effect" and "siphon effect" of the central city to the surrounding cities are also limited by the urban primacy [64,65]. Ding X.H. (2019) has already verified that environmental regulation had a threshold effect with the economic development level on water utilization efficiency [43]. At a certain stage of urbanization, the agglomeration of industries and population in the central city would have a positive effect, while the balanced urbanization would promote industrial water utilization efficiency after certain levels.
As seen in Table 2, the control variables of industrial water utilization efficiency presented different effects. Specifically, industrial structural upgrading had a significant positive effect, while eliminating the industrial enterprises of high water consumption and wastewater discharge. Then, the high-tech and green industries would gradually occupy a dominant position in this process [66,67]. The economic development level also had a significant positive effect, which was consistent with the theory of environmental Kuznets curve. When GDP per capita reaches a certain level, the problems of resource consumption and environmental pollution would be gradually improved [68,69]. Foreign investment also had a significant positive effect, and would have a spillover effect on regional enterprises through the correlation effect, demonstration effect, competition effect and talent flow effect, which would improve the utilization efficiency [70,71]. Environmental regulation didn’t have a significant effect, while stricter environmental regulation would lead to the transfer of virtual water and water pollution [72]. Hou W.L. (2013) had explored the relationship between environmental regulation and industrial inter-regional transfer, and had proved the “Pollution Havens” in China [73]. However, stricter environmental regulations may lead industrial enterprises to pay higher compliance costs, thus squeezing their investment in technological innovation, which may be bad for industrial water efficiency [74,75].
5. Conclusions
Considering the undesirable output of industrial wastewater, the research adopted the Super-efficiency Slack-based-Model DEA to measure the utilization efficiency of industrial water in Yangtze River Economic Belt. Firstly, the overall utilization efficiency of industrial water was improved significant in the research period, while the utilization efficiency of central and western provinces showed a U-shaped trend. However, the eastern provinces maintained an upward trend during the research period, which was consistent with the environmental Kuznets curve, so the government should solve these problems in economic development. Secondly, the industrial water utilization efficiency of central provinces was the lowest, which had become the major disaster areas of water utilization. Besides, the industrial water utilization efficiency of the central provinces was highest, catching up the western provinces from 2010 to 2017. Thirdly, the whole utilization efficiency of industrial water showed the convergence trend from 2005 to 2017 in the Yangtze River Economic Belt. Regionally, the eastern provinces showed a convergence trend after a slight risie, while central provinces showed a diffusion trend after a slight decline.
Thie research also adopted the mixed and stochastic Tobit panel models to estimate how the urbanization level and urban primacy affected the industrial water utilization efficiency, and verified that the random Tobit model was more suitable. Firstly, both population urbanization and land urbanization had a significant negative effect on industrial water utilization efficiency, while the negative effect of land urbanization was relatively larger. Secondly, the imbalanced development of urbanization had a significant negative effect, as the hypercentral city would crowd out the resources of technological innovation and environmental governance in surrounding cities. The hypercentral city would also transfer the high water-consuming and high wastewater-discharge industries to surrounding cities. Thirdly, the relationship between urban primacy and utilization efficiency may depend on the urbanization stage, so the urban primacy should be consistent with the level of economic development. Finally, industrial structure, foreign investment and technological innovation had a significantly positive effect on industrial water utilization efficiency, while environmental regulation didn’t have a significant effect.
In view of these conclusions, firstly, the local government should comprehensively promote the new type of urbanization, gradually improve the population quality of urbanization, and enhance the education and vocational training of the population. Secondly, the expansion preferences of local government in land urbanization should be strictly regulated, and the scale and speed of urbanization should be scientifically formulated. Thirdly, the government should persist in exerting the role of the central city, promoting the balanced development of urban agglomerations, and guiding the orderly transfer of industries. Fourthly, the government should accelerate the upgrading and adjustment of industrial structure, actively develop the high-tech industries, and strengthen the technological innovation of water-saving and emission-reduction efforts. Finally, the government should formulate reasonable environmental regulation policies, limit the entry of foreign-invested enterprises with a high wastewater discharge, and promote the green coordinated development of the Yangtze river economic belt.
However, this research didn’t consider the threshold effect of urbanization on industrial water utilization efficiency, and the bounds of population urbanization and land urbanization should be further explored. Economic urbanization and social urbanization should be very important in the urbanization process, so the urbanization quality should be included in the evaluation process of water utilization. The different industries’ departments should be distinguished in the water utilization, because they may have significant effects on water utilization and wastewater discharge in the Yangtze river economic belt. Due to the availability of data, the study region was set at the province level, but this was better for exploring the results at the city level. These problems will be answered in the future research.
Author Contributions
Data curation, Z.F. and H.J.; Formal analysis, X.D.; Funding acquisition, X.D.; Investigation, Z.F.; Methodology, Z.F.; Resources, Z.F.; Software, X.D.; Supervision, H.J.; Visualization, H.J.; Writing—original draft, H.J.; Writing—review and editing, X.D.
Funding
This research was supported by Social Science Foundation of Jiangsu Province (18GLC002), National Natural Science Foundation of China (71603071), National Social Science Foundation of China (16CJY018) and Soft Science of Key R&D and Promotion Special Project of Henan Province (192400410104).
Conflicts of Interest
The authors declare no conflict of interest.
References
- Ministry of Water Resources of the People′s Republic of China. China Water Resources Bulletin 2017; China Water Resources and Hydropower Publishing House: Beijing, China, 1 April 2017.
- Yangtze River Water Resources Committee of the Ministry of Water Resources. Water Resources Bulletin of the Yangtze River Basin and Southwest Rivers 2017; Yangtze River Publishing House: Wuhan, China, 10 October 2018. [Google Scholar]
- Huang, M.Y.; Yue, W.Z.; He, X. Decoupling Relationship between Urban Expansion and Economic Growth and Its Spatial Heterogeneity in the Yangtze Economic Belt. J. Nat. Resour. 2018, 33, 219–232. [Google Scholar]
- Skoulikaris, C.H.; Filali-Meknassi, Y.; Aureli, A.; Amani, A.; Jiménez-Cisneros, B.E. Information-Communication Technologies as an Integrated Water Resources Management (IWRM) Tool for Sustainable Development. In Integrated River Basin Management for Sustainable Development of Regions; Komatina, D., Ed.; InTech Publications: London, UK, 2018. [Google Scholar]
- Garcia-Valinas, M.A.; Muniz, M.A. Is DEA Useful in the Regulation of Water Utilities? A Dynamic Efficiency Evaluation. Appl. Econ. 2007, 39, 245–252. [Google Scholar] [CrossRef]
- Lei, Y.T.; Huang, Y.P. Analysis of Industrial Water Use Efficiency and Water Saving Potential of Main Industrial Provinces in China Based on SFA: 1999–2013. J. Ind. Technol. Econ. 2015, 3, 49–57. [Google Scholar]
- Li, J.; Ma, X.C. The Utilization Efficiency of Industrial Water under the Dual Constraints of Resource and Environment—An Empirical Study Based on SBM-Undesirable and Meta-frontier Model. J. Nat. Resour. 2014, 29, 920–933. [Google Scholar]
- Gidion, D.K.; Hong, J.; Adams, M.Z.A.; Khoveyni, M. Network DEA models for assessing urban water utility efficiency. Util. Policy 2019, 57, 48–58. [Google Scholar] [CrossRef]
- Wang, Y.S.; Xu, H.; Bian, Y.W. Efficiency Evaluation of Industrial Water Use System: Two-Stage DEA Considering the Disposable Characteristics of Pollutants. Chin. J. Manag. Sci. 2016, 24, 169–176. [Google Scholar]
- Wang, M.; Sun, C.Z.; Wang, X.L. Analysis of the Water-Energy Coupling Efficiency in China: Based on the Three-Stage SBM-DEA Model with Undesirable Outputs. Water 2019, 11, 632. [Google Scholar] [CrossRef]
- Zhang, Y.; Pan, B.L.; Li, J.B.; Gu, A.L. Research on the Relationship between Industrial Water Use and Economic Growth in China Based on Kuznets Curve. Resour. Sci. 2017, 39, 1117–1126. [Google Scholar]
- Yao, L.Q.; Xu, J.R.; Zhang, L.N.; Pang, Q.H.; Zhang, C.J. Temporal-spatial Decomposition Computing of Regional Water Intensity for Yangtze River Economic Zone in China based on LMDI Model. Sustain. Comput. Inform. Syst. 2019, 21, 119–128. [Google Scholar] [CrossRef]
- Zhang, F.; Xue, H.F.; Song, X.N.; Wang, H.N. Spatial Spillover Effect Test on Industrial Water Use Efficiency. Stat. Decis. 2018, 9, 130–134. [Google Scholar]
- Kilic, E.; Yucel, N. Determination of Spatial and Temporal Changes in Water Quality at Asi River Using Multivariate Statistical Techniques. Turk. J. Fish. Aquat. Sci. 2019, 19, 727–737. [Google Scholar] [CrossRef]
- Wang, Y. Virtual Water Transfer Calculation among China′s Regional Trade Based on Whole Industry Caliber. China Popul. Resour. Environ. 2016, 26, 107–115. [Google Scholar] [CrossRef] [PubMed]
- White, D.J.; Feng, K.S.; Sun, L.X.; Hubacek, K. A hydro-economic MRIO analysis of the Haihe River Basin′s water footprint and water stress. Ecol. Model. 2015, 318, 157–167. [Google Scholar] [CrossRef]
- Ganoulis, J.; Skoulikaris, C. Impact of Climate Change on Hydropower Generation and Irrigation: A Case Study from Greece. In NATO Science for Peace and Security Series C: Environmental Security; Springer: Dordrecht, The Netherlands, 2011; Volume 3, pp. 87–95. [Google Scholar]
- Hu, B.; Hou, S.B. Temporal and Spatial Differences of Urban Industrial Water Consumption Efficiency in Jing—Jin—Ji region. J. Arid Land Resour. Environ. 2016, 30, 1–7. [Google Scholar]
- Manouseli, D.; Kayaga, S.M.; Kalawsky, R. Evaluating the Effectiveness of Residential Water Efficiency Initiatives in England: Influencing Factors and Policy Implications. Water Resour. Manag. 2019, 33, 2219–2238. [Google Scholar] [CrossRef]
- Zhang, X.D. Spatial Ddifferences and Influencing Factors of Regional Agricultural Water Use Efficiency in Heilongjiang Province, China. Water Sci. Technol. Water Supply 2019, 19, 545–552. [Google Scholar]
- Yao, X.L.; Feng, W.; Zhang, X.L.; Wang, W.X.; Zhang, C.T.; You, S.Q. Measurement and Decomposition of Industrial Green Total Factor Water Efficiency in China. J. Clean. Prod. 2018, 198, 1144–1156. [Google Scholar] [CrossRef]
- Wang, Y.Y.; Yu, H.; Zhang, Y.L.; Zhao, Z.J.; Zhang, Y. The Forecast Analysis on the Effect of Urbanization Process on Resources and Environment. Urban Dev. Stud. 2017, 24, C1–C5. [Google Scholar]
- Kan, D.X.; Lv, L.J. Study on the Nonlinear Influence of Urbanization on Water Resources Utilization: Based on PSTR Model. J. Huazhong Univ. Sci. Technol. 2017, 31, 126–134. [Google Scholar]
- Sun, H.; Bless Kofi, E.; Sun, C.; Kporsu, A.K. Institutional quality, Green Innovation and Energy efficiency. Energy policy 2019, 135, 111002. [Google Scholar] [CrossRef]
- Bao, C.; Chen, X.J. Spatial Econometric Analysis on Influencing Factors of Water Consumption Efficiency in Urbanizing China. J. Geogr. Sci. 2017, 27, 1450–1462. [Google Scholar] [CrossRef]
- Qin, T.; Zhang, H.Q.; Tong, J.P.; Ma, J.F.; Zhi, Y.L. Water resource constraint on urbanization in Yangtze River Economic Belt. China Popul. Resour. Environ. 2018, 28, 39–45. [Google Scholar]
- Ma, H.L.; Jiang, M.D.; Hou, Y.R. Study on Decoupling Effect of Urbanization of the Yangtze River Economic Belt to Industrial Water Use: Based on the Comparative Analysis of the Data of the Period of “11th Five Year Plan” and “12th Five Year Plan”. Resour. Environ. Yangtze Basin 2018, 27, 1683–1692. [Google Scholar]
- Zhang, H.; Zhou, Z.L.; Zheng, J. Efficiency Evaluation of Science and Technology Service Industry in the Yangtze River Delta Urban Agglomeration—Based on Super-Efficient DEA Model and Window Analysis. Sci. Technol. Prog. Policy 2019, 36, 46–53. [Google Scholar]
- Kan, D.X.; Lv, L.J. Study on the Impact of Urbanization on Water Resources Utilization in China—A Perspective based on Water Footprint and Spatial Dynamic Panel Data. Shanghai J. Econ. 2017, 12, 37–46. [Google Scholar]
- Fu, L.N.; Chen, X.H.; Leng, Z.H. Urban Agglomerations Ecoefficiency Analysis Based on Superefficienty DEA Model: Case Study of Chang-Zhu-Tan “3 + 5” Urban Agglomeration. China Popul. Resour. Environ. 2013, 23, 169–175. [Google Scholar]
- Wang, X.Y. A Comparative Study of Irrigation Water Efficiency of Farmers Based on DEA and SFA—by Using Survey Data from Northwest China. Sci. Technol. Prog. Policy 2010, 1, 8–13. [Google Scholar]
- Cecchini, L.; Venanzi, S.; Pierri, A.; Chiorri, M. Environmental Efficiency Analysis and Estimation of CO2 Abatement Costs in Dairy Cattle Farms in Umbria (Italy): A SBM-DEA Model with Undesirable Output. J. Clean. Prod. 2018, 197, 895–907. [Google Scholar] [CrossRef]
- Zhang, Z.F.; Shen, J.Q.; He, W.J. An Empirical Study of Urbanization and Sewage Discharge Based on EKC: Taking Provincial Panel Data in Eastern China for Example. J. Hohai Univ. Philos. Soc. Sci. 2018, 20, 60–66. [Google Scholar]
- Wang, S.Q.; Zhou, L.; Wang, H.; Li, X.C. Water Use Efficiency and Its Influencing Factors in China: Based on the Data Envelopment Analysis (DEA)-Tobit Model. Water 2018, 10, 832. [Google Scholar] [CrossRef]
- Tong, J.P.; Ma, J.F.; Wang, S.; Qin, T.; Wang, Q. Study on Agricultural Water Use Efficiency in the Yangtze River Basin: Based on Super Efficiency DEA and Tobit Model. Resour. Environ. Yangtze Basin 2015, 24, 603–608. [Google Scholar]
- Chen, F.P.; Zhang, H.O.; Wu, Q.T.; Chen, W.L. A Study on Coordinate Development Between Population Urbanization and Land Urbanization in China. Hum. Geogr. 2010, 5, 53–58. [Google Scholar]
- Liu, C.L.; Wang, T.; Guo, Q.B. Factors Aggregating and the Regional Differences among China Urban Agglomerations. Sustainability 2018, 10, 4179. [Google Scholar] [CrossRef]
- Zhou, Y.; Kong, Y.; Sha, J.; Wang, H.K. The Role of Industrial Structure Upgrades in Eco-efficiency Evolution: Spatial Correlation and Spillover Effects. Sci. Total Environ. 2019, 687, 1327–1336. [Google Scholar] [CrossRef]
- Chen, M.; Qiu, J.Q. Research on Water Environment Regulation Based on Environmental Kuznets Curve. J. Jiangxi Univ. Financ. Econ. 2018, 4, 53–59. [Google Scholar]
- Ridzuan, S. Inequality and the environmental Kuznets curve. J. Clean. Prod. 2019, 228, 1472–1481. [Google Scholar] [CrossRef]
- Sun, T.; Zhang, H.W.; Wang, Y.; Wang, C.W. Research on “Pollution First, Treatment Later” in China Based on Environmental Kuznets Curve Theory. Environ. Sci. Manag. 2010, 35, 148–151. [Google Scholar]
- Liu, Y.B.; Wang, G.X. Analysis of “Growing Resistance” of Water and Soil Resources in the Process of Urbanization. Ecol. Econ. 2010, 10, 161–163. [Google Scholar]
- Ding, X.; Tang, N.; He, J. The Threshold Effect of Environmental Regulation, FDI Agglomeration and Water Use Efficiency under Double Control Actions—An Empirical Test Based on Yangtze River Economic Belt. Water 2019, 11, 452. [Google Scholar] [CrossRef]
- Xiong, Y.; Su, M.T.; Zhang, F.M.; Li, J.Z. Study on the Response Relationship between Urbanization and Water Resource Utilization of Changsha-Zhuzhou-Xiangtan Urban Agglomeration. Hum. Geogr. 2018, 6, 69–76. [Google Scholar]
- Deng, X.L.; Che, M.H.; Chen, B.D. Analysis of Environmental Pollution Effect and Influencing Factors of Urbanization in China. Inq. Econ. Issues 2017, 1, 31–37. [Google Scholar]
- Gu, G.T.; Zhu, W.J. Interaction Effects between Technology-Driven Urbanization and Eco-Environment: Evidence from China′s East Zhejiang Region. Sustainability 2019, 11, 836. [Google Scholar] [CrossRef]
- Hou, Y.C.; Han, J.; Jiang, S.S.; He, Y.P.; Jin, S.L. The General Situation and Strategy Orientation of the Citizenization Process of the Migrant Workers. Reform 2011, 5, 5–29. [Google Scholar]
- Liu, H.; Sun, Z. Distortion of Urbanization Motivation and Overcapacity of Manufacturing Industry: An Empirical Analysis Based on China′s Provincial Panel Data 2001–2012. China Ind. Econ. 2014, 11, 5–17. [Google Scholar]
- Qiu, L.F.; Pan, Y.; Zhu, J.X.; Amable, G.S.; Xu, B.G. Integrated Analysis of Urbanization-triggered Land Use Change Trajectory and Implications for Ecological Land Management: A Case Study in Fuyang, China. Sci. Total Environ. 2019, 660, 209–217. [Google Scholar] [CrossRef] [PubMed]
- Li, B.L.; Hu, X.P. Forming and Evolvement of Land Urbanization Bubble: A Researches Based on Financial Supportive Excess Hypothesis. Econ. Surv. 2016, 33, 155–160. [Google Scholar]
- Guo, X.F.; Chen, T.L. Research on Promoting Green Urbanization through Rural Revitalization. Mod. Econ. Res. 2019, 9, 114–117. [Google Scholar]
- Qin, T.; Zhang, H.Q.; Tong, J.P.; Ma, J.F. Analysis on Threshold Effects and Dynamic Mechanism of Water Consumption Growth in the Process of Urbanization. China Popul. Resour. Environ. 2017, 27, 45–53. [Google Scholar]
- Arfanuzzaman, M.; Dahiya, B. Sustainable Urbanization in Southeast Asia and beyond Challenges of Population growth, Land Use Change, and Environmental Health. Growth Chang. 2019, 50, 725–744. [Google Scholar] [CrossRef]
- Li, X.Q.; Jiang, B.; Chu, N.C. Coupling and Coordination Analysis of Land Intensive Utilization and New Urbanization in Urban Agglomerations: A Case Study of Three Big City Agglomerations in China. Resour. Environ. Yangtze River Basin 2017, 26, 983–991. [Google Scholar]
- Zhang, H.Q.; Li, Y.; Li, J.; Zhang, C.J. Analysis of the Influencing of Multi-Dimensional Urbanization on Industrial Wastewater Discharge. J. Ind. Technol. Econ. 2019, 9, 58–66. [Google Scholar]
- Wei, H.K. Polarization Trend and Optimization of Size Distribution in China′s Urbanization Process. China Ind. Econ. 2014, 3, 18–30. [Google Scholar]
- Saravanan, V.S.; Idenal, M.A.; Saiyed, S.; Saxena, D.; Gerke, S. Urbanization and Human Health in Urban India: Institutional Analysis of Water-borne Diseases in Ahmedabad. Health Policy Plan. 2016, 31, 1089–1099. [Google Scholar] [CrossRef] [PubMed]
- Xiao, Y.F.; Liao, S.H. Green Innovation or Pollution Transfer: Literature Review of Environmental Regulation Effect and Prospect of Cooperative Emission Reduction Theory. World Geogr. Stud. 2017, 26, 126–133. [Google Scholar]
- Yuan, F.; Wei, Y.D.; Gao, J.L.; Chen, W. Water Crisis, Environmental Regulations and Location Dynamics of Pollution-intensive Industries in China: A Study of the Taihu Lake Watershed. J. Clean. Prod. 2019, 216, 311–322. [Google Scholar] [CrossRef]
- Xu, C.S.; Zhou, Z.P. The Spatial Spillover Effects of Urban Primacy on Different Industries. J. Guizhou Univ. Financ. Econ. 2014, 4, 70–74. [Google Scholar]
- Chen, L.; Zhu, X.G. Regional Disequilibrium and Dynamic Evolution of China′s Urbanization:Evidence from the Gini Coefficient and Kernel Density Estimation. Stat. Inf. Forum 2017, 32, 76–84. [Google Scholar]
- Zhou, Z.P.; Xu, C.S. Leading or Balanced—A Spatial Econometric Analysis on Urban Primacy and Economic Growth. Econ. Surv. 2014, 31, 20–25. [Google Scholar]
- Chen, Z. Empirical Study Theoretical and Evidence on the Optimal Scale of Urban Primacy Ratio. Stat. Decis. 2017, 5, 126–129. [Google Scholar]
- Carvalho, J.M.S.; Costa, R.V.; Marnoto, S.; Vieira, J.C.; Sousa, C.A.A. Resource-based view of city quality: Scales development and validation. Growth Chang. 2019, 50, 856–879. [Google Scholar] [CrossRef]
- Shi, D.Y.; Li, X.B.; Duan, L.L. Does New Urbanization Improve the Quality of Ecological Civilization in Western China? Explor. Econ. Issues 2018, 7, 164–173. [Google Scholar]
- Wu, D. Analysis of the Relationship between Industrial Structure and Water Resources in Beijing-Tianjin-Hebei Region and Construction of Two-way Optimization Model. China Popul. Resour. Environ. 2018, 28, 158–166. [Google Scholar]
- Wang, W.Y.; Zeng, W.H. Optimizing the Regional Industrial Structure Based on the Environmental Carrying Capacity: An Inexact Fuzzy Multi-Objective Programming Model. Sustainability 2013, 5, 5391–5415. [Google Scholar] [CrossRef]
- Ma, J.; Yan, B.S. Research on the Relation between Economic Development and Water Use Efficiency Based on Environmental Kuznets Theory: Evidence from Panel Data of 31 Provinces in China from 2002 to 2013. Audit Econ. Res. 2016, 4, 121–128. [Google Scholar]
- Zhao, X.L.; Fan, X.H.; Liang, J.C. Kuznets Type Relationship between Water Use and Economic Growth in China. J. Clean. Prod. 2017, 168, 1091–1100. [Google Scholar] [CrossRef]
- Jin, W.; Mao, G.X. The Threshold Effect of FDI and Environmental Regulation on Industrial Water Use Efficiency. Int. Bus. 2018, 2, 100–112. [Google Scholar]
- Sun, H.; Clottey, S.A.; Geng, Y.; Fang, K.; Amissah, J.C.K. Trade Openness and Carbon Emission: Evidence from Belt and Road Countries. Sustainability 2019, 11, 2682. [Google Scholar] [CrossRef]
- Rezza, A.A. FDI and pollution havens: Evidence from the Norwegian manufacturing sector. Ecol. Econ. 2013, 90, 140–149. [Google Scholar] [CrossRef]
- Hou, W.L.; Fang, L.; Liu, S. Do Pollution Havens Exist in China? An Empirical Research on Environmental Regulation and Transfer of Pollution Intensive Industries. Econ. Rev. 2013, 4, 65–72. [Google Scholar]
- Zhang, F.; Song, X.N.; Xue, H.F.; Dong, H.Z. Decoupling Relation and Dynamic Response of Environmental Regulation, Technological Progress and Industrial Water Intensity. China Popul. Resour. Environ. 2017, 27, 193–201. [Google Scholar]
- Jin, W.; Zhang, H.Q.; Liu, S.S.; Zhang, H.B. Technological innovation, environmental regulation, and green total factor efficiency of industrial water resources. J. Clean. Prod. 2019, 211, 61–69. [Google Scholar] [CrossRef]
Figure 1.
Diagram of the Yangtze river economic belt with geographical zones.


Table 1.
Measurements of Interprovincial Industrial Water Utilization Efficiency in the Yangtze River Economic Belt, Considering Undesirable Output from 2005 to 2017.
Table 1.
Measurements of Interprovincial Industrial Water Utilization Efficiency in the Yangtze River Economic Belt, Considering Undesirable Output from 2005 to 2017.
| Province | 2005 | 2006 | 2007 | 2008 | 2009 | 2010 | 2011 | 2012 | 2013 | 2014 | 2015 | 2016 | 2017 |
|---|---|---|---|---|---|---|---|---|---|---|---|---|---|
| Anhui | 0.25 | 0.21 | 0.20 | 0.21 | 0.20 | 0.23 | 0.28 | 0.30 | 0.33 | 0.36 | 0.34 | 0.43 | 0.55 |
| Chongqing | 0.38 | 0.36 | 0.36 | 0.35 | 0.39 | 0.44 | 0.52 | 0.60 | 0.58 | 0.60 | 0.69 | 0.83 | 1.13 |
| Guizhou | 1.16 | 1.03 | 1.04 | 1.09 | 0.87 | 0.75 | 1.01 | 0.90 | 1.03 | 0.85 | 0.83 | 1.04 | 1.03 |
| Hubei | 0.26 | 0.26 | 0.24 | 0.26 | 0.26 | 0.28 | 0.33 | 0.40 | 0.49 | 0.52 | 0.54 | 0.80 | 1.02 |
| Hunan | 0.27 | 0.27 | 0.26 | 0.27 | 0.26 | 0.29 | 0.33 | 0.36 | 0.41 | 0.48 | 0.49 | 0.64 | 1.06 |
| Jiangsu | 0.23 | 0.30 | 0.35 | 0.41 | 0.42 | 0.50 | 0.60 | 0.64 | 0.67 | 0.70 | 0.71 | 0.81 | 1.12 |
| Jiangxi | 0.30 | 0.29 | 0.26 | 0.24 | 0.26 | 0.28 | 0.34 | 0.34 | 0.35 | 0.37 | 0.36 | 0.36 | 0.45 |
| Sichuan | 0.26 | 0.26 | 0.26 | 0.29 | 0.29 | 0.35 | 0.47 | 0.61 | 0.67 | 0.81 | 0.61 | 0.75 | 0.80 |
| Shanghai | 0.49 | 0.52 | 0.53 | 0.53 | 0.51 | 0.60 | 0.63 | 0.65 | 0.65 | 0.71 | 0.74 | 0.84 | 1.13 |
| Yunnan | 0.34 | 0.36 | 0.34 | 0.36 | 0.34 | 0.35 | 0.33 | 0.34 | 0.45 | 0.50 | 0.54 | 0.60 | 0.88 |
| Zhejiang | 0.33 | 0.35 | 0.41 | 0.49 | 0.51 | 0.59 | 1.02 | 0.75 | 0.72 | 0.74 | 0.77 | 0.91 | 1.05 |
| mean value | 0.39 | 0.38 | 0.39 | 0.41 | 0.39 | 0.42 | 0.53 | 0.54 | 0.58 | 0.60 | 0.60 | 0.73 | 0.93 |
| CV | 0.69 | 0.60 | 0.61 | 0.61 | 0.48 | 0.39 | 0.50 | 0.37 | 0.35 | 0.28 | 0.27 | 0.28 | 0.26 |
Table 2.
Tobit Model Estimation of Industrial Water Utilization Efficiency in the Yangtze River Economic Belt.
Table 2.
Tobit Model Estimation of Industrial Water Utilization Efficiency in the Yangtze River Economic Belt.
| Variable | Regression Coefficient | Standard Deviation | T Statistic | P Value | Regression Coefficient | Standard Deviation | Z Statistic | P Value |
|---|---|---|---|---|---|---|---|---|
| type | Tobit Regression of Mixed Panel | Tobit regression of Random Panel | ||||||
| Constant | −0.0487 | 0.2996 | −0.16 | 0.871 | 0.3211 | 0.2851 | 1.13 | 0.260 |
| Population Urbanization | −1.8904 | 0.6072 | −3.11 | 0.002 | −0.9267 | 0.5799 | −1.60 | 0.110 |
| Land Urbanization | −1.5912 | 1.1725 | −1.36 | 0.177 | −4.4141 | 1.6832 | −2.62 | 0.009 |
| Urban Primacy | −0.3210 | 0.1092 | −2.94 | 0.004 | −0.3174 | 0.1012 | −3.14 | 0.002 |
| Crossing Terms | 0.7143 | 0.2515 | 2.84 | 0.005 | 0.7447 | 0.1999 | 3.72 | 0.000 |
| Industrial Structure | 2.7282 | 0.3749 | 7.28 | 0.000 | 0.7715 | 0.3466 | 2.23 | 0.026 |
| Development Level | 0.00006 | 0.00001 | 5.32 | 0.000 | 0.00005 | 0.00001 | 3.58 | 0.000 |
| Technological Innovation | −0.0744 | 0.0227 | −3.28 | 0.001 | −0.0044 | 0.0242 | −0.18 | 0.854 |
| Environmental Regulation | 19.0467 | 13.1952 | 1.44 | 0.151 | 6.2209 | 7.6012 | 0.82 | 0.413 |
| Foreign Investment | 0.0528 | 0.0519 | 1.02 | 0.311 | 0.1857 | 0.1099 | 1.69 | 0.091 |
| /sigma | 0.1634 | 0.0112 | ||||||
| /sigma_u | 0.1775 | 0.0413 | 4.30 | 0.000 | ||||
| /sigma_e | 0.1047 | 0.0064 | 16.16 | 0.000 | ||||
| LR | 87.22 | 0.000 | ||||||
© 2019 by the authors. Licensee MDPI, Basel, Switzerland. This article is an open access article distributed under the terms and conditions of the Creative Commons Attribution (CC BY) license (http://creativecommons.org/licenses/by/4.0/).
Share and Cite
MDPI and ACS Style
Ding, X.; Fu, Z.; Jia, H. Study on Urbanization Level, Urban Primacy and Industrial Water Utilization Efficiency in the Yangtze River Economic Belt. Sustainability 2019, 11, 6571. https://0-doi-org.brum.beds.ac.uk/10.3390/su11236571
AMA Style
Ding X, Fu Z, Jia H. Study on Urbanization Level, Urban Primacy and Industrial Water Utilization Efficiency in the Yangtze River Economic Belt. Sustainability. 2019; 11(23):6571. https://0-doi-org.brum.beds.ac.uk/10.3390/su11236571
Chicago/Turabian StyleDing, Xuhui, Zhu Fu, and Hongwen Jia. 2019. "Study on Urbanization Level, Urban Primacy and Industrial Water Utilization Efficiency in the Yangtze River Economic Belt" Sustainability 11, no. 23: 6571. https://0-doi-org.brum.beds.ac.uk/10.3390/su11236571
Note that from the first issue of 2016, this journal uses article numbers instead of page numbers. See further details here.