Article

Evaluating the Effectiveness of Climate Change Adaptations in the World’s Largest Mangrove Ecosystem

by
Pramod K. Singh
1,*,
Konstantinos Papageorgiou
2,
Harpalsinh Chudasama
1 and
Elpiniki I. Papageorgiou
3
1
Institute of Rural Management Anand (IRMA), Anand 388001, India
2
Computer Science Department, University of Thessaly, 35100 Lamia, Greece
3
Faculty of Technology, University of Thessaly, 41500 Larisa, Greece
*
Author to whom correspondence should be addressed.
Sustainability 2019, 11(23), 6655; https://0-doi-org.brum.beds.ac.uk/10.3390/su11236655
Submission received: 22 September 2019 / Revised: 20 November 2019 / Accepted: 20 November 2019 / Published: 25 November 2019
(This article belongs to the Special Issue Green, Closed Loop, Circular Bio-Economy)

Abstract

:
The Sundarbans is the world’s largest coastal river delta and the largest uninterrupted mangrove ecosystem. A complex socio-ecological setting, coupled with disproportionately high climate-change exposure and severe ecological and social vulnerabilities, has turned it into a climate hotspot requiring well-designed adaptation interventions. We have used the fuzzy cognitive maps (FCM)-based approach to elicit and integrate stakeholders’ perceptions regarding current climate forcing, consequent impacts, and efficacy of the existing adaptation measures. We have also undertaken climate modelling to ascertain long-term future trends of climate forcing. FCM-based simulations reveal that while existing adaptation practices provide resilience to an extent, they are grossly inadequate in the context of providing future resilience. Even well-planned adaptations may not be entirely transformative in such a fragile ecosystem. It was through FCM-based simulations that we realised that a coastal river delta in a developing nation merits special attention for climate-resilient adaptation planning and execution. Measures that are likely to enhance adaptive capabilities of the local communities include those involving gender-responsive and adaptive governance, human resource capacity building, commitments of global communities for adaptation financing, education and awareness programmes, and embedding indigenous and local knowledge into decision making.

1. Introduction

The Sundarbans, the world’s largest coastal river delta and the largest uninterrupted mangrove forest, is critical biodiversity and climate hotspot [1]. It has a complex ecosystem studded with inter-tidal and estuarine zones stretching for about 10,000 km2 and is located on the borders of the state of West Bengal in India (~40%) and southern Bangladesh (~60%) where the Ganges, Brahmaputra, and Meghna rivers meet the Bay of Bengal. Coastal river deltas are often naturally low-lying areas close to the local mean sea-level. Changes in regional sea-levels affect coastal river delta systems geomorphologically by altering the base level, coastal erosion, and inundation, not to mention inland propagation of tidal and backwater effects [2,3]. The geomorphological response of a coastal river delta system to sea-level rise is determined by the delta system’s capacity to adapt. The system is complex owing to the variety of feedbacks and changes in internal and external boundary conditions, including sediment supply, river discharge, ecological system feedbacks, subsidence, and human intervention; it is also mainly associated with hydrodynamic and ecological responses [2,4]. It influences system functioning and determines the ability to either adapt dynamically, mitigate the effects of regional sea-level, or submerge [5,6]. In the coming decades, the effects of human intervention, causing further subsidence, changes in sediment supply, river discharge, and ecosystems will be dominant in determining the impacts of sea-level change in coastal river deltas [5,6].
The coastal regions of the Bay of Bengal, especially the Sundarbans delta, are among the most vulnerable areas of the world in terms of experiencing the rapid sea-level rise, seawater intrusion, and other climate change impacts [7,8]. The Sundarbans landscape is highly fragile and particularly vulnerable to global and regional climate change impacts because of its complex geomorphology and environmental settings attributable to continuing global warming, rising sea-levels, seawater intrusion, land erosion, gradual subsidence, and cyclones [1,9,10]. The Sundarbans’ mangroves, which protect more than 10 million people from cyclonic storms, today stand threatened by cyclonic damage. Cyclones and tidal storm surges cause damage to the floral and faunal biodiversity along the sea-land interface [1].
The sea-level has risen approximately three to four times higher than the global mean between 1993 and 2009 in the tropical western Pacific and the Indian Ocean [11]. The coastal region in the southwest of Bangladesh has undergone a relative sea-level rise varying from 2.8 to 8.8 mm per year in the last few decades. In South Asia, the sea-level in the Ganges-Brahmaputra-Meghna delta of Bangladesh is likely to rise by 0.63 to 0.88 m by 2090 [12]. Frequent cyclones, together with increasing sea-levels, have resulted in flooding, coastal erosion, and recession of coastline in the region [13].
Coastal flooding is driven by multiple factors, including local land elevation, regional sea-level rise, heavy precipitation, tidal waves, storm surges, and tropical cyclones [14,15,16,17,18]. All these factors are likely to adversely affect the lives and livelihoods of the local community.
The remaining part of the paper describes the study area and sampling; it discusses the methodology adopted for climate change modelling, construction of fuzzy cognitive maps, and fuzzy cognitive map-based simulations. After this, we present the results of climate change projections. We describe the climate change impacts and adaptations as perceived by the community before presenting the results of fuzzy cognitive maps (FCM)-based simulations. Finally, we discuss the results in detail, drawing appropriate conclusions. The paper ends with guidance for future research.

Study Area and Sampling

The Indian Sundarbans, comprising 54 islands, is home to about 4.5 million people [19]. An analysis of the SRTM data reveals that these islands are naturally flat, mostly comprising moderately elevated areas (0 to 5 m high from the mean sea-level), with few low-lying and elevated regions (0 m and 5 to 10 m respectively).
Agriculture and fishing are the two major livelihood options available to the communities living in this region. However, both sectors have been facing stress due to seawater intrusion, coastal erosion, and the increasing salinity in agricultural fields and river water. All of this has been causing a sizeable male population to emigrate from the villages. Phenomena like global and regional climatic changes coupled with anthropogenic pressures including poaching, human encroachment for agriculture and fishing, and overexploitation of both timber and non-timber forest produce have led to multiple alterations in the mangrove flora, fauna, and ecosystem dynamics and functions posing, as a consequence, severe threats to the Sundarbans’ ecosystem [9]. They also introduce many changes in the ecosystem services vital for human health, wellbeing, and livelihoods [1,9,20].
This perception mapping study engaged 46 community groups (male and female groups constituted 35 and 11 respectively) from seven villages in Sagar and Mousini islands of the South 24 Paraganas district of Sunderbans.

2. Methodology

2.1. Climate Change Modelling

We implemented climate modelling in a GIS environment for reference as well as projected climates. Available monthly climate data were read and converted to variables required for subsequent calculations. We used time-series data from the Climate Research Unit (CRU) at the University of East Anglia, the Global Precipitation Climatology Centre (GPCC), and the EU WATCH Integrated Project. We obtained the CRU TS v3.21 (time-series) datasets from the British Atmospheric Data Centre (BADC), highlighting month-by-month climatic variations over the last century covering the period from January 1901 to December 2012. CRU TS v3.21 data were calculated on 0.25 × 0.25 degree grids. We downloaded the GPCC v6 full re-analysis data product and concluded the spatial interpolation to 5 arc-minutes resolution for the period 1981–2010. We obtained the daily data at 0.5-degree resolution from the WATCH Integrated Project data repository; we compiled within-month precipitation distribution and computed the deviation of daily temperatures from respective monthly means for each month for the period 1981–2010.
We used the results of the IPCC’s AR5 climate model for two representative concentration pathways (RCPs: 2.6 and 8.5) to characterise a range of possible future climate distortions for the periods 2041‒2070 (2050s) and 2071‒2100 (2080s). The RCPs were developed and documented in a special issue of climate change [21]. We implemented climate model simulations based on RCPs as part of the Coupled Model Inter-comparison Project Phase 5 (CMIP5) [22] and extracted monthly mean temperature and precipitation data from the WorldClim 30 arc-second raster databases [23]. We analysed the multi-model ensembles for two climate forcing levels of the RCPs based on spatial data from the IPCC’s AR5 CMIP5 process and corrected data bias, downscaling it 0.25-degree as in the Inter-sectoral Impact Model Inter-comparison Project (ISI-MIP) [24]. In order to calculate the ensemble mean, we used the ISI-MIP data at 0.25-degree resolution of five climate models (GFDLESM2M, HadGEM2-ES, IPSL-CM5A-LR, MIROC-ESM-CHEM, and NorESM1-M).

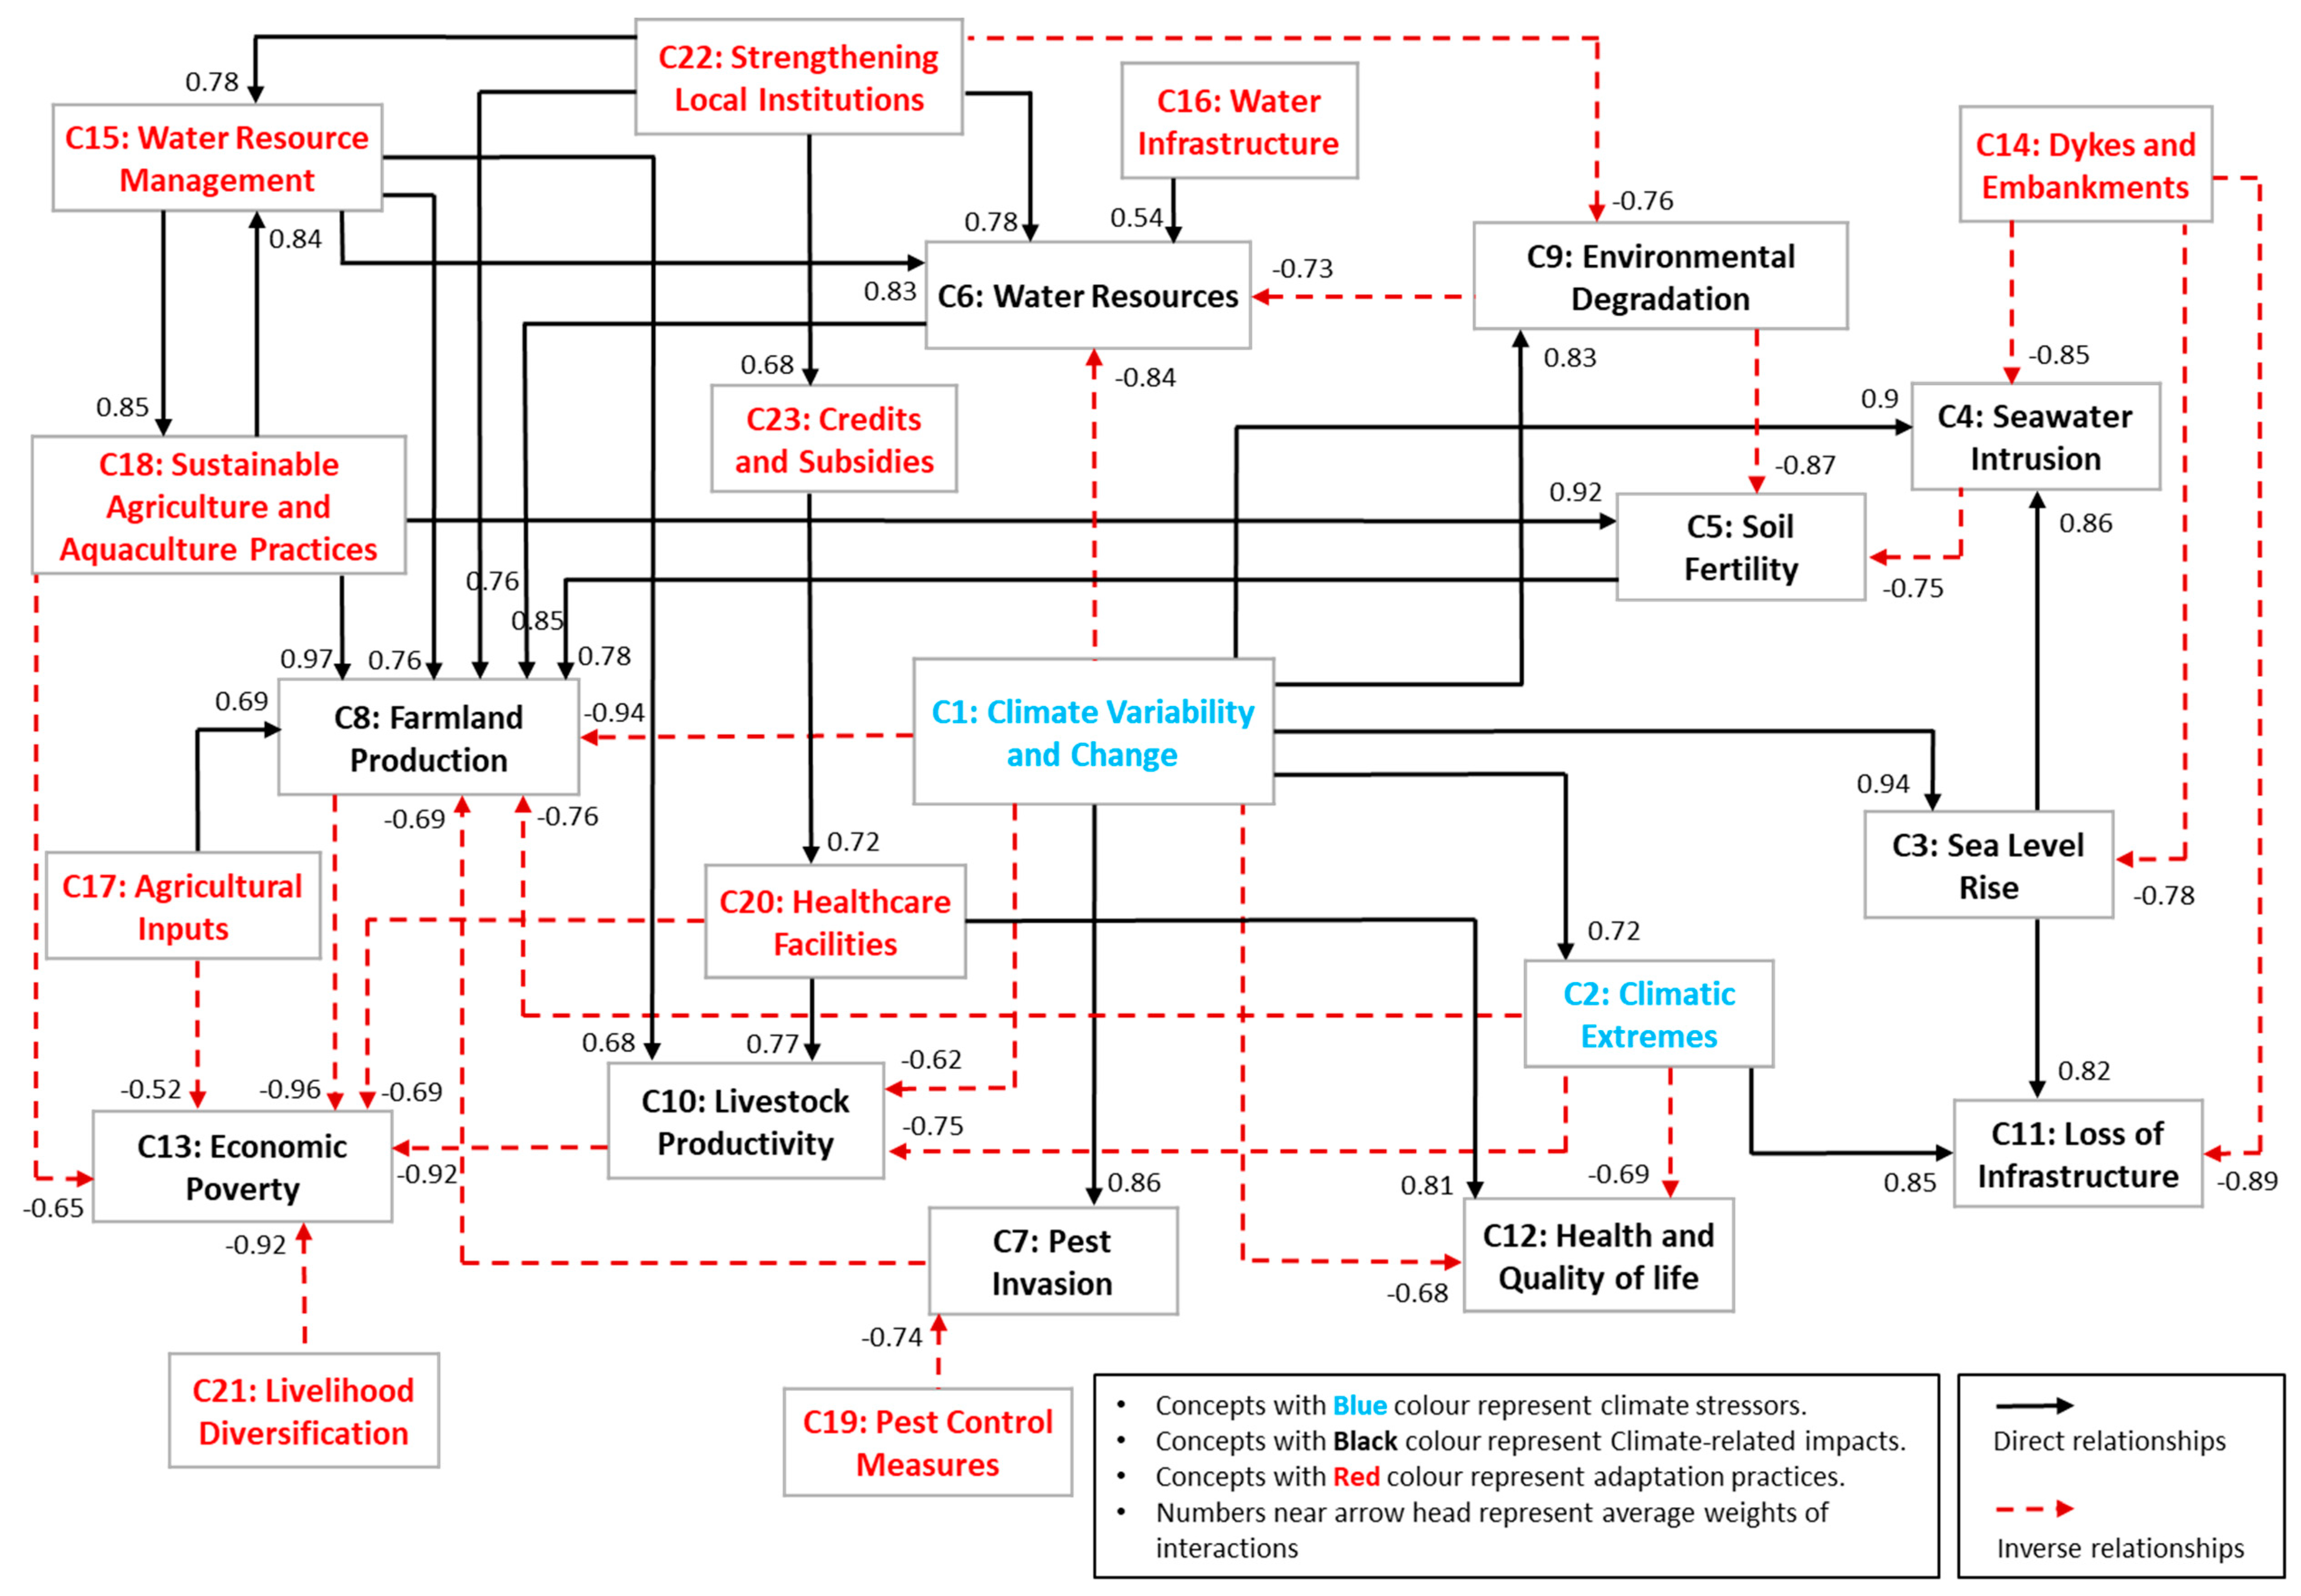
2.2. Fuzzy Cognitive Mapping

We conducted the perception mapping study aided by the fuzzy cognitive maps-based approach introduced by Kosko in 1986 [25] to document communities’ perceptions about the direct and indirect impacts of climate variability and change on different livelihood assets. The FCM approach captures the functioning of a complex system based on people’s perceptions [26]. The process of data capture in the FCM approach is considered quasi-quantitative because the quantification of concepts and links can be interpreted in relative terms [27,28,29]. In order to generate data, the participants debated the cause-effect relations between the qualitative concepts and generated quantitative data based on their experiences, knowledge, and perceptions of inter-relationships between the concepts [26,27,28,30,31].

2.2.1. Main Aspects of Fuzzy Cognitive Maps

FCMs are graph-based structures, describing signed weighted digraphs [25]. They can handle vagueness while being capable of incorporating and adapting human knowledge through fuzzy logic. They form a component of soft computing providing, thereby, a simple but powerful tool for analysing, representing, and simulating dynamic systems [32].
The structure of FCMs consists of concepts (i.e., nodes) C1, C2… Ci, and connections between them. All this is represented by the adjacency matrix W [ ]. The concepts are mapped to the real-valued activation level where Ci takes values in the interval [0,1], which is the degree to which the observation belongs to the concept (i.e., the value of the fuzzy membership function). As a consequence of the dynamic interactions of connected nodes, the concept’s state changes over time. The reasoning is performed as the calculation of Equation (1), where f ( ) stands for a hyperbolic transformation function Equation (2), ensuring that the concept defined value falls within the interval [0,1] and f ( ) is given by Equation (2), where C—parameter, C > 0.
C i ( t + 1 ) = f ( C i ( t ) + j = 1 i j n C j ( t ) × W j i )
f ( x ) = e λ x e λ x e λ x + e λ x ,   a R +
The edges Wij displayed in the dimensions of the matrices denote the degrees of the causal relationship (i.e., the weight of the edge or influences between the connected nodes) and typically lie between [−1, 1]; whereas Wij > 0 implies that Ci increases Cj, Wij = 0 means no relation and Wij < 0 means Ci decreases Cj. Therefore, the adjacency matrices are not symmetric as per definition. The diagonal entries (e.g., Wii, Wjj) in W reflect the effect on it. With increasing uncertainty, fuzzy rules, or fuzzy numbers may be used to describe the weights of the connections [25,32].

2.2.2. Constructing Fuzzy Cognitive Maps

Step 1: Obtaining fuzzy cognitive maps from community groups
The majority of marginal and poor people across the globe rely on climate-sensitive livelihood activities that are highly susceptible to increase in temperature and variability in precipitation patterns, along with extreme climatic events, such as cyclones, floods, droughts, etc., making them highly vulnerable to climate change [33]. Hence, in order to obtain fuzzy cognitive maps, we selected marginal farmers possessing less than two acres of land and some livestock as our stakeholders. The steps of constructing fuzzy cognitive maps from stakeholders/farmers are given in Section 2.2.2.
A consensus of the local community was obtained with regard to the summer and winter temperatures, as well as precipitation variability increase over the last 10 to 15 years. We also sought community opinion in the context of increasing intensity and frequency of climatic extremes. The communities perceived an overall increase in temperatures and precipitation variability. The communities also perceived an increase in climate-related extremes, including cyclonic storms and floods. We divided the local community members, after the group discussion, into groups of four to five individuals. We formed the groups according to simple wealth-ranking allocating individuals with the same landholdings/ number of livestock within a single group while conducting gender-wise segregation. This helped in neutralising power dynamics within each group. We demonstrated the construction of fuzzy cognitive maps to the participants with the help of a disparate context. We asked the following questions from each of the 46 community groups:
  • What are the changes in summer and winter temperature observed over the past 10 to 15 years?
  • What are the changes in rainfall variability observed over the past 10 to 15 years?
  • What are the changes in extreme climatic events (cyclone, flood, etc.) observed over the past 10 to 15 years?
  • What are the resulting impacts arising from direct effects due to climate variability, sea-level rise, and changes and climatic extremes?
  • How have your lives and livelihoods been affected due to these changes?
  • What adaptation practices have been taken up for enhancing climate resilience?
The participants designed cognitive maps relevant to the central concept: Increased climate variability and change. They laid out concepts pertinent to the central concept, showing impacts of climate variability and change on their lives and livelihoods and adaptation practices adopted; they also assigned cause–effect interconnections between the concepts. Stakeholders assigned individual weights to each connection on a scale of 1–10, with 1 representing the minimum impact and 10 the maximum. Researchers scaled down these weights to a scale of 0.1–1, with 0.1 representing the minimum impact and 1 the maximum [26,27,30].
Step 2: Coding of individual cognitive maps into adjacency matrices
We coded individual cognitive maps into adjacency matrices listing the same concepts on the vertical and horizontal axes. Weights assigned by the stakeholders were coded into the adjacency matrix. A value is coded into the matrix if a connection exists between two concepts [26,27,28,34].
Step 3: Quantitative aggregation of individual cognitive maps
We aggregated each coded map to construct a social cognitive map (SCM) through matrix addition [26,27,28,30]. Thus, the SCM we obtained represents the perception of all the 46 community groups. SCM gives a better representation of system dynamics yielding a more accurate, reliable, and comprehensive understanding of a system [26,27,30].
Step 4: Qualitative aggregation of the social cognitive map
In order to organise the data and make it easier to understand, we condensed the concepts obtained from the SCM into broader categories based on their nature [26,27,30]. We followed it up with calculations for an arithmetic mean of the weights of concepts mentioned in the SCM. We did this to identify interconnections between the broader encompassing concepts [26,28,30,35]. The qualitatively aggregated SCM comprises 23 concepts.

2.3. FCM-Based Simulations

The adaptation strategies that are likely to reduce climate risks and increase resilience adequately may be classified as effective adaptations. What cannot be ruled out is the possibility of an adaptation deficit (‘a failure to adapt adequately to existing climate risks’ [36]). Having implemented all adaptations in the area, climate risk possibilities can arise, presenting limits to adaptation. Therefore, it is crucial to understand the effectiveness of adaptation strategies.
In order to evaluate the effectiveness of current adaptation interventions, we conducted FCM-based simulations with the help of the aggregated SCM. Simulating the FCM model gives a deeper understanding of the concepts’ behaviour, their relations, and the extent to which one concept has an impact on the rest. The simulation process was conducted by ‘clamping/activating’ the initial values of the key concepts (in Equation (1)) until the system reached a stabilisation point (known as the system steady-state). We developed a baseline by ‘clamping/activating’ the initial values of concepts C1—‘climate variability and change’ and C2—‘climatic extremes’ at |1|. This was done by taking into consideration the climate change projections in the region.
In FCMs, each concept varies from 0 to |1| where 0 means ‘non-activated’ and |1| means ‘activated’. When one or more concepts are ‘clamped/activated,’ the activation spreads through the matrix following the weighted relationships in the FCM matrix. An iteration produces a new state vector with ‘activated’ concepts and ‘non-activated’ concepts [31,37]. The resulting concept values are used to interpret the outcomes of a particular scenario [27,28,31,37]. We multiplied the input vector concepts (Table 1) with the adjacency matrix and applied a squashing function (Equation (2)) after every multiplication as a threshold function. We iterated the process until the system (output vector) reached a steady-state. The FCMWizard tool ran the simulations. The FCMWizard can also perform simulations for different possible scenarios, in various scientific domains, using a very intuitive graphical user interface [38].
The first established approach in scenario planning is the selection of key concepts. Filtering the key concepts helps in linking storylines to the quantitative model while focusing on significant concepts that often have strong direct or indirect effects on the goal. It can, at the same time, significantly change the balance of the whole system. While conducting the FCM-based scenario analysis, recognition of crucial concepts mainly relies upon communities’ perceptions, although some characteristics were elicited from the model facilitates the procedure. We identified four key adaptation strategies in the study area for assessing their effectiveness (Table 1). These concepts were selected as they were among the concepts with the highest centrality (see Table S1(a)) and could well influence the dynamics of the system.
Scenario 1 is devoted to increasing the concept of ‘dykes and embankments’, by ‘clamping’ it to one. We adopted the same procedure for the following three key concepts: ‘water resource management’, ‘sustainable agriculture and aquaculture practices’, and ‘strengthening local institutions’ where Scenario 2, Scenario 3, and Scenario 4 referred to the increase in the above corresponding concepts (‘clamped’ to one). We developed the fifth scenario by combining all the four key concepts/adaptation strategies used in the previous scenarios. We also conducted a sensitivity analysis to ascertain the stability of the system.

3. Results

3.1. Projections of Climate Change in the Study Area

Climate vulnerability refers to a system’s susceptibility to change as a consequence of variation in climatic parameters. We assessed climate vulnerability, with the help of climate modelling, for key climatic parameters including temperature, precipitation, and accumulated precipitation on consecutive rainy days in the study area (Table 2).
Projections for the 2050s (2041–2070) and the 2080s (2071–2100) with regard to RCPs 2.6 and 8.5 show a rise from the reference climate (1981–2010) in terms of annual mean temperature, annual mean precipitation, and accumulated precipitation on consecutive rainy days in the region. According to the results, there is a definite rise in temperature. The projected increase is 1.1 to 2.4 °C in the 2050s and 1.1 to 4.0 °C in the 2080s as relevant to the RCPs 2.6 and 8.5, in that order. The quantum of precipitation evinces a rise as well. The projected increase is 88 to 128 mm in the 2050s and 128 to 168 mm in the 2080s pertinent to the RCPs 2.6 and 8.5, in that order. There is a rise in accumulated precipitation on consecutive rainy days exceeding 30 mm. The projected increase is 210 to 257 mm in the 2050s and 254 to 258 mm in the 2080s relevant to the RCPs 2.6 and 8.5, in that order. Continuous precipitation on consecutive rainy days exceeding 30 mm is considered a heavy precipitation incident and is likely to cause flooding.

3.2. Climate-Related Impacts as Perceived by the Communities

Community observations relevant to climate change mirror historical trends and projections regarding climate change in the context of climatic parameters mentioned in the previous section. The communities perceived that manifestations of climate variability and change, along with extreme climatic events, have impacted land and water resources, fisheries, agriculture and fodder, forests, human health, and livestock productivity. All this has caused an inexorable decline in the livelihoods and financial reserves of the communities. The groundwater level has plummeted in the region owing to the increased precipitation variability. It has reduced the productivity of agriculture and horticulture crops predominantly. The resultant seawater intrusion has degraded the quality of several freshwater bodies adversely impacting their aquaculture. Rising sea-levels, not to mention cyclones and storm surges, are responsible for saline water ingress causing underground freshwater aquifers and surface water reserves to pollute. Seawater intrusion has also led to soil salinity. Seawater intrusion, coupled with rising temperatures and consequent higher evaporation rates, causes increased salt concentration in surface water bodies. Seawater intrusion is a prominent issue in the region as it primarily impacts agriculture and fish production. It has forced many families to flee from places where they have been old residents. Degrading water quality has adversely affected the productivity of aquaculture, pisciculture, agriculture, and horticulture, all of which are critical to community livelihood. The communities affirm a greater extent of the negative impact on fisheries and agriculture stimulated by rising temperatures, precipitation variability, and climatic extremes. These variabilities and changes in climate have caused pest invasion incidences to rise, leading to considerable loss of agricultural produce. Rising temperatures have led to increasing occurrences of disease within the fish population, depressing fish production thereby. Increasing temperatures, precipitation variability, and increasing water and soil salinity are also responsible for lowering fodder availability, which in turn, has diminished livestock health and productivity. The communities also perceived declining water quality as being responsible for the diminished availability of drinking water, leading to sanitation-related problems causing the deterioration of human health. The proliferation of mosquitoes, owing to increased temperatures, has fomented malarial outbreak in the region. Owing to rising temperatures, rainfall variability, and anthropogenic interference, mangrove forests have degraded, ruining the fragile ecosystem of the Sundarbans and its unique biodiversity. This ultimately causes soil erosion, loss of infrastructure, and overall environmental degradation. Impacts on agriculture, fishery, and livestock production act as significant contributors to declining incomes and increasing the economic poverty of the communities. This not only affects the quality of life of the stakeholders but also decreases opportunities for education for their children.

3.3. Climate Change Adaptations in the Area

The community also informed about several adaptation practices implemented in the study area in order to curtail the impacts of climate change. WWF-India implements the Climate Adaptation Programme. The state government has facilitated the construction of earthen embankments and dykes along the coasts in order to check seawater intrusion. These embankments have been built to reduce the impact of tidal surges while reducing soil erosion to some extent. Several sections along embankments and dykes have been stabilised by mangrove plantations in order to check seawater intrusion, soil erosion, loss of critical infrastructure, and reduce environmental degradation. The state government has also facilitated the digging of hand pumps and tube wells to ensure freshwater access. Furthermore, healthcare facilities are being provided and vaccination drives conducted in order to improve human and livestock health. The Sundarbans Development Board, in partnership with the state government, has initiated several afforestation measures in order to restore the green cover of the region and to conserve the fragile ecosystem of the Sundarbans. The Greening India Programme―implemented by the Tagore Society for Rural Development (TSRD)―engages local communities for mangrove plantation drives through social forestry in a bid to protect the islands from natural calamities. Alongside afforestation activities, TSRD has also implemented a Disaster Management Programme. TSRD has taken the initiative to spread awareness about the importance of maintaining the soil’s natural fertility by promoting organic fertilisers and vermicompost. TSRD has been imparting training to communities regarding alternative livelihood options including handicrafts, poultry, duckery, and goatery.
Adaptation measures involving intensifying sustainable agriculture and aquaculture practices such as crop diversification, the introduction of salt-tolerant crops, and traditional techniques of agriculture and fishery are meant to improve soil fertility and production from agriculture and fisheries. Pest control measures have been undertaken to combat pest invasion while increasing agricultural production in the long term. Diversification of livelihoods is another coping strategy adopted by communities. Since traditional natural resource-based livelihoods are unable to sustain the existing population in the Sundarbans of late, many community members are engaged with the tourism sector providing various services to tourists.
The communities acknowledged that earthen embankments and dykes along with mangrove plantations had reduced seawater intrusion, soil erosion, loss of critical infrastructure, and environmental degradation to a certain extent. Planting fruit-bearing and medicinal trees along the coastline have also helped increase the incomes of some households. Such measures have reduced soil erosion and helped improve water and land resources; it has also increased agriculture and fish production and, consequently, fodder availability. Better management of water resources in the form of rainwater harvesting, pond construction, and farm bunding has also helped to increase the availability of freshwater and productivity of agriculture and fisheries while hand pumps and tube wells have helped to reduce the drudgery of women. A combination of improved agricultural inputs with the introduction of climate-resilient agricultural and piscicultural practices coupled with the re-introduction of indigenous salt-tolerant rice varieties and fish species have helped communities diversify their livelihoods while coping with increased water and soil salinity. However, the communities perceived that these adaptation practices were relatively meagre in relation to curbing the current risks involved in climate change. They also believed, notwithstanding the current adaptation practices, the risk from future impacts of climate change cannot be denied. They expressed a requirement for more concerted efforts towards developing climate resilience.
Figure 1 illustrates the condensed social cognitive map showing the perception of communities regarding climate-related impacts and adaptations.

3.4. FCM-Based Simulations

The baseline simulates a situation through the existing FCM model in which both ‘climate variability and change’ and ‘climatic extremes’ are activated. It illustrates an increase in sea-level rise, seawater intrusion, pest invasion, environmental degradation, loss of infrastructure, and economic poverty. It also suggests a reduction in soil fertility, water resources, agriculture, livestock productivity, and the health and quality of life (Table 3).
After having conducted simulations of all the different scenarios (scenarios 1 to 5, as discussed in Section 2.3), we tabulated the outcome and compared the deviation of each concept against the steady-state of the baseline, as shown in Table 3. Exploring the dynamic change of concepts’ values between the baseline steady-state and scenario outcomes enabled a quantitative interpretation of the impact of the key concepts on the system.
The first scenario highlights the effects of ‘dykes and embankments’. This scenario does not give relief from sea-level rise while the loss of infrastructure, seawater intrusion, pest invasion, environmental degradation, and economic poverty continue to increase. The second scenario highlights the effects of ‘water resource management’. This scenario does not show much deviation from the baseline; it illustrates a substantial increase in sea-level rise, seawater intrusion, pest invasion, environmental degradation, loss of infrastructure, and economic poverty. It also shows a considerable decrease in soil fertility, water resources, agriculture productivity, livestock productivity, and the health and quality of life. The third scenario highlights the effects of ‘sustainable agriculture and aquaculture practices’. This scenario also does not show much deviation from the baseline. What it indicates is an increase in sea-level rise, seawater intrusion, pest invasion, environmental degradation, and loss of infrastructure. It also displays a decrease in water resources, health, and quality of life and, consequently, an increase in economic poverty. The fourth scenario highlights the effects of ‘strengthening local institutions’. This scenario is unlikely to decrease sea-level rise, seawater intrusion, pest invasion, environmental degradation, and loss of infrastructure. However, water resources, agriculture productivity, and livestock productivity are likely to increase, leading to reduced economic poverty. This scenario also shows an increase in water resource management, sustainable agriculture and aquaculture practices, healthcare facilities, and credits and subsidies because a vibrant local institution is likely to implement interventions in all these areas.
All the concepts deployed for the previous scenarios have been clamped together in the fifth scenario. This integrative scenario displays a marginal reduction in climate change impacts compared to the baseline. However, seawater intrusion, pest invasion, environmental degradation, and economic poverty show a continuous rise. On the other hand, water resources, agriculture production, and livestock productivity show an increase leading to a decrease in the economic poverty. This scenario also indicates an increase in water resource management, sustainable agriculture and aquaculture practices, healthcare facilities, and credits and subsidies (see Table 3 and Figure S1).
Overall, the results of the FCM-based scenario analysis illustrate that the possibilities of climate risk in the region cannot be ruled out in the future even after having implemented all the adaptations. This signifies limits to the ongoing adaptations, meaning the existing adaptations in the area are inadequate in the context of providing resilience to the community against climate stressors.

4. Discussions

Communities, especially those living in climatically vulnerable regions (such as the Sundarbans) and dependent on climate-sensitive livelihoods, are not only more vulnerable to climate change impacts but also less able to pursue adaptation measures [39]. Adaptation to climate change is often described as a local issue, with specific attention given to context-specific features and factors enabling or constraining adaptations. [40]. Increased climate variability, climatic extremes, rising sea-levels, and coastal flooding can impact natural, human, and financial assets in a coastal river delta like Sundarbans owing to deteriorating water and soil quality attributable to increased seawater intrusion. All of this depresses production pertinent to agriculture, fishery, and livestock while augmenting environmental degradation, worsening human health, and economic poverty in the area. According to the study, the chief climate change adaptation measures in the region are climate change adaptation programme, greening India programme, building dykes and embankments, and the introduction of climate-resilient agriculture and pisciculture. These adaptation measures, to some extent, help reduce seawater intrusion and soil erosion, improve water quality and soil fertility, prevent environmental degradation while increasing the productivity of agriculture, fishery, and livestock in the current climatic conditions. However, the FCM-based scenarios show adverse impacts of climate change in the future in the context of several parameters, including sea-level rise, seawater intrusion, soil fertility, environmental degradation, pest invasion, and loss of infrastructure. The current adaptation interventions in the region are inadequate in terms of reducing ecological and social vulnerabilities and enhancing resilience.
Adaptation interventions, whether planned or autonomous, are not isolated responses and actions. Instead, they are contextual and are known to be influenced by the rate of climate change along with economic, demographic, environmental, social, and technological factors. The lack of knowledge, and level of financial, human, and social capital also limit capabilities of communities for adaptation. The opportunities and constraints regarding adaptations are determined in the contexts of the region, community, or household; which means that they vary across geographies, sectors, communities, and species [41]. Our simulation results reveal the likelihood of limits to adaptations in the region. The adaptation limits are classified as: (a) Hard limits where no adaptation is possible and (b) soft limits where adaption options are currently unavailable [41]. The Intergovernmental Panel on Climate Change [8] refers to adaptation limits as obstacles that tend to be absolute in the real sense while setting up thresholds beyond which adaptation activities cannot be maintained or modified. In some studies [42,43], the hard limits have been referred to as limits to adaptation. Soft adaptation limits, on the other hand, are referred to as adaptation barriers—obstacles that may be overcome through concerted efforts, creative management, prioritisation, and related shifts in resources, institutions, and so on. [43]. Significant barriers to adaptations could include: bio-physical―climate variability and change; socio-economic―lack of climate change awareness among decision-makers; political―asymmetrical governance structures; and other cross-cutting barriers, which carry the potential of evolving into hard limits to adaptations [44,45,46,47].
The act of implementing adaptations is riddled with barriers including dated and locally extraneous information along with the paucity of financial resources, appropriate technology, and traditional knowledge pertinent to adaptation strategies, not to mention institutional constraints. Major bio-physical obstacles in the Sundarbans include climate variability and change, leading to rising sea-levels, coastal flooding, and depleting water quality and quantity. The socio-economic barriers in the region include several social, cultural, cognitive, behavioural, economic, and political impediments that influence actions and choices related to adaptations. These include: (a) Inadequate community awareness regarding manifestations of climate change; (b) lack of information, knowledge, infrastructure, and technology to battle with the impacts of climate variability and change; (c) lack of sufficient financial capital; and (d) other hidden social, economic, and political norms that indirectly control adoption and non-adoption of climate change adaptations and translate into the marginalisation of communities. These barriers to climate change adaptations not only shape the current and future climatic vulnerability in the region, but also the implementation and effectiveness of adaptations. Therefore, it is important to overcome these barriers in order to ensure the successful and effective implementation of adaptations. Researchers argue that many limits and barriers, especially social ones, can be overcome with sufficient financial resources, social efforts and support, and political will [48]. Gender-responsive and inclusive leadership, strategic and creative thinking, handholding support, resourcefulness, a collaboration between various players, and effective communication will be required for overcoming these barriers. However, merely overcoming barriers is not as straightforward as building adaptive capacity and does not necessarily ensure a successful adaptation intervention [43]. The need of the hour, hence, is the adoption of community-based adaptation (CBA) and ecosystem-based adaptation (EbA) supporting greater prioritisation of adaptation requirements at the local level while bringing co-benefits to the ecosystems and communities [40,49].

5. Conclusions and Research Directions

This paper sheds light on the diverse impacts of climate variability and change with regard to the Sundarbans ecosystem besides the lives and livelihoods of resident communities. Increased risks attributable to climatic variability and change, in addition to a rapidly growing population in the region, exert pressure on the Sundarbans ecosystem, making it extremely vulnerable to climate-related impacts. According to our findings, the current adaptations in the study area do not emerge as effective strategies against climate change. This calls for immediate action regarding implementing area-specific robust adaptation interventions. After all, adaptation is not just about choosing between technical options; it is also about ‘social and political change’ [50]. Some of the relatively effective adaptations in the context of river deltas are: Climate-resilient lifestyle and employment, climate-resilient farming systems, and better planning of housing and other infrastructure. Mainstreaming climate change adaptation requires targeted strategies and actions that are beyond mere aspirations in order to be effective while overcoming current and potential adaptation barriers [51].
Innumerable scholars have grappled with the concept of maladaptation [52,53,54,55], yet no clear metric has emerged that can identify the threshold between potentially successful adaptation and maladaptation. A holistic approach with a full range of CBA and EbA interventions is likely to enhance resilience against climate variability and change in order to protect the fragile Sundarbans ecosystem. These include profound systemic change requiring the reconfiguration of social and ecological systems [56]. While designing and implementing the CBA and EbA interventions, the role of indigenous and local knowledge cannot be overlooked. Therefore, the success of CBA and EbA relies on gaining a good understanding of the socio-cultural and socio-political context within which the communities operate on the ground. This includes gender, caste, land ownerships and tenure arrangements, local governance, decision-making processes, etc. [47,49,57,58]. Such adaptations are likely to support needs at the local level while bringing co-benefits to the ecosystems and communities [40,49]. Globally, small islands have been focusing increasingly on CBA that seeks to enable community-level ownership of adaptations. They are also looking to EbA approaches that benefit the ecosystems as well as communities [49,59]. Ample evidence is available with regard to the implementation of both CBA and EbA approaches across the small islands. However, one must still work to find robust ways of quantifying their benefits [60].
Transformative adaptation, which describes the need for changes in major systems in order to deal with impacts related to climate change, is usually contrasted with incremental adaptation. This refers to small adjustments made for climate-proofing. However, there is no clear metric available for planning a transformative adaptation. Climate-resilient lifestyle and employment, climate-resilient farming systems, and superior planning of housing and other infrastructure are likely to overcome several barriers while being transformative. However, some of these transformative adaptations may necessitate behavioural change on the part of communities. The Sundarbans needs more than just physical infrastructure for long-term sustainability. It requires a holistic development plan that includes ecosystem management in terms of land management and sustainability of the natural resource base along with community development in terms of creating awareness, capacity building, livelihood enhancement, adaptive governance, and disaster preparedness and management in order to mainstream climate change adaptations.
While CBA and EbA have gained significant traction lately, they too require more in-depth research in the context of coastal river deltas. The importance of locating local and timely adaptation strategies and development goals independently or through mutual co-benefits cannot be undermined. The situation merits an urgency regarding introducing synergy between the natural and social sciences while involving the latter more intensively in climate change adaptation research and application while mainstreaming adaptation interventions into development policies. It is vital to keep innovating and refining climate-related economic studies in order to support areas such as loss and damage along with adaptation costs.
Of late, international research and implementation policies have been focusing on climate change mitigation, adaptations, and development on a global basis to a greater extent. Attention to local problems and development potential have been somewhat overshadowed. Further research is needed to assess the restorative and productive abilities of the fragile ecosystems under changing climatic conditions. Scholars also need to conduct new scientific research with regard to both the effectiveness of adaptations, transformative adaptation, adaptation deficit, and limit to adaptation. This necessitates immediate and adequate financial commitment from global communities in the context of climate change adaptation research and implementation. Such efforts could help maintain climate change adaptations pertinent to the policy agenda while increasing political stakes [51]. Research also needs to be more thorough in terms of identifying the amount of funding required to implement an effective adaptation activity.

Supplementary Materials

The following are available online at https://0-www-mdpi-com.brum.beds.ac.uk/2071-1050/11/23/6655/s1, Table S1(a): Network statistics of the FCM model; Table S1(b): Structural analysis of the FCM model; Figure S1: Results of various FCM-based simulations.

Author Contributions

All authors contributed equally to this paper.

Funding

This research was funded by the Department of Science and Technology, Government of India.

Acknowledgments

We thank the Department of Science and Technology, Government of India, for providing financial support for the study. We thank Indrani Talukdar for language editing. We acknowledge the community members for participating in the research. We sincerely thank the two anonymous reviewers for raising pertinent questions and providing constructive suggestions.

Conflicts of Interest

The authors declare no conflict of interest.

References

  1. Hossain, M.S.; Dearing, J.A.; Rahman, M.M.; Salehin, M. Recent changes in ecosystem services and human well-being in the Bangladesh coastal zone. Reg. Environ. Chang. 2016, 16, 429–443. [Google Scholar] [CrossRef]
  2. Phillips, J.D. Environmental gradients and complexity in coastal landscape response to sea-level rise. Catena 2018, 169, 107–118. [Google Scholar] [CrossRef]
  3. IPCC. Climate Change 2013: The Physical Science Basis. Contribution of Working Group I to the Fifth Assessment Report of the Intergovernmental Panel on Climate Change; Stocker, T.F., Qin, D., Plattner, G.K., Tignor, M., Allen, S.K., Boschung, J., Nauels, A., Xia, Y., Bex, V., Midgley, P.M., Eds.; Cambridge University Press: Cambridge, UK; New York, NY, USA, 2013; p. 1535. [Google Scholar]
  4. Temmerman, S.; Kirwan, M.L. Building land with a rising sea. Science 2015, 349, 588–589. [Google Scholar] [CrossRef]
  5. Van De Lageweg, W.I.; Slangen, A.B.A. Predicting Dynamic Coastal Delta Change in Response to Sea-Level Rise. J. Mar. Sci. Eng. 2017, 5, 24. [Google Scholar] [CrossRef]
  6. Lentz, E.E.; Thieler, E.R.; Plant, N.G.; Stippa, S.R.; Horton, R.M.; Gesch, D.B. Evaluation of dynamic coastal response to sea-level rise modifies inundation likelihood. Nat. Clim. Chang. 2016, 6, 696–700. [Google Scholar] [CrossRef]
  7. IPCC. Climate Change 2014: Impacts, Adaptation, and Vulnerability. Part. B: Regional Aspects. Contribution of Working Group II to the Fifth Assessment Report of the Intergovernmental Panel on Climate Change; Barros, V.R., Field, C.B., Dokken, D.J., Mastrandrea, M.D., Mach, K.J., Bilir, T.E., Chatterjee, M., Ebi, K.L., Estrada, Y.O., Genova, R.C., et al., Eds.; Cambridge University Press: Cambridge, UK; New York, NY, USA, 2014; p. 688. [Google Scholar]
  8. IPCC. Climate Change 2007: Impacts, Adaptation and Vulnerability. Contribution of Working Group II to the Fourth Assessment Report of the Intergovernmental Panel on Climate Change; Parry, M.L., Canziani, O.F., Palutikof, J.P., van der Linden, P.J., Hanson, C.E., Eds.; Cambridge University Press: Cambridge, UK; New York, NY, USA, 2007; p. 976. [Google Scholar]
  9. Neogi, S.B.; Dey, M.; Kabir, S.M.L.; Masum, S.J.H.; Kopprio, G.; Yamasaki, S.; Lara, R. Sundarban mangroves: Diversity, ecosystem services and climate change impacts. Asian J. Med. Biol. Res. 2016, 2, 488–507. [Google Scholar] [CrossRef]
  10. Lara, R.J.; Neogi, S.B.; Islam, M.S.; Mahmud, Z.H.; Islam, S.; Paul, D.; Demoz, B.B.; Yamasaki, S.; Nair, G.B.; Kattner, G. Vibrio cholerae in waters of the Sunderban mangrove: Relationship with biogeochemical parameters and chitin in seston size fractions. Wetl. Ecol. Manag. 2011, 19, 109–119. [Google Scholar] [CrossRef]
  11. Nurse, L.A.; McLean, R.F.; Agard, J.; Briguglio, L.P.; Duvat-Magnan, V.; Pelesikoti, N.; Tompkins, E.; Webb, A. Small Islands. In Climate Change 2014: Impacts, Adaptation, and Vulnerability. Part B: Regional Aspects. Contribution of Working Group II to the Fifth Assessment Report of the Intergovernmental Panel on Climate Change; Barros, V.R., Field, C.B., Dokken, D.J., Mastrandrea, M.D., Mach, K.J., Bilir, T.E., Chatterjee, M., Ebi, K.L., Estrada, Y.O., Genova, R.C., et al., Eds.; Cambridge University Press: Cambridge, UK; New York, NY, USA, 2014; pp. 1613–1654. [Google Scholar] [CrossRef]
  12. Kay, J.E.; Deser, C.; Phillips, A.; Mai, A.; Hannay, C.; Strand, G.; Arblaster, J.M.; Bates, S.C.; Danabsoglu, G.; Edwards, J.; et al. The Community Earth System Model (CESM) Large Ensemble Project: A Community Resource for Studying Climate Change in the Presence of Internal Climate Variability. Bull. Am. Meteorol. Soc. 2015, 96, 1333–1349. [Google Scholar] [CrossRef]
  13. Behera, R.; Kar, A.; Das, M.R.; Panda, P.P. GIS-based vulnerability mapping of the coastal stretch from Puri to Konark in Odisha using analytical hierarchy process. Nat. Hazards 2019, 96, 731–751. [Google Scholar] [CrossRef]
  14. Vitousek, S.; Barnard, P.L.; Fletcher, C.H.; Frazer, N.; Erikson, L.; Storlazzi, C.D. Doubling of coastal flooding frequency within decades due to sea-level rise. Sci. Rep. 2017, 7, 1–9. [Google Scholar] [CrossRef]
  15. Wasko, C.; Sharma, A. Global assessment of flood and storm extremes with increased temperatures. Sci. Rep. 2017, 7, 1–8. [Google Scholar] [CrossRef] [PubMed]
  16. Muis, S.; Verlaan, M.; Winsemius, H.C.; Aerts, J.C.J.H.; Ward, P.J. A global reanalysis of storm surges and extreme sea-levels. Nat. Commun. 2016, 7, 1–11. [Google Scholar] [CrossRef] [PubMed]
  17. Little, C.M.; Horton, R.M.; Kopp, R.E.; Oppenheimer, M.; Vecchi, G.A.; Villarini, G. Joint projections of US East Coast sea-level and storm surge. Nat. Clim. Chang. 2015, 5, 1114–1120. [Google Scholar] [CrossRef]
  18. Wahl, T.; Jain, S.; Bender, J.; Meyers, S.D.; Luther, M.E. Increasing risk of compound flooding from storm surge and rainfall for major US cities. Nat. Clim. Chang. 2015, 5, 1093–1097. [Google Scholar] [CrossRef]
  19. Government of India. Census 2011. Available online: http://www.censusindia.gov.in/2011-common/census_2011.html (accessed on 20 August 2019).
  20. Uddin, M.S.; Shah, M.A.R.; Khanom, S.; Nesha, M.K. Climate change impacts on the Sundarbans mangrove ecosystem services and dependent livelihoods in Bangladesh. Asian J. Conserv. Biol. 2013, 2, 152–156. [Google Scholar]
  21. Van Vuuren, D.P.; Stehfest, E.; den Elzen, M.G.J.; Kram, T.; van Vliet, J.; Deetman, S.; Isaac, M.; Goldewijk, K.K.; Hof, A.; Beltran, A.M.; et al. RCP2.6: Exploring the possibility to keep global mean temperature change below 2°C. Clim. Chang. 2011, 109, 95–116. [Google Scholar] [CrossRef]
  22. Taylor, K.E.; Stouffer, R.J.; Meehl, G.A. An overview of CMIP5 and the experiment design. Bull. Am. Meteorol. Soc. 2011, 93, 485–498. [Google Scholar] [CrossRef]
  23. Hijmans, R.E.; Cameron, S.E.; Parra, J.L.; Jones, P.G.; Jarvis, A. Very high resolution interpolated climate surfaces of global land areas. Int. J. Clim. 2005, 25, 1965–1978. [Google Scholar] [CrossRef]
  24. Hempel, S.; Frieler, K.; Warszawski, L.; Schewe, J.; Piontek, F. A trend-preserving bias correction—The ISI-MIP approach. Earth Syst. Dyn. 2013, 4, 219–236. [Google Scholar] [CrossRef]
  25. Kosko, B. Fuzzy Cognitive Maps. Int. J. Man Mach. Stud. 1986, 24, 65–75. [Google Scholar] [CrossRef]
  26. Özesmi, U.; Özesmi, L.S. Ecological models based on people’s knowledge: A multi-step fuzzy cognitive mapping approach. Ecol. Model. 2004, 176, 43–64. [Google Scholar] [CrossRef]
  27. Singh, P.K.; Chudasama, H. Pathways for drought resilient livelihoods based on people’s perception. Clim. Chang. 2017, 140, 179–193. [Google Scholar] [CrossRef]
  28. Singh, P.K.; Chudasama, H. Assessing impacts and community preparedness to cyclones: A fuzzy cognitive mapping approach. Clim. Chang. 2017, 143, 337–354. [Google Scholar] [CrossRef]
  29. Solana-Gutiérrez, J.; Rincón, G.; Alonso, C.; García-de-Jalón, D. Using fuzzy cognitive maps for predicting river management responses: A case study of the Esla River basin, Spain. Ecol. Model. 2017, 360, 260–269. [Google Scholar] [CrossRef]
  30. Singh, P.K.; Nair, A. Livelihood vulnerability assessment to climate variability and change using fuzzy cognitive mapping approach. Clim. Chang. 2014, 127, 475–491. [Google Scholar] [CrossRef]
  31. Papageorgiou, E.; Kontogianni, A. Using Fuzzy Cognitive Mapping in Environmental Decision Making and Management: A Methodological Primer and an Application. In International Perspectives on Global Environmental Change; Young, S., Ed.; InTech: Lonodn, UK, 2012; pp. 427–450. ISBN 978-953-307-815-1. [Google Scholar]
  32. Papageorgiou, E. (Ed.) Fuzzy Cognitive Maps for Applied Sciences and Engineering—From Fundamentals to Extensions and Learning Algorithms, Intelligent Systems Reference Library, 54; Springer (Springer-Verlag): Heidelberg, Germanay, 2014; ISBN 978-3-642-39738-7. [Google Scholar]
  33. Allen, M.R.; Dube, O.P.; Solecki, W.; Aragón–Durand, F.; Cramer, W.; Humphreys, S.; Kainuma, M.; Kala, J.; Mahowald, N.; Mulugetta, Y.; et al. Framing and Context. In Global warming of 1.5 °C. An IPCC Special Report on the impacts of global warming of 1.5 °C above Pre-Industrial Levels and Related Global Greenhouse Gas Emission Pathways, in the Context of Strengthening the Global rEsponse to the Threat of Climate Change, Sustainable Development, and Efforts to Eradicate Poverty; Masson-Delmotte, V., Zhai, P., Pörtner, H.O., Roberts, D., Skea, J., Shukla, P.R., Pirani, A., Moufouma-Okia, W., Péan, C., Pidcock, R., et al., Eds.; IPCC: Geneva, Switzerland, 2018; pp. 49–91. [Google Scholar]
  34. Ziv, G.; Watson, E.; Young, D.; Howard, D.C.; Larcom, S.T.; Tanentzap, A.J. The potential impact of Brexit on the energy, water and food nexus in the UK: A fuzzy cognitive mapping approach. Appl. Energy 2018, 210, 487–498. [Google Scholar] [CrossRef]
  35. Jetter, A.J.; Kok, K. Fuzzy cognitive maps for futures studies—A methodological assessment of concepts and methods. Futures 2014, 61, 45–57. [Google Scholar] [CrossRef]
  36. UNDP. Adaptation Policy Frameworks for Climate Change: Developing Strategies, Policies and Measures; Lim, B., Spanger-Siegfried, E., Burton, I., Malone, E., Huq, S., Eds.; Cambridge University Press: Cambridge, UK; New York, NY, USA, 2004; p. 248. [Google Scholar]
  37. Nápoles, G.; Papageorgiou, E.; Bello, R.; Vanhoof, K. On the convergence of sigmoid Fuzzy Cognitive Maps. Inf. Sci. 2016, 349, 154–171. [Google Scholar] [CrossRef]
  38. Papageorgiou, E.; Papageorgiou, K.; Dikopoulou, Z.; Mouhrir, A. A web-based tool for Fuzzy Cognitive Map Modeling. In Proceedings of the 9th International Congress on Environmental Modelling and Software (iEMSs), Fort Collins, CO, USA, 24–29 June 2018. [Google Scholar]
  39. Asfaw, S.; Pallante, G.; Palma, A. Diversification Strategies and Adaptation Deficit: Evidence from Rural Communities in Niger. World Dev. 2018, 101, 219–234. [Google Scholar] [CrossRef]
  40. Nalau, J.; Becken, S.; Schliephack, J.; Parsons, M.; Brown, C.; Mackey, B. The Role of Indigenous and Traditional Knowledge in Ecosystem-Based Adaptation: A Review of the Literature and Case Studies from the Pacific Islands. Weather Clim. Soc. 2018, 10, 851–865. [Google Scholar] [CrossRef]
  41. Klein, R.J.T.; Midgley, G.E.; Preston, B.L.; Alam, M.; Berkhout, F.G.H.; Dow, K.; Shaw, M.R. Adaptation Opportunities, Constraints, and Limits. In Climate Change 2014: Impacts, Adaptation, and Vulnerability. Part A: Global and Sectoral Aspects. Contribution of Working Group II to the Fifth Assessment Report of the Intergovernmental Panel on Climate Change; Field, C.B., Barros, V.R., Dokken, D.J., Mach, K.J., Mastrandrea, M.D., Bilir, T.E., Chatterjee, M., Ebi, K.L., Estrada, Y.O., Genova, R.C., et al., Eds.; Cambridge University Press: Cambridge, UK; New York, NY, USA, 2014; pp. 899–943. [Google Scholar]
  42. Barnett, J.; Evans, L.S.; Gross, C.; Kiem, A.S.; Kingsford, R.T.; Palutikof, J.P.; Pickering, C.M.; Smithers, S.G. From barriers to limits to climate change adaptation: Path dependency and the speed of change. Ecol. Soc. 2015, 20, 5. [Google Scholar] [CrossRef] [Green Version]
  43. Moser, S.C.; Ekstrom, J.A. A framework to diagnose barriers to climate change adaptation. PNAS 2010, 107, 22026–22031. [Google Scholar] [CrossRef] [PubMed] [Green Version]
  44. Petzold, J.; Magnan, A.K. Climate change: Thinking small islands beyond Small Island Developing States (SIDS). Clim. Chang. 2019, 152, 145–165. [Google Scholar] [CrossRef]
  45. Shackleton, S.; Ziervogel, G.; Sallu, S.; Gill, T.; Tschakert, P. Why is socially-just climate change adaptation in sub-Saharan Africa so challenging? A review of barriers identified from empirical cases. WIREs Clim. Chang. 2015, 6, 321–344. [Google Scholar] [CrossRef] [Green Version]
  46. Antwi-Agyei, P.; Dougill, A.J.; Stringer, L.C. Barriers to climate change adaptation: Evidence from northeast Ghana in the context of a systematic literature review. Clim. Dev. 2014, 7, 297–309. [Google Scholar] [CrossRef]
  47. Nunn, P.; Aalbersberg, W.; Lata, S.; Gwilliam, M. Beyond the core: Community governance for climate-change adaptation in peripheral parts of Pacific Island Countries. Reg. Environ. Chang. 2013, 14, 221–235. [Google Scholar] [CrossRef]
  48. Adger, W.N.; Dessai, S.; Goulden, M.; Hulme, M.; Lorenzoni, I.; Nelson, D.R.; Naess, L.O.; Wolf, J.; Wreford, A. Are there social limits to adaptation to climate change? Clim. Chang. 2009, 93, 335–354. [Google Scholar] [CrossRef]
  49. Nalau, J.; Handmer, J. Improving development outcomes and reducing disaster risk through planned community relocation. Sustainability 2018, 10, 3545. [Google Scholar] [CrossRef] [Green Version]
  50. Petzold, J.; Ratter, B.M.W. Climate change adaptation under a social capital approach—An analytical framework for small islands. Ocean. Coast. Manag. 2015, 112, 36–43. [Google Scholar] [CrossRef]
  51. Runhaar, H.; Wilk, B.; Persson, Å.; Uittenbroek, C.; Wamsler, C. Mainstreaming climate adaptation: Taking stock about “what works” from empirical research worldwide. Reg. Environ. Chang. 2018, 18, 1201–1210. [Google Scholar] [CrossRef] [Green Version]
  52. Neset, T.; Asplund, T.; Käyhkö, J.; Juhola, S. Making sense of maladaptation: Nordic agriculture stakeholders’ perspectives. Clim. Chang. 2019, 153, 107–121. [Google Scholar] [CrossRef] [Green Version]
  53. Antwi-Agyei, P.; Dougill, A.J.; Stringer, L.C.; Codjoe, S.N.A. Adaptation opportunities and maladaptive outcomes in climate vulnerability hotspots of northern Ghana. Clim. Risk Manag. 2018, 19, 83–93. [Google Scholar] [CrossRef]
  54. Juhola, S.; Glaas, E.; Linnér, B.; Neset, T. Redefining maladaptation. Environ. Sci. Policy 2016, 55, 135–140. [Google Scholar] [CrossRef] [Green Version]
  55. Barnett, J.; O’Neil, S. Maladaptation. Glob. Environ. Chang. 2010, 20, 211–213. [Google Scholar] [CrossRef]
  56. De Coninck, H.; Revi, A.; Babiker, M.; Bertoldi, P.; Buckeridge, M.; Cartwright, A.; Dong, W.; Ford, J.; Fuss, S.; Hourcade, J.C.; et al. Strengthening and implementing the global response. In Global Warming of 1.5 °C. An IPCC Special Report on the Impacts of Global Warming of 1.5 °C above Pre-Industrial Levels and Related Global Greenhouse Gas Emission Pathways, in the Context of Strengthening the Global Response to the Threat of Climate Change, Sustainable Development, and Efforts to Eradicate Poverty; Masson Delmotte, V., Zhai, P., Pörtner, H.O., Roberts, D., Skea, J., Shukla, P.R., Pirani, A., Moufouma-Okia, W., Péan, C., Pidcock, R., et al., Eds.; IPCC: Geneva‎, Switzerland, 2018; pp. 313–443. [Google Scholar]
  57. Parsons, M.; Brown, C.; Nalau, J.; Fisher, K. Assessing adaptive capacity and adaptation: Insights from Samoan tourism operators. Clim. Dev. 2018, 10, 644–663. [Google Scholar] [CrossRef]
  58. McNamara, K.E.; Buggy, L. Community-based climate change adaptation: A review of academic literature. Local Environ. 2016, 22, 1–18. [Google Scholar] [CrossRef]
  59. Remling, E.; Veitayaki, J. Community-based action in Fiji’s Gau Island: A model for the Pacific? Int. J. Clim. Chang. Strateg. Manag. 2016, 8, 375–398. [Google Scholar] [CrossRef]
  60. Doswald, N.; Munroe, R.; Roe, D.; Giuliani, A.; Castelli, I.; Stephens, J.; Möller, I.; Spencer, T.; Vira, B.; Reid, H. Effectiveness of ecosystem-based approaches for adaptation: Review of the evidence-base. Clim. Dev. 2014, 6, 185–201. [Google Scholar] [CrossRef]
Figure 1. Condensed social cognitive map showing the perception of communities regarding climate-related impacts and adaptations.
Sustainability 11 06655 g001
Table 1. Various future scenarios using fuzzy cognitive maps (FCM)-based simulations.
ScenariosInput Vector Concepts Used for Simulations
BaselineC1—Climate variability and change, C2—Climatic extremes
Scenario 1C14—Dykes and embankments
Scenario 2C15—Water resource management
Scenario 3C18—Sustainable agriculture and aquaculture practices
Scenario 4C22—Strengthening local institutions
Scenario 5C14—Dykes and embankments, C15—Water resource management, C18—Sustainable agriculture and aquaculture practices, and C22—Strengthening local institutions
Table 2. Annual mean temperature and precipitation profile of the study area.
Climatic ParametersReference Climate * (1981‒2010)** E-Mean of Projections during 2050s (2041–2070)** E-Mean of Projections during 2080s (2071–2100)
RCP 2.6RCP 8.5RCP 2.6RCP 8.5
Mean Temperature (°C)26.827.929.227.930.8
Mean Precipitation (mm)17441832187219121872
Accumulated precipitation on consecutive rainy day (above 30 mm)118375328372376
* Reference climate (CRUTS32: 1981–2010); ** E-Mean: Ensemble mean-ESM2M of all five models (CRUTS32, HadGEM2-ES, IPSL-CM5A-LR, MIROC-ESM-CHEM, and NorESM1-M) are taken into consideration to avoid extreme variations in the result.
Table 3. Results of FCM-based simulations.
ConceptsBaselineScenario 1Scenario 2Scenario 3Scenario 4Scenario 5
IVSteady State ValueIVSteady State ValueIVSteady State ValueIVSteady State ValueIVSteady State ValueIVSteady State Value
C1: Climate variability and change111111111111
C2: Climatic extremes10.929710.929710.929710.929710.929710.9297
C3: Sea-level rise00.956400.689100.956400.956400.956400.6897
C4: Seawater intrusion00.998600.983900.998600.998600.998600.984
C5: Soil fertility0−0.98840−0.98810−0.92750−0.92760−0.83340−0.8284
C6: Water resources0−0.99210−0.99210−0.96050−0.960500.748200.7482
C7: Pest invasion00.947700.947700.947700.947700.947700.9477
C8: Agriculture productivity0−0.99990−0.99990−0.99610−0.996100.809600.8116
C9: Environmental degradation00.944400.944500.944500.944500.553200.5532
C10: Livestock productivity0−0.98040−0.98040−0.92310−0.923200.479900.48
C11: Loss of infrastructure00.988400.871700.988400.988400.988400.8721
C12: Health and quality of life0−0.98060−0.98060−0.98060−0.98060−0.90310−0.9031
C13: Economic poverty00.993500.993500.974600.97460−0.99810−0.9981
C14: Dykes and embankments001100000011
C15: Water resource management000010.939200.939100.988510.9885
C16: Water infrastructure000000000000
C17: Agriculture inputs000000000000
C18: Sustainable agriculture and aquaculture practices000000.940210.940200.945510.9455
C19: Pest control measures000000000000
C20: Healthcare facilities0000000000.919900.9199
C21: Livelihood diversification000000000000
C22: Strengthening local institutions000000001111
C23: Credits and subsidies0000000000.922800.9228
Note: IV stands for initial value; Concepts shown in Blue are climate stressors, concepts shown in Black are climate-related impacts, and concepts shown in Red are climate change adaptations in the area as perceived by the communities.

