Modeling of Biofuel’s Emissivity for Fuel Choice Management


1
Department of Production Engineering, Institute of Mechanical Engineering, Warsaw University of Life Sciences, Nowoursynowska Street 164, 02-787 Warsaw, Poland
2
Department of Production Management, Bialystok University of Technology, Wiejska Street 45A, 15-351 Bialystok, Poland
3
Faculty of Mechanical Engineering, Department of Production Computerization and Robotization, Lublin University of Technology, Nadbystrzycka 38 D, 20-618 Lublin, Poland
*
Authors to whom correspondence should be addressed.
Sustainability 2019, 11(23), 6842; https://0-doi-org.brum.beds.ac.uk/10.3390/su11236842
Submission received: 19 September 2019
/
Revised: 8 November 2019
/
Accepted: 26 November 2019
/
Published: 2 December 2019
(This article belongs to the Special Issue Sustainable Mobility: Social, Technological and Environmental Issues)
Abstract
:The depletion of conventional energy sources, including crude oil, is one of the cause of the search for alternative carriers and fuels in order to prevent an energy crisis. Due to the progressing climate change, each new solution must comply with the principles of sustainable development. Dynamic development in the transport sector and, as a consequence, the increase in the number of vehicles on the roads negatively affect the atmosphere and the environment, which is why the share of biofuels, which are used to minimize this negative impact, is steadily increasing. This paper analyzes the emissivity (emission capability) of biofuels such as fatty acid methyl esters (FAME), ethanol, dimethyl ether and butanol and compares them with conventional fuels. A computer simulation was used, based on the real parameters of vehicles and fuels. The test procedure was carried out in accordance with the appropriate New European Driving Cycle (NEDC) approval test for such cars. In addition, a life cycle assessment (LCA) for the fuels and vehicles in question was carried out using the SimaPro package. Based on the results obtained from the z computer simulation, it was found that diesel fuel showed lower emissivity than petrol and its alternatives. However, FAME fuel provided more carbon dioxide than conventional diesel. As far as petrol is concerned, it was less emissive than dimethyl ether. Ethanol and butanol reduced emissions by 7% and 15%, respectively. After taking into account CO2 emissions generated in the production process, both FAME and butanol were not very favorable in the context of other fuels. The results might be used for appropriate fuel use management.
1. Introduction
Sustainable development in modern times has become a key determinant of shaping society and the economic systems of states. It is particularly visible in the legislation and strategic documents of countries and communities. Bearing in mind the depletion of conventional energy carriers and the deteriorating condition of the natural environment, it has become necessary to reconcile technological progress and prosperity growth with care and maintaining balance in nature [1,2]. The multitude of definitions of sustainable development results from economic diversity and numerous sectors in which it should be used; however, they have one thing in common, namely taking into account environmental conditions (development, restoration, respect, increase of resources, care for the state) [3,4]. An undoubted threat is the excessive emission of greenhouse gases into the atmosphere, including carbon dioxide, which is considered the main anthropogenic factor, deepening the greenhouse effect and increasing the average temperature on Earth [5].
The fuel and energy sector reflect the state of the economy around the world [6,7]. Energy security, sustainable development and environmental protection are the priorities of the European Union. Increased emphasis is placed on the development of new technologies in the energy sector [8,9,10,11], promotion of electromobility [12,13], and a departure from fossil fuels [14,15,16]. In the wake of the oil crisis and the progressing pollution of the environment, replacing non-renewable fuels with their renewable counterparts in the event of total depletion of fossil resources has become a priority [17,18,19]. An important goal in the energy policy of the European Union member states is to increase the share of biofuels and biocomponents in the fuel market [20,21] as well as to reduce CO2 emissions into the atmosphere [21,22,23,24]. The most desirable types of fuel are second-generation biofuels, produced from raw materials unfit for human consumption, whose use is consistent with the principles of sustainable development [25,26]. For petrol, possible substitutes are primary alcohols such as ethanol and methanol, secondary alcohols and ethers, while for diesel, oil-vegetable oils and their derivatives (higher fatty esters) [27,28]. The most popular alternative to petrol is ethanol, which is obtained as a result of a complex treatment of raw materials rich in polysaccharides, e.g., starch. Moreover, cereals and molasses (mainly from sugar cane and beetroots) constitute good materials for the production of this fuel [29,30,31]. Dimethyl ether (DME), whose properties are similar to those of LPG, is also possible for application. It has a high cetane number and is relatively inexpensive to produce [32]. It is obtained in a complex process of indirect and direct synthesis from raw materials such as biogas, biomethanol or biomass, including lignocellulosic biomass [33,34]. For diesel, a popular replacement is FAME fuel, i.e., methyl esters of higher fatty acids, occurring as an additive or a standalone fuel (biodiesel). This fuel is produced by esterification of fats present in vegetable oils (e.g., rapeseed, sunflower) or animal fats [35,36]. Due to its promising ecological properties, the use of butyl alcohol obtained from biomass (biobutanol), as a substitute for classic diesel, is subject to increasing verification. Biobutanol, similarly to ethanol, is obtained by fermentation in anaerobic conditions but using different microorganisms in the process [37,38]. This alcohol can be obtained from a variety of biomass types such as sugar cane, beets, wheat, but also corn stalks, straw and wood waste, which are all rich sources of lignocellulose [39].
The current energy and environmental regulations applicable in the European community largely focus on energy efficiency and the reduction of carbon dioxide emissions, which is considered to be the main anthropogenic factor which intensifies the greenhouse effect [40].
In 2017, the global emission of carbon dioxide into the atmosphere amounted to 36,153 MtCO2. The largest emitters include China (9439 MtCO2), the United States (5270 MtCO2) and India (2467 MtCO2). The European Union states were responsible for about 10% of global CO2 emissions [41]. Within the European Union, the highest loads of carbon dioxide were emitted from Germany (799.4 MtCO2), Great Britain (384.7 MtCO2), France (356.3 MtCO2), and Italy (355.5 MtCO2). Poland emitted 326.6 MtCO2, which is why it ranked fifth among emitters in the European Union [42]. According to the data from the European Environment Agency, Poland, compared to other EU-28 Member States, recorded the largest absolute increase in emissions. About 25% of the total carbon dioxide emissions originates from transport, while over 70% is provided by road transport.
Under the EU Emissions Sharing Regulation (ESR), Poland is obliged to reduce greenhouse gas emissions from sectors not covered by the Emissions Trading Scheme (non-ETS). This includes mainly construction, transport, agriculture. According to the concluded agreements, Poland has to reduce its non-ETS sector emissions by 7% in the period 2020–2030 compared to 2005 [43]. Analysis of options to deliver the required reductions and implement actions that contribute to reducing transport emissions is ongoing. One of the ways to reduce C02 emissions in Poland is to increase the market share of biofuels.
Due to the numerous advantages and the growing need for broadly defined mobility [44], the share of motor vehicles is constantly increasing. According to the European Environment Agency, passenger cars were responsible for over 60% of emissions from transport in 2016. Freight vehicles (light and heavy trucks) provided about 38% of CO2 emissions. The number of vehicles in Poland, especially passenger cars, is growing every year. In 2017, the total number of motor vehicles in Poland amounted to 29,762,900, of which 22,569,900 items were passenger cars. For comparison, the vehicle fleet 5 years earlier was 24,877,700 in total, of which 18,744,400 were passenger cars [45,46]. A distinct increase in the share can be seen in this segment.
The European Union has undertaken a consistent fight against climate change and committed itself to reducing emissions by at least 40% in time horizon until 2030 and by at least 60% by 2050 (with reference to 1990). Due to the high invasiveness in this area, the requirement to reduce greenhouse gases is also being enforced in the area of transport [47]. The objective can be achieved by a sum of organizational innovation, low-carbon technology deployment, smart management of energy production and consumption [48,49]. This is why efforts have been made for many years to increase the use of low-carbon sustainable fuels and propulsion systems, to promote research and development aimed at increasing transport efficiency and to develop local energy networks [50,51].
In the face of restrictive regulations regarding the reduction of greenhouse gas emissions (mainly CO2) and the increase of bio-based additives in fuels [52,53], it has been deemed reasonable to determine the impact of required biofuels and bio-additives on the emission of carbon dioxide from internal combustion engines.
Emission limits for newly manufactured vehicles have been in operation since 2009 (the first application of emission limits in 2015). The limits on average carbon dioxide emissions for passenger cars in the European Union will be regular reduced from 130 gCO2/km in 2015 to 65 gCO2/km in 2030 [52,54].
The purpose of this work was to determine the level of carbon dioxide emissions from conventional fuels and biofuels. For this purpose, computer simulation was used, which reflects the set cycle of the considered engine. The research covered the development of a simulation model based on mathematical relationships both regarding engine operation and fuel combustion processes and exhaust emissions, obtaining and transforming the results for comparative purposes with applicable limits, assessment of the emissivity of the tested fuels in terms of carbon dioxide and indication of carriers that may contribute to reducing the negative impact of transport on the environment.
In the available literature, no approach has been found that would link actual engine tests for broad changes in operating parameters. Other authors in the literature have only presented the results of these studies, but have not referred to the NEDC (New European Driving Cycle) type-approval tests that condition the vehicle’s entry into service on public roads [55]. It seems that the calculation is limited to a conversion of carbon content in fuels to end-of-pipe CO2 emissions. While this a suitable proxy, you cannot draw conclusions for a climate mitigation policy from end-of-pipe CO2 emissions. You are missing upstream emissions and CO2 uptake for bio fuels. This changes everything. (Bio) fuel research will be much more advanced if it includes life-cycle assessment. The intention of the authors of this manuscript was to answer the question whether based on the operational characteristics of the engine, it is possible to estimate the behavior of the vehicle under the conditions of the NEDC dynamic test. This combination of actual test conditions and a simulation model in road conditions will allow other vehicles to estimate their environmental impact in the future without the need for costly driving tests. Acquiring research results in this way has many advantages and does not threaten any actual objects. Fuels that constitute the power source should be treated as an important structural element, taking into account in the design and operation phases. Due to its functions, the fuel cannot be properly defined without specifying its purpose and properties. It should be remembered that at the stage of designing fuel systems of modern passenger cars, the use of fuels other than conventional petrol and diesel fuels [56,57,58] was not taken into account, in which case real experiments would have negative and irreversible effects. Fuel mixers require adaptive testing to tailor the fuel properties to a particular engine. Thanks to computer modelling, a significant amount of data is obtained in an accessible form and affordable time, which can be the basis for planning experiments on actual physical objects [59,60]. This method is practically cost-free and any modifications are possible in a simple and quick way. It should be emphasized that the model is based on actual fuel consumption and emission characteristics for given engines, thanks to which the real results are obtained in the context of a given engine. In the available literature, similar estimates are often made basing on ready conversion factors, which generalizes the results. In the case of bench tests or road tests, there is a risk of errors coming from external factors. In the case of computer simulation, such incidents do not occur and do not disturb the results obtained.
The way in which cars affect the environment is very complex, and the assessment of the environmental impact is complicated and in many cases, ambiguous. During the life cycle of a car, its use is a dominant source of environmental pollution. The possibility of applying the assessment of the cycle of existence in the automotive industry, despite the rich literature, with the involvement of the industry and significant resources allocated to research programmes, is debatable. Published analytical results are often inconsistent and even lead to contradictory conclusions. The reason for this state of affairs is a far-reaching freedom of choice of assumptions and input data by the authors of the research. There are no clear criteria for assessing the life cycle of a car—different methods are commonly used, the results relate to different impact categories, whose quantitative indicators are also not always the same [61,62]. This situation also results from the lack of data on a commercial scale and the need to build complex mathematical models and advanced computer tools. This suggests that the results of the published analyses are highly uncertain and lead to caution in their interpretation. In the vast majority of studies, the life-cycle assessment method does not take into account the different traffic conditions that characterize the typical use of vehicles. Instead, assumptions are made based on the results of type-approval tests, based on standard driving tests (carried out for one specific type of fuel) or even assumes that the emission values are equal to the limits set by the exhaust emission standards applicable to the vehicle. Although this approach makes it possible to benchmark cars, it does represent a major simplification and should not be taken into account when assessing the environmental performance of cars in actual use. For the purposes of LCA analysis, emission levels obtained from computer simulation of driving tests of two popular motor vehicles have been implemented. In consequence, the results of the analysis are more reliable and better assess the life cycle of the analyzed fuels (including biofuels from plant raw materials) in the context of the vehicles tested.
The production of biofuels from plant materials brings wide possibilities of reducing CO2 emissions [63,64]. Reduction of greenhouse gas (GHG) is implemented, among others, by improving agrotechnics of crops, for example by using no-tillage cultivation, indirect land use change [65] or using less energy-intensive processing processes for given substrates [66], using lower emission fuels to power machines and devices in the harvesting and processing [67], limiting transport distances in the manufacturing process [68]. In addition, biomass conversion is considered as a closed cycle due to CO2 sequestration by plants from which energy is produced. According to the RED directive, this capture is not included in the biofuel life cycle greenhouse gas balance, however, this process is actually taking place and can be considered as an estimate, which further increases the reduction potential of the energy carrier. Due to the above, it is possible to obtain negative CO2 emission results throughout the entire life cycle from the production stage to the moment of utilization for the considered fuels of vegetable origin [69,70]. The described case will occur in the analysis of LCA results.
Modern propulsion units, despite technological progress and continuous improvement, resulting from market needs and legal conditions, are still designed for the fuels used so far, such as gasoline and diesel. Throughout the history of their use, these fuels have not experienced many changes in their operational properties and parameters, hence, the injection systems still available are designed with respect to characteristics of a traditional carrier. Modifications being introduced to these systems focus on increasing their productivity and economic factors [56,58,71]. Problems with the use of clean biofuels in modern engines are dictated by the need to assure the same properties as the reference fuel [72]. As demonstrated earlier, biofuels differ from fossil ones in two aspects: chemical composition and physical parameters.
From the point of view of physicochemical properties and composition, the use of 100% biofuel is not possible without changes in engine construction, but it is highly desirable due to the ecological effects. Currently, the share of biocomponents being added to conventional fuels corresponds to the adopted regulations of the European Community. Directive 2009/28/EC of the European Parliament introduced the share of bio-additives at the level of 7% of the addition of fatty acid methyl esters to diesel fuel B7 and 5% ethanol addition to gasoline E5 [68]. However, Directive 2014/94/EU of the European Parliament and of the Council of 22 October 2014 on the development of alternative fuels infrastructure (Text with EEA relevance) introduces the possibility of increasing biocomponents content in classic fuels to 10% [73].
This directive maintains the position that currently, biofuels are the most important type of alternative carriers that can significantly reduce the emission of carbon dioxide into the atmosphere, assuming that their production takes place in a sustainable manner. Biofuels are treated as fuels that provide clean energy for all transport vehicles. Keeping in mind the statements of Directive 2014/94/EU, it is worth looking at the production of individual fuels and taking into account the total carbon dioxide production resulting from the whole life cycle of a given fuel.
Pure conventional fuels and pure biofuels were analysed in the LCA approach. The purpose of the analysis was to determine the CO2 reduction potential of individual fuels, so their mixtures were not significant here. If the production of any of the fuels shows high emissions, its mixtures will also be burdened with a high percentage of CO2 emission, even if only some percentage of the additive is taken into account. The LCA analysis only supplemented the results of the simulation in order to broaden the view on the issue under consideration. The third stage of the LCA, which took into account the results of direct emissions taken from the simulation, was based on the 100% content of individual fuels, which gave a comparative picture of emissions for individual carriers.
2. Materials and Methods
2.1. Nomentclature and Units
The following list contains a collection of the most important quantities used in calculations, together with appropriate symbols and units (Table 1).
2.2. Materials
The real parameters of the Fiat Panda 1.3 MultiJet passenger car, equipped with a diesel engine and Fiat Seicento 1.1 with a petrol engine, were implemented for the simulation. These particular vehicles were chosen because of their typical urban character (small displacement capacity of the engine, small dimensions) and the different fuels with which they are supplied.
It should be pointed out that in urban areas, motor vehicles are responsible for 70–90% of atmospheric air pollution [76] and the specificity of cities’ spatial management impedes self-cleaning of the air (limited urban greenery, lack of open spaces), which prevents “airing”, a significant amount of paved surfaces, which favors accumulation of freely floating dust [77]. Furthermore, by comparing two different engine types, it was possible to estimate which of the two units is described by potentially lower emission.
The Fiat Seicento with the 1.1-litre Fire 8v petrol engine achieves maximum power (40 kW) at 5000 rpm and maximum torque (88 Nm) at 2750 rpm. The stroke of the piston and the inner diameter of the cylinder are 72 × 70 mm. The timing drive is realized with a belt with one shaft, embedded in an aluminum head. The construction is four-cylinder with two valves on each cylinder. The tappets are driven directly [78]. According to the manufacturer’s data, the fuel consumption in the urban cycle is 7.2 L/100 km, the combined cycle 5.8 L/100 km and the extra-urban cycle 4.8 L/100 km.
The Fiat Panda, equipped with a modern 1.3 L MultiJet II diesel engine is a compact vehicle designed for a typically urban use. The maximum power (75 HP) is achieved at 4000 rpm and the maximum torque (190 Nm) at 1500 rpm. The fuel delivery system is implemented via a Common Rail injection system. The engine’s construction is based on a 16-valve DOHC head and a chain-driven timing [79,80]. Based on the manufacturer’s data, the fuel consumption in the urban cycle amounts to 4.7 L/100 km, in the extra-urban cycle 3.5 L/100 km and in the combined cycle, the consumption is 3.9 L/100 km [81].
Table 2 summarizes the basic technical data for the 1.1 Fire and 1.3 MultiJet II engines.
Computer simulations enabled the use of fuels with different properties. For the purposes of this study, the following conventional fuels were used: petrol 95, diesel fuel and alternative fuels (100% content): ethanol, methanol, dimethyl ether (DME), fatty acid methyl esters (FAME), butanol. The selected properties of the fuels used are listed in Table 3 below [82,83,84,85].
The above table shows that fuels of biological origin have different properties than their conventional counterparts. In the case of diesel fuel and FAME fuel, the largest difference is the content of carbon and calorific value (higher for diesel fuel) as well as oxygen content (higher for FAME fuel) [83,84]. In the case of petrol and its equivalents, the largest differences can be seen in the oxygen content (higher for alternative fuels), carbon content and oxygen demand (higher for petrol) [85].
In order to calculate the air value that is necessary to burn a specific fuel mixture, the air demand parameters defined for separate components of the mixture were used. The resultant value of the air demand was calculated according to the dependence:
In successive algorithms of the simulation model to determine the value of the fuel mixture stream generating the same value of flowing chemical energy as in the case of 95 petrol, the calorific value parameters for separate components of the mixture were used. The resultant calorific value was calculated based on the given dependences:
To calculate the emissions of carbon dioxide and water vapor, it was necessary to determine the resultant mass fractions of chemical components: carbon, hydrogen and oxygen.
2.3. Methods
Scilab software was used to build simulation models. It is an open source science package offering advanced calculation functions in a user-friendly form. The program offers dynamic model making based on complicated mathematical calculations and algorithms. Its scope includes design, simulation, recording and compilation of developed solutions. Its computing functions are mainly concentrated on solving differential equations, solving linear and nonlinear systems, generating random numbers, fast Fourier transforms, algorithms and their optimization, determination of vectors and eigenvalues. The program environment also enables the creation of low-level utility graphics (cursor coordinates, polygons) and high-level graphics (curvatures, contour charts). In the research conducted, a built-in Xcos package was used, which is the equivalent of Simulink for the popular Matlab program. This component enables the creation of block diagrams that reflect the actual dependencies that occur in the modelled system. This type of solution is quite intuitive for the user and reduces the possibility of errors, whilst all calculations are performed within the developed systems. In the Xcos module, apart from building the model, you can edit it, create model blocks and perform simulations. The software is widely used in the construction of real mechanical systems (e.g., in the automotive industry), control systems or in designing other dynamic systems, e.g., hydraulic circuits [86].
Besides choosing the right software, it was also important to select the right work cycle for each vehicle in order to reliably verify the results obtained. Each newly manufactured vehicle, before it is allowed to drive in public, must undergo the homologation procedure to determine the values of its various parameters (including exhaust emissions) and compare those values with applicable standards. The NEDC (New European Driving Cycle) homologation test has been in force since 1990 and it was on its basis that the decision was made to permit entry into service for the new car.
From September 2018, car manufacturers may sell new cars on the condition that they meet the new standard of fuel consumption and emissions in accordance with the WLTP (Worldwide Harmonized Light Vehicle Test Procedure) test standard (there has been a departure from the NEDC test when certifying vehicles for WLTP and RDE—Real Driving Emissions) [87,88]. The new regulations also includes models of cars that have been approved earlier using the NEDC test, and are still not sold (they must be certified according to WLTP). Recently, many times, the withdrawal of individual car models, or engine versions occurred because they did not meet the new rules.
In spite of those restrictive tests, still on the roads of many EU countries (and not only the EU) there are cars that are about 10 years old and do not meet neither the WLTP, nor NEDC [89,90] standards. Therefore, the older NEDC procedure was chosen, which both vehicles, Fiat Seicento and Fiat Panda included in the study, were originally subject to.
The NEDC test lasts 20 min (1200 s) during which operation is performed under various conditions. The test is divided into two parts: the urban cycle and the extra-urban cycle. In the urban cycle, which represents the vehicle movement in typical city conditions (stops, moderate speeds, average driving dynamics), there are four recurring driving phases from the slow acceleration of the car to reaching the respective speeds of 15, 32 and 50 km/h. Each acceleration is followed by stopping the vehicle for a specified time. The vehicle in the urban cycle covers about 4 km in 13 min and its average speed is 18.35 km/h. The extra-urban cycle is to simulate driving in non-residential areas and motorways (higher speeds, high driving dynamics, no stops). This is where the vehicle accelerates to the following speeds: 70, 100 and 120 km/h respectively. The vehicle does not stop, only slows down to 50 km/h for a period of about 70 s. At this point, the distance of about 7 km is covered in 6 min and 40 s and the average speed is 62.6 km/h. The result of the test is the average fuel consumption and the emission of carbon dioxide and other exhaust components [91,92].
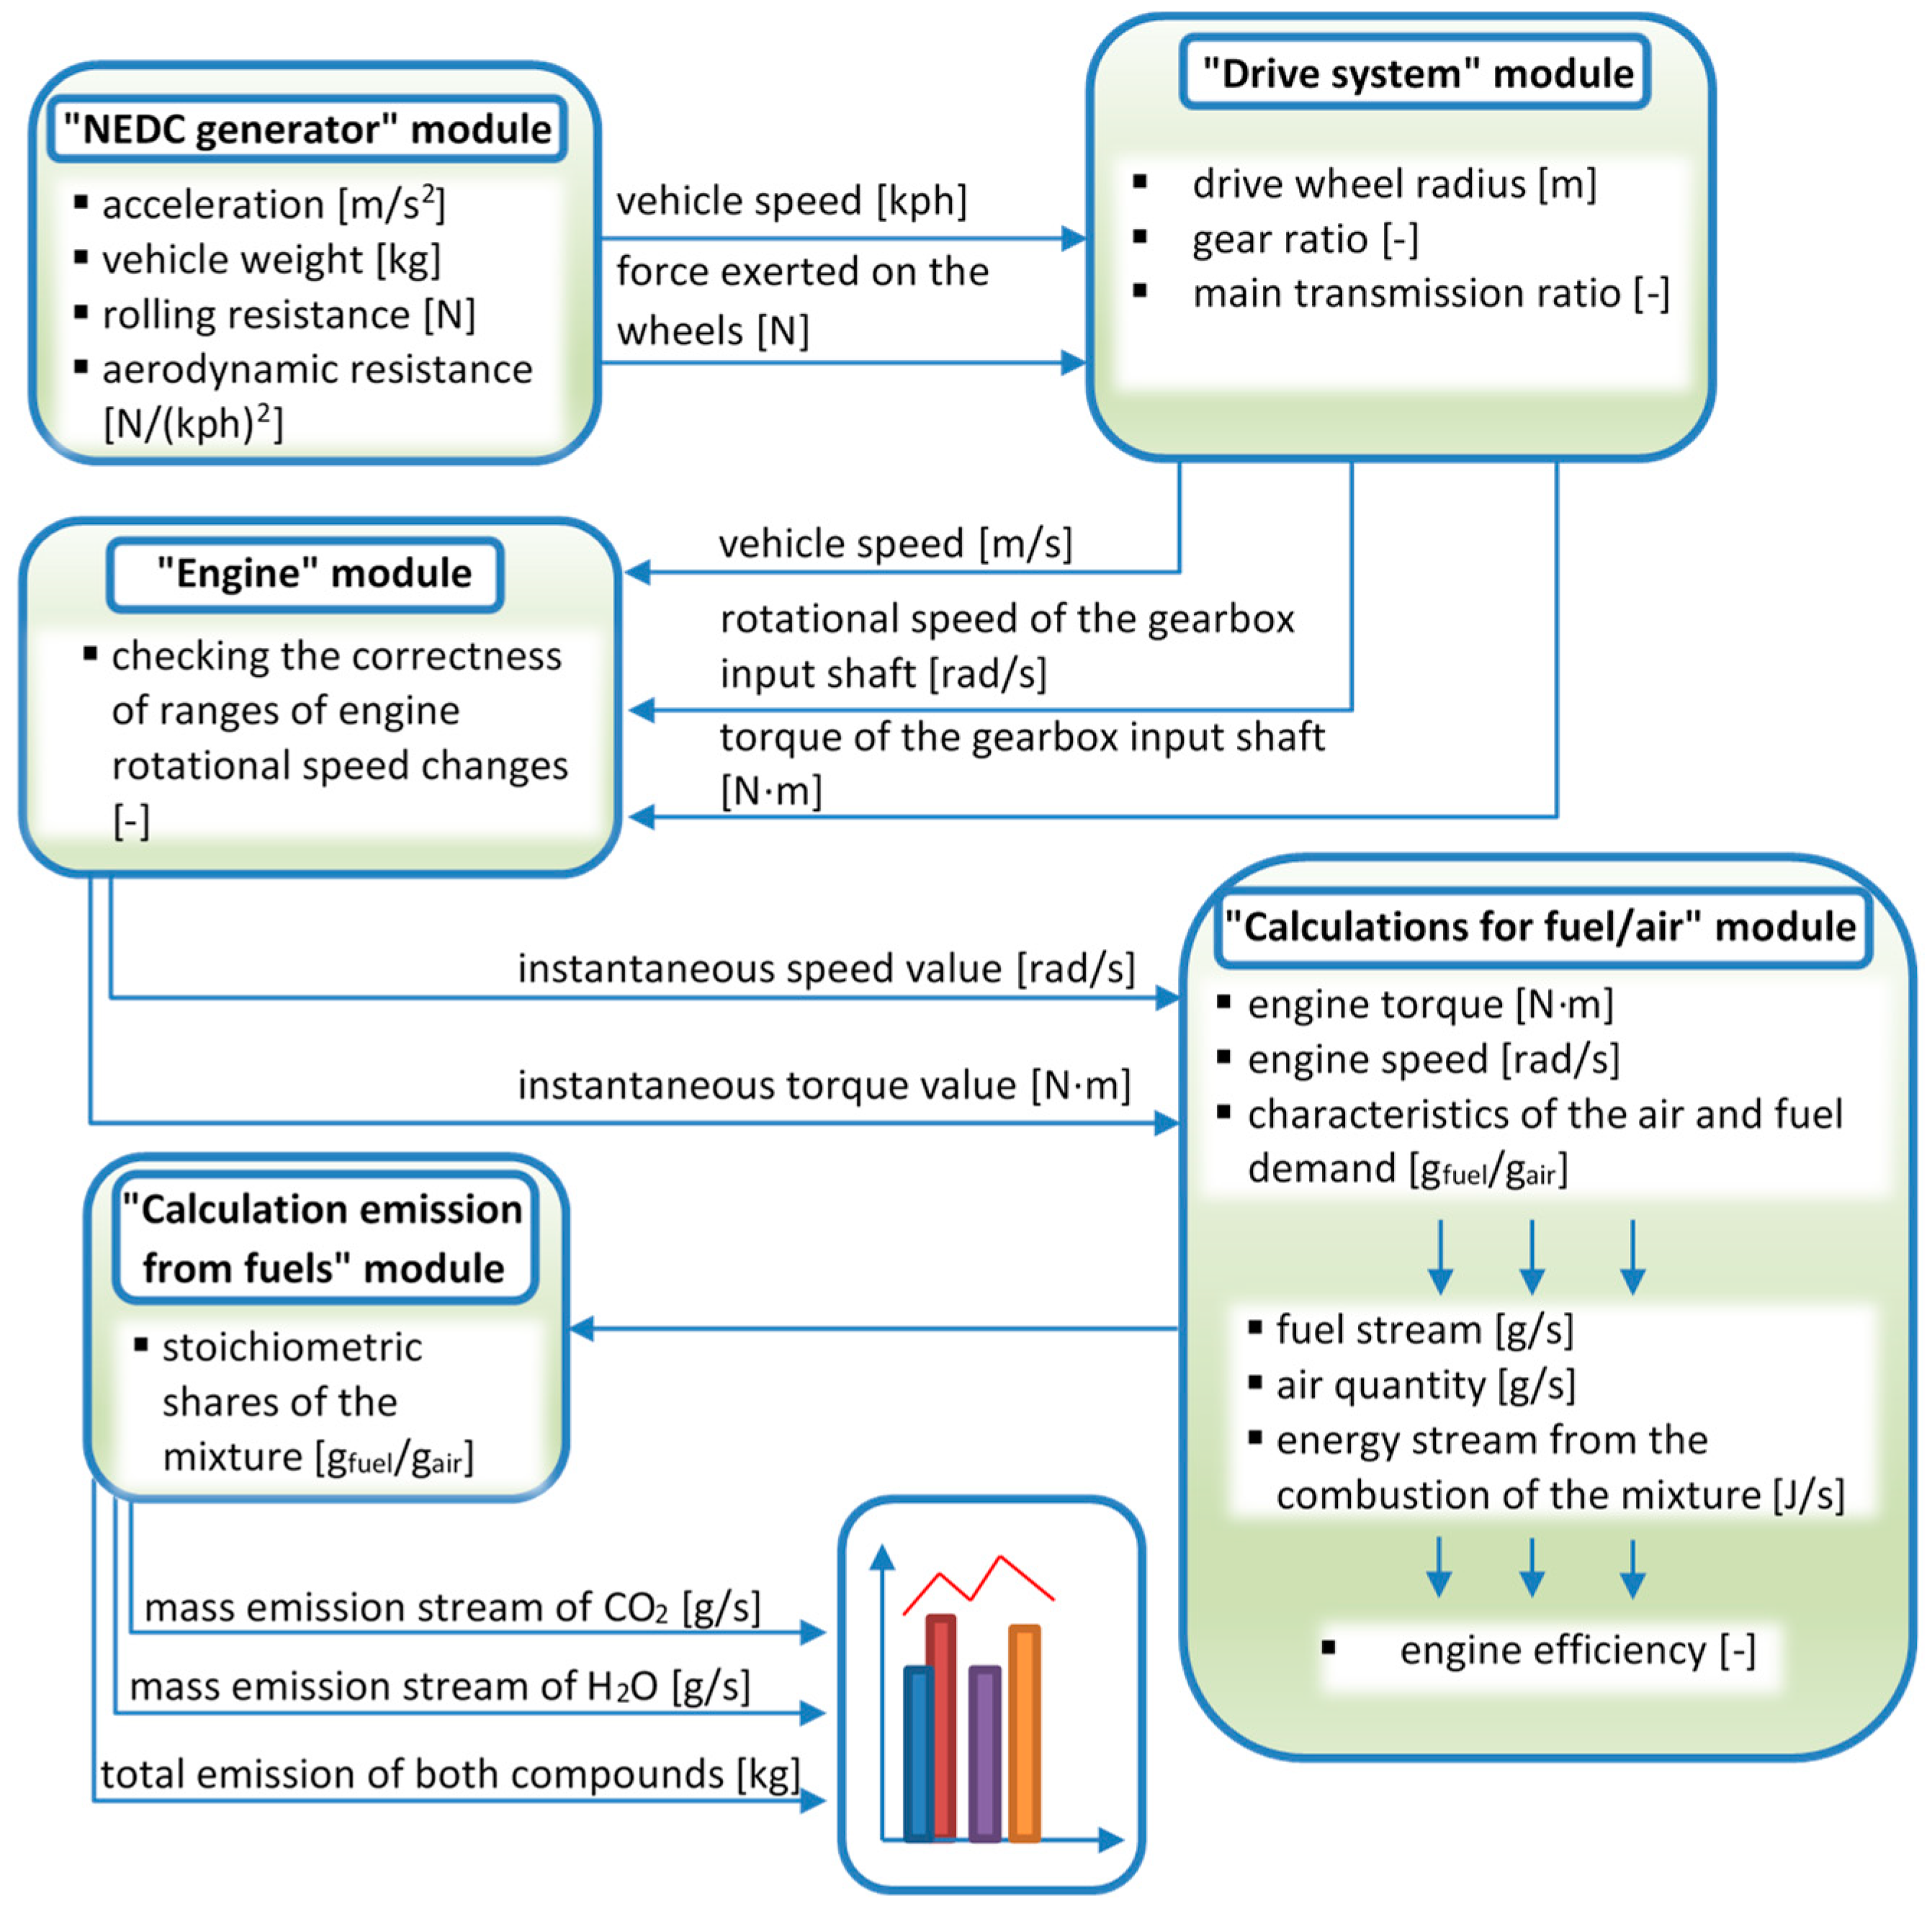
The diagram of the simulation model developed as part of the tests conducted is shown in Figure 1.
In order to correctly calculate the carbon dioxide emission values for the vehicles included, it was necessary to take into account their technical parameters and dependencies occurring during the test. It was also necessary to develop a module that would provide parameters characteristic of the NEDC driving test. The input data applied to the model was adopted based on the parameters of the actual test bench for the measurement of diesel emissions. The simulation model, therefore, consists of 5 modules, which are described below.
2.3.1. The Module “NEDC Generator”
Based on the information provided about the vehicle acceleration, computational mass, air and rolling resistance for each vehicle, this module generates signals characteristic of the NEDC test, such as vehicle speed [m/s] and force exerted on the wheels [N] (Table 4).
Calculations of vehicle accelerations were carried out using a differentiating element.
Then, based on the parameters specified for driving tests, and being adequate for the selected vehicle, load values are calculated that result from the vehicle’s movement. In addition to the load associated with the vehicle’s resistance to motion, the simulation also calculates the load that is a consequence of the efficiency of movement in the driving test. Then the calculated load values are added together and forwarded to subsequent modules. This block also calculates the amount of energy flowing between the brake rollers loading the vehicle. Next, the total value of energy send to the brake rollers, as well as taken from the roller device is calculated.
The values calculated during the simulation correspond adequately to the power and energy transferred by the engine to the load as well as the power and energy needed to brake the vehicle at the roller stand in the braking system.
2.3.2. The Module “Drive System”
The module, based on the data on the radius of the driving wheels, the range of gear ratios and the main transmission, provides signals such as the speed at which the vehicle moves [m/s], the speed of the gearbox input shaft [rad/s], torque of the gearbox input shaft [N·m] (Table 5).
2.3.3. The Module “Engine”
This module checks whether the values calculated in the previous part are within the acceptable range of engine speed variations. If there is compliance with the next part of the simulation, the instantaneous values of the rotational speed [rad/s] and the torque [N·m] are transmitted.
In this block, the value of the idle speed value of 83.7 rad/s (800 rpm), corresponding to the principles of the vehicle’s engine operation, is determined according to the following formula:
The limitation of the engine torque due to the use of the unit fuel consumption characteristic for the selected engine allowed the removal of the negative values of the torque acting on the vehicle’s transmission, which correspond to the braking process of the vehicle in the test by the engine or braking system.
2.3.4. The Module “Calculations for Fuel/Air”
In this part, fuel consumption is calculated based on the torque and rotational speed data. This module includes universal characteristics and demand for fuel and air as a function of the torque to the angular speed of the motor [77,93].
On the basis of the speed and torque values and the aforementioned fuel consumption characteristics, the instantaneous value of the fuel stream is determined [J/s].
By obtaining the value of the fuel stream and using the value of air demand, the amount of air necessary for the appropriate fuel-air mixture combustion process is then determined. Then, the energy flow which is supplied by the fuel used was determined, taking into account the heating values of petrol 95 and diesel fuel respectively. In the next step, the module calculates temporary engine efficiency values η [-].
On the basis of all the above data, cumulative values of fuel and air consumed during the whole test are determined, using integral modules.
2.3.5. The Module “Calculation Emission from Fuels”
The last part of the numerical model is responsible for determining the emission of carbon dioxide and water vapor for each engine, depending on the fuel used. On the basis of the implemented stoichiometric proportions of the mixture, the module does calculations for a specific fuel.
An extensive description of the simulation model was placed in order to facilitate familiarization with its construction and individual calculation stages. This is the main tool by which the results were obtained, therefore, a significant part of this section was devoted to demonstrating the reliability of the results obtained.
3. Results and Discussion
3.1. Computer Simulation of Driving Tests
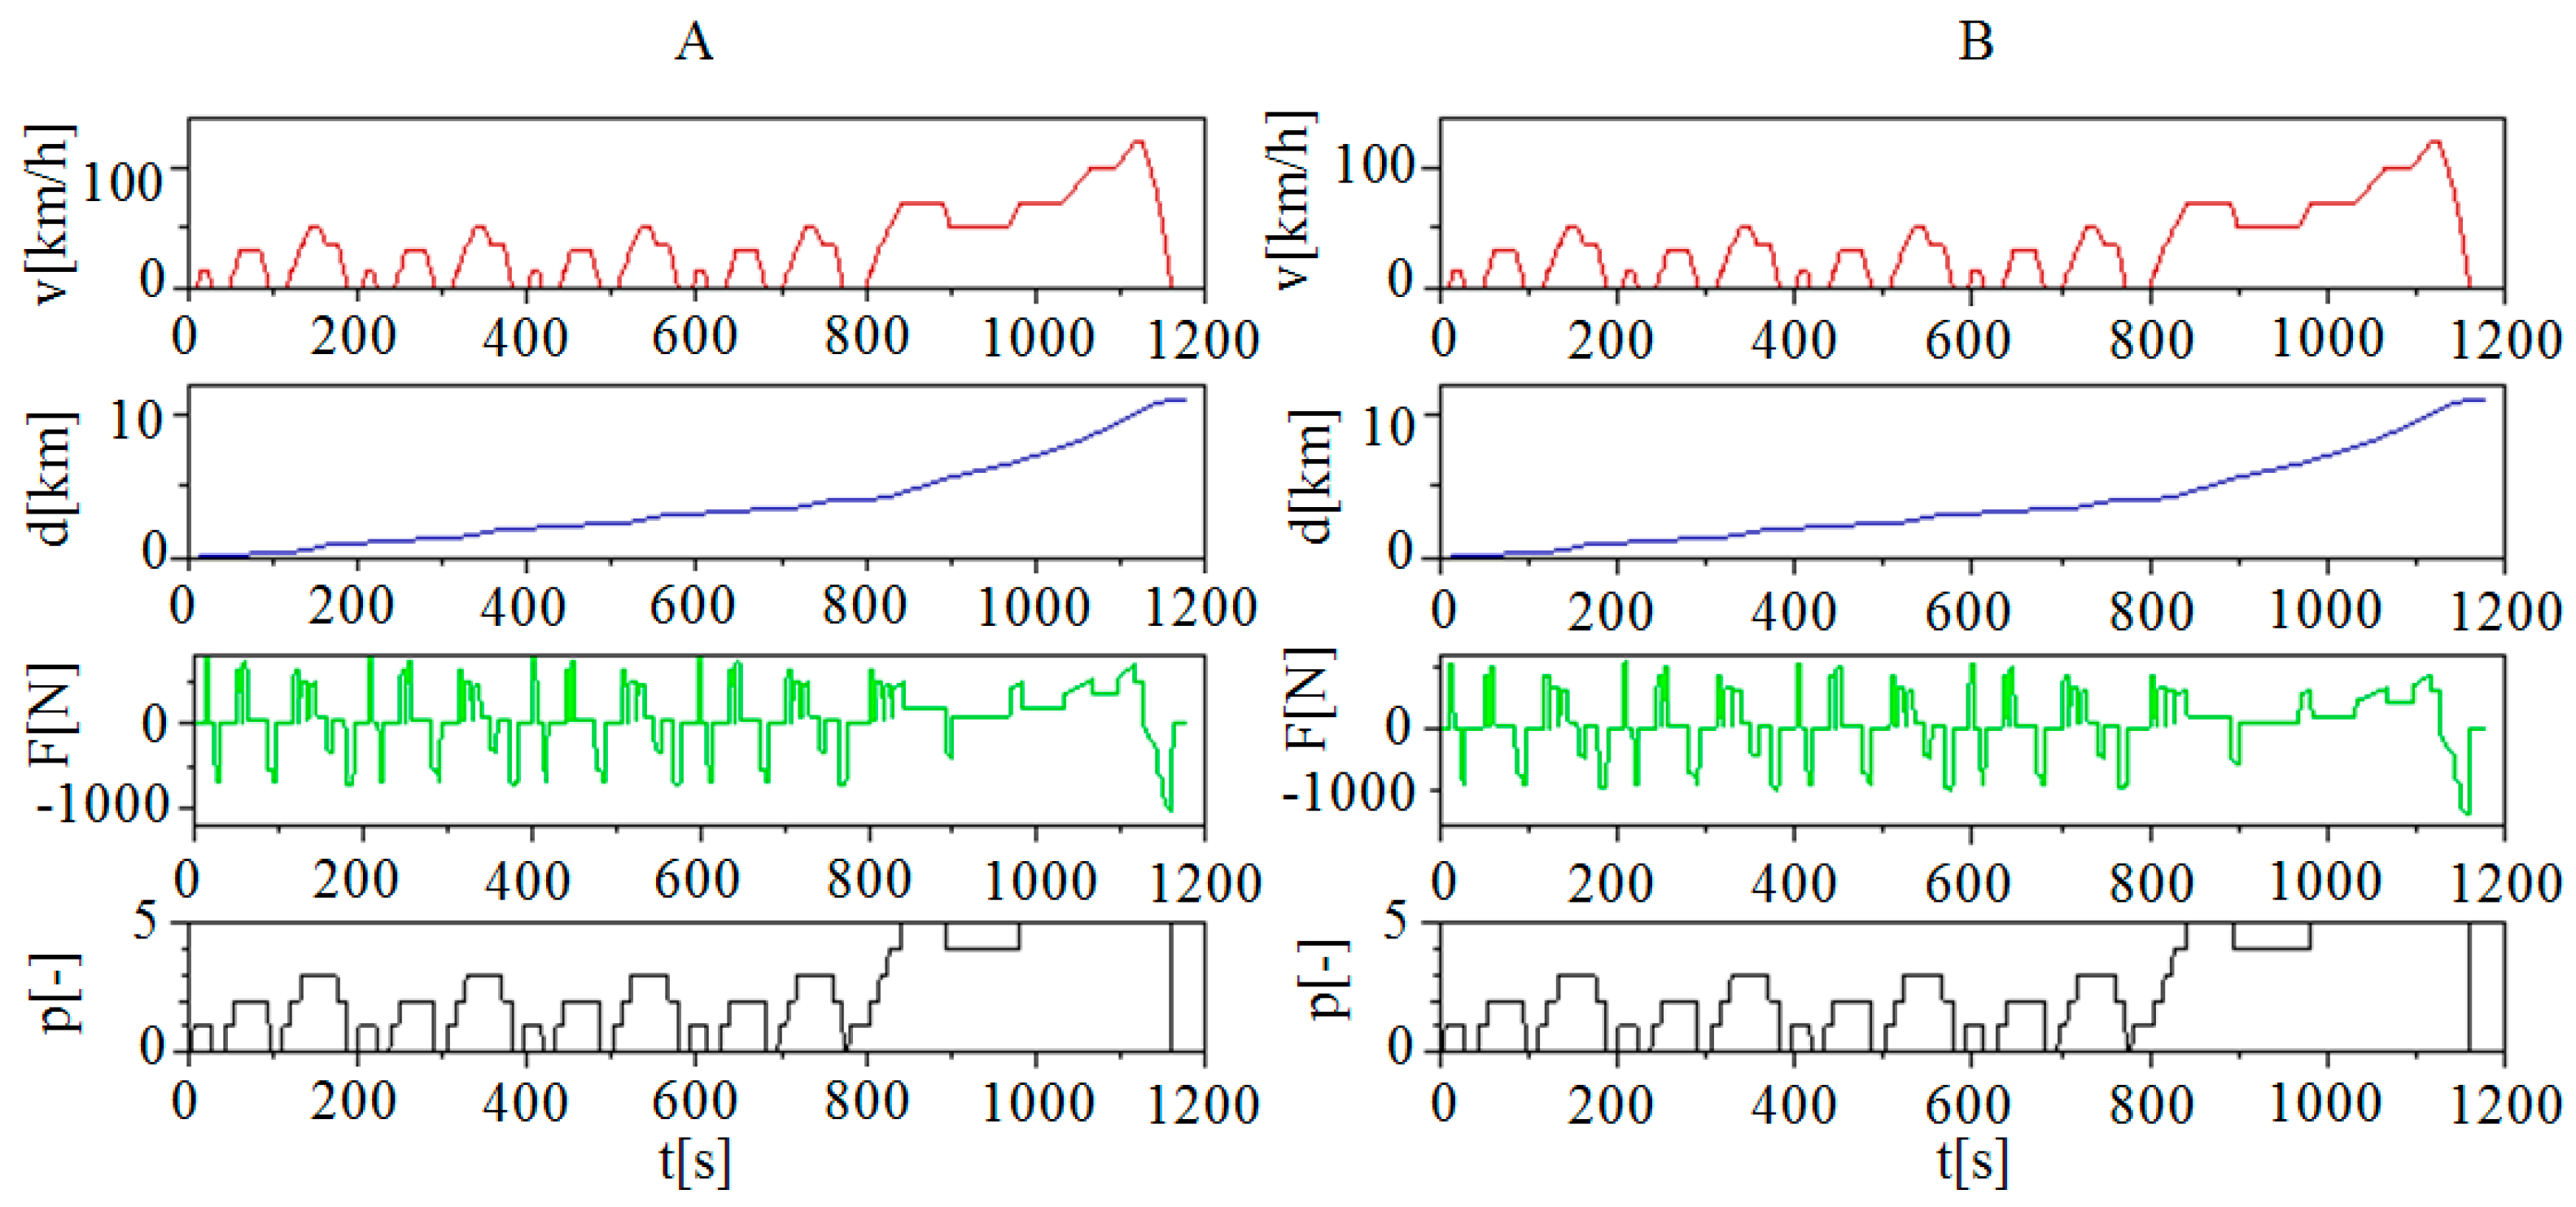
The developed simulation model was used to conduct an experiment of two different engine types, according to the NEDC test procedure, while feeding different types of fuels. Figure 2 shows the results of the operation of the “NEDC generator” block, on the basis of which the following waveforms can be seen: v-vehicle speed, d-distance travelled by the vehicle during the test, F-force exerted on the wheels and p-gear number in the gearbox.
The correctness of the entire model depends on the course of the above signals. It was found that the courses are consistent with literature data, and that at this stage, there are no differences (deviations) depending on the simulated engine type.
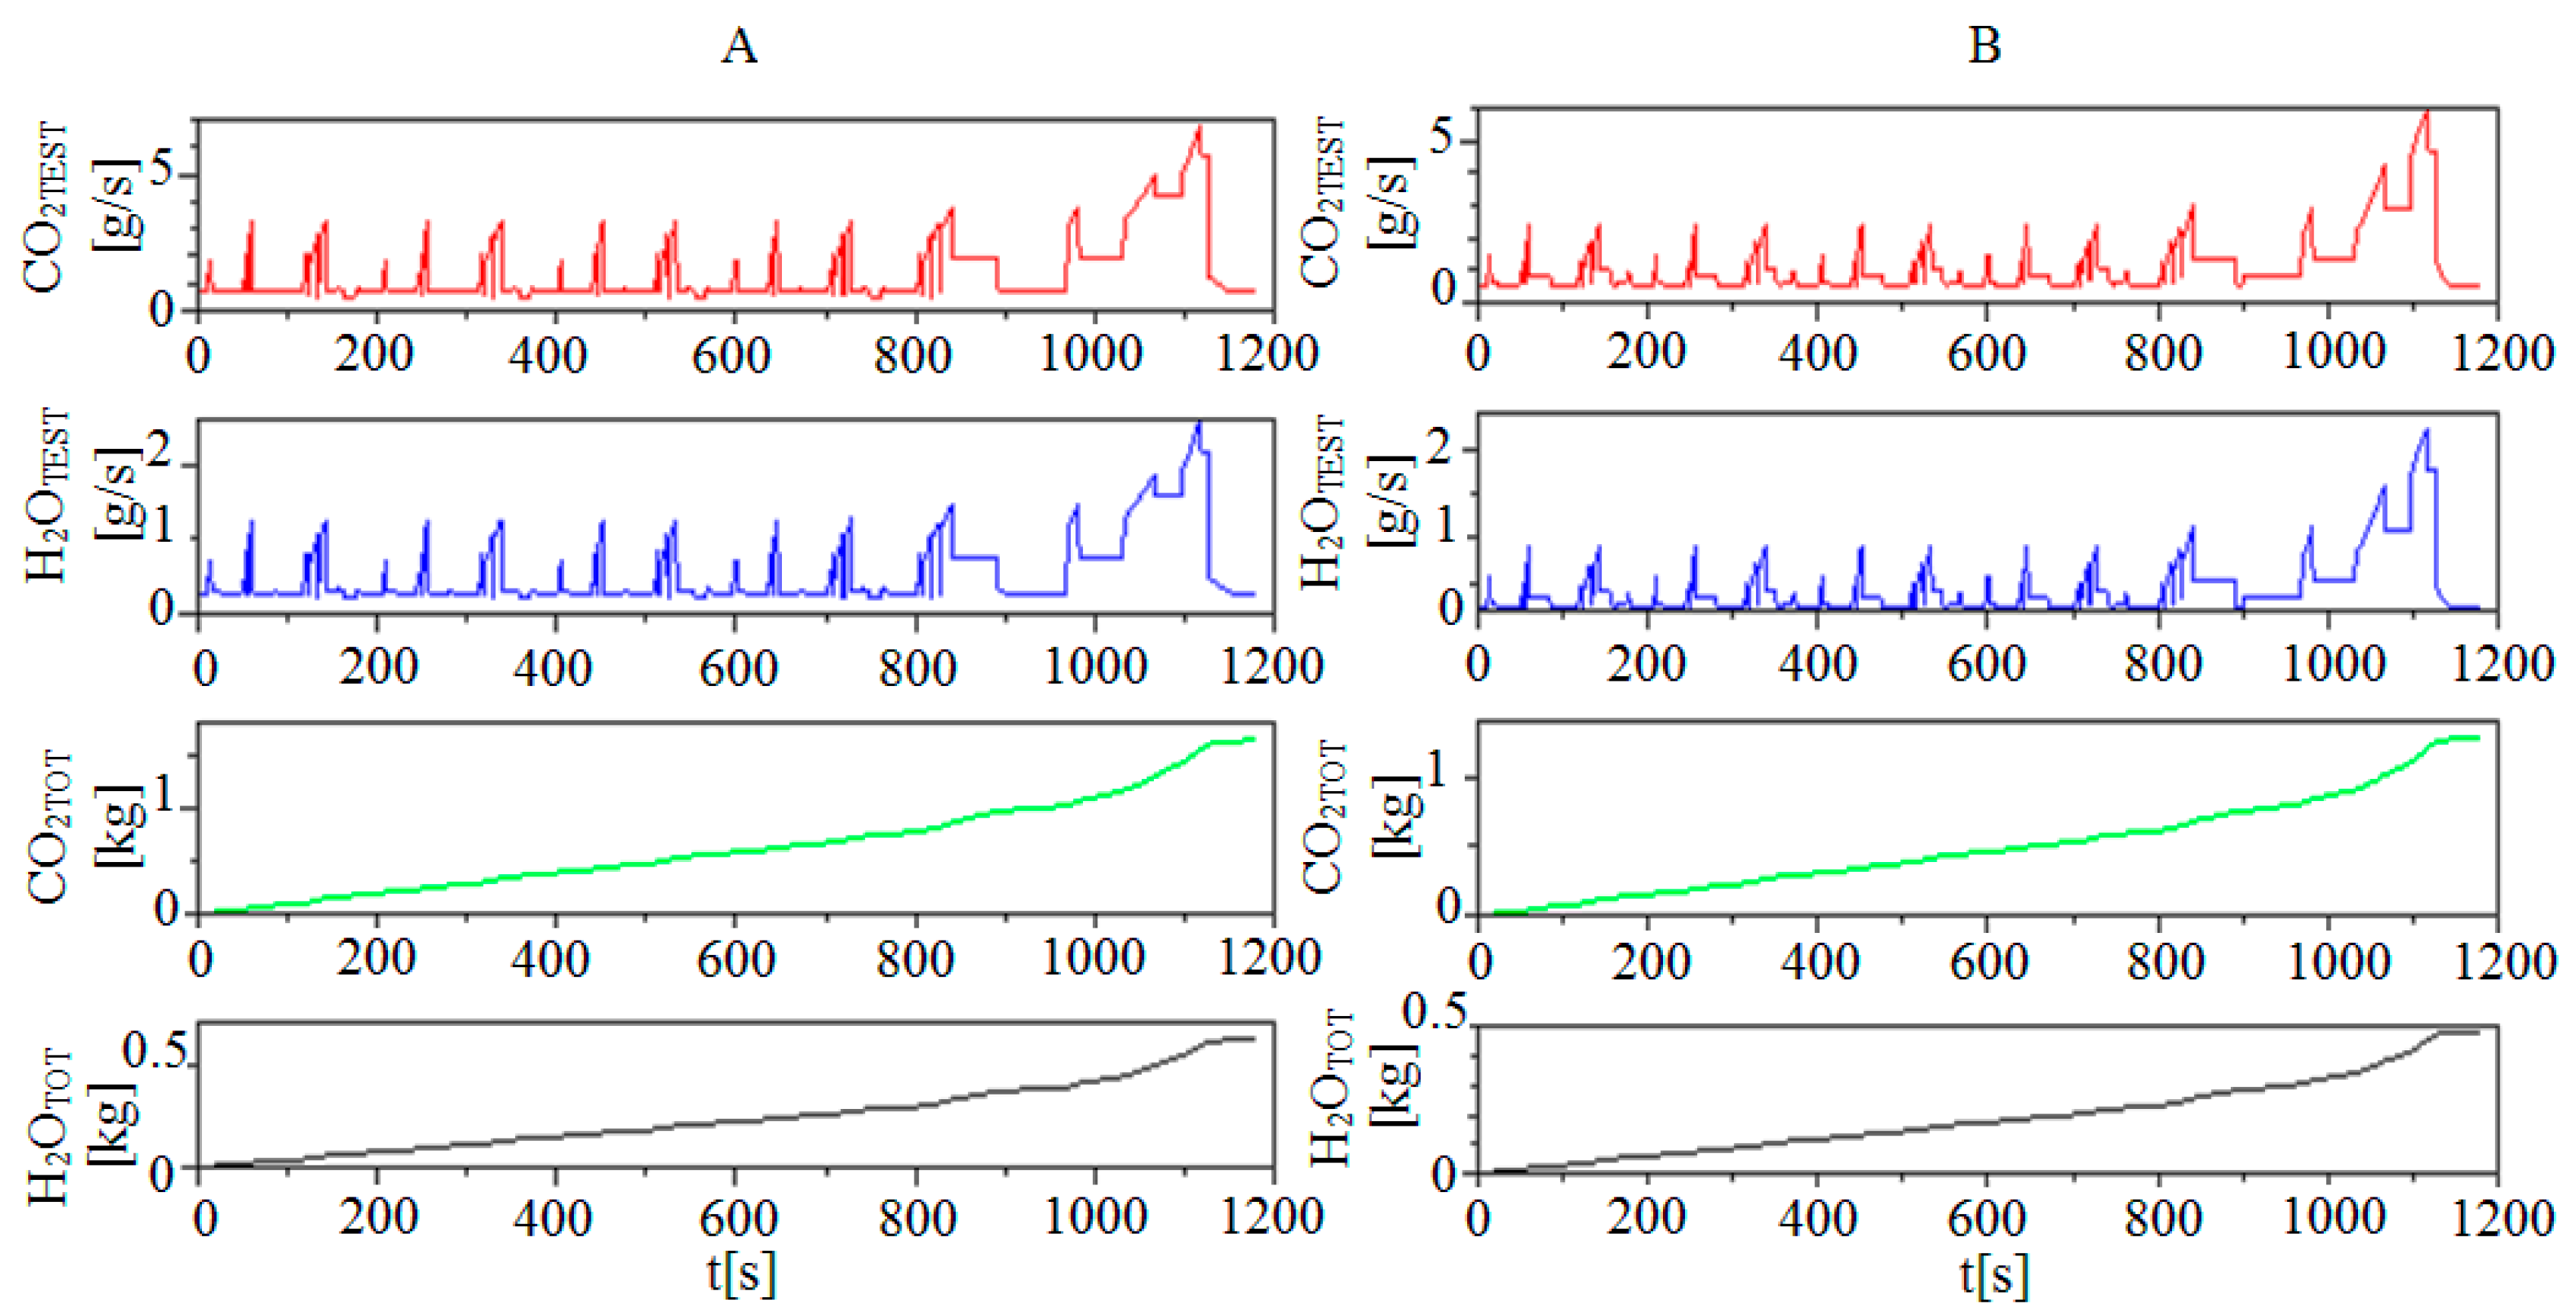
Figure 3 summarizes the results of the “Calculation emission from fuels” module, which was responsible for determining carbon dioxide and water vapour emission in the test. The graphs show CO2TEST—mass emission stream of carbon dioxide during the test, H2OTEST—mass emission stream of water vapour, and CO2TOT—total carbon dioxide emission and H2OTOT—total emission of water vapour from petrol 95 and diesel. Indexes were intentionally introduced to distinguish between mass streams of substances (TEST) and total emissions of substances under consideration (TOT).
On the basis of the above graphs, slight differences in the mass emission of carbon dioxide and water vapour for the discussed fuels can be observed. However, on the basis of the “total carbon dioxide emission” chart, it can be seen that more CO2 was emitted by the petrol engine.
Table 6 summarizes the detailed results in reference to the values obtained. The list includes the total carbon dioxide and water vapour emissions for the individual fuels.
On the basis of the table above, there are differences in the emission of the indicated compounds in favour of diesel and its alternative fuel. During the test, the diesel engine emitted more than 17% less carbon dioxide than the petrol engine. However, the FAME fuel turned out to be more emissive in relation to conventional fuel, in terms of both carbon dioxide and water vapour. The difference is about 7% CO2 and 6% H2O, respectively. In the case of petrol and its substitutes, the conventional fuel, with its CO2 emission values, ranked in the middle of its own alternatives. Butanol and ethanol demonstrated a lower emissivity (15% and more than 7% less CO2 in the test, respectively), while dimethyl ether DME provided about 2% more. In the case of water vapour, the emission value, in comparison with conventional petrol, was higher by approx. 20% for ethanol and 26% for DME, respectively, while for butanol, it was lower by approx 12.5%.
The subject of consideration in this manuscript is carbon dioxide. Focusing on its emissions from the fuels under consideration is closely related to the environmental policy of the European Community and its Member States based on radical actions aimed at limiting emissions of this factor, perceived as the main cause of global warming. Complementing the results with the value of water vapour emission was to indicate the relationship between the content of hydrogen and oxygen in the fuels and the amount of emitted component. A higher content of these elements in the elementary composition results in a higher emission of water vapour in the exhaust gases. According to current knowledge, water vapour is indifferent to the climate. To date, no one has paid attention to the harmful effects of increased water vapour content on the corrosion processes of exhaust system components in the literature. This is particularly important in the winter season for the Polish climate zone. This leads to condensation of the water vapour contained in the exhaust gases and in the presence of incomplete hydrocarbon combustion compounds to accelerated corrosion of these elements.
The results presented in Table 7 is a direct emission resulting in the completion of the NEDC test procedure. When calculating the “ecological effect”, i.e., the reduction potential of biomass and biofuels, often earlier stages from the life cycle of a given raw material are taken into account, such as “CO2 capture” (e.g., photosynthesis cycle in plants), i.e., limiting carbon dioxide before the product has been converted into biofuel. It should be mentioned that the NEDC approval test does not take into account the life cycle of the fuel used, hence, direct emissions were used for the analysis. Simulation refers to the behavior of a particular engine during a given travel test when running on a particular fuel. In order to refer to existing CO2 emission limits, the results obtained were converted into a comparison unit (g/km) and compared to the permissible levels of these components, as set out in the relevant standards. On this basis, it was estimated whether a given power unit could obtain entry into service on the basis of this criterion.
A CO2 limit of 170 g/km was adopted for petrol. According to Table 2, this limit was in force in 2003, whereas the Fiat Seicento vehicle in question was manufactured in 2002. For Fiat Panda, the limit was set at 130 g/km because its production date is 2015. Despite the differences in carbon dioxide emissivity from individual fuels, each type of fuel is within the acceptable range of values. According to the adopted postulates on reducing greenhouse gas emissions, such solutions should be chosen that will reduce negative emissions.
3.2. LCA Analysis for the Vehicles in Question
The analysis served to supplement the research results with the impact of biofuels on carbon dioxide emissions from the vehicles in question in the context of their entire life cycle. As defined in the ISO 14040 standard, the Life Cycle Assessment (LCA) method is used to assess environmental aspects and potential environmental impacts throughout the product’s lifetime. It is also one of the techniques that has an impact on environmental management. The correct interpretation of the results obtained may have a strong impact on further handling of the considered object, such as marketing activities, social policy, product development and improvement in the long run.
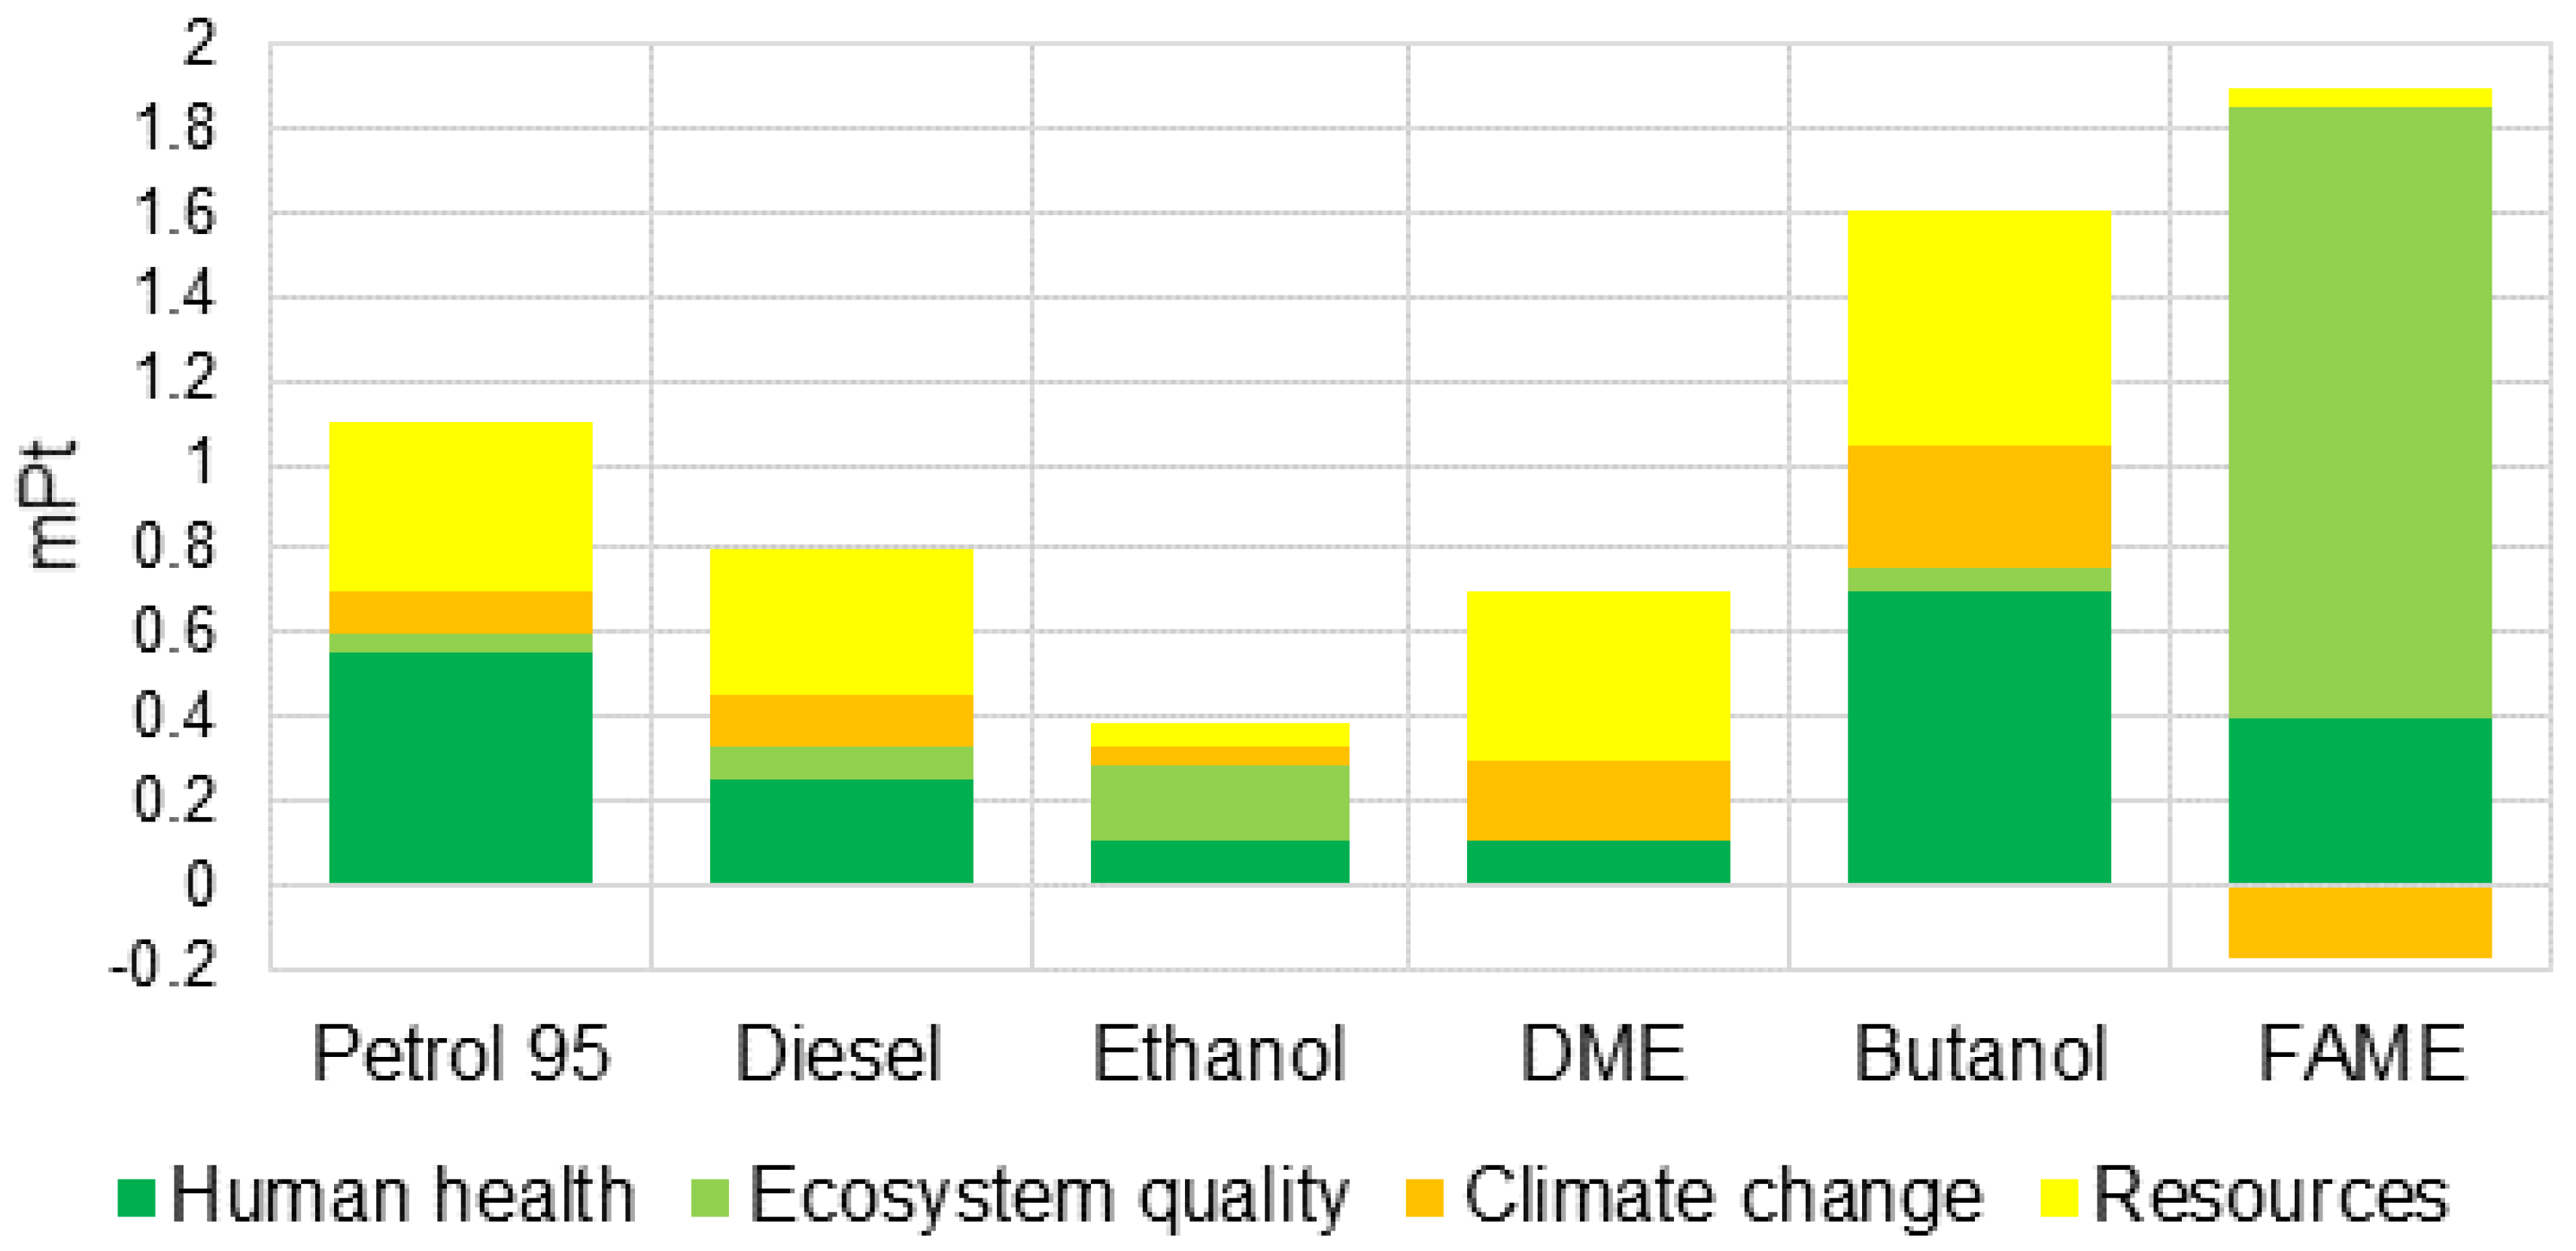
The LCA analysis was performed in three stages. SimaPro ver. 9.0.0.48. This environment is fully compliant with the requirements of ISO 14040. This is a professional tool enabling the analysis and monitoring of information related to sustainable development. It is a source of scientific information that allows a transparent and quick analysis of materials and processes in terms of assessing their life cycle. Using the SimaPro package, one can model and analyze complex life cycles in a systematic way, measure the impact of materials and processes on the environment, and analyze individual stages of the life of the tested objects. SimaPro uses the Ecoinvent 3 database containing high quality data relating to Central European and Swiss conditions. First, the impact of unit production of selected fuels on aspects such as “human health”, “ecosystem quality”, “climate change” and “resource” as well as carbon dioxide emissions during these processes were determined. The analysis was performed using the built-in IMPACT 2002+ method. It allows to determine the impact of the process or object under consideration on the environment and human health. It is based on modern methods to conduct a comparative assessment of the scale of toxicity for both human and ecosystems. Figure 4 shows the results of the analysis for the fuels under consideration. The indicator unit is mPt.
Based on the analysis using the IMPACT 2002+ method, it can be seen that the fuel with the largest range of impact on the indicated areas are fatty acid methyl esters. The quality of ecosystems has the greatest impact during production. It is somewhat related to obtaining them from oil plants, whose cultivation requires transformation, development and cultivation of land. It is worth noting, however, that this fuel has a beneficial effect on climate change. This is due to the absorption of carbon dioxide and other substances by the plants from which it is produced. In a broader sense, biomass and plant biofuels are treated as zero-emission, assuming that the amount of substances emitted during combustion was absorbed during the development and life of the plant from which the fuel was obtained. In the second place, the fuel with the greatest impact was butanol, which interfered the most in human health and raw materials. Ethanol was the least invasive. Gasoline in this ranking turned out to be more harmful than its alternative counterparts, while classic diesel oil in the production process showed less impact on the areas in question.
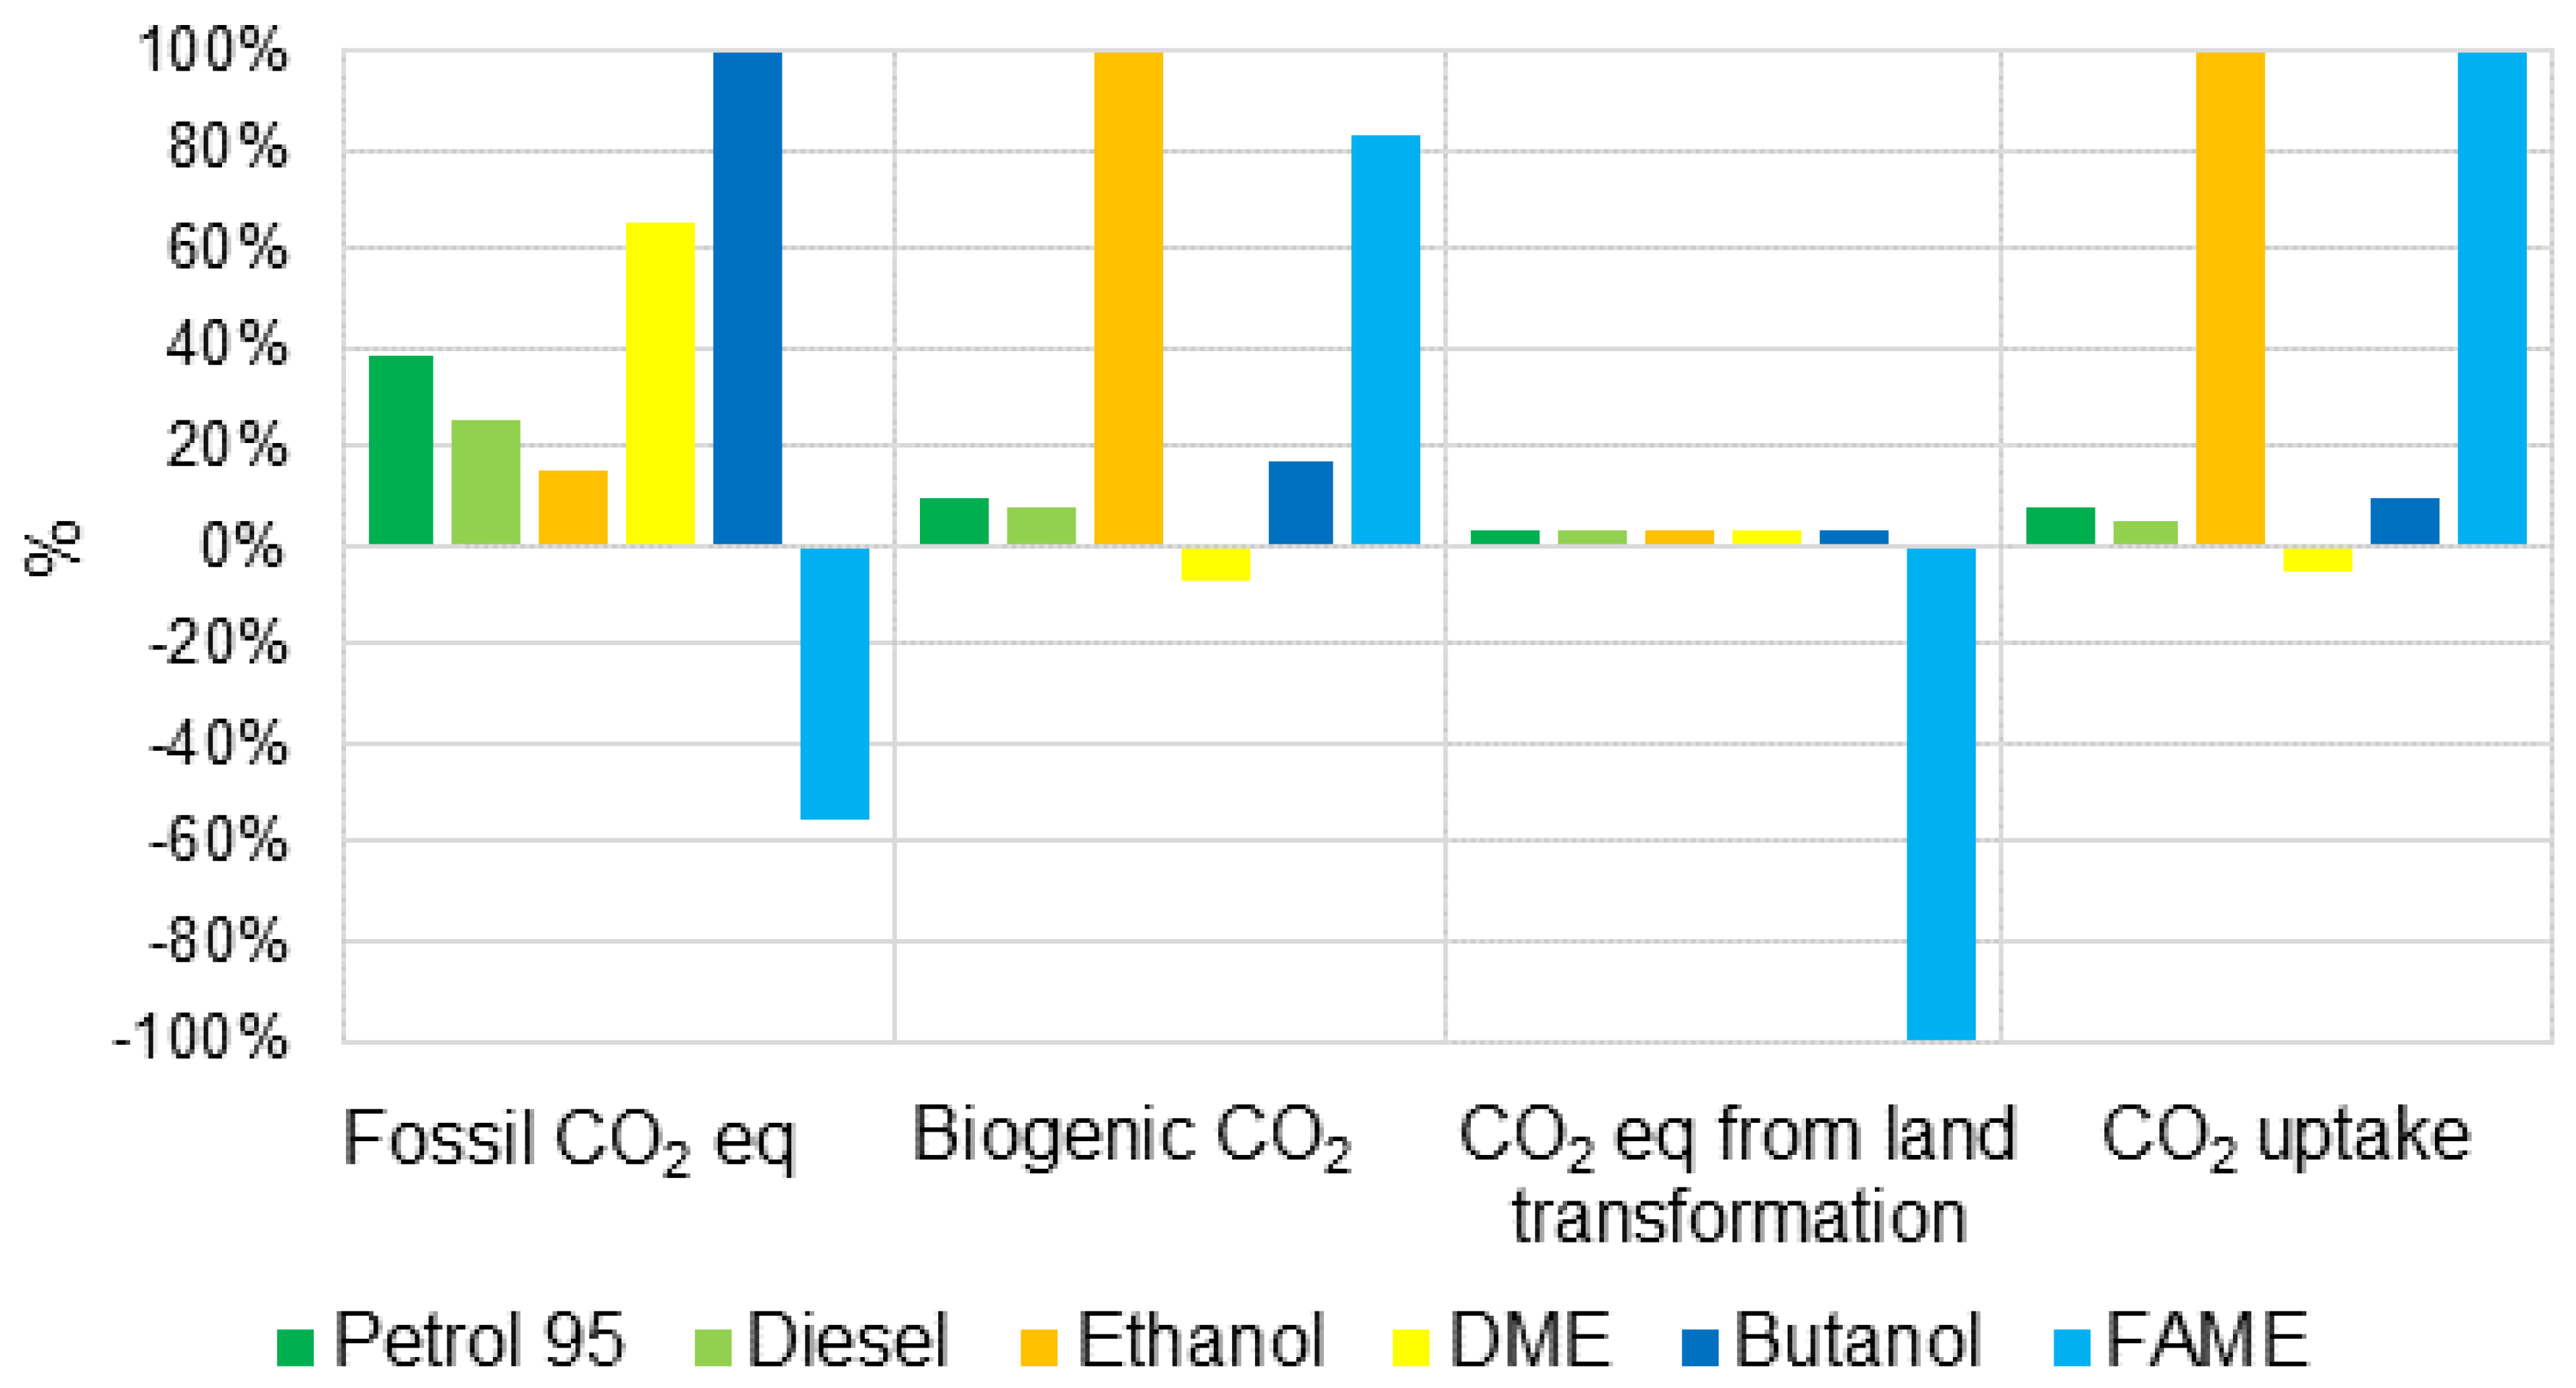
As a further step in the analysis, the Greenhouse Gas Protocol method was used, which provides information on carbon dioxide emissions in accordance with the greenhouse gas emissions protocol. The results were divided into four categories: “Fossil CO2 eq” or emissions from fossil fuels, “Biogenic CO2 eq”—emissions from biogenic sources such as trees or plants, “CO2 eq from land transformation”—emissions resulting from land transformation (impact direct) and “CO2 uptake”—the capture of carbon dioxide in a given process.
Figure 5 shows the results of the GGP method for the fuels under consideration.
The analysis based on the Greenhouse Gas Protocol method shows that the fuel with the most favorable properties in terms of emissions during the production process is FAME fuel. It does not generate carbon dioxide from fossil raw materials and has a high degree of CO2 absorption. Ethanol (of wood origin) is also characterized by a high level of carbon dioxide absorption. Butanol produces the highest carbon dioxide production from fossil fuels (however, hydroformylated butylene propylene was adopted, what might be responsible for the result). Conventional fuels remain balanced. Interestingly, their carbon dioxide emissions appears lower than their alternative counterparts.
In the last stage, the CO2 emission value for the production of the reference fuel unit (from the Greenhouse Gas Protocol method) was taken into account and combined with the results obtained from the simulation (fuel combustion). As a result, it was possible to determine carbon dioxide emissions from the cars in question, taking into account the life cycle of the fuels used.
The data used in the last stage of the analysis are summarized in Table 8.
The service of life car was adopted according to the LCA analysis performed for its cars by a leading manufacturer of commercial vehicles [94,95]. In addition, a literature review confirms that the value of 150,000 km is in accordance with ISO 14044 [96,97].
In the available literature, ready reference emission values are often used for similar analyzes based on type approval driving tests, which makes the tests highly theoretical. Emission levels obtained from simulations have been implemented for the purposes of this analysis, making them more reliable and better able to assess the life cycle of given fuels in the context of the vehicles in question.
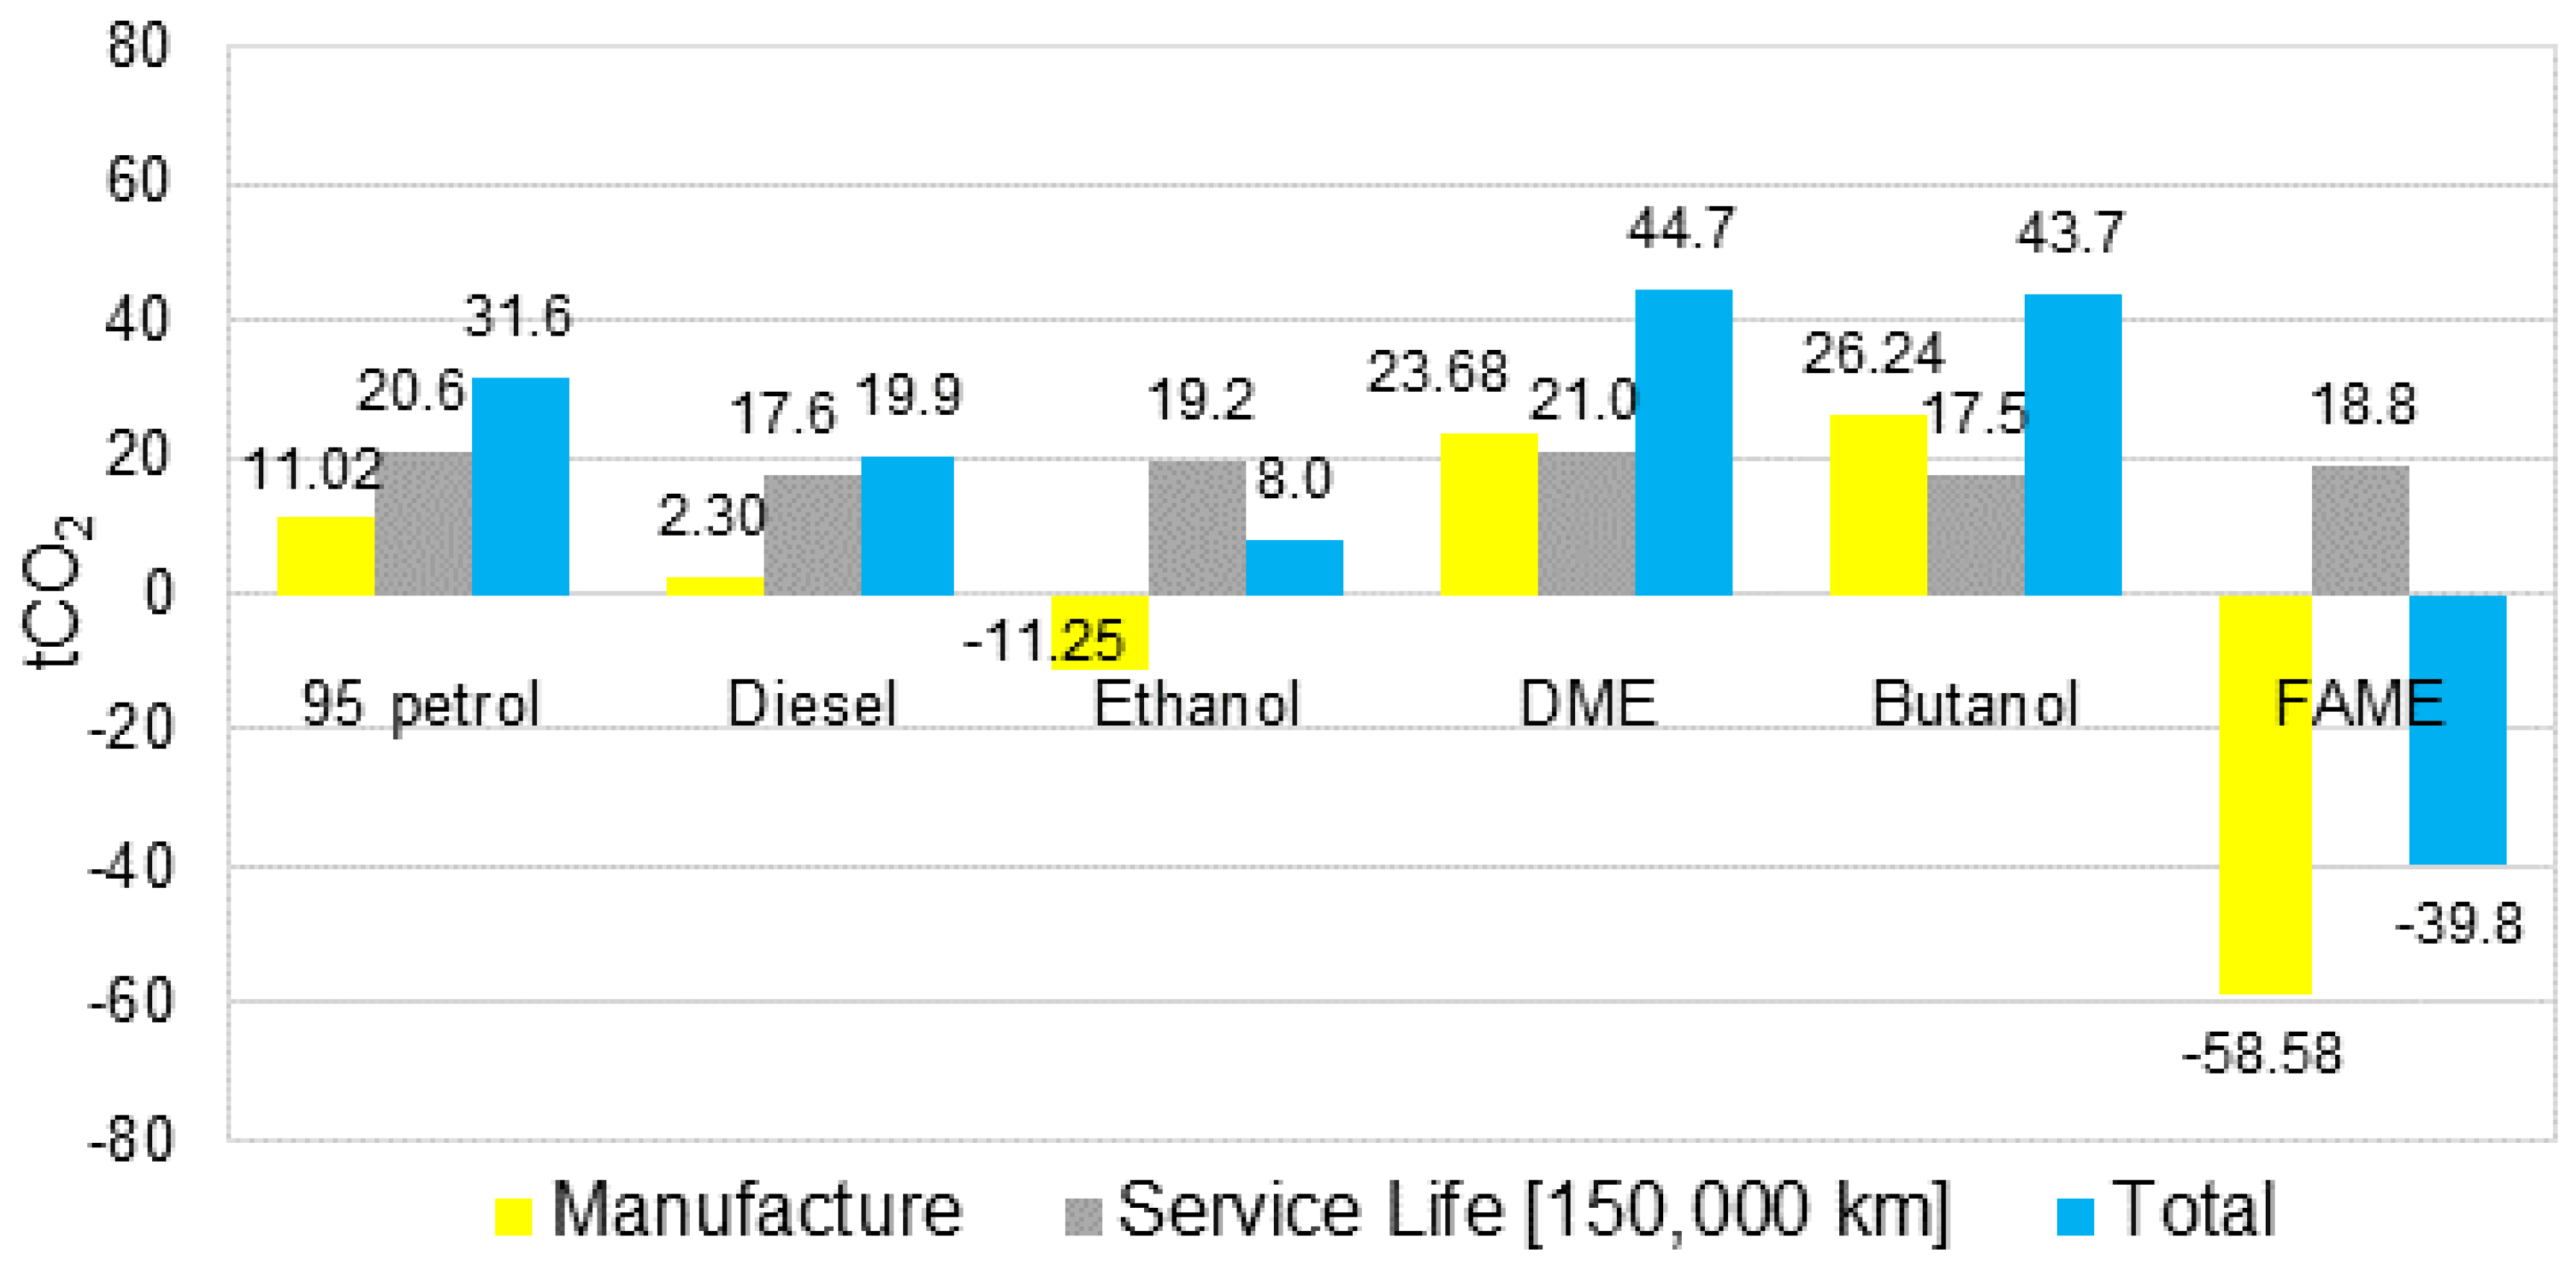
The results of the analysis of carbon dioxide emissions in the context of the fuel life cycle are shown in Figure 6.
Figure 6 shows that each fuel has different emissions depending on its life cycle. After taking into account the emission data resulting from the fuel life cycle, the final results are summarized in Table 9.
Dimethyl ether DME has the greatest potential to increase the greenhouse effect, which is a premise to stop using it as an alternative fuel. Its total emissions exceeded the value for gasoline, which is conventional fuel for it.
High emissions result from high emissions at the production stage. In addition, the DME has a high carbon content in the elementary composition and one of the lowest calorific values, which requires a higher consumption of this medium to meet the energy requirements of the engine.
FAME fuel showed the lowest total emissions, achieving more favorable values than both conventional fuels and other biofuels. The most popular replacement for classic gasoline (ethanol) in the overall balance will achieve lower emissions than conventional carriers, while the alternative to diesel (butanol) has outperformed diesel emissions.
4. Conclusions
The following conclusions were drawn on the basis of the conducted research:
- Having compared the results of the simulation, petrol turned out to be the fuel with a higher emission of carbon dioxide. Conventional diesel will provide about 17% less CO2
- In the case of a comparison of diesel fuel with its alternative fuel FAME, the biofuel showed a higher content of carbon dioxide (in the direct emission) by about 7% therefore. However, taking into account the life cycle of this fuel, its emission balance is negative, so it will absorb more carbon dioxide during production than it produces in the combustion process.
- For petrol and its substitutes, the lowest value of emitted dioxide (in direct emission and lca) was found in ethanol, while dimethyl ether DME provided more CO2 than conventional petrol 95.
- Butanol turned out to be less emissive in carbon dioxide than traditional petrol by more than 15%. However, after taking into account CO2 emissions generated in the production process, this fuel did not look very favorable.
- Despite the differences in emissivity, each fuel that participated in the test procedure was within the limits setting the maximum CO2 values allowed by the regulations
- The fuel with the highest reduction potential in the range of carbon dioxide (in direct emission) is butanol, however, its process generates a significant amount of CO2. It is worth considering its production from plant raw materials, thanks to which this emission in the overall balance would be much lower.
- The developed simulation reflects the work cycle of actual engines powered by different fuels and can be a helpful tool in the process of planning experiments or a valuable data source, helpful in further considerations. The simulation model is universal and can be used to evaluate various engines and fuels with various properties, making it a useful tool with a wide range of use.
The vehicles analysed are certainly not suitable for 100% alternative fuels. Therefore authors in their research utilized computer simulations. In the currently conducted research, the results of which are prepared for publication by the authors, the maximum content of methanol in the mixture with petrol, which did not require any interference with the regulatory settings of the car, was about 85% [kg of methanol/kg of mixture]. Further increase in methanol already caused instability in the motor’s operation.
High levels of reduction of carbon dioxide emissions into the atmosphere adopted by the European Union require consistent and integrated actions in order to be achieved. Sustainable solutions should also be introduced in the transport sector. The research conducted for this paper shows that especially in the case of petrol, it is possible to choose a substitute fuel with similar properties, which will additionally bring a beneficial effect for the reduction of greenhouse gases.
The analysis of fuel emissivity using the LCA method gives a broader view on the fuels under consideration. It is considered an important element of decision-making processes in the selection of a product that reliably balances the total emissions incurred in connection with the production and use of a specific product. Even if the direct combustion of a given carrier will have a relatively low value of carbon dioxide emitted, it may turn out that at the production stage the emission and energy consumption of processes is so high that, despite the low direct emission, the overall ecological effect is negative and the use of a given fuel will negatively affect the natural environment.
At the current stage of the model development being presented in the article, the authors decided to use standard vehicle speed courses as required for NEDC driving tests, repeatable operating parameters of the tested vehicle and repeatable fuel parameters. It follows that the model is deterministic. The model generates the same simulation results for a given set of input variables. The simulation results obtained for individual fuels showed high compliance with real conditions, however, they do not contain the random nature of real objects. The authors in the next stages of development of the exhaust component model plan to expand the calculation algorithms that would introduce the possibility of taking into account the following: the randomness of the physico-chemical parameters of pile mixtures, the randomness of operational parameters and the randomness of the NEDC drive test process itself. The results obtained then will have the feature of a random variable for which we will be able to perform statistical tests.
Author Contributions
Conceptualization, K.T., R.M.; Methodology, O.O., K.T., R.M.; Investigation, O.O., A.Ś.; Writing—original draft preparation, K.T., O.O., K.B.; Validation, A.Ś., K.T.; Funding acquisition, A.Ś.
Funding
The authors wish to express gratitude to Lublin University of Technology for financial support given to the present publication (Antoni Świć). The research was carried out under financial support obtained from the research subsidy of the Faculty of Engineering Management (WIZ) of Bialystok University of Technology. From the grant No. WZ/WIZ/4/2019 (Olga Orynycz).
Conflicts of Interest
The authors declare no conflict of interest. The funders had no role in the design of the study; in the collection, analyses, or interpretation of data; in the writing of the manuscript; or in the decision to publish the results.
References
- Mauerhofer, V. Legal Institutions and Ecological Economics: Their Common Contribution for Achieving a Sustainable Development. Ecol. Econ. 2019, 156, 350–359. [Google Scholar] [CrossRef]
- Heldeweg, M.A. Legal regimes for experimenting with cleaner production—Especially in sustainable energy. J. Clean. Prod. 2017, 169, 48–60. [Google Scholar] [CrossRef]
- Asr, E.T.; Kakaie, R.; Ataei, M.; Mohammadi, M.R.T. A review of studies on sustainable development in mining life cycle. J. Clean. Prod. 2019, 229, 213–231. [Google Scholar] [CrossRef]
- Bastianoni, S.; Coscieme, L.; Caro, D.; Marchettini, N.; Pulselli, F.M. The needs of sustainability: The overarching contribution of systems approach. Ecol. Indic. 2019, 100, 69–73. [Google Scholar] [CrossRef]
- Baleta, J.; Mikulčić, H.; Klemeš, J.K.; Urbaniec, K.; Duić, N. Integration of energy, water and environmental systems for a sustainable development. J. Clean. Prod. 2019, 215, 1424–1436. [Google Scholar] [CrossRef]
- Herran, D.S.; Tachiiri, K.; Matsumoto, K. Global energy system transformations in mitigation scenarios considering climate uncertainties. Appl. Energy 2019, 243, 119–131. [Google Scholar] [CrossRef]
- Energy and Economy. Electric Power Research Institute and Galvin Electricity Initiative. Available online: http://www.iiasa.ac.at/ (accessed on 28 April 2019).
- Kosowski, K.; Tucki, K.; Piwowarski, M.; Stępień, R.; Orynycz, O.; Włodarski, W.; Bączyk, A. Thermodynamic Cycle Concepts for High-Efficiency Power Plans. Part A: Public Power Plants 60+. Sustainability 2019, 11, 554. [Google Scholar] [CrossRef]
- Tucki, K.; Orynycz, O.; Wasiak, A.; Świć, A.; Wichłacz, J. The Impact of Fuel Type on the Output Parameters of a New Biofuel Burner. Energies 2019, 12, 1383. [Google Scholar] [CrossRef]
- Kosowski, K.; Tucki, K.; Piwowarski, M.; Stępień, R.; Orynycz, O.; Włodarski, W. Thermodynamic Cycle Concepts for High-Efficiency Power Plants. Part B: Prosumer and Distributed Power Industry. Sustainability 2019, 11, 2647. [Google Scholar] [CrossRef]
- Anifantis, A.S.; Colantoni, A.; Pascuzzi, S.; Santoro, F. Photovoltaic and Hydrogen Plant Integrated with a Gas Heat Pump for Greenhouse Heating: A Mathematical Study. Sustainability 2018, 10, 378. [Google Scholar] [CrossRef]
- Kupczyk, A.; Mączyńska, J.; Redlarski, G.; Tucki, K.; Bączyk, A.; Rutkowski, D. Selected Aspects of Biofuels Market and the Electromobility Development in Poland: Current Trends and Forecasting Changes. Appl. Sci. 2019, 9, 254. [Google Scholar] [CrossRef]
- Silva, C.A.M. Grid Electrified Vehicles: Performance, Design and Environmental Impacts, 1st ed.; Nova Science Publishers: New York, NY, USA, 2013; pp. 20–283. ISBN 978-1-62808-840-3. [Google Scholar]
- Samson, I.; Sikora, M.; Bączyk, A.; Mączyńska, J.; Tucki, K. Technologies used to enhance the biogas and biomethane yield: A review. Przemysł Chem. 2017, 96, 1605–1611. [Google Scholar]
- Tucki, K.; Mruk, R.; Orynycz, O.; Wasiak, A.; Botwińska, K.; Gola, A. Simulation of the Operation of a Spark Ignition Engine Fueled with Various Biofuels and Its Contribution to Technology Management. Sustainability 2019, 11, 2799. [Google Scholar] [CrossRef]
- Mikielewicz, D.; Kosowski, K.; Tucki, K.; Piwowarski, M.; Stepien, R.; Orynycz, O.; Wlodarski, R. Gas Turbine Cycle with External Combustion Chamber for Prosumer and Distributed Energy Systems. Energies 2019, 12, 3501. [Google Scholar] [CrossRef]
- Raymundo, H.; Dos Reis, J.G.M. Measures for Passenger-Transport Performance Evaluation in Urban Areas. J. Urban Plan. Dev. 2018, 144, 04018023-14. [Google Scholar] [CrossRef]
- Krzywonos, M.; Tucki, K.; Wojdalski, J.; Kupczyk, A.; Sikora, M. Analysis of Properties of Synthetic Hydrocarbons Produced Using the ETG Method and Selected Conventional Biofuels Made in Poland in the Context of Environmental Effects Achieved. Rocz. Ochr. Środowiska 2017, 19, 394–410. [Google Scholar]
- Mączyńska, J.; Krzywonos, M.; Kupczyk, A.; Tucki, K.; Sikora, M.; Pińkowska, H.; Bączyk, A.; Wielewska, I. Production and use of biofuels for transport in Poland and Brazil—The case of bioethanol. Fuel 2019, 241, 989–996. [Google Scholar] [CrossRef]
- POPiHN. Annual Report 2016. Oil Industry and Trade. Available online: http://www.popihn.pl/ (accessed on 3 July 2019).
- Directive (EU) 2018/2001 of the European Parliament and of the Council of 11 December 2018 on the Promotion of the Use of Energy from Renewable Sources (Text with EEA Relevance). Available online: https://eur-lex.europa.eu/ (accessed on 3 July 2019).
- Schleussner, C.F.; Rogelj, J.; Schaeffer, M.; Lissner, T.; Licker, R.; Fischer, E.M.; Hare, W. Science and policy characteristics of the Paris Agreement temperature goal. Nat. Clim. Chang. 2016, 6, 827–835. [Google Scholar] [CrossRef]
- FCCC/CP/2015/L.9/Rev.1. Adoption of the Paris Agreement. Available online: https://undocs.org/ (accessed on 3 July 2019).
- Mikielewicz, D.; Kosowski, K.; Tucki, K.; Piwowarski, M.; Stepien, R.; Orynycz, O.; Wlodarski, R. Influence of Different Biofuels on the Efficiency of Gas Turbine Cycles for Prosumer and Distributed Energy Power Plants. Energies 2019, 12, 3173. [Google Scholar] [CrossRef]
- Eisentraut, A. Sustainable Production of Second-Generation Biofuels. Potential and Perspectives in Major Economies and Developing Countries. Available online: https://www.iea.org/ (accessed on 3 July 2019).
- Naik, S.N.; Goud, V.V.; Rout, P.K.; Dalai, A.K. Production of first and second generation biofuels: A comprehensive review. Renew. Sustain. Energy Rev. 2010, 14, 578–597. [Google Scholar] [CrossRef]
- Biernat, K. Perspectives for global development of biofuel technologies to 2050. Chemik 2012, 66, 1178–1189. [Google Scholar]
- Lewandowski, W.; Ryms, M. Biopaliwa. Proekologiczne Odnawialne Źródła Energii, 1st ed.; Wydawnictwo WNT: Warszawa, Poland, 2013; pp. 1–528. [Google Scholar]
- Leja, K.; Lewandowicz, G.; Grajek, W. Bioethanol production from cellulose raw material. Biotechnologia 2009, 4, 88–101. [Google Scholar]
- Rosiak, E.; Łopaciuk, W.; Krzemiński, M. Produkcja Biopaliw I Jej Wpływ na Światowy Rynek Zbóż Oraz Roślin Oleistych I Tłuszczów Roślinnych, 1st ed.; Instytut Ekonomiki Rolnictwa i Gospodarki Żywnościowej-Państwowy Instytut Badawczy: Warszawa, Polska, 2011; pp. 1–121. Available online: https://depot.ceon.pl/ (accessed on 3 July 2019).
- Hermiati, E.; Mangunwidjaja, D.; Sunarti, T.C.; Suparno, O.; Prasetya, B. Pemanfaatan biomassa lignoselulosa ampas tebu untuk produksi bioetanol. J. Penelit. Dan Pengemb. Pertan. 2017, 29, 121–130. [Google Scholar]
- Krupa, M.; Moskalewicz, M.; Sikora, A.P.; Szurlej, A. Dimethyl ether: Properties, production technologies and the market. Przemysł Chem. 2014, 93, 1621–1627. [Google Scholar]
- Trippe, F.; Fröhling, M.; Schultmann, F.; Stahl, R.; Henrich, E.; Dalai, A. Comprehensive techno-economic assessment of dimethyl ether (DME) synthesis and Fischer–Tropsch synthesis as alternative process steps within biomass-to-liquid production. Fuel Process. Technol. 2013, 106, 577–586. [Google Scholar] [CrossRef]
- Patel, M.; Zhang, X.; Kumar, A. Techno-economic and life cycle assessment on lignocellulosic biomass thermochemical conversion technologies: A review. Renew. Sustain. Energy Rev. 2016, 53, 1486–1499. [Google Scholar] [CrossRef]
- Van Gerpen, J. Biodiesel processing and production. Fuel Process. Technol. 2005, 86, 1097–1107. [Google Scholar] [CrossRef]
- Knothe, G.; Krahl, J.; Van Gerpen, J. The Biodiesel Handbook, 2nd ed.; AOCS Press: Urbana, IL, USA, 2010; pp. 137–455. [Google Scholar]
- Pałuchowska, M. Biobutanol produced from biomass. Naft. Gaz 2015, 71, 502–509. [Google Scholar]
- Zhang, J.; Wang, S.; Wang, Y. Biobutanol production from renewable resources: Recent advances. Adv. Bioenergy 2016, 1, 1–68. [Google Scholar]
- Robak, J.; Janusz, M.; Sobolewski, A. Preparation of lignocellulosic waste for combustion process. Chemik 2012, 66, 436–444. [Google Scholar]
- Anderson, T.R.; Hawkins, E.; Jones, P.D. CO2, the greenhouse effect and global warming: From the pioneering work of Arrhenius and Callendar to today’s Earth System Models. Endeavour 2016, 40, 178–187. [Google Scholar] [CrossRef] [PubMed]
- Global Carbon Atlas. Available online: http://www.globalcarbonatlas.org/en/CO2-emissions (accessed on 3 July 2019).
- Annual European Union Greenhouse Gas Inventory 1990–2016 and Inventory Report 2019. Available online: https://www.eea.europa.eu/ (accessed on 3 July 2019).
- Emissions Reduction Strategies for the Transport Sector in Poland. Available online: https://www.transportenvironment.org/sites/te/files/publications/2019_01_PL_EUKI_report_FINAL_0.pdf (accessed on 31 October 2019).
- Chamier-Gliszczynski, N.; Bohdal, T. Urban Mobility Assessment Indicators in the Perspective of the Environment Protection. Rocz. Ochr. Środowiska 2016, 18, 670–681. [Google Scholar]
- Statistics Poland 2019. Transport and Communication. Available online: https://bdl.stat.gov.pl/ (accessed on 3 July 2019).
- PZPM Automotive Industry Report 2018/2019. Available online: https://www.pzpm.org.pl/ (accessed on 3 July 2019).
- White Paper on the Future of Europe. Available online: https://ec.europa.eu/ (accessed on 22 July 2019).
- Forin, S.; Radebach, A.; Steckel, J.C.; Ward, H. The effect of industry delocalization on global energy use: A global sectoral perspective. Energy Economics 2018, 70, 233–243. [Google Scholar] [CrossRef]
- Gallo, M. An Optimisation Model to Consider the NIMBY Syndrome within the Landfill Siting Problem. Sustainability 2019, 11, 3904. [Google Scholar] [CrossRef]
- Tucki, K.; Orynycz, O.; Świć, A.; Mitoraj-Wojtanek, M. The development of electromobility in Poland and EU States as a tool for management of CO2 emission. Energies 2019, 12, 2942. [Google Scholar] [CrossRef]
- Tucki, K.; Orynycz, O.; Wasiak, A.; Świć, A.; Dybaś, W. Capacity market implementation in Poland: Analysis of a survey on consequences for the electricity market and for energy management. Energies 2019, 12, 839. [Google Scholar] [CrossRef]
- Regulation (EC) No 443/2009 of the European Parliament and of the Council of 23 April 2009 Setting Emission Performance Standards for New Passenger Cars as Part of the Community’s Integrated Approach to Reduce CO2 Emissions from Light-Duty Vehicles (Text with EEA Relevance). Available online: https://eur-lex.europa.eu/ (accessed on 3 July 2019).
- Proposal for a REGULATION OF THE EUROPEAN PARLIAMENT AND OF THE COUNCIL Setting Emission Performance Standards for New Passenger Cars and for New Light Commercial Vehicles as Part of the Union’s Integrated Approach to Reduce CO2 Emissions from Light-Duty Vehicles and Amending Regulation (EC) No 715/2007 (Recast). Available online: https://eur-lex.europa.eu/ (accessed on 3 July 2019).
- CO2 Targets are Becoming Ever More Demanding Worldwide. Available online: https://www.daimler.com/sustainability/vehicles/climate-protection/wltp/wltp-part-5.html (accessed on 14 August 2019).
- Merkisz, J. Real Road Tests—Exhaust Emission Results from Passenger Cars. J. Kones Powertrain Transp. 2011, 18, 253–260. [Google Scholar]
- Biernat, K.; Jeziorkowski, A. Problems in supplying modern internal combustion engine with biofuels. Stud. Ecol. Et Bioethicae 2008, 6, 307–329. [Google Scholar]
- Tucki, K.; Mruk, R.; Orynycz, O.; Gola, A. The Effects of Pressure and Temperature on the Process of Auto-Ignition and Combustion of Rape Oil and Its Mixtures. Sustainability 2019, 11, 3451. [Google Scholar] [CrossRef]
- Piekarski, W.; Zając, G. Possibility of the use of liquid biofuels as a supply to the internal combustion engines. Autobusy Tech. Eksploat. Syst. Transp. 2011, 12, 347–354. [Google Scholar]
- Łatuszyńska, M. Computer Simulation Methods an Attempt of Logical Classification. Stud. Proc. Pol. Assoc. Knowl. Manag. 2011, 41, 163–176. [Google Scholar]
- Gotowała, K.; Patyk, R. The application of modern methods of modeling and simulation in the design of machines and devices. Autobusy Tech. Eksploat. Syst. Transp. 2016, 17, 275–280. [Google Scholar]
- Messagie, M.; Macharis, C.; Van Mierlo, J. Key Outcomes from Life Cycle Assessment of Vehicles, a State of the Art Literature Review. World Electric Vehicle Symposium and Exhibition (EVS27). 2013, pp. 1–9. Available online: https://0-ieeexplore-ieee-org.brum.beds.ac.uk/document/6915045 (accessed on 20 August 2019).
- Messagie, M.; Boureima, F.S.; Coosemans, T.; Macharis, C.; Van Mierlo, J. A range-based vehicle life cycle assessment incorporating variability in the environmental assessment of different vehicle technologies and fuels. Energies 2014, 7, 1467–1482. [Google Scholar] [CrossRef]
- Hoque, N.; Biswas, W.; Mazhar, I.; Howard, I. Environmental Life Cycle Assessment of Alternative Fuels for Western Australia’s Transport Sector. Atmosphere 2019, 10, 398. [Google Scholar] [CrossRef]
- Boonrod, B.; Prapainainar, C.; Narataruksa, P.; Kantama, A.; Saibautrong, W.; Sudsakorn, K.; Mungcharoen, T.; Prapainainar, P. Evaluating the environmental impacts of bio-hydrogenated diesel production from palm oil and fatty acid methyl ester through life cycle assessment. J. Clean. Prod. 2017, 142, 1210–1221. [Google Scholar] [CrossRef]
- Rogowska, D.; Jakobiec, J. The impact of source data on the estimation of GHG emissions in the life cycle of motor fuels—production stage. Naft. Gaz 2017, 9, 660–667. [Google Scholar] [CrossRef]
- Zak, A.; Golisz, E.; Tucki, K.; Borowski, P. Perspectives of biofuel sector development in Poland in comparision to CO2 emission standards. J. Agribus. Rural Dev. 2014, 3, 299–312. [Google Scholar]
- Oil and Gas Institute—National Research Institute. Certification System of Sustainable Biofuels and Bioliquids Production. Guidelines for the Determination of the Lifecycle per Unit Values of GHG Emissions for Biofuels, Bioliquids. Available online: https://www.inig.pl/ (accessed on 14 September 2019).
- Directive 2009/28/EC of the European Parliament and of the Council of 23 April 2009 on the Promotion of the Use of Energy from Renewable Sources and Amending and Subsequently Repealing Directives 2001/77/EC and 2003/30/EC. Available online: https://eur-lex.europa.eu/ (accessed on 14 September 2019).
- Yano, J.; Aoki, T.; Nakamura, K.; Yamada, K.; Sakai, S. Life cycle assessment of hydrogenated biodiesel production from waste cooking oil using the catalytic cracking and hydrogenation method. Waste Manag. 2015, 38, 409–423. [Google Scholar] [CrossRef] [Green Version]
- Menten, F.; Chèze, B.; Patouillard, L.; Bouvart, F. A review of LCA greenhouse gas emissions results for advanced biofuels: The use of meta-regression analysis. Renew. Sustain. Energy Rev. 2013, 26, 108–134. [Google Scholar] [CrossRef]
- Biernat, K. Second generation biofuels. Stud. Ecol. Et Bioethicae 2007, 5, 281–294. [Google Scholar]
- Kasprzyk, P.; Sas, S. Selected aspects of the use of biofuels to power internal combustion engines used in motor transport. Logistyka 2015, 3, 9102–9107. [Google Scholar]
- Directive 2014/94/EU of the European Parliament and of the Council of 22 October 2014 on the Deployment of Alternative Fuels Infrastructure Text with EEA Relevance. Available online: https://eur-lex.europa.eu/ (accessed on 7 November 2019).
- Tucki, K.; Mruk, M.; Orynycz, O.; Botwińska, K.; Gola, A. Toxicity of Exhaust Fumes (CO, NOx) of the Compression-Ignition (Diesel) Engine with the Use of Simulation. Sustainability 2019, 11, 2188. [Google Scholar] [CrossRef] [Green Version]
- Tucki, K.; Mruk, R.; Orynycz, O.; Wasiak, A.; Świć, A. Thermodynamic Fundamentals for Fuel Production Management. Sustainability 2019, 11, 4449. [Google Scholar] [CrossRef] [Green Version]
- Filipowicz, J.; Filipowicz, P.; Zaprawa, K. Emission of pollutants by public transport buses. Autobusy Tech. Eksploat. Syst. Transp. 2017, 18, 52–55. [Google Scholar]
- Chmielowiec–Korzeniowska, A.; Popiołek–Pyrz, M. Atmospheric air pollution with dust in the urban agglomeration of Lublin and its surroundings. Probl. Ekol. 2008, 12, 69–72. [Google Scholar]
- Zembowicz, J. Fiat Seicento, 1st ed.; Wydawnictwo Komunikacji i Łączności: Warszawa, Polska, 2010; pp. 10–220. [Google Scholar]
- Ambrozik, A.; Kurczyński, D.; Łagowski, P.; Warianek, M. The toxicity of combustion gas from the Fiat 1.3 Multijet engine operating following the load characteristics and fed with rape oil esters. Proc. Inst. Veh. 2016, 1, 23–36. [Google Scholar]
- Ambrozik, A.; Ambrozik, T.; Kurczyński, D. Load characteristics of turbocharged 1.3 Multijet engine Postępy Nauk. I Tech. 2012, 15, 7–20. [Google Scholar]
- Fiat Panda Misc Documents Accessories Brochure PDF. Available online: https://manuals.co/ (accessed on 3 July 2019).
- Kordylewski, W. Spalanie I Paliwa, 5th ed.; Oficyna Wydawnicza Politechniki Wrocławskiej: Wrocław, Polska, 2008; pp. 10–470. ISBN 978-83-7493-378-0. [Google Scholar]
- Baczewski, K.; Kałdoński, T. Paliwa Do Silników O Zapłonie Samoczynnym, 2nd ed.; Wydawnictwa Komunikacji i Łączności: Warszawa, Polska, 2017; pp. 50–210. [Google Scholar]
- Gwardiak, H.; Rozycki, K.; Ruszkarska, M.; Tylus, J.; Walisiewicz-Niedbalska, W. Evaluation of fatty acid methyl esters (FAME) obtained from various feedstock. Rośliny Oleiste Oilseed Crop. 2011, 32, 137–147. [Google Scholar]
- Dobras, S.; Więcław-Solny, L.; Chwoła, T.; Krótki, A.; Wilk, A.; Tatarczuk, A. Renewable methanol as a fuel and feedstock in the chemical industry. Zesz. Nauk. Inst. Gospod. Surowcami Miner. I Energią PAN 2017, 98, 27–37. [Google Scholar]
- Campbell, S.L.; Chancelier, J.P.; Nikoukhah, R. Modeling and Simulation in Scilab/Scicos with ScicosLab 4.4, 1st ed.; Springer: New York, NY, USA, 2006; pp. 73–155. [Google Scholar]
- Triantafyllopoulos, G.; Dimaratos, A.; Ntziachristos, L.; Bernard, Y.; Dornoff, J.; Samaras, Z. A study on the CO2 and NOx emissions performance of Euro 6 diesel vehicles under various chassis dynamometer and on-road conditions including latest regulatory provisions. Sci. Total Environ. 2019, 666, 337–346. [Google Scholar] [CrossRef]
- Pavlovic, J.; Ciuffo, B.; Fontaras, G.; Valverde, V.; Marotta, A. How much difference in type-approval CO2 emissions from passenger cars in Europe can be expected from changing to the new test procedure (NEDC vs. WLTP)? Transp. Res. Part A Policy Pract. 2018, 111, 136–147. [Google Scholar] [CrossRef]
- Suarez-Bertoa, R.; Valverde, V.; Clairotte, M.; Pavlovic, J.; Giechaskiel, B.; Franco, V.; Kregar, Z.; Astorga, C. On-road emissions of passenger cars beyond the boundary conditions of the real-driving emissions test. Environ. Res. 2019, 176, 108572. [Google Scholar] [CrossRef] [PubMed]
- Hooftman, N.; Messagie, M.; Van Mierlo, J.; Coosemans, T. A review of the European passenger car regulations—Real driving emissions vs local air quality. Renew. Sustain. Energy Rev. 2018, 86, 1–21. [Google Scholar] [CrossRef]
- Barlow, T.J.; Latham, S.; McCrae, S.I.; Boulter, P.G. A Reference Book of Driving Cycles for Use in the Measurement of Road Vehicle Emissions. Available online: https://assets.publishing.service.gov.uk/ (accessed on 3 July 2019).
- Regulation No 83 of the Economic Commission for Europe of the United Nations (UN/ECE)—Uniform Provisions Concerning the Approval of Vehicles with Regard to the Emission of Pollutants According to Engine Fuel Requirements. Available online: https://eur-lex.europa.eu/ (accessed on 3 July 2019).
- Romaniszyn, K.M. Evaluation of the differences in determining fuel consumption for a real car based on universal and dynamic characteristics. Siln. Spalinowe 2004, 43, 48–54. [Google Scholar]
- Volkswagen AG Group Research. First Interim Report of the Sustainability Advisory Board of the Volkswagen Group. Available online: https://www.volkswagen-newsroom.com/en/press-releases/first-interim-report-of-the-sustainability-advisory-board-of-the-volkswagen-group-4510 (accessed on 28 November 2019).
- Volkswagen AG Group Research. The Golf—Environmental Commendation Background Report. Available online: https://www.a-pointduurzaamheid.nl/files/4914/2348/7329/e_golf_Env_Comm.pdf (accessed on 31 October 2019).
- Guyon, O. Methodology for the Life Cycle Assessment of a Car-sharing Service. Available online: https://www.diva-portal.org/smash/get/diva2:1183366/FULLTEXT01.pdf (accessed on 31 October 2019).
- ISO 14044. Environmental Management—Life Cycle Assessment—Requirements and Guidelines. Available online: https://www.iso.org/standard/38498.html (accessed on 31 October 2019).
Figure 1.
Diagram of simulation model on the basis of which the mass exhaust values were calculated.
Figure 1.
Diagram of simulation model on the basis of which the mass exhaust values were calculated.

Figure 2.
Signals generated by the “NEDC generator” module during the simulation (A—Fiat Seicento, B—Fiat Panda).
Figure 2.
Signals generated by the “NEDC generator” module during the simulation (A—Fiat Seicento, B—Fiat Panda).

Figure 3.
Signals generated by the “Calculation emission from fuels” module during the simulation (A—Fiat Seicento, B—Fiat Panda).
Figure 3.
Signals generated by the “Calculation emission from fuels” module during the simulation (A—Fiat Seicento, B—Fiat Panda).

Figure 4.
Impact of a given fuel on indicated areas [mPt].

Figure 5.
Carbon dioxide emissions in the production process of a given fuel [%].

Figure 6.
Comparison of carbon dioxide emissions from fuels in the context of the fuel life cycle.


Table 1.
Symbols and units used in calculations.
| Symbol | Description | Unit |
|---|---|---|
| constant air demand for the fuel mixture | [gair/gfuel] | |
| air demand constant for petrol 95 | [gair/gfuel] | |
| air demand constant for the additive | [gair/gfuel] | |
| mass fraction of the additive in the mixture | [gbiofuel/gmixture] | |
| calorific value for the fuel mixture | [kJ/g] | |
| calorific value for petrol 95 | [kJ/g] | |
| calorific value for the additive | [kJ/g] | |
| the momentary speed of the vehicle in the test | [m/s] or [km/h] | |
| the end time of simulation | [s] | |
| vehicle acceleration | [m/s2] | |
| moment value of force on wheels | [N] | |
| wheel radius | [m] | |
| power transmission ratio for torque | [-] | |
| drivetrain ratios for rotational speed | [-] | |
| momentary torque value on the vehicle transmission | [N·m] | |
| the instantaneous speed value on the vehicle transmission | [rad/s] | |
| the hourly fuel consumption function dependent on the speed and torque | [g/h] | |
| rotational engine speed | [rad/s] | |
| engine torque | [N m] | |
| fuel flux | [g/s] | |
| air flux | [g/s] | |
| energy flux supplied by the fuel | [J/s] | |
| efficiency | [-] |
Table 2.
Basic technical data of the engines: 1.1 Fire and 1.3 MultiJet II used in the simulation.
| Parameter | Unit | 1.1 Fire | MultiJet II |
|---|---|---|---|
| Cylinder layout | - | in-line | in-line |
| Number of cylinders, c | - | 4 | 4 |
| Type of injection | - | direct, multistage | direct, multistage |
| Compression ratio, e | - | 9.6:1 | 16.8:1 |
| Diameter of the cylinder, D | mm | 70 | 69.6 |
| Piston stroke, S | mm | 72 | 82 |
| Engine displacement, Vss | cm3 | 1108 | 1251 |
| Maximum engine power, Ne | kW | 40 | 55 |
| Engine rotational speed for its maximum power, nN | rpm | 5000 | 4000 |
| Maximum engine torque, Me | Nm | 88 | 190 |
| Engine rotational speed for its maximum torque, nM | rpm | 2750 | 1500 |
| Rotational speed of idle gear, nbj | rpm | 850 ± 50 | 850 ± 20 |
Table 3.
Selected properties of the fuels applied. FAME—fatty acid methyl esters; DME—dimethyl ether.
Table 3.
Selected properties of the fuels applied. FAME—fatty acid methyl esters; DME—dimethyl ether.
| Parameter | 95 Petrol | Ethanol | Methanol | DME | Diesel | FAME | Butanol |
|---|---|---|---|---|---|---|---|
| Carbon content [%] | 86.4 | 52.1 | 37.4 | 52.1 | 86.5 | 78.0 | 64.8 |
| Hydrogen content [%] | 13.6 | 13.1 | 12.5 | 13.1 | 13.4 | 12.0 | 13.5 |
| Oxygen content [%] | 0.0 | 34.7 | 49.9 | 34.7 | 0.0 | 10.0 | 21.6 |
| Calorific value [kJ/g] | 45.0 | 30.4 | 20.1 | 28.8 | 44.0 | 37.0 | 33.0 |
| Air demand [gair/gfuel] | 14.7 | 9.06 | 6.51 | 9.06 | 14.5 | 12.5 | 11.2 |
Table 4.
Parameters for the “NEDC generator” module.
| Parameter | Unit | Fiat Seicento | Fiat Panda |
|---|---|---|---|
| vehicle weight | kg | 740 | 1020 |
| rolling resistance | N | 5 | 6.15 |
| aerodynamic resistance | N/(km/h)2 | 0.0337 | 0.0412 |
Table 5.
Parameters for the “Drive system” module based on the manufacturer’s data.
| Parameter | Unit | Fiat Seicento | Fiat Panda |
|---|---|---|---|
| Radius of the vehicle wheels | m | 0.274 | 0.298 |
| Drive system ratio for torque | [-] | 0; 1/13.9; 1/7.30; 1/4.78; 1/3.48; 1/2.98 | 0; 1/13.46; 1/7.05; 1/4.55; 1/3.24; 1/2.42 |
| Drive system ratio for rotational speed | [-] | 0; 13.926; 7.303; 4.787; 3.481; 2.980 | 0; 13.46; 7.05; 4.55; 3,24; 2.42 |
Table 6.
Results of total carbon dioxide and water vapor emissions for the used fuels.
| Fuel Type | CO2 [kg] | H2O [kg] |
|---|---|---|
| 95 petrol | 1.51 | 0.750 |
| Diesel | 1.29 | 0.488 |
| Ethanol | 1.41 | 0.898 |
| DME | 1.54 | 0.948 |
| Butanol | 1.28 | 0.657 |
| FAME | 1.38 | 0.517 |
Table 7.
List of CO2 emission results for the individual fuels with values from regulations.
| Fuel Type | CO2 [kg] | CO2 [g/km] | CO2 [g/km] Limit from the Regulation |
|---|---|---|---|
| 95 petrol | 1.51 | 137.27 | 170 |
| Diesel | 1.29 | 117.27 | 130 |
| Ethanol | 1.41 | 128.18 | 170 |
| DME | 1.54 | 140.00 | 170 |
| Butanol | 1.28 | 116.36 | 130 |
| FAME | 1.38 | 125.45 | 130 |
Table 8.
Data used in the LCA analysis of selected fuels.
| Fuel Consumption in the Cycle [L/100 km] | |||
|---|---|---|---|
| Urban | Extra Urban | Combinated | |
| MultiJet II | 4.7 | 3.5 | 3.9 |
| 1.1 Fire | 7.2 | 4.8 | 5.8 |
| Estimated Fuel Consumption I Car Service Life | |||
| 95 petrol | 9750 | ||
| Diesel | 6750 | ||
| Ethanol | 11,250 | ||
| DME | 11,250 | ||
| Butanol | 8250 | ||
| FAME | 8250 | ||
| CO2 Emission from Fuels in Production Process [kgCO2/1 kg Fuel] | |||
| Petrol 95 | 1.13 | ||
| Diesel | 0.341 | ||
| Ethanol | −1.34 | ||
| DME | 2.105 | ||
| Butanol | 3.18 | ||
| FAME | −7.01 | ||
| CO2 Emission from Fuels in Burn Process [g/km] | |||
| 1.1 Fire | 95 petrol | 137.27 | |
| MultiJet II | Diesel | 117.27 | |
| 1.1 Fire | Ethanol | 128.18 | |
| 1.1 Fire | DME | 140.00 | |
| MultiJet II | Butanol | 116.36 | |
| MultiJet II | FAME | 15.45 | |
| Service Life of Car [km] | |||
| MultiJet II | 150,000 | km | |
| 1.1 Fire | 150,000 | km | |
Table 9.
Carbon dioxide emissions for a given fuel over the vehicle’s life cycle.
| Fuel | CO2 Total [t] |
|---|---|
| 95 petrol | 31.6 |
| Diesel | 19.9 |
| Ethanol | 8.0 |
| DME | 44.7 |
| Butanol | 43.7 |
| FAME | −39.8 |
© 2019 by the authors. Licensee MDPI, Basel, Switzerland. This article is an open access article distributed under the terms and conditions of the Creative Commons Attribution (CC BY) license (http://creativecommons.org/licenses/by/4.0/).
Share and Cite
MDPI and ACS Style
Tucki, K.; Orynycz, O.; Mruk, R.; Świć, A.; Botwińska, K. Modeling of Biofuel’s Emissivity for Fuel Choice Management. Sustainability 2019, 11, 6842. https://0-doi-org.brum.beds.ac.uk/10.3390/su11236842
AMA Style
Tucki K, Orynycz O, Mruk R, Świć A, Botwińska K. Modeling of Biofuel’s Emissivity for Fuel Choice Management. Sustainability. 2019; 11(23):6842. https://0-doi-org.brum.beds.ac.uk/10.3390/su11236842
Chicago/Turabian StyleTucki, Karol, Olga Orynycz, Remigiusz Mruk, Antoni Świć, and Katarzyna Botwińska. 2019. "Modeling of Biofuel’s Emissivity for Fuel Choice Management" Sustainability 11, no. 23: 6842. https://0-doi-org.brum.beds.ac.uk/10.3390/su11236842
Note that from the first issue of 2016, this journal uses article numbers instead of page numbers. See further details here.