Article

Urban Growth and Long-Term Transformations in Spanish Cities Since the Mid-Nineteenth Century: A Methodology to Determine Changes in Urban Density

by
Eduard J. Alvarez-Palau
1,*,
Jordi Martí-Henneberg
2 and
Jorge Solanas-Jiménez
2
1
Universitat Oberta de Catalunya, 08035 Barcelona, Spain
2
University of Lleida, 25003 Lleida, Spain
*
Author to whom correspondence should be addressed.
Sustainability 2019, 11(24), 6948; https://0-doi-org.brum.beds.ac.uk/10.3390/su11246948
Submission received: 31 October 2019 / Revised: 30 November 2019 / Accepted: 2 December 2019 / Published: 5 December 2019

Abstract

:
The current work models urban growth in the continuous built-up areas of 47 Spanish cities from the mid-nineteenth century through to the present day. We did this by compiling a comprehensive Geographic Information System (GIS) dataset, based on a series of historic maps and aerial images, and then used this to study urban growth and to make spatial comparisons. Our chosen indicator of expansion: population density, was calculated by dividing the total population of each city (based on its municipal area) by its built-up area during each period. Our results revealed four different stages of growth, each of which was characterised by a certain political and economic reality. They showed the clogging up of the walled city, the shaping of the urban ensanches, the maturity of the compact city and the process of metropolisation.

1. Introduction

The way in which modern cities have evolved has generated an intense debate within the academic community between the models of compact cities and dispersed cities. In Europe, Mediterranean countries have a tradition based on urban compactness, but recent trends show different patterns, leading to the consumption of more space [1,2,3,4]. The main characteristic of the compact city is its high level of population density. This depends on its population and the size of its built-up area, which tend to be in a state of constant evolution. As a result, the means used to measure population density may differ greatly, depending on each particular situation. A city may contain neighbourhoods in which high-density blocks of housing can be found alongside others mainly composed of detached housing, yet everything is computed in an aggregated way. Calculations of urban density therefore include important differences from area to area which should be considered when measuring the occupied built-up surface. In our opinion, the limits of the urban fabric should be clearly identified in order to provide the best possible measurements of density, instead of using the whole surface of the municipality, as has previously been common practice. Although this is a complex and time-consuming process, particularly for long-term analyses, in this article, we highlight its interest and show how it can be made feasible.
Recent patterns of territorial expansion in Spanish cities have been accompanied by a major reduction in their population density, which has resulted in serious social and environmental problems. New urban developments have emerged on the urban fringes of the most dynamic cities, contributing to the creation of larger agglomerations [5,6,7,8]. New urban sectors tend to be more specialised, either in socioeconomic status or in terms of land use [9]. Commuting journeys for work and education are now longer. People are more dependent on private cars, which in turn has led to higher rates of spatial and social exclusion [10]. The supply of public utilities and public transport is more expensive. Further, and more importantly, huge amounts of peri-urban lands are being urbanised in a non-return process, although very profitable for some economic agents [11,12]. Many of these cities have evolved from an initial stage of urban compactness due to the existence of consolidated historical centres [13]. This is important because most previous studies only started paying attention to this phenomenon in the 1990s. As a result, until now, important periods of the morphological evolution of these cities have been ignored. Moudon claimed that “the study of urban form can only be understood historically because the elements that define it are subject to continuous transformations and modifications” [14]. With this in mind, we proposed extending the time scale of this type of analysis back in time.
Outside the Spanish context, and at other scales, researchers have based their analysis on variations in urban population [15,16]. The wide time scale adopted for these studies have made it possible to observe cycles of population concentration and dispersion in urban areas and the consequent modification of their land uses and urban landscapes. This overview of the recent bibliography also shows a set of works that we have used as references for our research. It seems clear that there is great interest in related issues such as the impact of urban expansion on the corresponding rural environment. Good examples are provided by works dedicated to Athens, Toulouse, Rome and Spain [17,18,19,20]. In more general terms, researchers have also paid attention to the correlation between the rural environment and the distribution of population [21]. Other studies, more based on demographic data, have analysed interdependence and the formation of metropolitan subcentres [22,23]. All of these studies have mainly focused on the period after 1960. There are few cases in which the research conducted has included statistics dating back to the 19th century, such as a demographic study of Italy; and a geographical study of Great Britain, Belgium and the Netherlands [24,25]. On the other hand, most of these authors have analysed data at the municipal level, without using historic cartography to interpret spatial changes in urban morphology. Our methodology can thus shed new light on this subject.
Returning to the Spanish case, this process of urban expansion has been particularly intense due to historical circumstances. The decision taken in 1959 to drastically liberalise its economic policy was a watershed in the history of modern-day Spain. The country’s economic potential had been repressed during the Civil War (1936–1939) and the subsequent years of political autarky. The liberalising policies of 1959 produced an explosion of the latent energy that had hitherto been lain dormant. As a result, the period 1960–1973 marked the beginning of a process of rapid transformation in terms of domestic migrations and was associated with intense urban growth. From an urban planning perspective, ensuring the understanding of the urban growth phenomenon and helping to define appropriate policies to implement are key considerations. Housing supply and housing demand should be balanced between and aligned with the location of economic activities and land uses. An unbalanced evolution of such variables can lead to uncertain scenarios, in which geographical specialisation undermines the proper functioning of cities and their surrounding areas. All in all, our research would seem particularly appropriate at this moment in time.
We have therefore focused on the evolution of the 47 provincial capitals in Spain’s continental territory. Many of these have expanded from initially being compact urban units based on, and around, consolidated historical centres, but the current urban landscape is far more heterogeneous. The initial research question aimed to show whether these cities maintained a level of demographic stability in terms of their population densities, or if—on the contrary—they exhibited significant changes over time. The sample of cities chosen also allowed us to make a geographic reading of the results obtained and to identify different patterns in different regions. We therefore began by defining an indicator of population density. This was calculated by dividing the total urban population by the continuous built-up area of each city in each period. The objective was to interpret the process of urban transformation which converted the small cities of the nineteenth century—many of which had been walled enclosures—into modern-day urban metropolis [26,27]. We quantified the phenomenon using GIS (Geographic Information System), estimating the extension of the urban fabric to determine changes in the continuous built-up area. We also proposed extending the scale of our analysis back in time for a century and a half using historic cartography. The wider time scale helped us to observe cycles of concentration and dispersion of population in specific urban areas, and particularly to identify which cities developed the most. Our innovation in relation to previous studies is that we propose combining large series of population data with a new variable of built-up areas to estimate the fluctuation of population density within a context of constant urban growth [28,29].
The article is divided into five sections. After this introduction, we explain the information compiled to create our dataset. We then describe the methodology employed to generate indicators of the built-up area and the density of urban population. The fourth section presents the results obtained and the fifth includes a discussion and historical contextualisation.

2. Materials and Methods

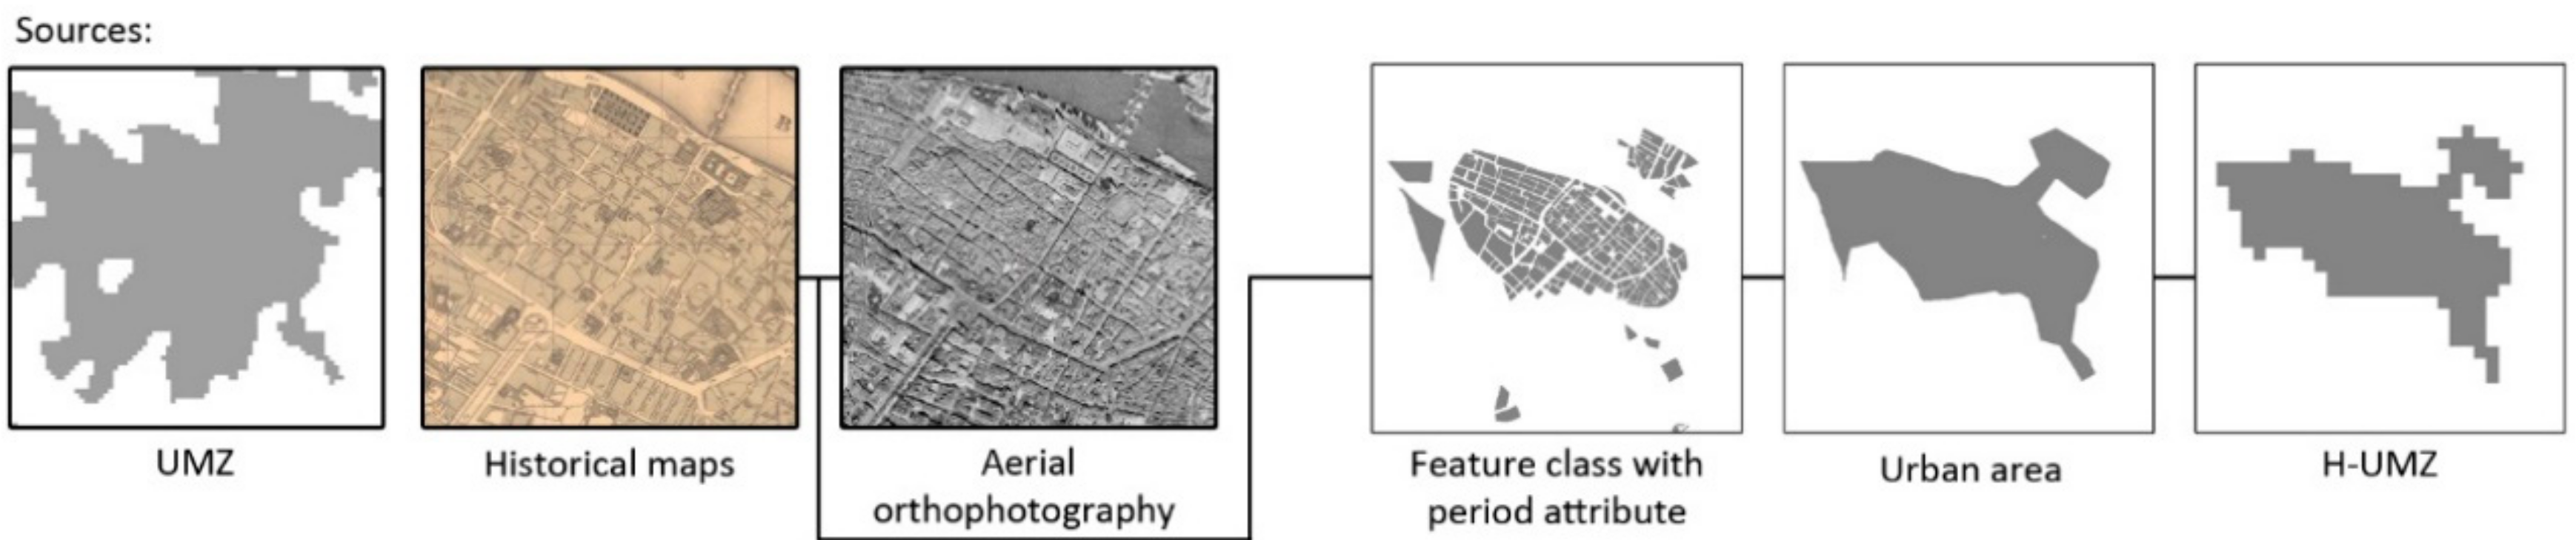
2.1. Sources of Data for the Reconstruction of the Built-Up Area

As mentioned, the objective of the current work was to measure urban growth and to determine the population density of Spain’s provincial capitals since the middle of the nineteenth century. Our selection of provincial capitals provided us with a wide range of reliable historic cartography from 1850 onwards [30]. Their various sizes and geographical distribution throughout the country also ensured a coherent sample (Figure 1).
Given the evolution of cartographic techniques throughout the period under study, we had to consult and combine different kinds of sources to cover comparable periods at 25-year intervals. For the initial periods, we mainly used historical maps and city plans. Later, we relied on aerial orthophotography obtained from different sources. Finally, for the most recent periods, we used the Corine Land Cover (CLC) database created by the European Environment Agency (EEA).
We selected our source documents bearing in mind three basic characteristics: firstly, the fact that each urban block had to be visually identifiable; secondly, the preferred system for representation was the orthogonal projection; and, thirdly, the minimum scale had to be 1:50,000 to ensure enough precision. This allowed the use of the first series of the National Topographic Map (1875–1968) for those cities where more detailed data sources were not available.
Collecting the historic maps and plans proved the most laborious part of the research. The Atlas of Spain and its Overseas Possessions, by Francisco Coello, which is associated with the “Geographical Dictionary of Spain”, was our initial source. Although this atlas is incomplete, its map series covers 223 cities between 1847 and 1870 [31]. Another relevant collection was the work entitled “Regional Spain”, which contains urban plans of the main provincial capitals at the beginning of the twentieth century [32]. The 25-year periods that these major collections left uncovered were filled using maps and plans obtained from surveys by public authorities. When this material was not available, we used secondary source materials included in travel guides and other publications used by commercial associations to promote their businesses [33]. Although not all of the sources were official cartographic surveys, they provided revisions and upgrades with a sufficient degree of accuracy to meet our needs.
In the case of aerial photography, we mainly worked with two photogrammetric flight series. The first, referred to as Series A, corresponded to flights carried out by the US military between 1945 and 1946; this was the first aerial photography project to cover the whole of mainland Spain [34]. The second, called Series B, was also produced by the US military and dated from 1956 and 1957. Both flight series responded to the geostrategic need to control the territory during the Cold War period. On the Spanish side, the main motivation for the authorities was to access graphic material of great value without any economic cost to the taxpayer.
For the most recent periods, we obtained information about the space occupied by cities from the Urban Morphological Zones (UMZ) database of the EEA. These are based on polygons, generated using data from the CLC, which delimit the space occupied by urban areas as a type of land use. They were available for the years 1990, 2000 and 2006. As we shall see in the next section, the way they were represented also served as a point of reference for homogenising the rest of our data.
As a result of this data compilation, we obtained over 400 examples of cartographic evidence relating to the urban growth of Spain’s 47 mainland provincial capitals [35]. The exhaustive procedure applied involved recompiling all the information available and leaving only a limited number of gaps for specific cities and periods (Table A1 in the Appendix A).
As regards demographic data, the information used was obtained from Spanish population censuses. We selected the census years that were closest to most of the cartographic sources. As a result, we used the population censuses for the years 1860, 1887, 1920, 1940, 1960, 1991 and 2001. In this regard, Spain experienced several changes in its municipal boundaries during the period under study, especially in rural areas suffering depopulation and in the surroundings of the largest cities. To facilitate historical comparisons, we used a dataset in which total population at the municipal level was homogenised for the 2011 municipal boundaries. The data and methodology used for this purpose were explained in previous papers [36,37]. The sources mentioned in this section were combined as described below.

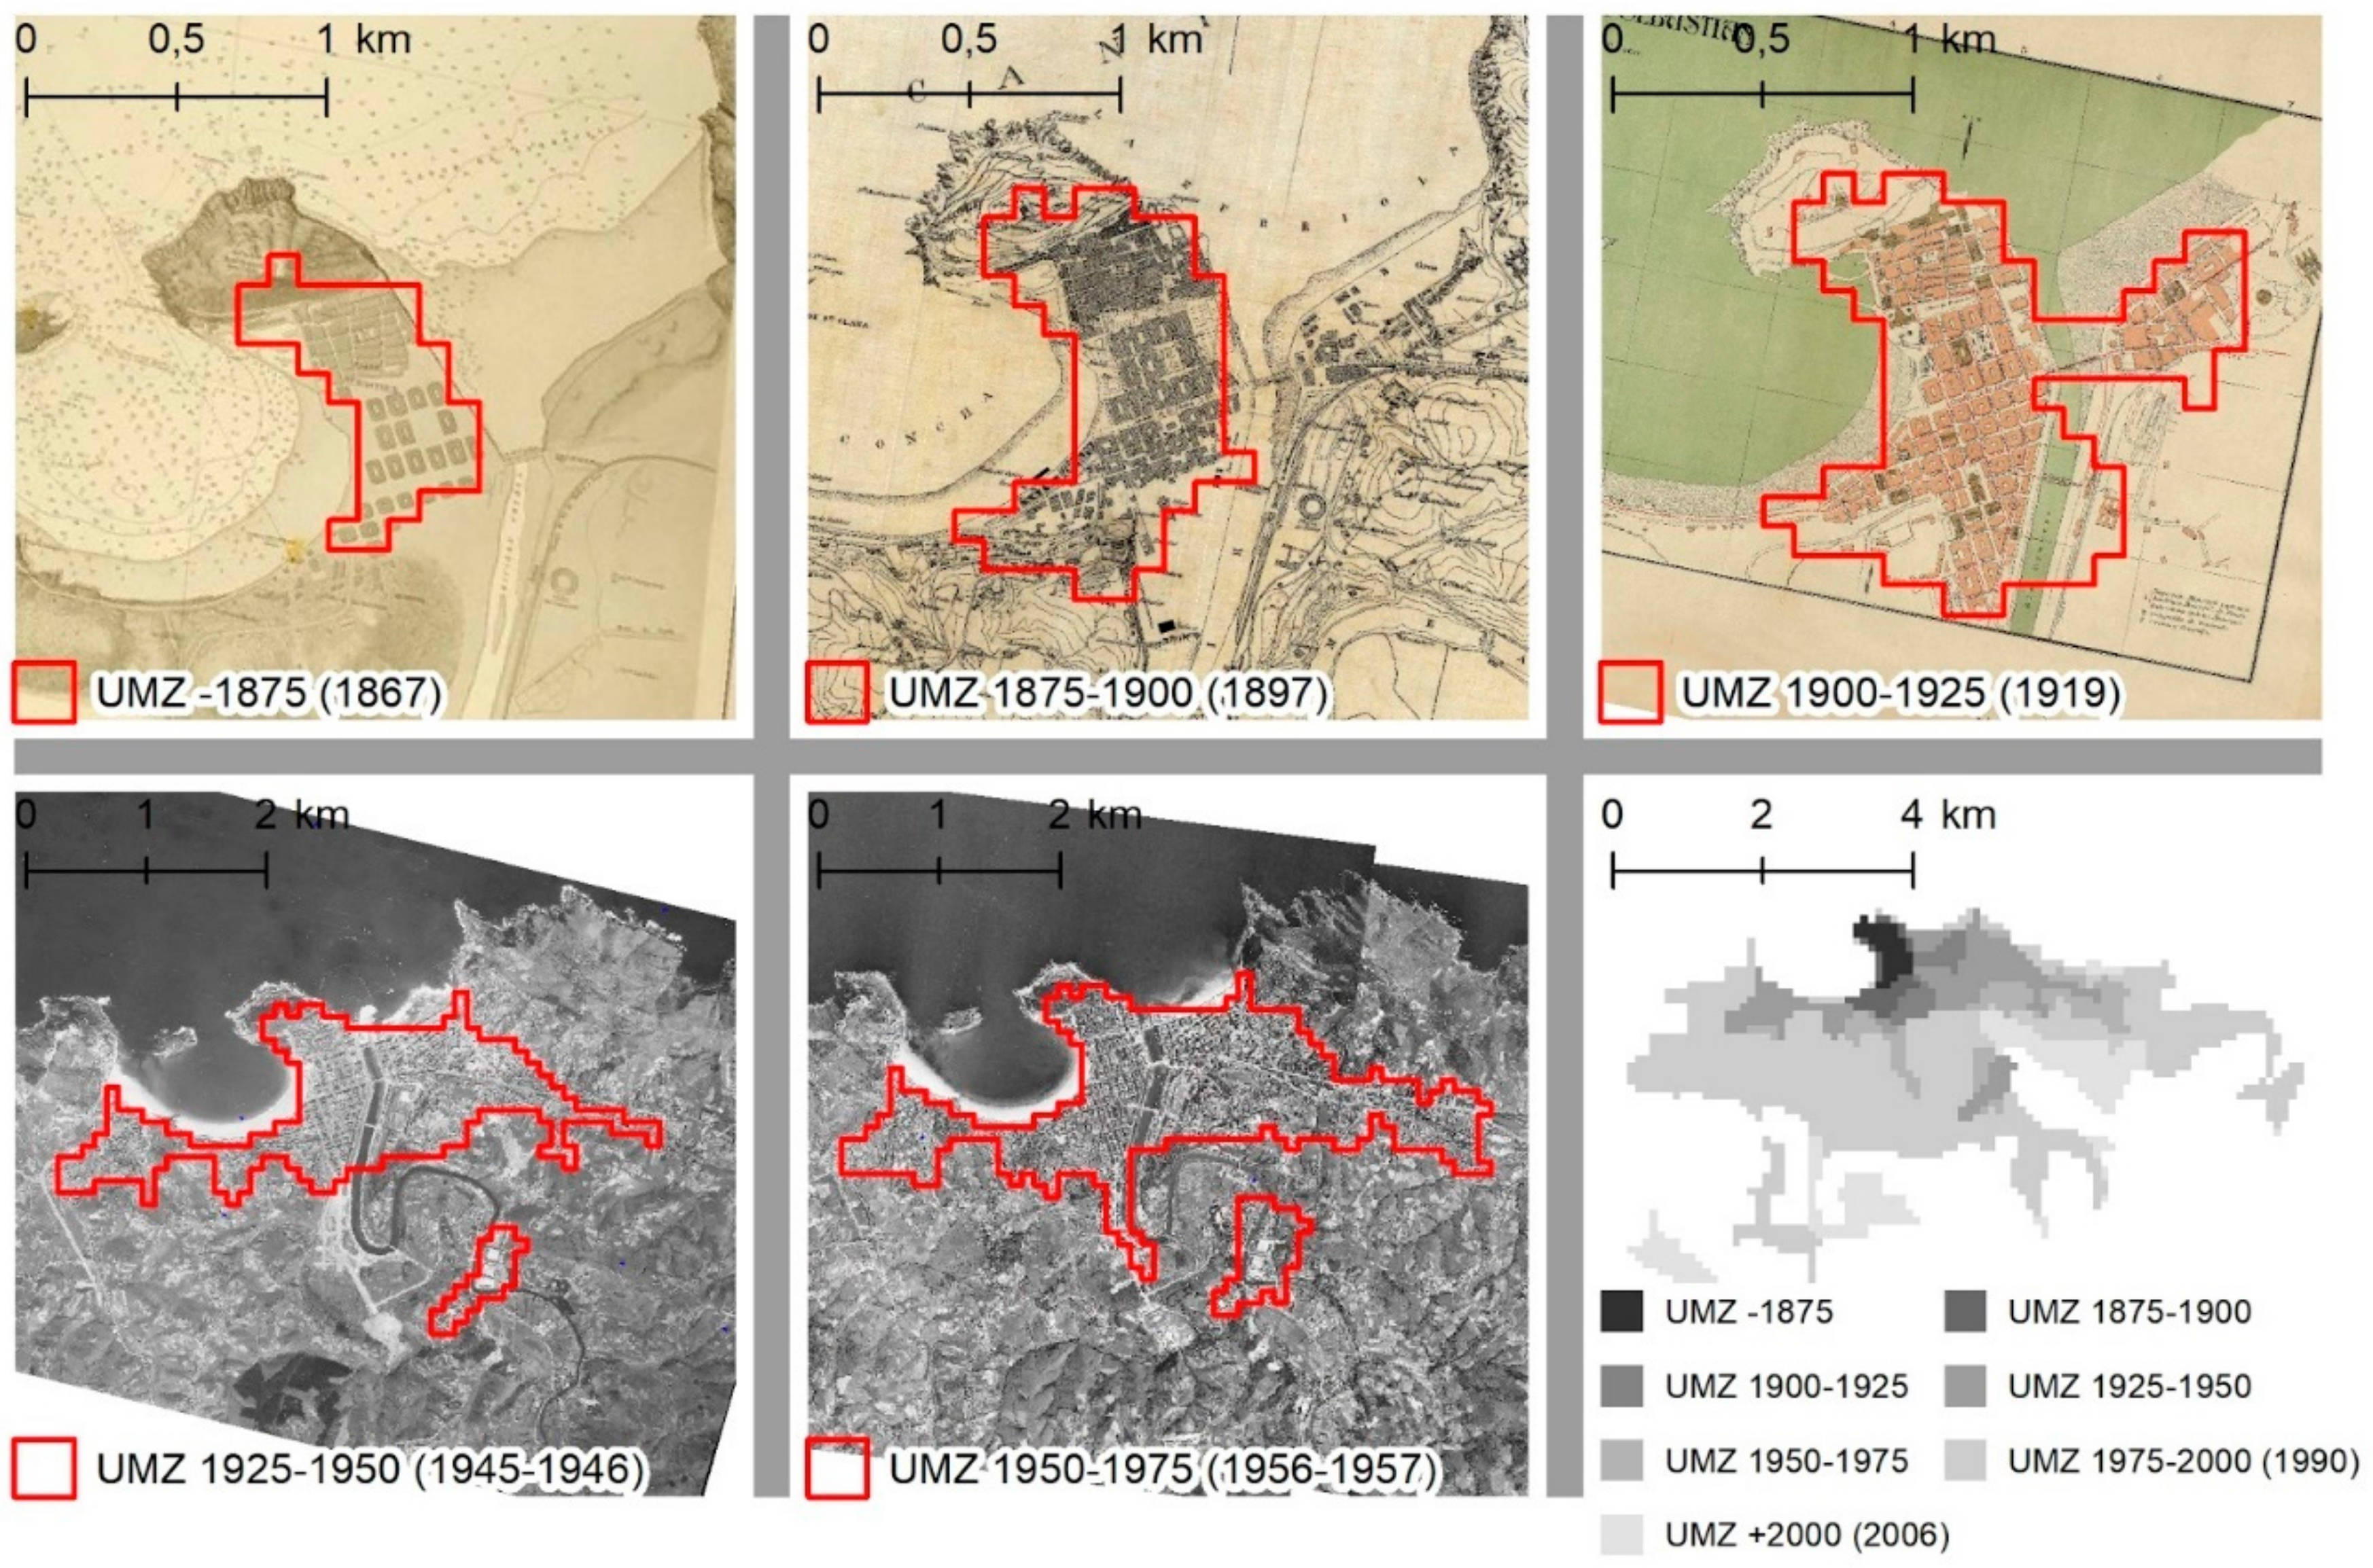
2.2. Methodology for Defining H-UMZ and Estimating Urban Density
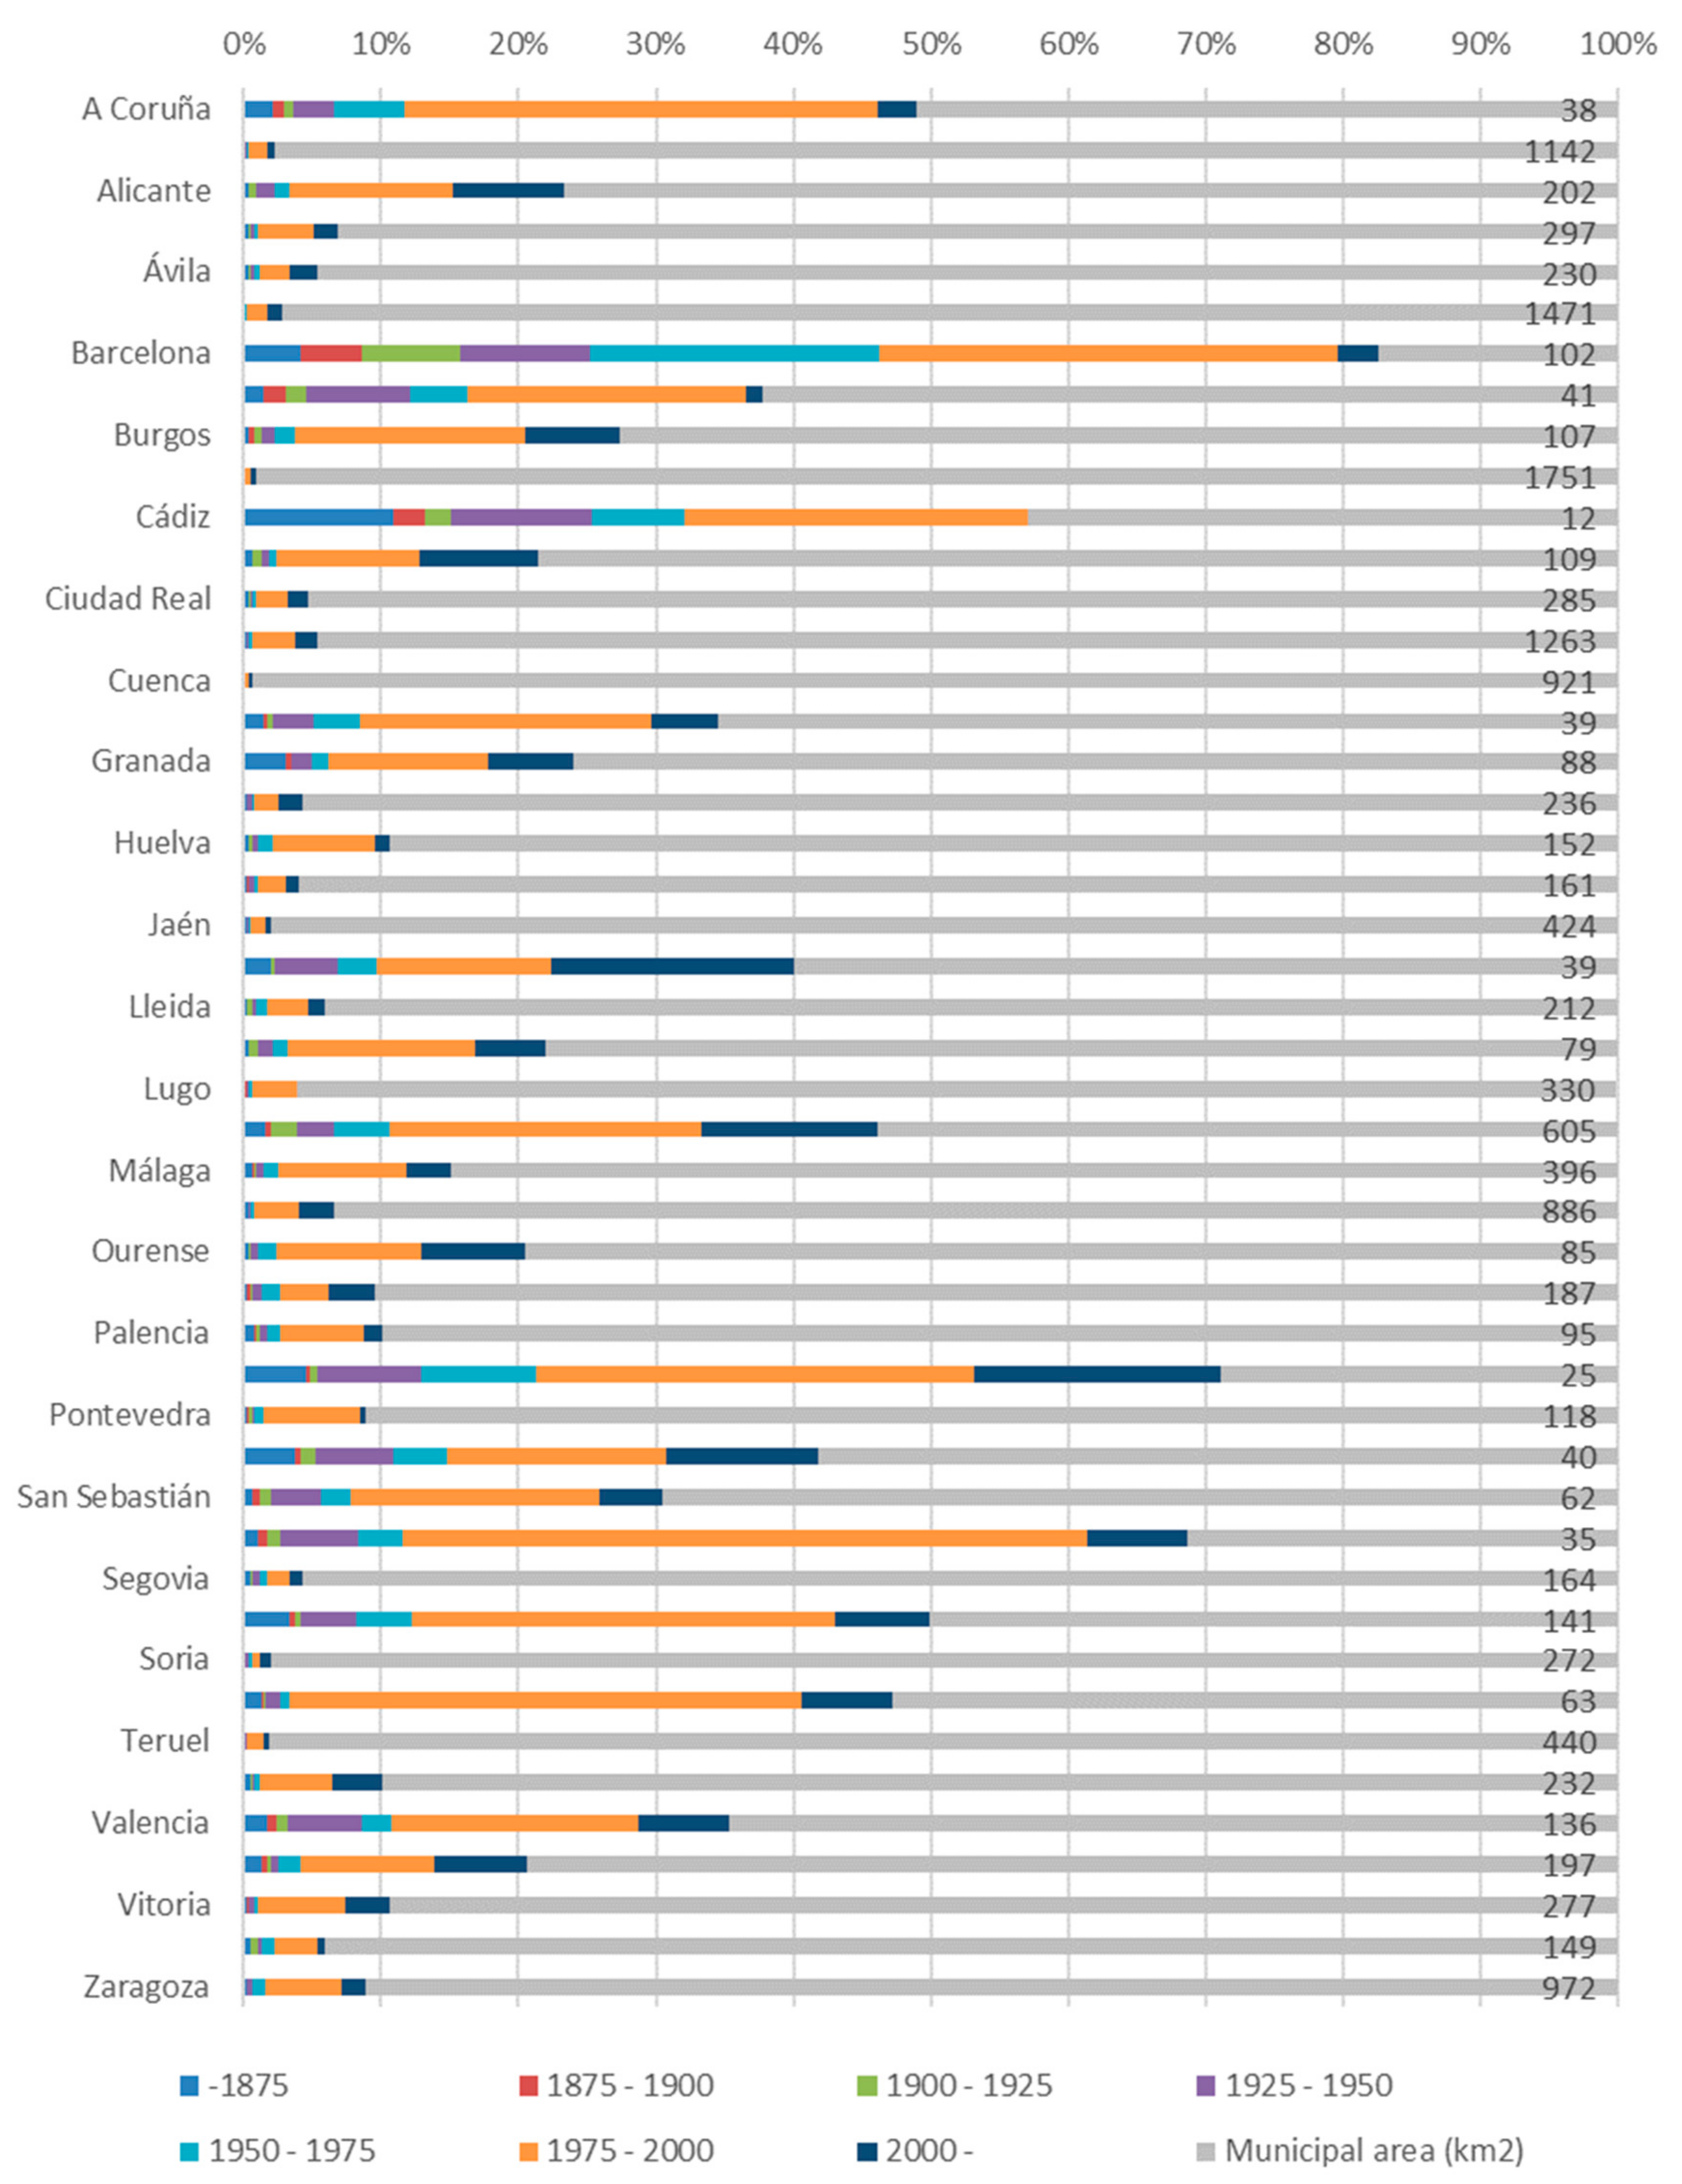
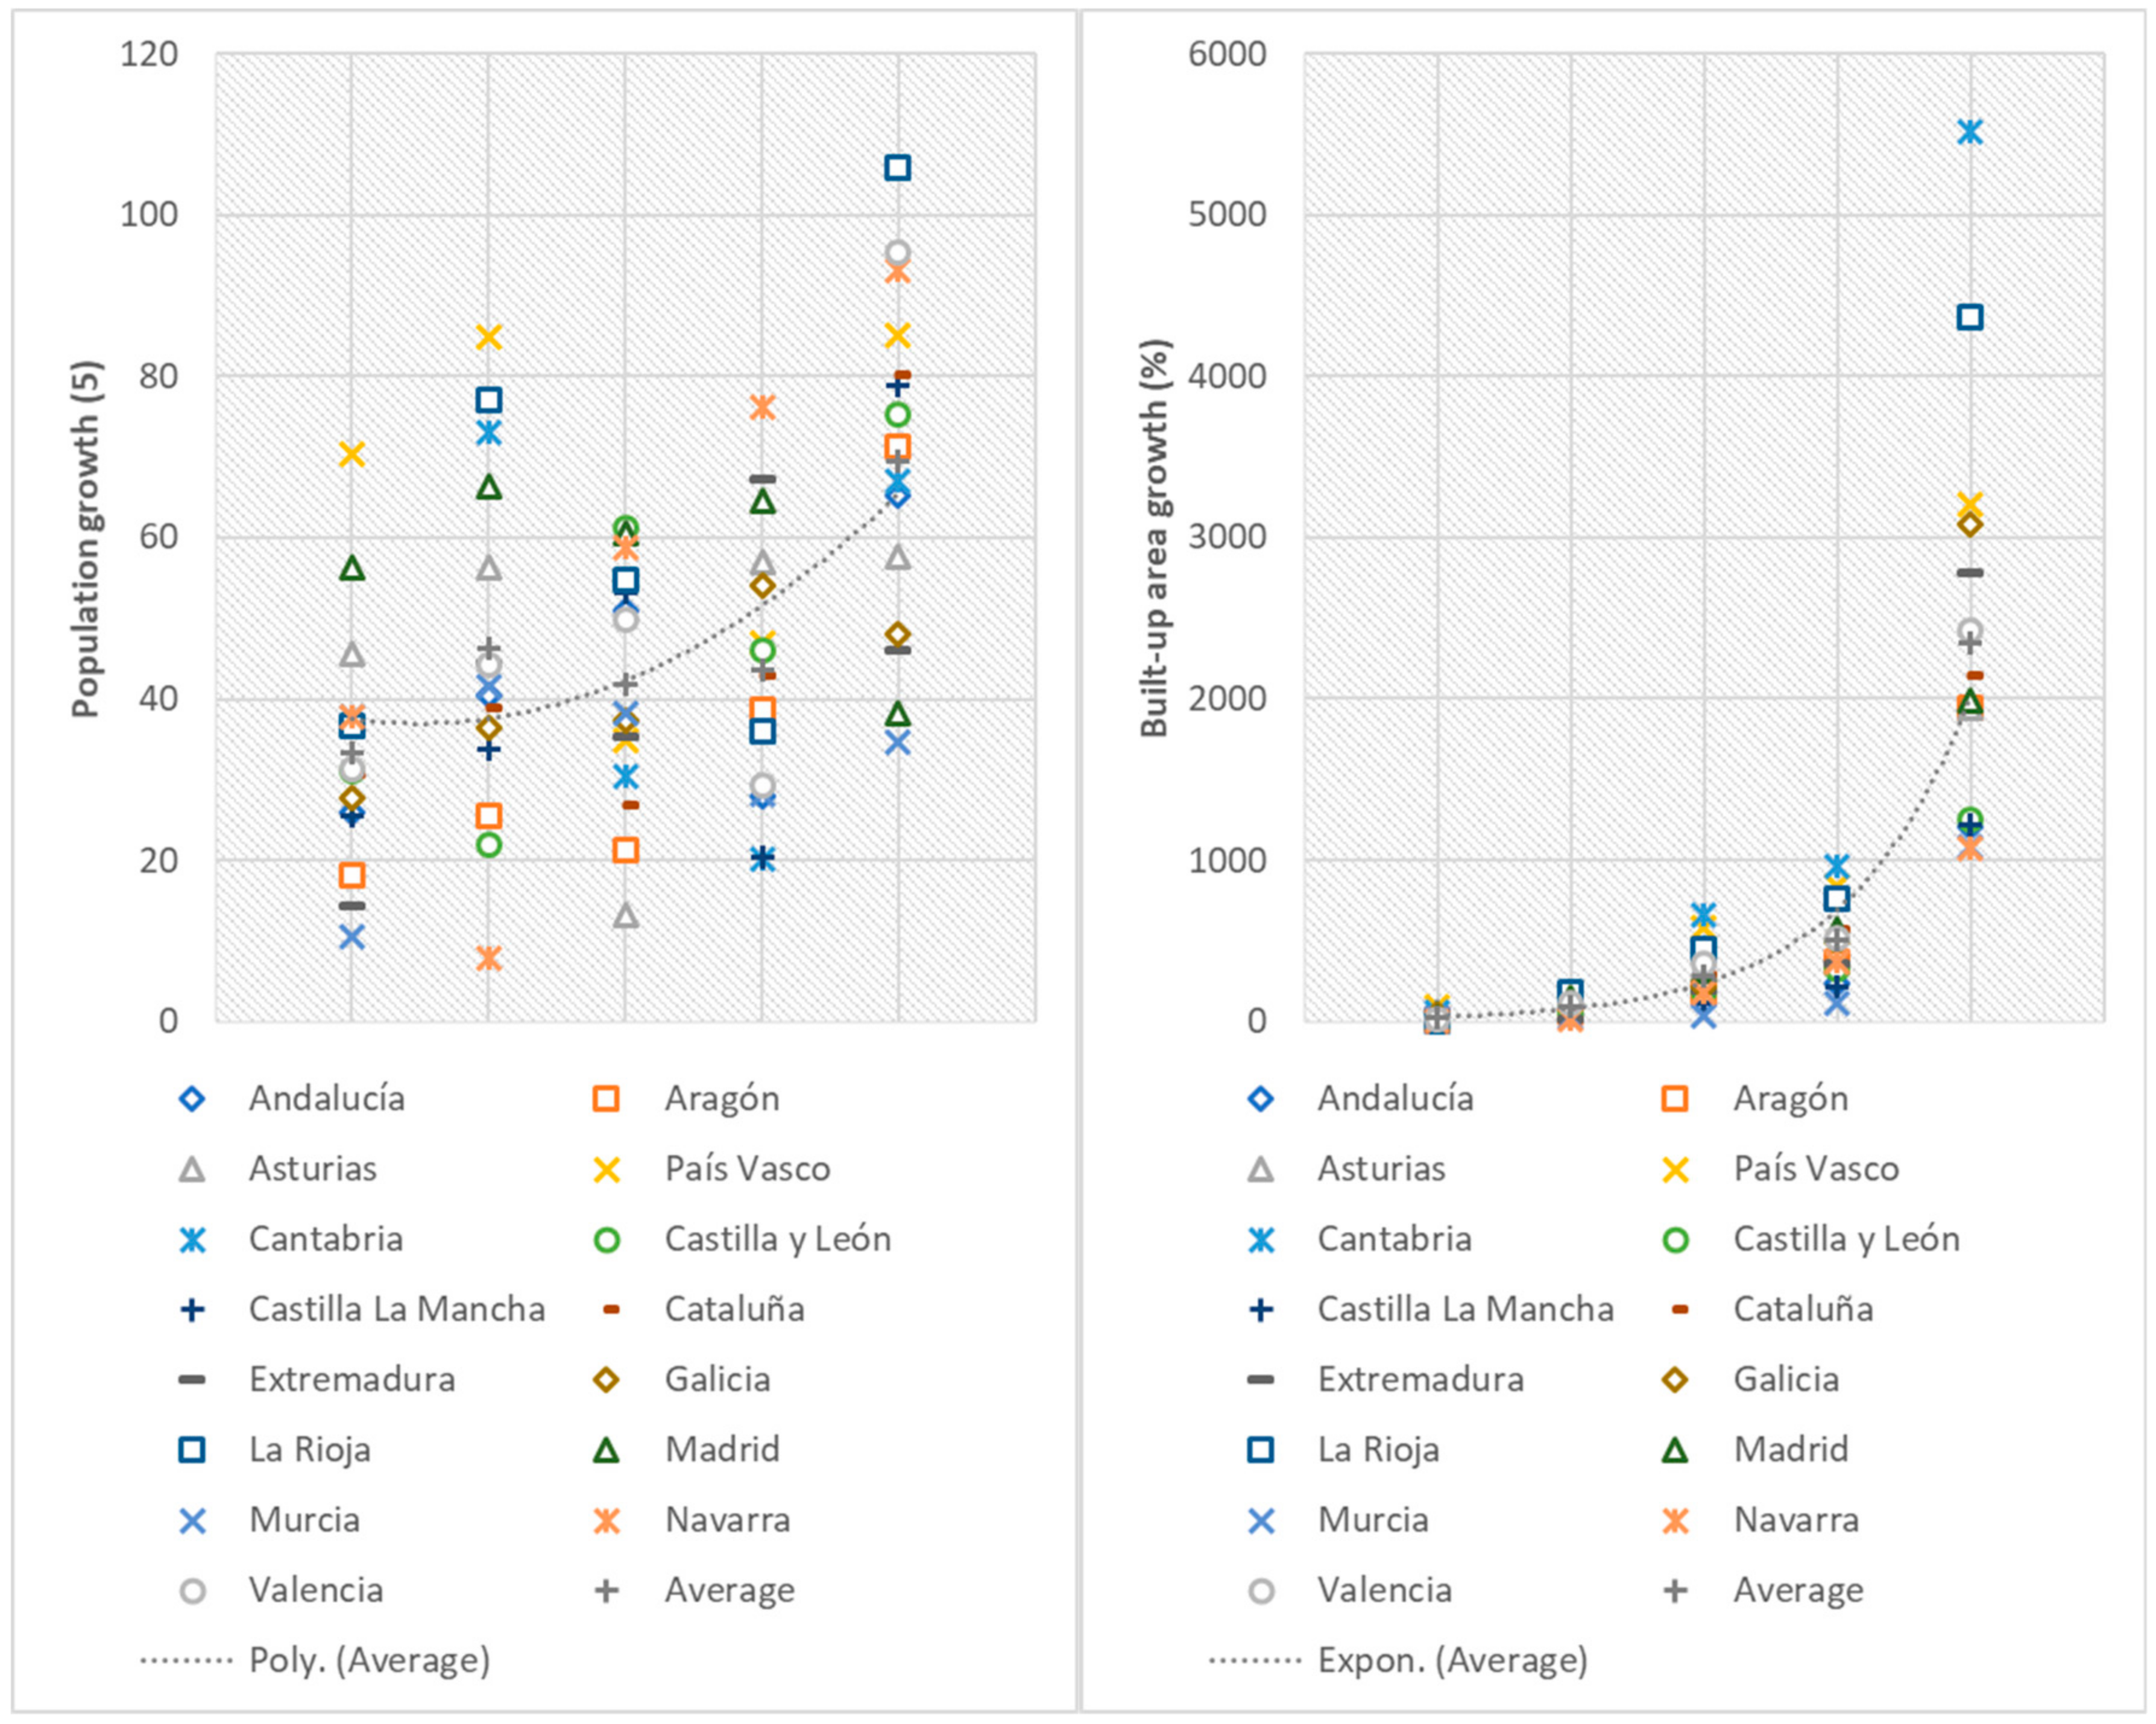
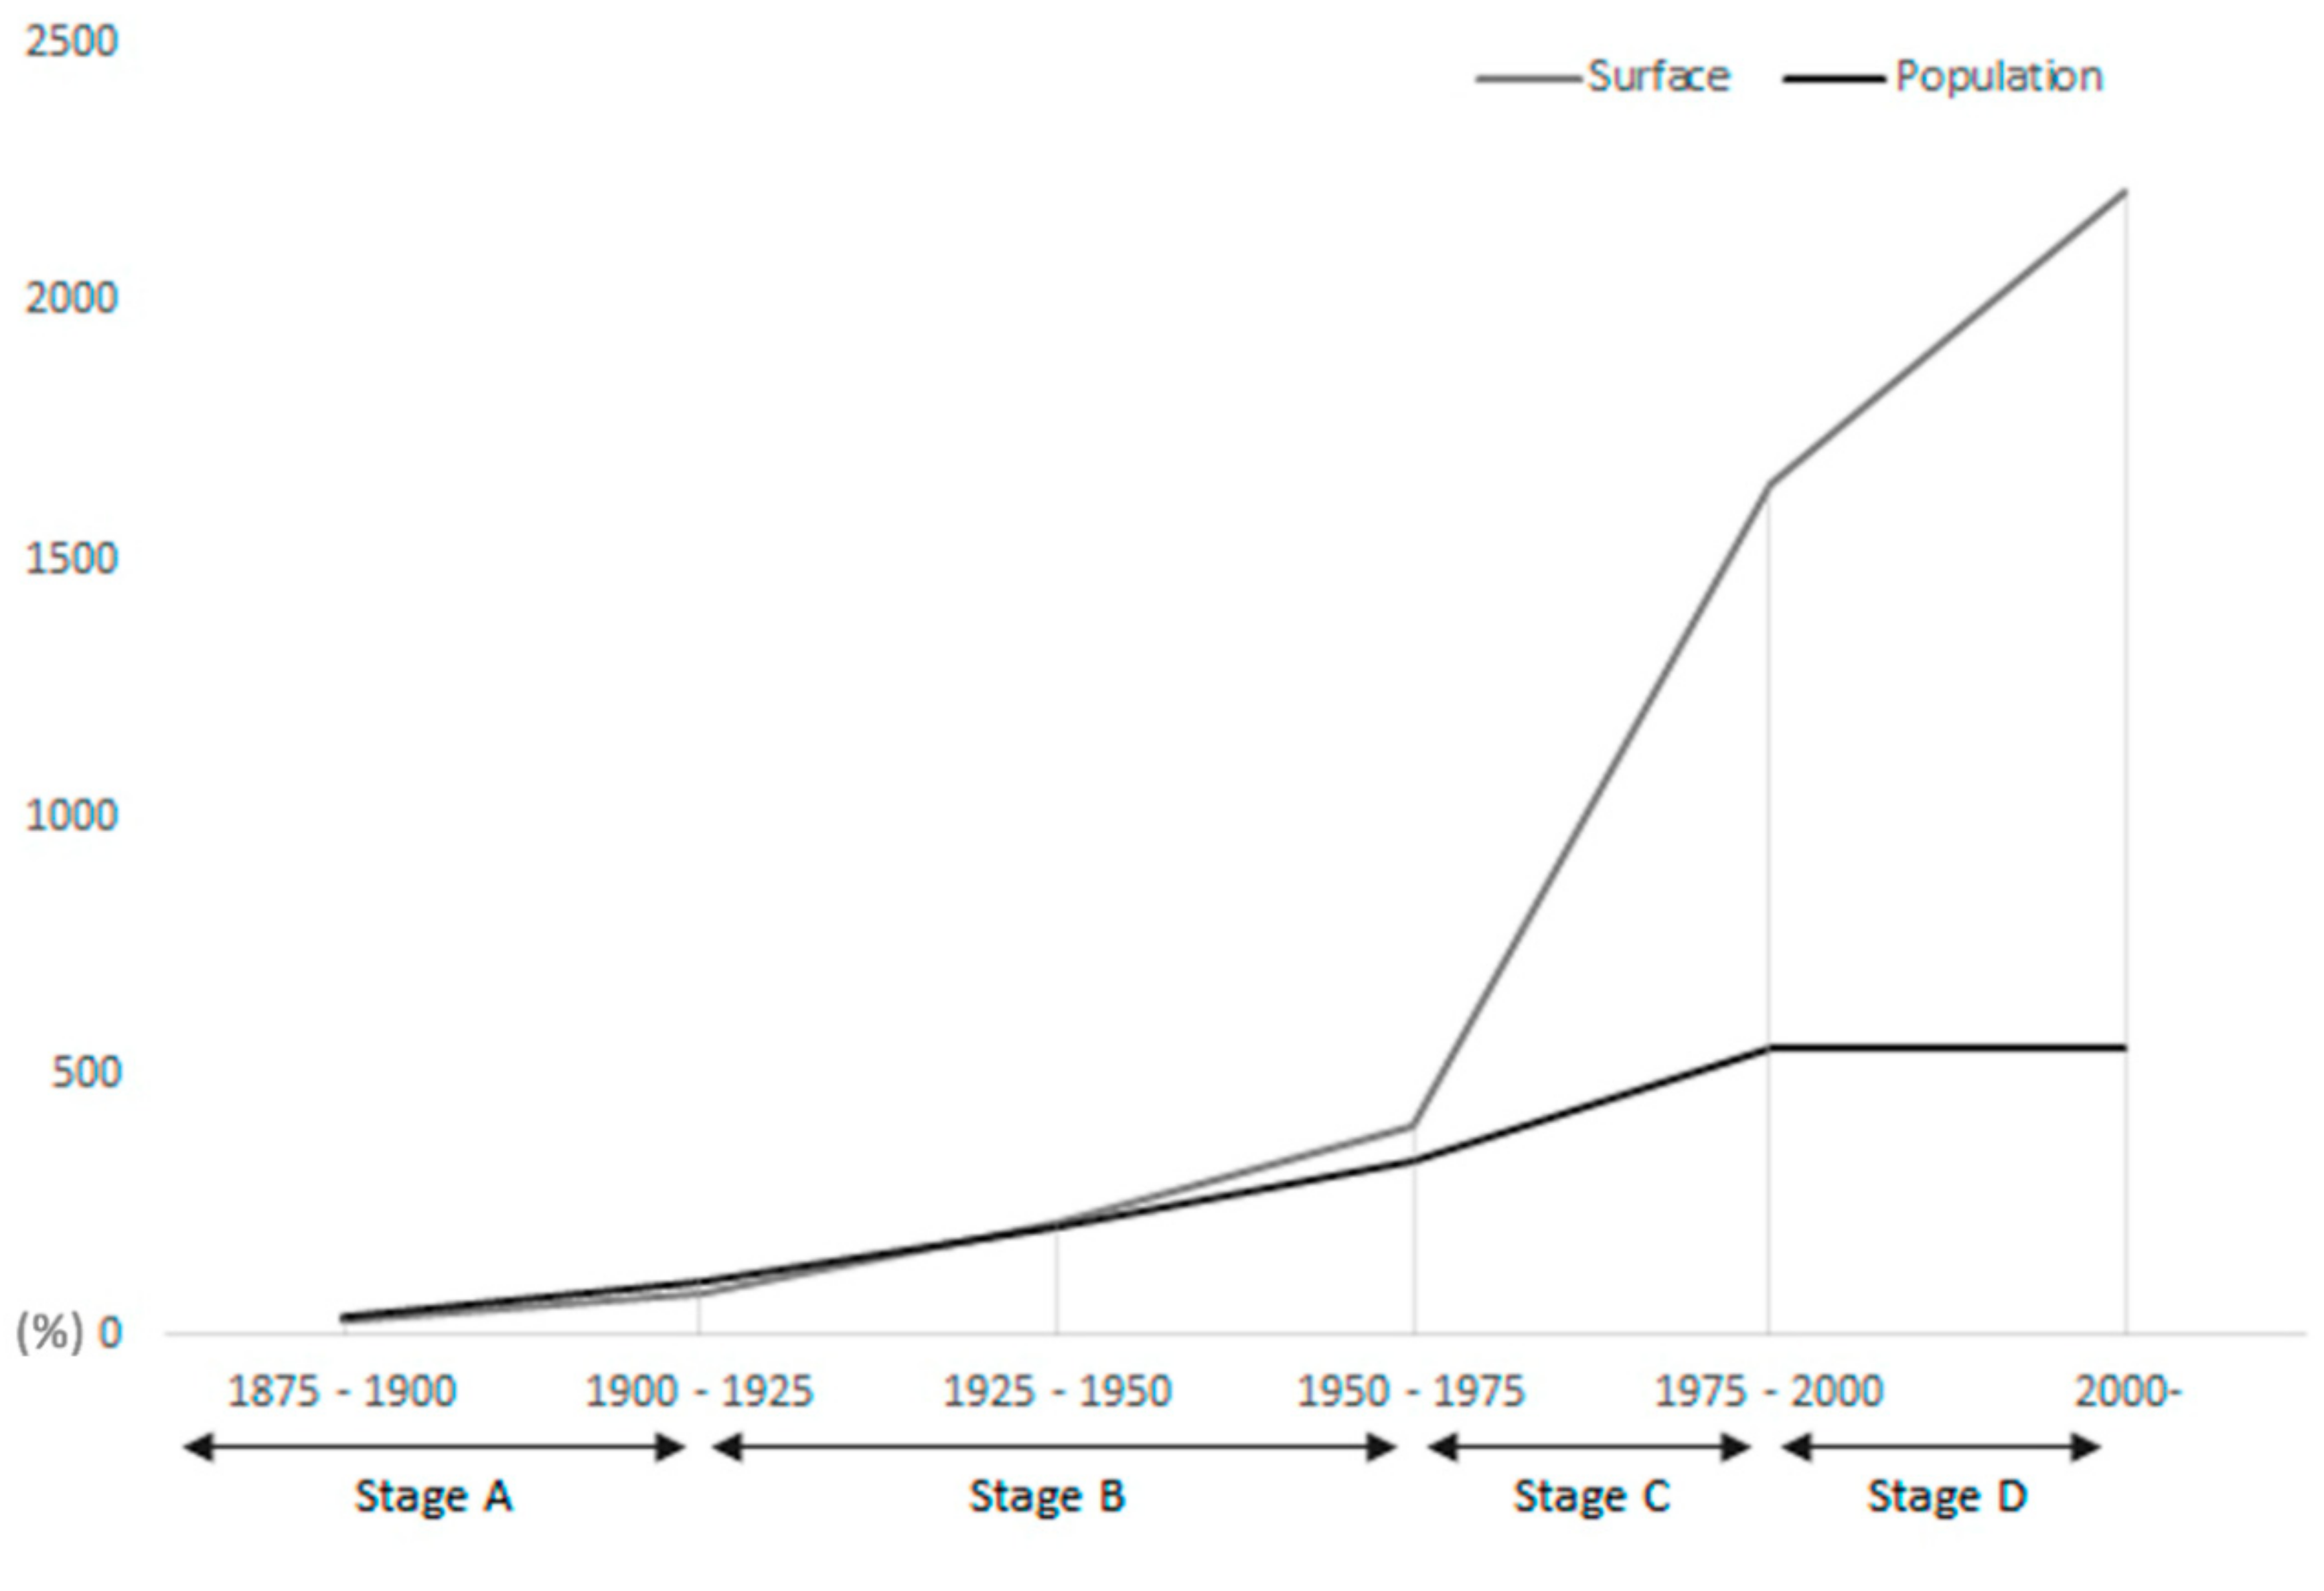
Compiling cartographic information from a diverse variety of sources requires specific work to process the information and make it comparable. Differences in scale, orientation or projection made it difficult to read and analyse the material depicted on the maps [38]. We had to devise a specific methodology for the construction of a homogeneous GIS showing the evolution of Spanish cities. We therefore opted for the creation of Historical Urban Morphological Zones (H-UMZ). Although there had been a precedent for UMZ in Spain, based on the Land Use Information System (whose Spanish acronym is SIOSE), we preferred to define a new methodology that could be readily assimilable with the EEA’s UMZ (Figure 2) [39,40]. This enabled us to start from an existing database and to create a retrospective view by projecting backwards until the mid-nineteenth century.
The process of transcribing the cartographic sources was carried out manually and involved identifying the urban fabric constructed in each period and city with respect to the cartography. We established the year in which each plot, or urban block, was developed by using GIS [41,42,43,44]. We did so by assigning a binary variable: value of 1 to urban blocks already built and value of 0 to the rest. This part of our work required various iterations until we were able to ensure that the resulting GIS map matched our old urban maps. We acknowledge that finding spatial relationships between recent and historical sources can be confusing and tends to be rather subjective. It can result in geometric distortions, distort our understanding of urban change or even cause a lack of correspondence between the present and historic urban fabric of the city [45]. The quality of the sources has a direct influence on the reliability of the results, especially for the initial periods when it is easier to misread the original data.
A representation of the city at the plot level was therefore first transformed into one of urban areas for each period and then into H-UMZ. The objective behind defining the urban areas was to group together all the blocks that formed part of the urban fabric to create a single polygon. The parameters used for the grouping of these elements also made it possible to include the river courses and channels of communication belonging to the urban space. The EEA’s UMZ finally grouped together residential, commercial, industrial and gardened zones, as well as the river courses and communication channels which separated neighbouring plots within the built-up area.
The result was a polygon of continuous urban areas that did not distinguish between different land uses. The next task was to aggregate the H-UMZ. By definition, these zones had to be “a set of urban areas lying less than 200 m apart” [46]. We began by using previously generated urban areas, which we spatially aggregated with other neighbouring areas lying less than 200 m from them. Finally, we converted the resulting polygons into a 100 × 100 m vectoral grid in order to morphologically harmonise across cities and periods. In this process, we also eliminated any elements that were smaller than 25 ha in area: the minimum cell size for the CLC.
The result was the H-UMZ database for Spain, which made it possible to identify the space occupied by urban zones in the main Spanish cities during each period. Figure 3 shows the practical application of this method for San Sebastián, with seven time-slices between the years 1867 and 2006. This harmonised process allowed us not just to quantify the physical extension of each city, but also to cross this information with other types of data such as population censuses.
Finally, we calculated the population density based on the relationship between the population and the built-up area corresponding to each period and city. Population density is often measured by dividing the population of a given administrative area by its total surface area. Our method relied on the division only by the actual built-up area, estimating the real density of the city and excluding any bare land (Equation (1)). This measure gave us a comparable indicator with which to assess changes in urban density, both in qualitative and quantitative terms.
N e t   P o p u l a t i o n   D e n s i t y = P o p u l a t i o n   i n h a b . B u i l t u p   A r e a   H a
Two main criticisms can be levelled against this approach. First, it is important to note that some small rural nuclei were included within the municipal areas. Although these lacked sufficiently large size and were omitted by the H-UMZ estimation, we included their populations, assuming the deviation that this implied was fairly small. In any case, this omission underestimated the growth in the built-up areas, limiting the decrease in our calculations regarding population density. Second, it is worth noting that urban areas in large cities tended to overspill their municipal boundaries, which means that the actual built-up area considered in our study was limited by the administrative boundaries. However, this effect was only significant for interpreting the last two periods and for certain specific cities, most notably Barcelona and Bilbao.

3. Results

The total built-up area of the municipalities analysed grew continuously from the beginning of the period studied. Its total size expanded from 63 km2 to over 1400 km2 in 2006. This means that its siza multiplied by a factor of 22 in a century and a half, implying an average annual growth rate of about five per cent.
Table A2 (in the Appendix A) shows the results considering the increases in the size of the built-up area for all of the periods and cities studied. As expected, Madrid was the largest city in all of the periods analysed, having started at 966 ha. It was followed by Sevilla and Barcelona, both with initial areas slightly over 400 ha. At the other extreme were cities such as Logroño, Ourense and Pontevedra, with initial built-up areas of less than 30 ha. Whereas in the last period, the smallest cities were Soria, Cuenca and Huesca, whose areas ranged in size from 529 to 640 ha. The largest cities in the latest period were Madrid (27,858 ha), Zaragoza (8667 ha) and Barcelona (8464 ha).
The average size of the cities studied was 133 ha in the initial period, while by the final period it had grown to over 3000 ha. This evolution shows the tremendous growth experienced by all of the cities. In absolute terms, it has been the initial largest cities that have grown the most. For example, the initial surface areas have multiplied by factors of 28, 43 and 20 in Madrid, Zaragoza and Barcelona respectively. However, in relative terms Alicante, Santander, Burgos and Ourense are the cities that have experienced the greatest urban growth, multiplying their initial surface areas by factors of more than 60. In contrast, the municipalities that have grown least have been Soria, Cuenca, Cádiz and Huesca, whose total growth in urban area ranged from 488 ha in the case of Soria, to 596 ha in that of Huesca. In relative terms, the cities that have grown least have been Cádiz, Granada, Jaen and Segovia. In the case of Cádiz, the total built-up area has multiplied by a factor of five, while it has multiplied by almost eight in the other cities [47].
Figure 4 shows the percentage of municipal area occupied by the urban fabric by periods. We can observe that the greatest growth in the total built-up area has taken place during the last two periods. In 1975–2000, the total growth for the whole sample was 78,001 ha, while it was 35,057 ha in the very last one. The factors that most determined these results will be explained in the discussion section.
Some results should, quite logically, be treated with a certain degree of caution. Cases such as Barcelona and Cádiz present a high percentage of surface occupation of flat terrain. Meanwhile other areas of their municipalities correspond to zones in which the characteristics of the terrain have made construction either difficult or almost impossible. As a result, their expansion has spilled over into neighbouring municipalities. Pamplona and Santander also presented a high percentage of occupation because their municipal areas are relatively small. In contrast, those of Caceres and Cuenca are very large and predominantly rural in character. Taking this into account, we compared this information with the total population figures for these cities.
This growth in the built-up area has been accompanied by an increase in population from 2 to 13 million, considering all 47 cities. Although this increase has been considerable, it has been much smaller than that in the total built-up area. The difference between the rhythm of growth of the urban area and that of population has resulted in variations in the population density of each municipality which, in turn, serves as an indicator for analysing the compactness of these cities. The reduction from 323 inhabitants per ha (the average population density in the first period) to 84 in the last one can be explained by the transition from the compact city to a new model more characterised by urban sprawl. Even so, these changes have not been homogeneously spread over space and time.
Table A3 (in the Appendix A) shows data for the population density of the built-up areas organised by periods. The shaded squares in the table show periods of higher population growth related to the expansion of the surface areas. Bilbao, for example, went from having a population density of 516 per ha in the initial period to one of 719 per ha in that of 1900–1925. During the latter periods, there has been a general fall in population density, with all of the cities studied losing compactness. The largest decreases in population density were recorded in the period 1975–2000 and are attributable to rapid expansion and urban sprawl. In this period, all of the cities experienced declines in their population density. Good examples of this tendency are provided by Murcia, whose population density fell from 379 to 93 inhabitants per ha, and A Coruña, where it fell from 395 to 142 per ha.
Analysing these variables by region, or autonomous communities, allows us to confirm the general patterns, but also to identify some singularities. Figure 5 plots the evolution of the two disaggregated variables: population growth and growth of the built-up area of those cities under study.
In terms of population growth, the figure shows a gradual tendency for growth in average terms, but the different regions perform differently. The cities in the northern regions, País Vasco, Asturias, Cantabria and La Rioja, showed high rates of population growth in the first two periods, as did the capital, Madrid. In the final period, cities in Navarra led the growth followed by those in La Rioja, País Vasco, Valencia and Cataluña. Murcia and Aragón, on the other hand, were the regions whose cities had the lowest levels of average population growth throughout the study period. These results are in line with those of previous related studies [13].
In terms of the built-up area, the growth trend has been exponential, with virtually zero growth in the first periods and a pronounced final rise. The regions with cities showing the highest growth coincide with those with the highest population growth: Cantabria, La Rioja and País Vasco. On the other hand, in Murcia, Castilla y León, Andalucía, Navarra and Castilla La Mancha, the average growth values of cities lag far behind those in the leading regions.
Whatever the case, the disaggregated data obtained by region was not considered significant enough to perform more detailed analyses. We therefore opted to interpretat the aggregate results, including all the cities analysed.

4. Discussion

Variations in the rhythm of growth of the built-up areas and the total population of the municipalities allowed us to distinguish four different stages of development in terms of urban compactness (Figure 6). Stage A (1875–1925) was characterised by a slight increase in population densities in the cities. In Stage B (1925–1975), densities began to decline at a moderate rate. Stage C (1975–2000) showed the most pronounced extension of the built-up area. Finally, in Stage D (from 2000 onwards), the main characteristic has been stagnation in terms of total population numbers. In this section, we examine these four stages and contextualise their evolution with respect to the historical, political and economic reality of Spain.

4.1. Stage A—The Clogging Up of the Walled City

Although we did not have any previous data, we believe that this stage probably represented the historical tendency and lasted until around the first third of the twentieth century. This stage was not characterised by any significant urban development, but it provided the base for subsequent urban growth leading to population extending beyond the limits of the old walled Spanish city.
During this period, the first stages of industrialisation produced a multitude of changes at every level, which included a new spatial distribution of population [48]. The progressive mechanisation of agriculture and the creation of new places of work in cities gave rise to a rural exodus. Migratory movements towards cities became continuous from around 1860 onwards and then suddenly accelerated with the spread of railways and the arrival of imported cereals [49,50,51]. In addition, the liberal revolution of 1833 and a new territorial division initiated a centralising process at the national level that benefited the state capital. The accumulation of infrastructure and services was such that Madrid became the centre of the country in every respect. This same process was repeated at a lower scale when an intermediate level of administration was created between that of the state and the municipalities: the province. The capital of each province concentrated new activities in the tertiary sector, such as administrative and social services, which attracted population from its sphere of influence [52]. In fact, the populations of all the cities studied doubled during this period. In this respect, it is particularly relevant to highlight the cases of Bilbao, San Sebastián and Huelva, whose urban populations increased significantly (by 327, 297 and 274 per cent, respectively). Only the populations of Cádiz, Teruel and Burgos grew at rates of less than 20 per cent during this stage (Figure 7).
The initial reaction to population growth in the cities was internal reform. More specifically, construction pattern changes and this led to an increase in the height of buildings. There were also some significant changes in land use and ownership, such as those that took place following the disentailment of ecclesiastical properties which heralded the founding of a new liberal state in the 19th century [53,54]. These new policies permitted the creation of new urban spaces in order to meet the growing demand for housing within the walled city.
The defensive wall remained present in most cities and was still considered a key piece of infrastructure, even though it obviously limited the growth of the built-up area. Even in the 1840s, 145 population nuclei were still considered Plaza Fuerte (fortified squares), with contemporary legislation impeding construction in their immediate surroundings due to military constrains [55].
Despite this reticence to eliminate the old city walls, population growth within cities increased, so maintaining them was no longer a viable option because of this demographic pressure. Moreover, the densification within the city walls brought with it health problems given the deficient hygienic conditions. This led to the creation of the first extramural neighbourhoods (arrabales). These took the form of continuous built-up areas outside the city walls. It also led to the creation of suburbs that infringed contemporary regulations; and these became the first set of informal settlements. This phenomenon developed even further with the spread of railways and the location of new stations outside the old city walls [56,57].
In an attempt to deal with all these situations, plus the growing interest of the upper-middle class in having their own urban space, public authorities promoted the development of the first ensanches. Those areas of planned urban expansion were based on the growth of the urban fabric by the continuous extension of its infrastructure and the real estate business created around it [11]. Cerda’s project for Barcelona, approved in 1859, was the first example. It defined an orthogonal grid of streets and urban blocks and sought to organise growth and interconnect the old settlements on the plain next to the city. From this moment onwards, the occupation of urbanised land progressively responded to new needs. These were driven by the increase in population and demands for a better quality of life from the upper classes and the emergent middle classes [58,59,60,61,62].
Whatever the case, while the resulting increase in population was higher than 100 per cent on average, the expansion of the built-up areas did not reach 80 per cent. The process of urban densification within the city walls was therefore even more important in aggregate terms than the construction of the newly planned areas outside them; this was a situation that persisted until the second third of the twentieth century (Table A3 in the Appendix A).
A detailed analysis of this phenomenon also reveals regional differences. The growth was consistent in both the built-up area and population, particularly in the northern half of the peninsula (Figure 7). Bilbao is a relevant case to highlight, having been clearly affected by its relatively early industrial development.

4.2. Stage B—The Shaping of the Urban Ensanches

This development stage was characterised by a marked economic growth concentrated from the first to the third quarter of the twentieth century. One of the consequences of this was a rural exodus and rapid urban growth in some regions of the country. In urban terms, two phenomena occurred simultaneously. The urban bourgeoisie took advantage of the new transport modes to locate their houses in the new planned neighbourhoods, in a similar way to what happened in the Anglo-Saxon context with the garden cities [63]. Workers and immigrants predominantly remained in the old city, although in some cases the demographic pressure was sufficiently high that areas of informal housing were created on the peripheries of Spain’s largest cities.
This urban growth and the associated economic development were then abruptly interrupted by the Spanish Civil War (1936–1939). As a result of the subsequent destruction, the first years after the conflict were dedicated to urban reconstruction and the rebuilding of basic infrastructure. After the civil war came the toughest period of the dictatorship: that of autarky (1939–1959). During this period, Spain was subjected to an international commercial embargo, which clearly limited the economic performance and expansion of its cities. Later, from the 1950s onwards, the Spanish economy was gradually reopened, and the country underwent a period of industrial development that favoured urban growth in all senses. Credit facilities from foreign countries and tourism subsequently started to yield important benefits. Both the public and private sectors played a key role in the development of new urban areas for working and upper-middle class people, respectively. In this regard, ensanches played a key role in structuring the shape and defining the location of housing, industry and other land uses [64,65].
In Figure 8, it is possible to see how the growth in the built-up urban area was relevant in all of the cities studied. In fact, only five of the cities analysed: Castellón de la Plana, Ciudad Real, Murcia, Granada and Teruel, failed to see their built-up areas doubled in size. It is relevant to highlight the cases of Zaragoza and Ourense whose urban areas grew by more than 400 per cent with respect to Stage A. In general, the greatest dynamism continued to be found in the north of mainland Spain, as this was the most industrialised and expanding part of the country, albeit to a lesser extent than during the previous stage.
Demographic growth was also positive but limited in relative terms. This resulted in widespread falls in population density (Table A3 in the Appendix A). In fact, only Palencia and Zamora saw their population densities increase during this period: from 184 inhabitants per ha to 187 and from 124 ha to 126, respectively. Such small variations were attributable to the fact that in these cities, as in Madrid and Ciudad Real, the growth in the built-up area took place at almost the same pace as the growth in population; as a result, the population density remained stable.

4.3. Stage C—The Maturity of the Compact City

This stage corresponded to the period between the end of the dictatorship (1975) and the turn of the twenty-first century. Although the data for this period have been presented in line with the main milestones in Spanish history, it would perhaps be more logical to establish the beginning of this stage in the 1960s. The reason for this was that the Stabilisation Plan of 1959 heralded an important change in every aspect of life in Spain. It marked the end of the period of autarky and set the country on the road to industrial modernisation, with a consequent increase in productivity [66]. This activated a large-scale rural exodus towards the largest cities on an unprecedented scale [67]. The Economic Development Plans of the 1960s led to rapid industrialisation in some regions and played a vital role in this new strategy. A new period of growth started in 1986 when Spain joined the European Economic Community (EEC). This catalysed the country’s economic growth and transformed its society and its urban dimension, under the recently installed democratic system [68].
The popularisation of the transport modes also played a decisive role in the acceleration of urban expansion. In fact, the industrial growth that occurred near cities could not be explained without considering the fact that workers began to have their own vehicles at popular prices. As a result, working-class people no longer needed to live near their places of work. The freedom provided by the motor car, combined with a lack of regulatory instruments, led to the explosion of the cities [69,70]. People created new housing necessities, including that of having parking spaces where they lived, as well as more modern utilities and lower density areas with parks and green spots. Cities grew not only in a continuous way, within their respective built-up areas, but also by spread out across the urban fringe.
Another important factor was the development experienced by the tourism sector from the 1960s onwards. This required a large-scale consumption of land near the coast for the construction of resorts and tourist-oriented neighbourhoods. This was particularly evident in the Mediterranean area, where second housing fiercely competed for land with hotels and other tourism-related uses [71]. From 1950 to 2001, the percentage of second homes climbed from less than 3% to 16%, reaching 3.3 million dwellings in total [72]. According to data gathered from the 1991 census, the likelihood of owning a second house in Spain was almost 12% on average (16% using current data), with an important concentration in absolute numbers in Madrid (15,4%) and Barcelona (14,2%). In terms of socioeconomic status, belonging to the upper class raised the probability of owning a second house more than 3 times in relation to working classes [73]. This phenomenon was surpassed though by the large number of foreign residents owning houses in specific regions. In Alicante, for instance, some municipalities show percentages of foreigners over 70% of the total ongoing population censuses [74].
The municipality of Tarragona provides a clear example of the development of the built-up area during this period: its urban area increased by 1108 per cent with respect to the previous stage. In Tarragona, this was associated with the combination of the large-scale development of the petrochemical industry, which occupied a large area of land around the city’s port, and its consolidation as a tourist destination.
During this period, the size of Spain’s built-up area grew at a much faster rate than that of the population in all of the cities studied (Figure 9), which caused a generalised fall in population density (Table A3 in the Appendix A). During this stage, the population densities of cities such as Murcia, A Coruña, Pontevedra, Badajoz, Ourense and Lugo fell by over 200 inhabitants per ha.

4.4. Stage D—The Metropolisation of the City

The main characteristic of this stage was stagnation in terms of population growth in most of the municipalities studied. The reason was that Spanish population decreased, and the country’s total population only remained at the same level because of immigration. Furthermore, the main cities did not attract new residential population, which tended to drift towards smaller municipalities lying within their areas of influence. By 1997, the seven largest cities (with the exception of Zaragoza) were already clearly supramunicipal in character, which meant that their urban built-up areas spread across several municipalities [75]. This phenomenon has been masked by the fact that we only studied provincial capitals, but contemporary literature clearly highlights this trend as well [76].
In contrast, in terms of urban development, this has been a dynamic period. The property business enjoyed its heyday between the late-1990s and the mid-2000s, until the bursting of the construction bubble in 2008. Before 2008, a significant increase in the number of low-density housing estates was heavily linked with the increase in rates of car ownership. As with population, the municipalities that have most attracted this type of investment have been those nearest the major cities. A clear example of this is the metropolitan area of Barcelona, outside the city itself. This increased daily commuting journeys and led to a fall in housing-related costs at a time when the price of a square metre of urban land in the city centre rocketed. The rise in peripheral municipalities consolidated, thus, the process of metropolisation [77,78].
In this stage, the provincial capitals near Madrid have experienced high rates of growth in their built-up areas. This can be explained by the fact that they belong to the great area of influence of the capital, which often extends beyond the border of its own autonomous community. It has also been possible to appreciate high levels of growth in the built-up areas of some coastal municipalities, including Castellón de la Plana, Alicante and Murcia, all located on the Mediterranean coast. These were the most dynamic areas for new urban development promotions prior to the bursting of the property bubble. By contrast, 13 capitals have lost population, with the most outstanding of these being the major cities: Madrid, Barcelona, Bilbao and Valencia. These losses have, however, been compensated by the growth of the municipalities within their areas of influence. The capitals that have grown in population have done so at much lower rhythms than in earlier periods. This difference between the rhythms of growth of population and in the built-up areas has meant that all of the municipalities studied, with the exception of Lugo, have experienced further falls in their urban population densities (Table A3 in the Appendix A).

5. Conclusions

This article proposes a new methodology to quantify the growth of built-up areas over time in order to better understand the evolution of population density in compact cities. To do this, we combined old cartography with aerial photography and the EEA’s UMZ database. With this input, we created a database which included the size of built-up areas from the middle of the nineteenth century through to the present day. The data showed how the size of the total built-up area multiplied by a factor of 22 over the study period (from 133 ha in our first period to more than 3000 ha). Population growth was also high, with the total population of these cities having increased from just under 2 million to almost 13 million. These data were useful for the calculation of population density. The average population density for all of the cities initially analysed rose from 323 inhabitants per ha, in the first period, to 337, between 1900 and 1925, before subsequently falling to 84 in the final period.
These path variations made it possible to identify four stages of development in the cities analysed. The first stage, the clogging up of the walled city, shows how population growth was greater than the increase in surface area. It implied a densification of the old city contained within its walls. Construction patterns then changed, as did land uses and the ownership structure. This allowed an increase in the height of new buildings, combined with specific interventions to ensure minimum levels of public health. The second stage, the shaping of the urban ensanches, includes the period between growth beyond the walls and the consolidation of the first planned urban developments. New urban sectors were built by extending the historic centres, but also by growth further away and supported by new modes of transport. In this period, population growth was lower than that of built-up area, which constituted a turning point in terms of population density. The third stage, the maturity of the compact city, corresponds to a period of strong socioeconomic and territorial development. New urban sectors were driven by public and private agents, causing unprecedented urban growth. Population growth was high, but nothing compared to the growth of the build-up area. As a result, population density plummeted. The last stage, the metropolitanisation of the city, is characterised by the overspill out beyond the administrative boundaries of the old cities. Although the urban fabric continued to grow, the municipal scale was exceeded, and metropolitan areas began to emerge. Numerous population groups decided to leave the central city and settle on the periphery. This was accompanied by population stagnation at the municipal level, which further reduced population densities.
The results of the comparison between the evolution of the built-up areas with population figures demonstrate the importance of finding new instruments to quantify population density over time. In a context of increasing urbanisation and urban expansion, our indicators allowed us to find specific patterns which could not have been identified from a simple analysis of population data. The results responded to our initial hypothesis, showing a huge divergence between variables from 1950 onwards and resulting in an important decrease in population density in the continuous urban fabric of Spain’s main cities.
Our model of historical urban growth opens the way for new lines of research, some of which are already underway. These include quantitative analysis to establish the determinants of urban growth, based on such factors as physical geography and different infrastructural networks. Increasing the size of the sample analysed and seeing how cities interact with different factors would also help to improve our understanding of metropolitan areas and to find more efficient solutions to current challenges. It could also lead to investigating how public policies have contributed to urban change. The first Land Law in Spain was passed in 1956, but it was only after subsequent reforms that growth patterns clearly began to change. It could be interesting to analyse whether the current legal framework has introduced new mechanisms capable of altering these tendencies towards excessive growth.

Author Contributions

Conceptualisation, Methodology, Validation and Writing—review & editing, Funding acquisition: E.J.A.-P. Funding acquisition, Project administration, resources, supervision, Writing— review & editing: J.M.-H. Formal analysis, Investigation, Methodology and Writing—original draft: J.S.-J.

Funding

Spanish Ministry of Science, Innovation and Universities and BBVA-Foundation, project “El ferrocarril y la ciudad en la encrucijada: paisaje urbano y patrimonio industrial en el entorno de las estaciones de la Península Ibérica, 1850–2017 (EstaciónDigital)”. Universitat Oberta de Catalunya has paid the APC.

Acknowledgments

We would like to acknowledge Eduardo Olazábal and Mateu Morillas for their work as research assistants. We would also like to express our gratitude to the referees for their valuable comments.

Conflicts of Interest

The authors declare no conflict of interest.

Appendix A

Table A1. Year and type of source for each period and city.
Municipality–18751875–19001900–19251925–19501950–19751975–20002000–
A Coruña1865188419191945–19461956–195719902006
Albacete1861187619191945–19461956–195719902006
Alicante1859187819191945–19461956–195719902006
Almería1864189719191945–19461956–195719902006
Ávila1864189719191945–19461956–195719902006
Badajoz1873-19191945–19461956–195719902006
Barcelona18571889191919281956–195719902006
Bilbao1857188919191945–19461956–195719902006
Burgos1868187719191945–19461956–195719902006
Cáceres1853-19191945–19461956–195719902006
Cádiz1868188019171945–19461956–195719902006
Castellón de la Plana1852-19191945–19461956–195719902006
Ciudad Real1857188619191945–19461956–195719902006
Córdoba1851188419191945–19461956–195719902006
Cuenca1854187519191945–19461956–195719902006
Girona1851187619191945–19461956–195719902006
Granada1868189419191945–19461956–195719902006
Guadalajara1854-19191945–19461956–195719902006
Huelva1870-19191945–19461956–195719902006
Huesca1861188419191945–19461956–195719902006
Jaén--19191945–19461956–195719902006
León1862-19191945–19461956–195719902006
Lleida1851188019191945–19461956–195719902006
Logrono1851-19191945–19461956–195719902006
Lugo1864188019191945–19461956–195719902006
Madrid1867188319191945–19461956–195719902006
Málaga1863188319191945–19461956–195719902006
Murcia1810189619191945–19461956–195719902006
Ourense1856-19191945–19461956–195719902006
Oviedo1853188519191945–19461956–195719902006
Palencia1852188619191945–19461956–195719902006
Pamplona1861188219191945–19461956–195719902006
Pontevedra1856188719191945–19461956–195719902006
Salamanca1867189019191945–19461956–195719902006
San Sebastián1867189719191945–19461956–195719902006
Santander1865188319191945–19461956–195719902006
Segovia1849189719191945–19461956–195719902006
Sevilla1868188419191945–19461956–195719902006
Soria1860188119191945–19461956–195719902006
Tarragona1858188019191945–19461956–195719902006
Teruel1869188119191945–19461956–195719902006
Toledo1854187919191945–19461956–195719902006
Valencia1850188219191945–19461956–195719902006
Valladolid1852188119191945–19461956–195719902006
Vitoria1864188619191945–19461956–195719902006
Zamora1863-19191945–19461956–195719902006
Zaragoza1853188019081945–19461956–195719902006
Historical cartography Aerial photographyUMZ
Table A2. Built-up area by stage, period and city (ha).
Surface (ha)Stage AStage BStage CStage D
Municipality–18751875–19001900–19251925–19501950–19751975–20002000–
A Coruña8311213424944017411844
Albacete707311924038620282559
Alicante778319145466830574698
Almería10312415123532815232016
Ávila81881191822677771234
Badajoz70707021034125634194
Barcelona42288616132584474181598464
Bilbao6112818749666914981548
Burgos468513624940521932941
Cáceres48486213421110131545
Cádiz133162185310392697697
Castellón de la Plana72-14320526913932340
Ciudad Real911151331862649261322
Córdoba27932132650888846766792
Cuenca616168107135379611
Girona57698119732711531337
Granada27730530743454615652117
Guadalajara6969741461885841029
Huelva57579615533314401606
Huesca445971120168492640
Jaén108108108170234699829
León7878912703788751570
Lleida494913619536910071262
Logrono30308316525913391736
Lugo53818913721512811231
Madrid96612452393397464742012827858
Málaga268319369592100546975995
Murcia29936036640164335465875
Ourense2727398420510971732
Oviedo578912125449511651782
Palencia7790109160256836955
Pamplona11412013432553513361786
Pontevedra244474921659971053
Salamanca14916320743158612181655
San Sebastián387712334848316111893
Santander38609328940521342390
Segovia9192116185290555704
Sevilla4695305811159173460717045
Soria41434796163327529
Tarragona869410417021225612979
Teruel42426591121652850
Toledo12413513619128114872326
Valencia2363234301164146339024804
Valladolid27034740049881527464067
Vitoria639311720428120332939
Zamora8181149200335809883
Zaragoza199227293673150369068667
Table A3. Population density by stage, period and city (pop/ha.).
Pop/haStage AStage BStage CStage D
Municipality–18751875–19001900–19251925–19501950–19751975–20002000–
A Coruña423426475397395142128
Albacete2382612532391806358
Alicante3614633381961828761
Almería27928933831126410283
Ávila1071461291151055940
Badajoz3094085792452664632
Barcelona595434444417322201178
Bilbao516479719363434247226
Burgos6134172452122017357
Cáceres296-3262172187454
Cádiz524391412277293221191
Castellón292-2392122289663
Ciudad Real1171251411681406248
Córdoba1571702232672146545
Cuenca16118822322020811376
Girona2842582391371166056
Granada253237337350284163114
Guadalajara129-20914112410366
Huelva160-3563632259989
Huesca2702432251451409072
Jaén--309302276148136
León146-26016920516583
Lleida41449628119116811189
Logrono389-3402652299177
Lugo3942463362992696572
Madrid328398344333336150105
Málaga37843040939228911187
Murcia2932693754743799363
Ourense445-6634443049462
Oviedo540504579312251168113
Palencia1701701842031879384
Pamplona197258249163175135103
Pontevedra9405724564143077271
Salamanca10914415915415513494
San Sebastián44641354726926710694
Santander8077047863302839076
Segovia1441821581341219877
Sevilla24727135426125511397
Soria1541871771451219966
Tarragona2413062862102074338
Teruel3052992331811804437
Toledo1431471921651454029
Valencia597589575391343193154
Valladolid16418819122018512078
Vitoria37432632024224910174
Zamora166-1241431268073
Zaragoza3604304803052028671
Municipalities that experienced increases in their urban densities with respect to the previous period are shown by shaded cells.

References

  1. Gordon, P.; Richardson, H. Are compact cities a desirable planning goal? J. Am. Plan. Assoc. 1997, 63, 95–107. [Google Scholar] [CrossRef]
  2. Bae, C.-H.C.; Richardson, H.W. Urban sprawl in western Europe and the United States; Routledge: London, UK, 2017. [Google Scholar]
  3. Oueslati, W.; Alvanides, S.; Garrod, G. Determinants of urban sprawl in European cities. Urban Stud. 2015, 52, 1594–1614. [Google Scholar] [CrossRef] [PubMed] [Green Version]
  4. Neuman, M. The compact city fallacy. J. Plan. Educ. Res. 2005, 25, 11–26. [Google Scholar] [CrossRef]
  5. Salvati, L.; Sateriano, A.; Bajocco, S. To grow or to sprawl? Land Cover Relationships in a Mediterranean City Region and implications for land use management. Cities 2013, 30, 113–121. [Google Scholar] [CrossRef]
  6. Le Gallo, J.; Chasco, C. Spatial analysis of urban growth in Spain, 1900–2001. Empir. Econ. 2008, 34, 59–80. [Google Scholar] [CrossRef] [Green Version]
  7. Lanaspa, L.; Pueyo, F.; Sanz, F. The evolution of Spanish urban structure during the twentieth century. Urban Stud. 2003, 40, 567–580. [Google Scholar] [CrossRef]
  8. Muñoz, F. Lock living: Urban sprawl in Mediterranean cities. Cities 2003, 20, 381–385. [Google Scholar] [CrossRef]
  9. Serra, P.; Vera, A.; Tulla, A.F.; Salvati, L. Beyond urban–rural dichotomy: Exploring socioeconomic and land-use processes of change in Spain (1991–2011). Appl. Geogr. 2014, 55, 71–81. [Google Scholar] [CrossRef]
  10. Cebollada, À. Mobility and labour market exclusion in the Barcelona Metropolitan Region. J. Transp. Geogr. 2009, 17, 226–233. [Google Scholar] [CrossRef]
  11. Herce, M. El Negocio Del Territorio: Evolución y Perspectivas de la Ciudad Moderna; Alianza: Barcelona, Spain, 2013. [Google Scholar]
  12. Herce, M.; Miró, J. El Soporte Infraestructural de la Ciudad; Universitat Politècnica de Catalunya: Barcelona, Spain, 2004. [Google Scholar]
  13. Chueca, F. Breve Historia del Urbanismo; Alianza: Madrid, Spain, 1968. [Google Scholar]
  14. Moudon, A.V. Urban morphology as an emerging interdisciplinary field. Urban Morphol. 1997, 1, 3–10. [Google Scholar]
  15. Van den Berg, L.; Drewett, R.; Klaassen, L.H.; Rossi, A.; Vijverberg, C.H.T. Urban Europe: A Study of Growth and Decline; Pergamon Press: Oxford, UK, 1982. [Google Scholar]
  16. Antrop, M. Landscape change and the urbanization process in Europe. Landsc. Urban Plan. 2004, 67, 9–26. [Google Scholar] [CrossRef]
  17. Zitti, M.; Ferrara, C.; Perini, L.; Carlucci, M.; Salvati, L. Long-Term Urban Growth and Land Use Efficiency in Southern Europe: Implications for Sustainable Land Management. Sustainability 2015, 7, 3359–3385. [Google Scholar] [CrossRef] [Green Version]
  18. Salvia, R.; Serra, P.; Zambon, I.; Cecchini, M.; Salvati, L. In-Between Sprawl and Neo-Rurality: Sparse Settlements and the Evolution of Socio-Demographic Local Context in a Mediterranean Region. Sustainability 2018, 10, 3670. [Google Scholar] [CrossRef] [Green Version]
  19. Duvernoy, I.; Zambon, I.; Sateriano, A.; Salvati, L. Pictures from the other side of the fringe: Urban growth and peri-urban agriculture in a post-industrial city (Toulouse, France). J. Rural Stud. 2018, 57, 25–35. [Google Scholar] [CrossRef]
  20. Salvati, L. Monitoring high-quality soil consumption driven by urban pressure in a growing city (Rome, Italy). Cities 2013, 31, 349–356. [Google Scholar] [CrossRef]
  21. Holl, A. Natural Geography and Patterns of Local Population Growth and Decline in Spain: 1960–2011. Sustainability 2019, 11, 4979. [Google Scholar] [CrossRef] [Green Version]
  22. Zambon, I.; Rontos, K.; Serra, P.; Colantoni, A.; Salvati, L. Population Dynamics in Southern Europe: A Local-Scale Analysis, 1961–2011. Sustainability 2019, 11, 109. [Google Scholar] [CrossRef] [Green Version]
  23. Mariani, F.; Zambon, I.; Salvati, L. Population Matters: Identifying Metropolitan Sub-Centers from Diachronic Density-Distance Curves, 1960–2010. Sustainability 2018, 10, 4653. [Google Scholar] [CrossRef] [Green Version]
  24. Salvati, L.; Carlucci, M.; Serra, P.; Zambon, I. Demographic Transitions and Socioeconomic Development in Italy, 1862–2009: A Brief Overview. Sustainability 2019, 11, 242. [Google Scholar] [CrossRef] [Green Version]
  25. Monteiro, J.; Martins, B.; Murrieta-Flores, P.; Pires, J.M. Spatial Disaggregation of Historical Census Data Leveraging Multiple Sources of Ancillary Information. ISPRS Int. J. Geo-Inf. 2019, 8, 327. [Google Scholar] [CrossRef] [Green Version]
  26. Terán, M. Ciudades Españolas; Real Academia de la Historia: Madrid, Spain, 2004. [Google Scholar]
  27. Vilagrasa, J. The study of urban form in Spain. Urban Morphol. 1998, 2, 35–44. [Google Scholar]
  28. Reher, D.S. Ciudades, procesos de urbanización y sistemas urbanos en la Península Ibérica, 1550-1991. In Atlas Histórico de Ciudades Europeas; Guardia, M., Monclús, M., Oyón, J.L., Eds.; Centre de Cultura Contemporània de Barcelona: Barcelona, Spain, 1994. [Google Scholar]
  29. Bretagnolle, A.; Pumain, D. Simulating urban networks through multiscalar space-time dynamics: Europe and the united states, 17th–20th centuries. Urban Stud. 2010, 47, 2819–2839. [Google Scholar] [CrossRef]
  30. Mirás, J. Quiebra del Antiguo Régimen, articulación del Estado y desarrollo capitalista en la urbanización de España (1833–1936). Transp. Serv. Y Telecomun. 2018, 37, 13–44. [Google Scholar]
  31. Quirós Linares, F. Las Ciudades Españolas en el Siglo XIX. Vistas de las Ciudades Españolas de Alfred Guesdon. Planos de Francisco de Coello; Editorial Ámbito: Valladolid, Spain, 1991. [Google Scholar]
  32. Rocafort, C.; Dalmau, C.; Carbó, B.C. España Regional; Alberto Martín: Barcelona, Spain, 1919. [Google Scholar]
  33. Serrano, M. Las Guías Urbanas y los Libros de Viaje en la España del siglo XIX. Repertorio Bibliográfico y Análisis de su Estructura y Contenido; Viajes de papel, Geocrítica: Barcelona, Spain, 1993. [Google Scholar]
  34. Fernández García, F.; Quirós Linares, F. El vuelo fotográfico de la” Serie A”. Ería 1997, 43, 190–198. [Google Scholar]
  35. Olazábal, E.; Alvarez-Palau, E.J.; Barquín, R.; Macías, O.; Martí Henneberg, J.; Morillas-Torné, M.; Ortuñez, P.P.; Solanas, J. Catálogo digital de cartografía urbana contemporánea en España (1800–1950). Biblio 3W 2019, 24, 1267. [Google Scholar]
  36. Chatel, C.; Morillas-Torné, M.; Esteve, A.; Martí-Henneberg, J. Patterns of Population and Urban Growth in Southwest Europe: 1920–2010. J. Urban Hist. 2017, 43, 1021–1040. [Google Scholar] [CrossRef]
  37. Franch Auladell, X.; Marti-Henneberg, J.; Puig-Farré, J. A spatial analysis of patterns of growth and concentration of population based on homogeneous population censuses: Spain (1877–2001). Investig. Reg. 2013, 25, 43–65. [Google Scholar]
  38. Koster, E. Urban morphology and computers. Urban Morphol. 1998, 2, 3–7. [Google Scholar]
  39. Goerlich, F.; Cantarino, I. Zonas de Morfología Urbana: Coberturas del Suelo y Demografía; BBVA Foundation: Bilbao, Spain, 2013. [Google Scholar]
  40. Goerlich, F.J.; Cantarino, I. A population density grid for Spain. Int. J. Geogr. Inf. Sci. 2013, 27, 2247–2263. [Google Scholar] [CrossRef] [Green Version]
  41. Pinho, P.; Oliveira, V. Cartographic analysis in urban morphology. Environ. Plan. B Plan. Des. 2009, 36, 107–127. [Google Scholar] [CrossRef]
  42. Oliveira, V.; Pinho, P. Study of urban form in Portugal: A comparative analysis of the cities of Lisbon and Oporto. Urban Des. Int. 2006, 1, 187–201. [Google Scholar] [CrossRef]
  43. Alvarez-Palau, E.; Hernandez, M.; Tort, A. Modelo morfológico de crecimiento urbano inducido por la infraestructura ferroviaria. Estudio de caso en 25 ciudades catalanas. Scr. Nova 2016, 20, 1–38. [Google Scholar]
  44. Solanas, J.; Alvarez-Palau, E.J.; Martí Henneberg, J. Estación ferroviaria y ciudades intermedias: Lectura geo-espacial del crecimiento urbano mediante indicadores SIG vectoriales. El caso de Cataluña (1848–2010). Geofocus 2015, 16, 253–280. [Google Scholar]
  45. Benavides Quecán, J.B. El uso de métodos históricos de levantamiento topográfico y cartográfico en la elaboración de mapas confiables de ciudades: Caso de estudio: Zwolle, Holanda. Scr. Nova 2004, 8. [Google Scholar] [CrossRef]
  46. Simon, A.; Fons, J.; Milego, R.; Georgi, B. Urban Morphological Zones Version F2v0: Definition and Procedural Steps; European Topic Centre Land Use and Spatial Information, EEA: Barcelona, Spain, 2010. [Google Scholar]
  47. Ruiz Nieto-Guerrero, M. Historia Urbana de Cádiz: Génesis y Formación de una Ciudad Moderna; ETSA Barcelona: Barcelona, Spain, 2016. [Google Scholar]
  48. Lobo, A.; Valero, P. El sistema urbano español en la segunda mitad del siglo XIX. Rev. Demogr. Histórica 1989, 7, 7–30. [Google Scholar]
  49. Barquín, R.; Pérez, P.; Sanz, B. La influencia del ferrocarril en el desarrollo urbano español (1860-1910). Rev. Hist. Econ. 2012, 30, 391–416. [Google Scholar] [CrossRef] [Green Version]
  50. Erdozain, P.; Mikelarena, F. Algunas consideraciones acerca de la evolución de la población rural en España en el siglo XIX. Hist. Agrar. 1996, 12, 91–118. [Google Scholar]
  51. Rodríguez, J. Las emigraciones interiores en España durante los siglos XIX y XX: Una revisión bibliográfica. Ager 2002, 2, 227–248. [Google Scholar]
  52. Cardesín Díaz, J.M.; Mirás, J. Historic Urbanization Process in Spain (1746–2013): From the Fall of the American Empire to the Real Estate Bubble. J. Urban Hist. 2017, 43, 33–52. [Google Scholar]
  53. Garcia Colmenares, P. Transformaciones urbanísticas e industriales. In La desamortización en la Península Ibérica; Rueda, G., Ed.; Marcial Pons: Madrid, Spain, 1993; pp. 175–211. [Google Scholar]
  54. Capel, H. Capitalismo y morfología urbana en España; Los Libros de la Frontera: Barcelona, Spain, 1975. [Google Scholar]
  55. Muro Morales, J.I. Las transformaciones en los usos de las propiedades militares en España. Finisterra 1990, 25, 261–298. [Google Scholar]
  56. Alcaide, R. El ferrocarril como elemento estructurador de la morfología urbana: El caso de Barcelona 1848–1900. Scr. Nova 2005, 9, 1–65. [Google Scholar]
  57. Bowie, K. De la gare du XIXe siècle au lieu-mouvement, évolution ou rupture? Les Annales de la Recherche Urbaine 1996, 7, 14–23. [Google Scholar] [CrossRef]
  58. Ramos Gorostiza, J.L. Edwin Chadwick, el movimiento británico de salud pública y el higienismo español. Rev. Hist. Ind. 2014, 23, 11–38. [Google Scholar]
  59. De Solà-Morales, M. Las Formas de Crecimiento Urbano; Univ. Politècnica de Catalunya: Barcelona, Spain, 1997. [Google Scholar]
  60. Monclús, F.J. Planning and history in Spain. Plan. Perspect. 1992, 7, 101–106. [Google Scholar] [CrossRef]
  61. Aibar, E.; Bijker, W.E. Constructing a city: The Cerdà plan for the extension of Barcelona. Sci. Technol. Hum. Values 1997, 22, 3–30. [Google Scholar] [CrossRef]
  62. Cerdà, I. Teoría General de la Urbanización, y Aplicación de sus Principios y Doctrinas a la Reforma y Ensanche de Barcelona; Imprenta Española: Madrid, Spain, 1867. [Google Scholar]
  63. Richert, E.D.; Lapping, M.B. Ebenezer Howard and the garden city. J. Am. Plan. Assoc. 1998, 64, 125–127. [Google Scholar] [CrossRef]
  64. Sambricio, C. De la Ciudad Lineal a la Ciudad Jardín: Sobre la difusión en España de los supuestos urbanísticos a comienzos del siglo. Ciudad Y Territ. 1992, 94, 147–159. [Google Scholar]
  65. Pallares-Barbera, M.; Badia, A.; Duch, J. Cerdà and Barcelona: The need for a new city and service provision. Urbani Izziv 2011, 22, 122–136. [Google Scholar] [CrossRef] [Green Version]
  66. Terán, F. Historia del Urbanismo en España III: Siglos XIX y XX; Catedra: Madrid, Spain, 1999. [Google Scholar]
  67. Otero, R. Sociología e Historia de la Ciudad Desconcentrada; CIS-Centro de Investigaciones Sociológicas: Madrid, Spain, 2017. [Google Scholar]
  68. Toboso, F. Institutional Change and Economic Growth in Spain since Democratic Transition in 1978. In Law and Economics: Alternative Economic Approaches to Legal and Regulatory Issues; Oppenheimer, M., Mercuro, N., Eds.; ME Sharpe: New York, NY, USA, 2005. [Google Scholar]
  69. Herce, M.; Magrinyà, F. La Ingeniería en la Evolución de la Urbanística; Edicions UPC: Barcelona, Spain, 2002. [Google Scholar]
  70. Font, A. La Explosión de la Ciudad: Transformaciones Territoriales en las Regiones Urbanas de la Europa Meridional; Ministerio de Vivienda: Madrid, Spain, 2007.
  71. Walton, J.K. Planning and seaside tourism: San Sebastián, 1863–1936. Plan. Perspect. 2002, 17, 1–20. [Google Scholar] [CrossRef]
  72. Barke, M. Second homes in the Spanish housing market: One market or two? J. Hous. Built Environ. 2008, 23, 277–295. [Google Scholar] [CrossRef]
  73. Colás, J.L.; Cabrerizo, J.A. Vivienda secundaria y residencia múltiple en España: Una aproximación sociodemográfica. Scr. Nova 2004, 8, 178. [Google Scholar]
  74. Morote, Á.F.; Hernández, M. Población extranjera y turismo residencial en el litoral de Alicante (1960–2011): Repercusiones territoriales. EURE 2016, 42, 55–76. [Google Scholar] [CrossRef] [Green Version]
  75. Nel·lo, O. Las grandes ciudades españolas: Dinámicas urbanas e incidencia de las políticas estatales. Papers 1997, 27, 9–70. [Google Scholar]
  76. García, F. Compacidad y densidad de las ciudades españolas. EURE 2016, 42, 5–27. [Google Scholar] [CrossRef]
  77. Aguilera, F.; Valenzuela, L.M.; Botequilha-Leitão, A. Landscape metrics in the analysis of urban land use patterns: A case study in a Spanish metropolitan area. Landsc. Urban Plan. 2011, 99, 226–238. [Google Scholar] [CrossRef]
  78. Lancer Salas, V. The phenomenon of urban sprawl in the Community of Madrid. Morphological evolution of the urban fabric. Territorios en Formación 2011, 1, 95–113. [Google Scholar]
Figure 1. Spatial location of our sample of cities.
Sustainability 11 06948 g001
Figure 2. Process of adapting the historical sources to the Urban Morphological Zones (UMZ).
Sustainability 11 06948 g002
Figure 3. Evolution of the H-UMZ for San Sebastián based on cartography and historical reference photograms.
Sustainability 11 06948 g003
Figure 4. Percentage of municipal area occupied by urban fabric. In the right margin, the total surface area of the municipality is given in ha.
Sustainability 11 06948 g004
Figure 5. Disaggregated growth in population (left) and built-up area (right) by region.
Sustainability 11 06948 g005
Figure 6. Aggregated growth in built-up area and total population for all of the cities analysed (per cent).
Sustainability 11 06948 g006
Figure 7. Total built-up area (left) and population (right) of the provincial capitals for the period 1850–1925. Size indicates magnitude of the variable (at the end of the period) and colour expresses change.
Sustainability 11 06948 g007
Figure 8. Built-up area (left) and population (right) of the municipalities for the period 1925–1975. Size indicates magnitude of the variable (at the end of the period) and colour expresses change.
Sustainability 11 06948 g008
Figure 9. Built-up area (left) and population (right) of the municipalities for the period 1975–2000. Size indicates magnitude of the variable (at the end of the period) and colour expresses change.
Sustainability 11 06948 g009

