Pastoral Population Growth and Land Use Policy Has Significantly Impacted Livestock Structure in Inner Mongolia—A Case Study in the Xilinhot Region


Abstract
:1. Introduction
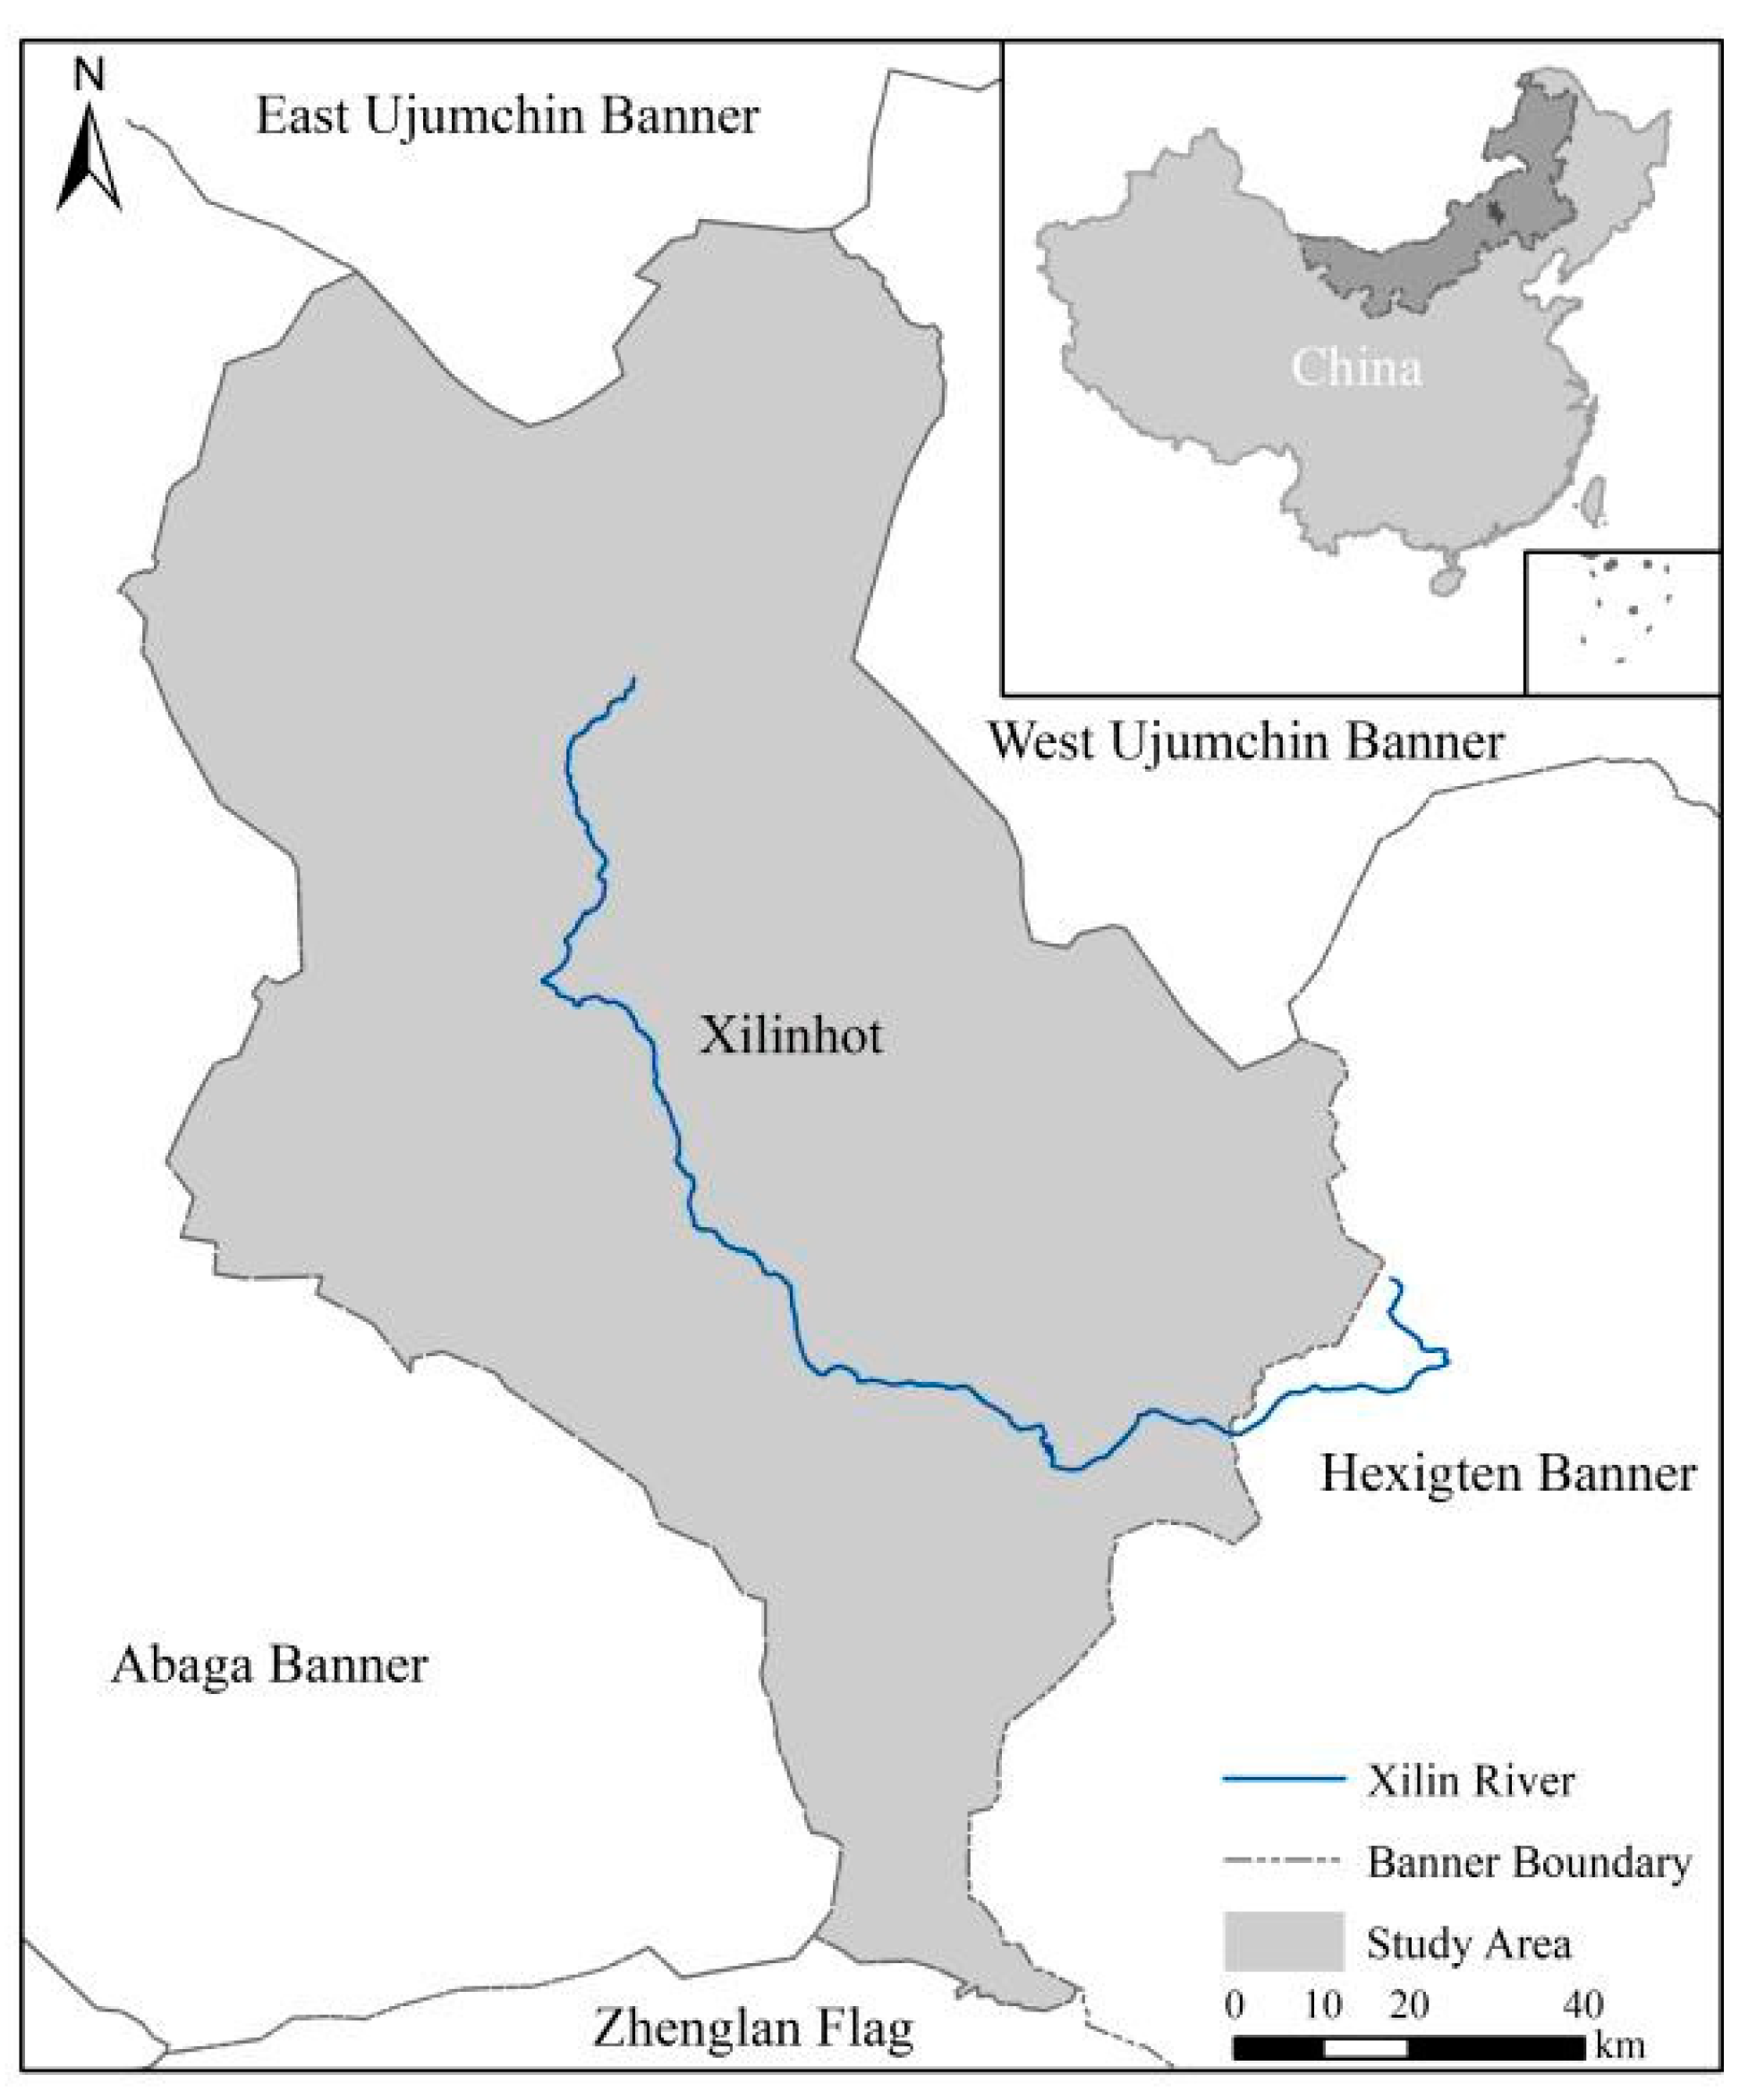
2. Study Area
3. Methods
4. Results
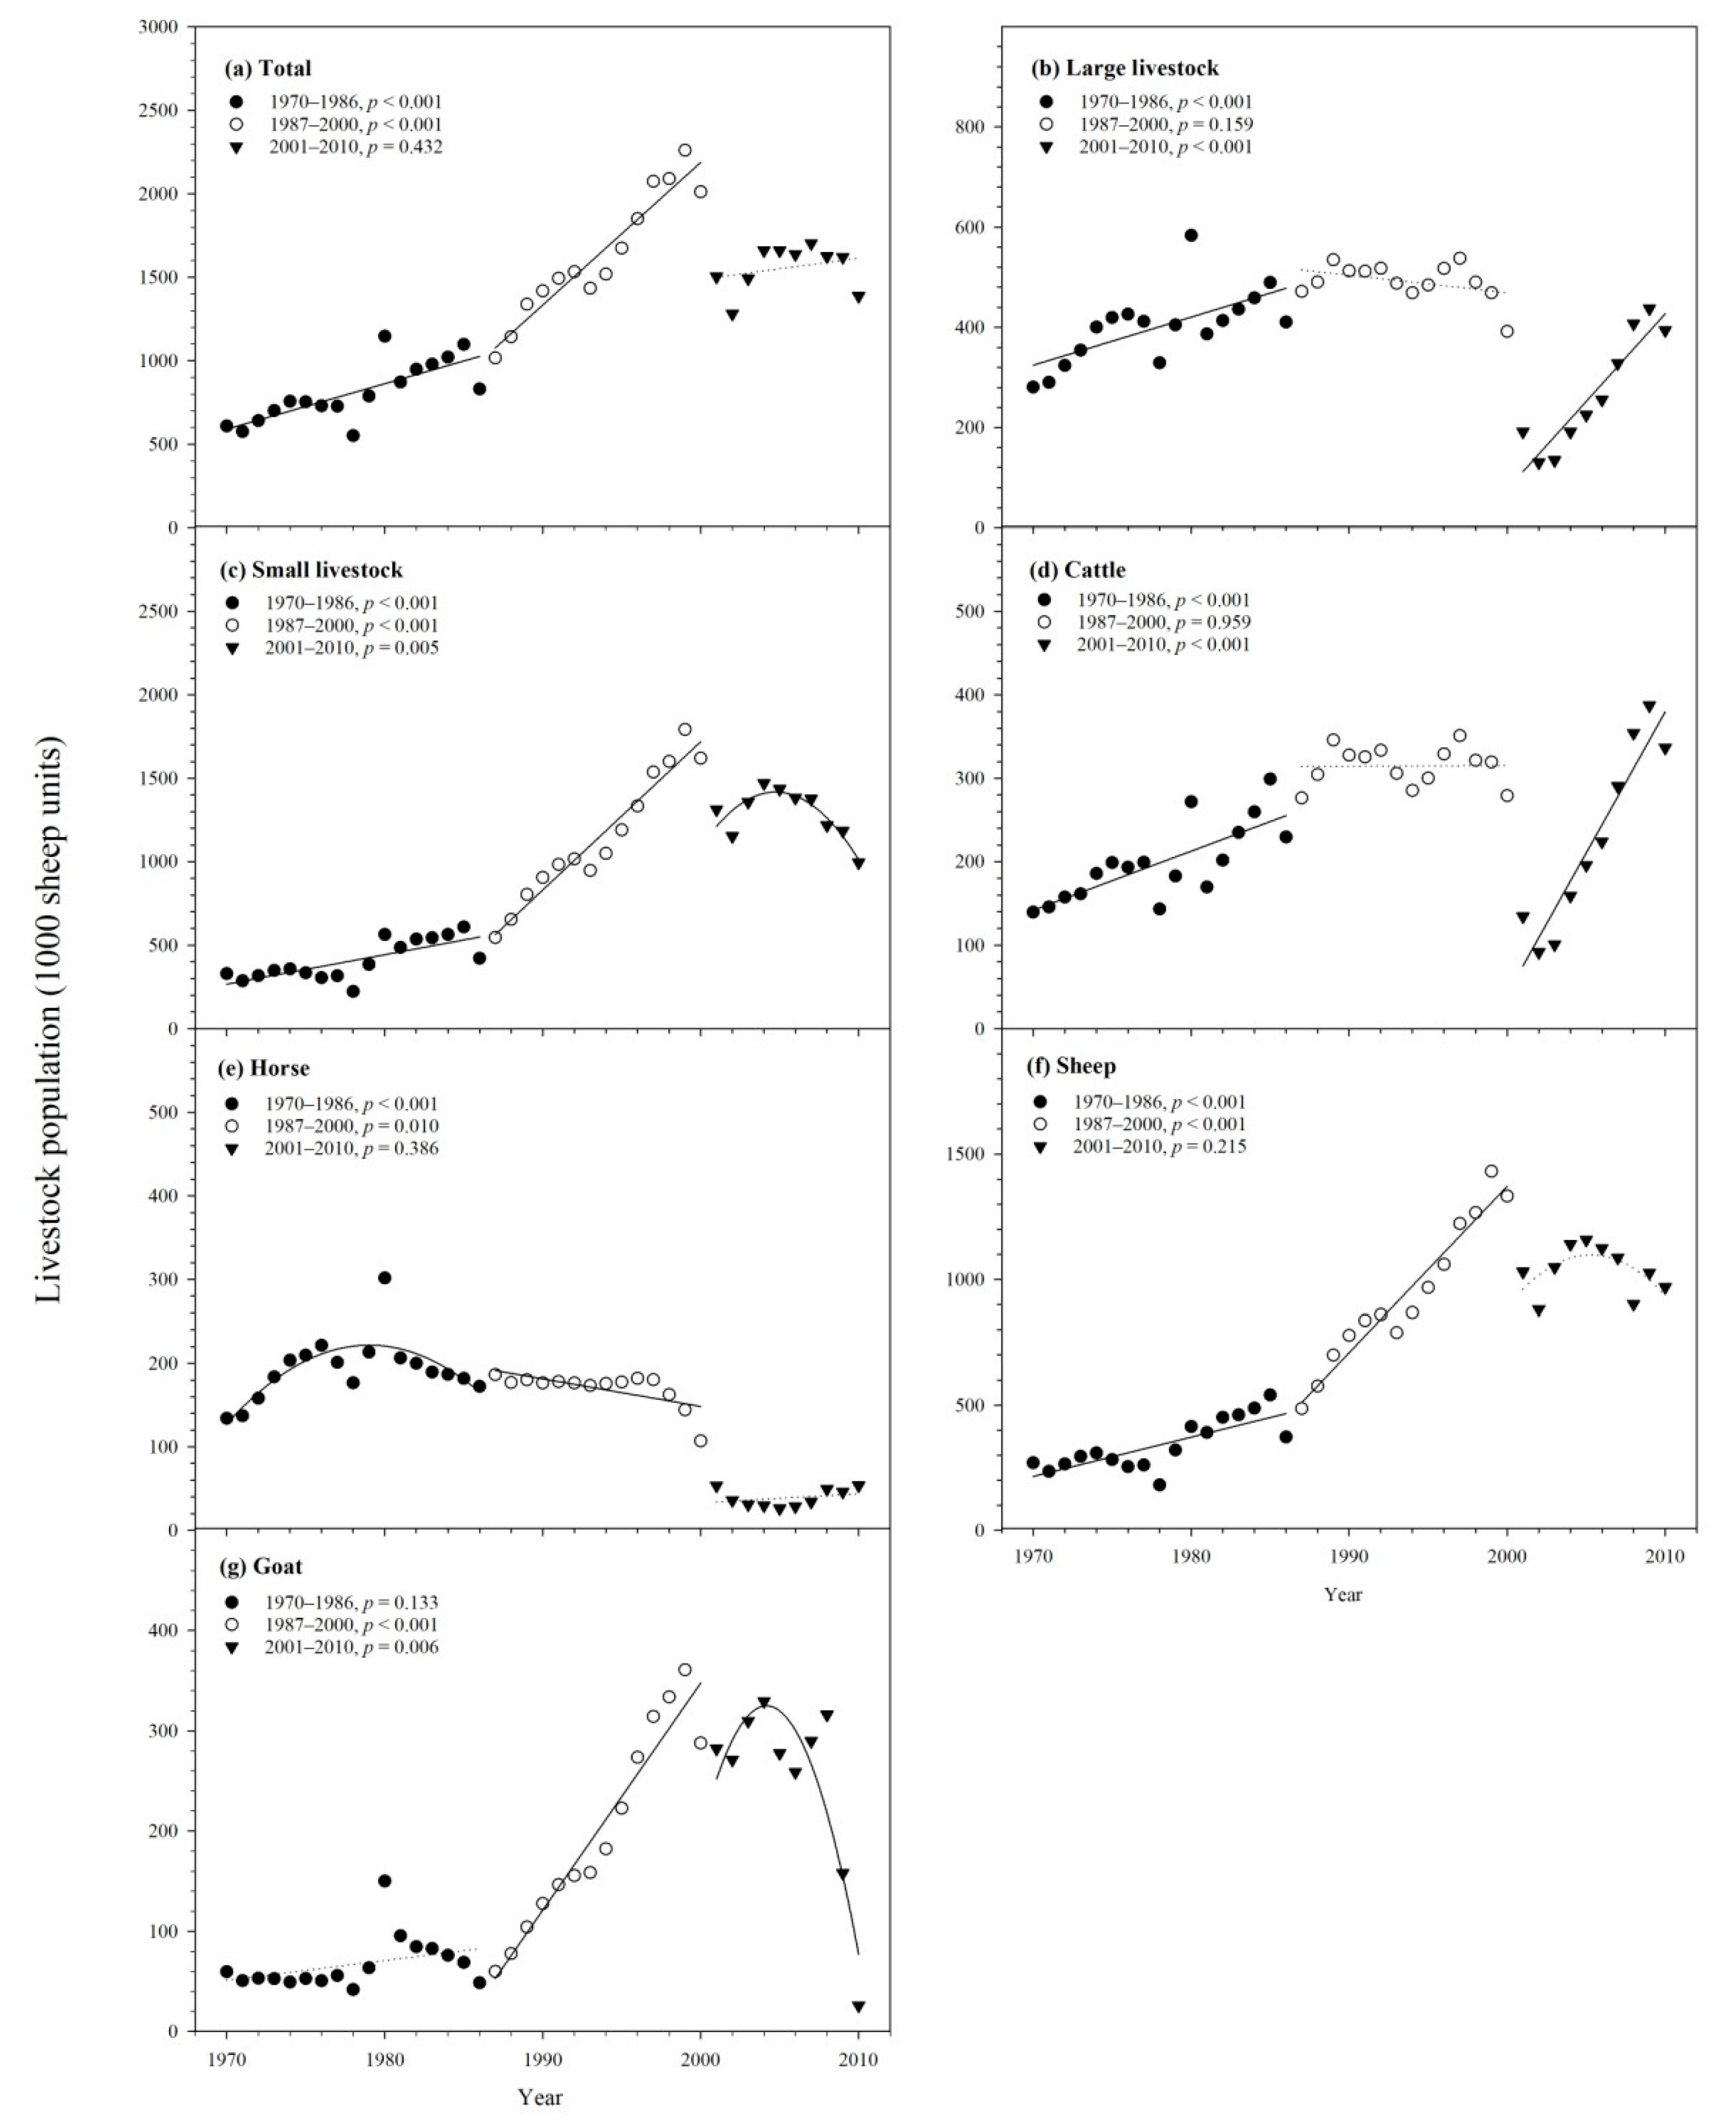
4.1. Changes in Livestock Population
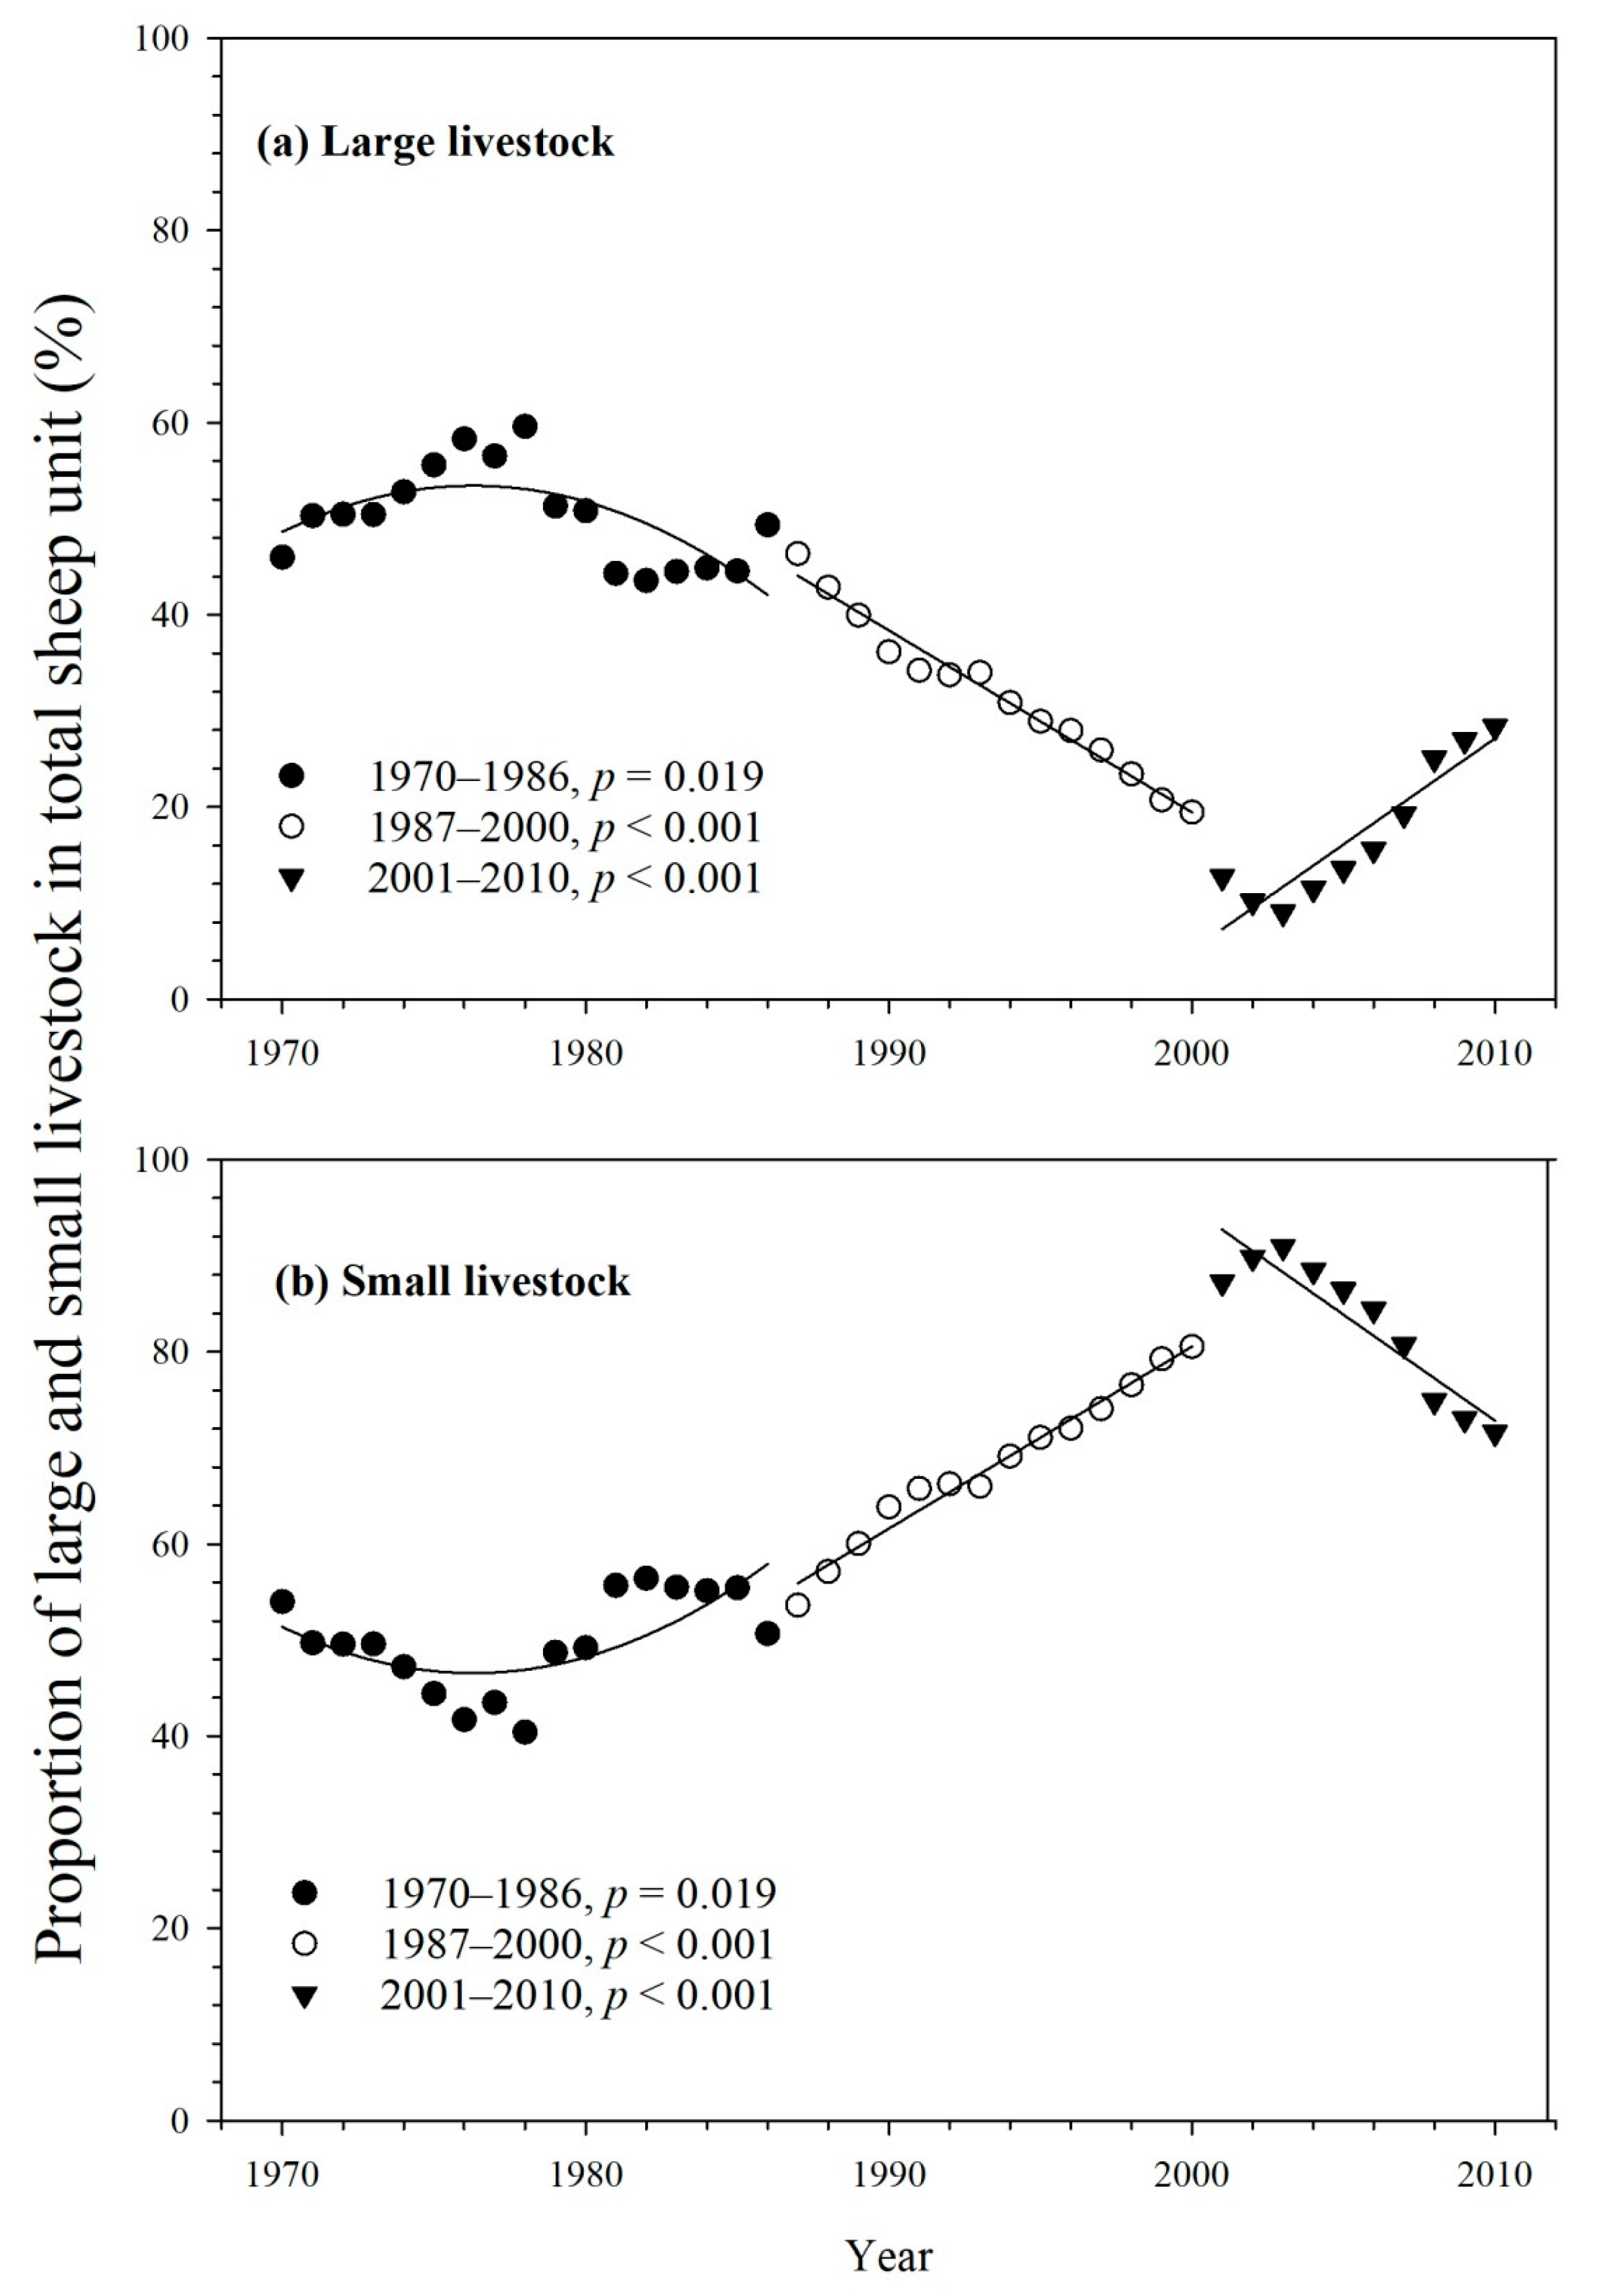
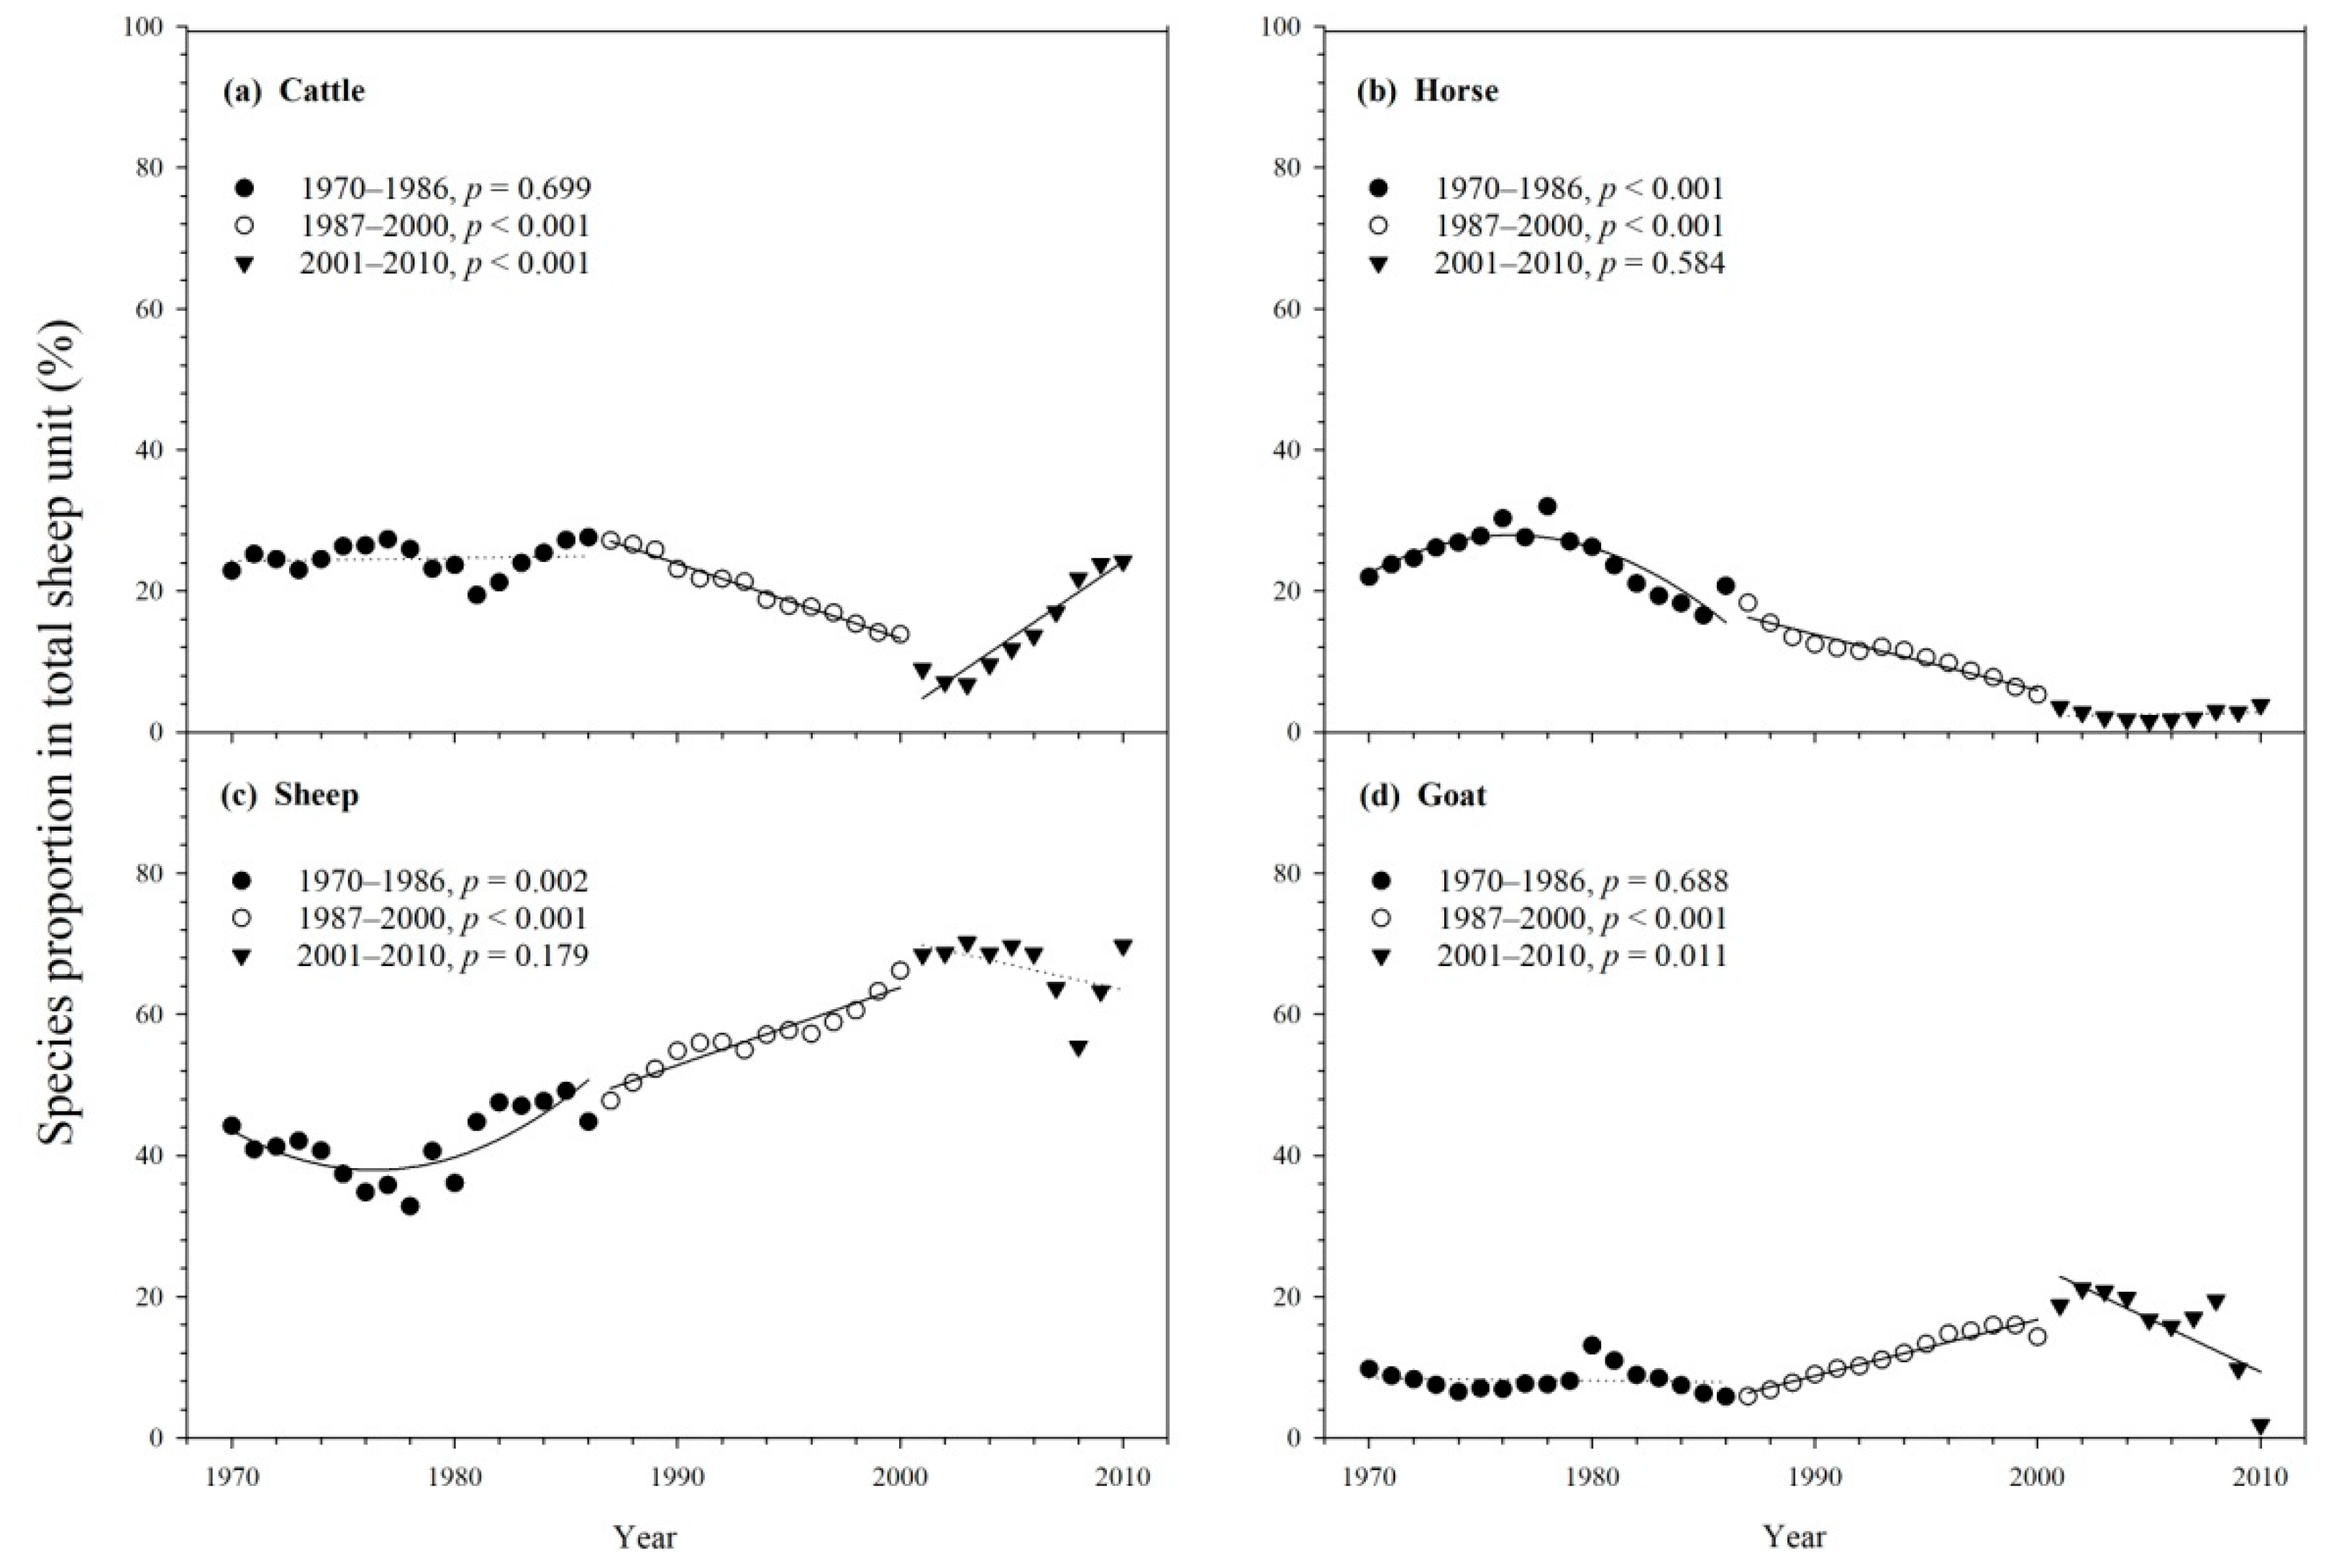
4.2. Changes in Large and Small Livestock as well as Species Proportion
4.3. Factors Driving Changes in Total Livestock and Species Population over the Past 40 Years
4.4. Factors Driving Changes in the Four Livestock Species Composition over the Past 40 Years
5. Discussion
5.1. Changes in Livestock Population and Composition
5.2. Factors Influencing Changes in Livestock Population and Composition During 1970–2010
5.3. Implications for Improving Animal Husbandry Sustainability in Xilinhot
6. Conclusions
Author Contributions
Funding
Acknowledgments
Conflicts of Interest
References
- Xu, G.; Wu, J. Social-ecological transformations of Inner Mongolia: A sustainability perspective. Ecol. Process. 2016, 5, 23. [Google Scholar] [CrossRef] [Green Version]
- Paul, R. The social impact of livestock: A developing country perspective. Anim. Sci. J. 2003, 74, 245–253. [Google Scholar]
- Steinfeld, H.; Mooney, H.A.; Schneider, F.; Neville, L.E. Livestock in a Changing Landscape, Volume 1: Drivers, Consequences and Responses; Island: Washington, DC, USA, 2010. [Google Scholar]
- Gerber, P.; Mooney, H.A.; Dijkman, J.; Tarawali, S.; Haan, C.D. Livestock in a Changing Landscape, Volume 2: Experiences and Regional Perspectives; Island: Washington, DC, USA, 2010. [Google Scholar]
- Rosegrant, M.W.F.M.; Sinha, A.; Alder, J.; Ahammad, H.; de Fraiture, C.; Eickhour, B.; Fonseca, J.; Huang, J.; Koyama, O.; Omezzine, A.M.; et al. Looking into the future for agriculture and AKST (Agricultural Knowledge Science and Technology). In Agriculture at a Crossroads; Island Press: Washington, DC, USA, 2009; pp. 307–376. [Google Scholar]
- Hurst, P.; Termine, P.; Karl, M. Agricultural Workers and Their Contribution to Sustainable Agriculture and Rural Development; Food and Agriculture Organization: Rome, Italy, 2005. [Google Scholar]
- Reynolds, C.; Crompton, L.; Mills, J. Livestock and climate change impacts in the developing world. Outlook Agric. 2010, 39, 245–248. [Google Scholar] [CrossRef] [Green Version]
- Thornton, P.K.; van de Steeg, J.; Notenbaert, A.; Herrero, M. The impacts of climate change on livestock and livestock systems in developing countries: A review of what we know and what we need to know. Agric. Syst. 2009, 101, 113–127. [Google Scholar] [CrossRef]
- Herrero, M.; Grace, D.; Njuki, J.; Johnson, N.; Enahoro, D.; Silvestri, S.; Rufino, M.C. The roles of livestock in developing countries. Animal 2013, 7, 3–18. [Google Scholar] [CrossRef] [Green Version]
- Hilker, T.; Natsagdorj, E.; Waring, R.H.; Lyapustin, A.; Wang, Y.J. Satellite observed widespread decline in Mongolian grasslands largely due to overgrazing. Glob. Chang. Biol. 2014, 20, 418–428. [Google Scholar] [CrossRef] [Green Version]
- Moore, A.D.; Ghahramani, A. Climate change and broadacre livestock production across southern Australia. 1. Impacts of climate change on pasture and livestock productivity, and on sustainable levels of profitability. Glob. Chang. Biol. 2013, 19, 1440–1455. [Google Scholar] [CrossRef]
- Megersa, B.; Markemann, A.; Angassa, A.; Ogutu, J.; Piepho, H.-P.; Valle Zárate, A. Livestock Diversification: An Adaptive Strategy to Climate and Rangeland Ecosystem Changes in Southern Ethiopia. Hum. Ecol. 2014, 42, 509–520. [Google Scholar] [CrossRef]
- Shabb, D.; Chitnis, N.; Baljinnyam, Z.; Saagii, S.; Zinsstag, J. A mathematical model of the dynamics of Mongolian livestock populations. Livest. Sci. 2013, 157, 280–288. [Google Scholar] [CrossRef]
- Herrero, M.; Thornton, P.K.; Gerber, P.; Reid, R.S. Livestock, livelihoods and the environment: Understanding the trade-offs. Curr. Opin. Environ. Sustain. 2009, 1, 111–120. [Google Scholar] [CrossRef]
- Hopkins, A.; Del Prado, A. Implications of climate change for grassland in Europe: Impacts, adaptations and mitigation options: A review. Grass Forage Sci. 2007, 62, 118–126. [Google Scholar] [CrossRef]
- Sirohi, S.; Michaelowa, A. Sufferer and cause: Indian livestock and climate change. Clim. Chang. 2007, 85, 285–298. [Google Scholar] [CrossRef]
- Baylis, M.; Githeko, A.K. The Effects of Climate Change on Infectious Diseases of Animals. In Report for the Foresight Project on Detection of Infectious Diseases, Department of Trade and Industry, UK Government; Office of Science and Innovation: London, UK, 2006; p. 35. [Google Scholar]
- IPCC (Intergovernmental Panel on Climate Change). Climate Change 2007: Impacts, Adaptation and Vulnerability. Summary for Policy Makers. 2007. Available online: https://www.ipcc.ch/site/assets/uploads/2018/02/ar4-wg2-spm-1.pdf (accessed on 23 January 2008).
- Li, A.; Chen, S.; Zhang, X.; Huang, J. Political Pressures Increased Vulnerability to Climate Hazards for Nomadic Livestock in Inner Mongolia, China. Sci. Rep. 2017, 7. [Google Scholar] [CrossRef] [PubMed] [Green Version]
- Steinfeld, H.; Wassenaar, T.; Jutzi, S. Livestock production systems in developing countries: Status, drivers, trends. Rev. Sci. Tech. 2006, 25, 505–516. [Google Scholar] [CrossRef] [PubMed]
- Saizen, I. Change in Livestock Species and Their Spatial Distribution. In The Mongolian Ecosystem Network; Yamamura, N., Fujita, N., Maekawa, A., Eds.; Springer: Tokyo, Japan, 2013; pp. 215–232. [Google Scholar]
- Li, X.L.; Yuan, Q.H.; Wan, L.Q.; He, F. Perspectives on livestock production systems in China. Rangel. J. 2008, 30, 211–220. [Google Scholar] [CrossRef]
- Caraveli, H. A comparative analysis on intensification and extensification in mediterranean agriculture: Dilemmas for LFAs policy. J. Rural Stud. 2000, 16, 231–242. [Google Scholar] [CrossRef]
- Du, F.; Cao, Q. Eco-husbandry: Trends of Animal Husbandry Economy in West China Prairies. J. Orig. Ecol. Natl. Cult. 2012, 4, 118–127. (In Chinese) [Google Scholar]
- Dong, X.; Zhang, X. The Grassland in the Inner Mongolia is Overloaded and Changes of the Production Pattern are Highlighted. Resour. Sci. 2005, 27, 175–179. (In Chinese) [Google Scholar]
- Cui, X.; Guo, K.; Hao, Y.; Chen, Z. Degradation and Management of Steppes in China. In Eurasian Steppes. Ecological Problems and Livelihoods in a Changing World; Werger, M.J.A., van Staalduinen, M.A., Eds.; Springer: Hague, The Netherlands, 2012; Volume 6, pp. 475–490. [Google Scholar]
- Li, S.; Verburg, P.; Lv, S.; Wu, J.; Li, X. Spatial analysis of the driving factors of grassland degradation under conditions of climate change and intensive use in Inner Mongolia, China. Reg. Environ. Chang. 2011, 12, 1–14. [Google Scholar] [CrossRef]
- Briske, D.D.; Zhao, M.L.; Han, G.D.; Xiu, C.B.; Kemp, D.R.; Willms, W.; Havstad, K.; Kang, L.; Wang, Z.W.; Wu, J.G.; et al. Strategies to alleviate poverty and grassland degradation in Inner Mongolia: Intensification vs production efficiency of livestock systems. J. Environ. Manag. 2015, 152, 177–182. [Google Scholar] [CrossRef]
- Wu, J.; Loucks, O. Xilingele (The Xilingol Grassland). In Grasslands and Grassland Sciences in Northern China; The US National Research Council, Ed.; National Academy Press: Washington, DC, USA, 1992; pp. 67–84. [Google Scholar]
- Xia, X.; Li, B.; Sui, Y. Analysis of Regional Differentiation of Animal Husbandry Production Structure in China from the Perspectives of Resources Endowment and Food Security. Resour. Sci. 2010, 32, 1592–1600. (In Chinese) [Google Scholar]
- Li, W.J.; Ali, S.H.; Zhang, Q. Property rights and grassland degradation: A study of the Xilingol Pasture, Inner Mongolia, China. J. Environ. Manag. 2007, 85, 461–470. [Google Scholar]
- Xu, G.C.; Kang, M.Y.; Jiang, Y. Adaptation to the Policy-oriented Livelihood Change in Xilingol Grassland, Northern China. Procedia Environ. Sci. 2012, 13, 1668–1683. [Google Scholar] [CrossRef] [Green Version]
- Humphrey, C.; Sneath, D. The End of Nomadism? Society, State, and the Environment in Inner Asia; Duke University Press: Durham, NC, USA, 1999. [Google Scholar]
- Li, O.; Ma, R.; Simpson, J.R. Changes in the nomadic pattern and its impact on the Inner Mongolian steppe grasslands ecosystem. Nomadic Peoples 1993, 33, 63–72. [Google Scholar]
- Shao, L.Q.; Chen, H.B.; Zhang, C.; Huo, X.X. Effects of Major Grassland Conservation Programs Implemented in Inner Mongolia since 2000 on Vegetation Restoration and Natural and Anthropogenic Disturbances to Their Success. Sustainability 2017, 9, 466. [Google Scholar] [CrossRef] [Green Version]
- Jiang, H. Grassland management and views of nature in China since 1949: Regional policies and local changes in Uxin Ju, inner Mongolia. Geoforum 2005, 36, 641–653. [Google Scholar] [CrossRef]
- Li, A.; Wu, J.; Huang, J. Distinguishing between human-induced and climate-driven vegetation changes: A critical application of RESTREND in inner Mongolia. Landsc. Ecol. 2012, 27, 969–982. [Google Scholar] [CrossRef]
- Hua, L.; Squires, V.R. Managing China’s pastoral lands: Current problems and future prospects. Land Use Policy 2015, 43, 129–137. [Google Scholar] [CrossRef]
- Department of Animal Husbandry and Veterinary; General Station of Animal Husbandry and Veterinary of Ministry of Agriculture of China. Rangeland Resources of China; China Science & Technology Press: Beijing, China, 1996. (In Chinese) [Google Scholar]
- Shan, Y.M.; Chen, D.M.; Guan, X.X.; Zheng, S.X.; Chen, H.J.; Wang, M.J.; Bai, Y.F. Seasonally dependent impacts of grazing on soil nitrogen mineralization and linkages to ecosystem functioning in Inner Mongolia grassland. Soil Biol. Biochem. 2011, 43, 1943–1954. [Google Scholar] [CrossRef]
- Johnson, D.A.; Sheehy, D.P.; Miller, D.; Damiran, D. Mongolian rangelands in transition. Secheresse 2006, 17, 133–141. [Google Scholar]
- Steinfeld, H.; Costales, A.; Rushton, J.; Scherf, B.; Bennett, T.; Hall, D. Livestock Report 2006; FAO: Rome, Italy, 2006; Available online: http://www.fao.org/3/a0255e/a0255e00.htm (accessed on 11 March 2011).
- FAO. World Livestock 2011: Livestock in Food Security; FAO: Rome, Italy, 2011. [Google Scholar]
- Jabbar, M.A.; Ahmed, M.; Benin, S.; Gebremedhin, B.; Ehui, S. Livestock, livelihood and land management issues in the highlands of Ethiopia. In Policies for Sustainable Land Management in the East African Highlands: Summary of Papers and Proceedings of a Conference Held at the United Nations Economic Commission for Africa (UNECA), Addis Ababa, Ethiopia, 24–26 April 2002; Benin, S., Pender, J., Ehui, S., Eds.; IFPRI: Washington, DC, USA, 2003; pp. 87–93. [Google Scholar]
- Halderman, M. The Political Economy of Pro-Poor Livestock Policy-making in Ethiopia. PPLPI Working Paper no. 19. In Pro-Poor Livestock Policy Initiative; FAO: Rome, Italy, 2005. [Google Scholar]
- Kgosikoma, O.E.; Batisani, N. Livestock population dynamics and pastoral communities’ adaptation to rainfall variability in communal lands of Kgalagadi South, Botswana. Pastoralism 2014, 4, 19. [Google Scholar] [CrossRef] [Green Version]
- Verburg, P.H.; Keulen, H.V. Exploring changes in the spatial distribution of livestock in China. Agric. Syst. 1999, 62, 51–67. [Google Scholar] [CrossRef]
- Sneath, D. Ecology-State policy and pasture degradation in inner Asia. Science 1998, 281, 1147–1148. [Google Scholar] [CrossRef]
- Mwanyumba, P.M.; Wahome, R.W.; MacOpiyo, L.; Kanyari, P. Livestock herd structures and dynamics in Garissa County, Kenya. Pastoralism 2015, 5, 26. [Google Scholar] [CrossRef] [Green Version]
- Han, J. Survey on Ecological Issues of China’s Grasslands; Shanghai Far East Publishers: Shanghai, China, 2011. (In Chinese) [Google Scholar]
- Davis, B.; Winters, P.; Carletto, G.; Covarrubias, K.; Quinones, E.; Zezza, A.; Stamoulis, K.; Bonomi, G.; Di Giuseppe, S. Rural Income Generating Activities: A Cross-Country Comparison. ESA Working Paper; FAO: Rome, Italy, 2007. [Google Scholar]
- Staal, S.J.; Poole, J.; Baltenweck, I.; Mwacharo, J.; Notenbaert, A.M.O.; Randolph, T.F.; Thorpe, W.; Nzuma, J.; Herrero, M. Strategic Investment in Livestock Development as a Vehicle for Rural Livelihoods; Bill and Melinda Gates Foundation-ILRI Knowledge Generation Project Report; International Livestock Research Institute: Nairobi, Kenya, 2009; p. 78. [Google Scholar]
- Neupert, R.F. Population, Nomadic Pastoralism and the Environment in the Mongolian Plateau. Popul. Environ. 1999, 20, 413–441. [Google Scholar] [CrossRef]
- Wu, J.; Zhang, Q.; Li, A.; Liang, C. Historical landscape dynamics of Inner Mongolia: Patterns, drivers, and impacts. Landsc. Ecol. 2015, 30, 1579–1598. [Google Scholar] [CrossRef]
- Yin, Y.; Hou, X.; Ding, Y.; Han, Y. Response of animal husbandry to climate change in desert steppe—A case of Suniteyou Banner, Inner Mongolia. J. Arid Land Resour. Environ. 2012, 26, 153–160. (In Chinese) [Google Scholar]
- Editorial Committee of Xilingol Meng Chorography (ECXMC). Xilingol Meng Chorography; Inner Mongolia People’s Press: Hohhot, China, 1996. (In Chinese) [Google Scholar]
- Dong, S. Overview: Pastoralism in the World. In Building Resilience of Human-Natural Systems of Pastoralism in the Developing World: Interdisciplinary Perspectives; Dong, S., Kassam, K.-A.S., Tourrand, J.F., Boone, R.B., Eds.; Springer International Publishing: Cham, Switzerland, 2016; pp. 1–37. [Google Scholar]
- Wu, J.G. Landscape sustainability science: Ecosystem services and human well-being in changing landscapes. Landsc. Ecol. 2013, 28, 999–1023. [Google Scholar] [CrossRef]
- Ostrom, E. A behavioral approach to the rational choice theory of collective action. Am. Political Sci. Rev. 1998, 92, 1–22. [Google Scholar] [CrossRef]
- Levin, S. Crossing scales, crossing disciplines: Collective motion and collective action in the Global Commons. Philos. Trans. R. Soc. B Biol. Sci. 2010, 365, 13–18. [Google Scholar] [CrossRef] [Green Version]


| Herding Management System | Last Nomadic Period (1970–1986) | Fast Development Period (1987–2000) | Ecological Recovery Period (2001–2010) |
|---|---|---|---|
| Period | The people’s commune | The socialist period | The socialist period |
| Economic system | Planned economy | Market economy | Market economy with rapid development of industrial economy |
| Land use institution | Collective management and use of grassland | Privatization of land use rights | Privatization of land use rights |
| Grazing regime | Nomadic grazing/semi-nomadic and semi-settled grazing/fixed grazing | Permanent grazing | Permanent grazing/conducting scientific grazing system in some areas |
| Basic business unit | People’s communes | Family household | Individual household/ co-management by small-group households |
| Grazing management | Collectively managed | Individual decision-making | Individual decision-making |
| Restrained measures in management | Yes | No | Yes (administrative control measures in the ecological programs areas) |
| Ecological programs | No | No | Yes (ecological recovery programs) |
| Allocation mechanism | Allocated by the collectives | Self-management/ assume responsibility for profits and losses on one’s own | Self-management/ assume responsibility for profits and losses on one’s own |
| Source of income of herdsmen | Single | Single | Diversified (selling livestock/ecological award/ engaging in service industry) |
| Number of livestock per capita (Mean ± SE) | 116 ± 28 | 169 ± 25 | 151 ± 13 |
| Driving Forces | Factor/Indicator Applied | Abbreviation | Unit |
|---|---|---|---|
| Environmental aspect | Annual average temperature | AVTEM | °C |
| Winter mean temperature | WMTEM | °C | |
| Non-winter mean temperature | NWMTEM | °C | |
| Extremely high temperature | EXHTEM | °C | |
| Extremely cold temperature | EXCTEM | °C | |
| Drought index | DRINDEX | -- | |
| Winter snowfall | WSNOW | mm | |
| Socioeconomic aspect | Urban population | URBPOPU | Person |
| Pastoral population | PASPOPU | Person | |
| Local policy aspect | Land use policy | LANDUC | -- |
| 1970–1986 | 1987–2000 | 2001–2010 | 1970–2010 | |||||||||
|---|---|---|---|---|---|---|---|---|---|---|---|---|
| Response | Predictor | Partial R2 | Effect | Predictor | Partial R2 | Effect | Predictor | Partial R2 | Effect | Predictor | Partial R2 | Effect |
| Total livestock | URBPOPU 2 | 0.54 *** | + | PASPOPU 2 | 0.88 *** | + | PASPOPU 2 | 0.76 *** | + | |||
| DRINDEX 1 | 0.18 ** | + | AVTEM 1 | 0.05 ** | + | |||||||
| Large livestock | URBPOPU 2 | 0.45 ** | + | NWMTEM 1 | 0.37 * | - | URBPOPU 2 | 0.70 ** | + | URBPOPU 2 | 0.29 *** | + |
| DRINDEX 1 | 0.19 * | + | AVTEM 1 | 0.25 * | + | NWMTEM 1 | 0.19 ** | + | LANDUC 3 | 0.13 * | - | |
| Small livestock | URBPOPU 2 | 0.48 ** | + | PASPOPU 2 | 0.89 *** | + | EXHTEM 2 | 0.48 * | - | PASPOPU 2 | 0.79 *** | + |
| DRINDEX 1 | 0.14 * | + | AVTEM 1 | 0.05 *** | + | |||||||
| Cattle | URBPOPU 2 | 0.55 *** | + | URBPOPU 2 | 0.75 ** | + | PASPOPU 2 | 0.23 ** | + | |||
| WMTEM 1 | 0.15 * | - | NWMTEM 1 | 0.16 ** | + | URBPOPU 2 | 0.15 ** | + | ||||
| Horse | DRINDEX 1 | 0.26 * | + | NWMTEM 1 | 0.58 ** | - | LANDUC 3 | 0.71 *** | - | |||
| WMTEM 1 | 0.24 ** | + | EXCTEM 1 | 0.06 ** | + | |||||||
| URBPOPU 2 | 0.03 * | + | ||||||||||
| Sheep | URBPOPU 2 | 0.54 *** | + | PASPOPU 2 | 0.88 *** | + | PASPOPU 2 | 0.83 *** | + | |||
| WMTEM 1 | 0.13 * | - | AVTEM 1 | 0.04 ** | + | |||||||
| Goat | DRINDEX 1 | 0.55 *** | + | PASPOPU 2 | 0.90 *** | + | EXCTEM 1 | 0.66 ** | + | PASPOPU 2 | 0.57 *** | + |
| WSNOW 1 | 0.16 * | - | AVTEM 1 | 0.10 ** | + | |||||||
| NWMTEM 1 | 0.08 ** | - | EXHTEM 1 | 0.03 * | - | |||||||
| PASPOPU 2 | 0.01 * | + | DRINDEX 1 | 0.03 * | + | |||||||
| AVTEM 1 | 0.0004 * | + | ||||||||||
| 1970–1986 | 1987–2000 | 2001–2010 | 1970–2010 | |||||||||
|---|---|---|---|---|---|---|---|---|---|---|---|---|
| Response | Predictor | Partial R2 | Effect | Predictor | Partial R2 | Effect | Predictor | Partial R2 | Effect | Predictor | Partial R2 | Effect |
| Cattle | PASPOPU 2 | 0.40 ** | + | PASPOPU 2 | 0.92 *** | - | URBPOPU 2 | 0.76 *** | LANDUC 3 | 0.46 *** | - | |
| WSNOW 1 | 0.02 * | - | NWMTEM 1 | 0.14 * | + | |||||||
| Horse | WMTEM 1 | 0.31 * | + | PASPOPU 2 | 0.88 *** | - | EXHTEM 1 | 0.44 * | + | URBPOPU 2 | 0.87 *** | - |
| WSNOW 1 | 0.15 * | + | LANDUC 3 | 0.03 ** | - | |||||||
| PASPOPU 2 | 0.02 ** | - | ||||||||||
| Sheep | NWMTEM 1 | 0.19 * | + | PASPOPU 2 | 0.83 *** | + | LANDUC 3 | 0.82 *** | + | |||
| WMTEM 1 | 0.06 * | - | PASPOPU 2 | 0.04 ** | + | |||||||
| AVTEM 1 | 0.03 * | + | ||||||||||
| Goat | EXHTEM 2 | 0.43 ** | + | PASPOPU 2 | 0.93 *** | + | EXCTEM 1 | 0.66 ** | + | LANDUC 3 | 0.43 *** | + |
| PASPOPU 2 | 0.19 * | - | URBPOPU 2 | 0.03 ** | + | WSNOW 1 | 0.17 * | - | EXCTEM 1 | 0.08 * | + | |
© 2019 by the authors. Licensee MDPI, Basel, Switzerland. This article is an open access article distributed under the terms and conditions of the Creative Commons Attribution (CC BY) license (http://creativecommons.org/licenses/by/4.0/).
Share and Cite
Jiang, Y.; Zhang, Q.; Niu, J.; Wu, J. Pastoral Population Growth and Land Use Policy Has Significantly Impacted Livestock Structure in Inner Mongolia—A Case Study in the Xilinhot Region. Sustainability 2019, 11, 7208. https://0-doi-org.brum.beds.ac.uk/10.3390/su11247208
Jiang Y, Zhang Q, Niu J, Wu J. Pastoral Population Growth and Land Use Policy Has Significantly Impacted Livestock Structure in Inner Mongolia—A Case Study in the Xilinhot Region. Sustainability. 2019; 11(24):7208. https://0-doi-org.brum.beds.ac.uk/10.3390/su11247208
Chicago/Turabian StyleJiang, Ye, Qing Zhang, Jianming Niu, and Jianguo Wu. 2019. "Pastoral Population Growth and Land Use Policy Has Significantly Impacted Livestock Structure in Inner Mongolia—A Case Study in the Xilinhot Region" Sustainability 11, no. 24: 7208. https://0-doi-org.brum.beds.ac.uk/10.3390/su11247208