1. Introduction
Nowadays, with the labor cost climbing sharply, the top 500 corporations in China are suffering from declining profits. According to a report on top 500 industrial corporations in China between 2008 and 2014, the average profit margin had fallen to 2.7%, much lower than that of the world in general, which was 9.3% [
1]. Along with the proposal of Industry 4.0 [
2], several countries have devised their own policy aimed at accelerating intelligent manufacturing. A new paradigm of digitized and connected manufacturing referred to as “Industry 4.0” or “Industrial Internet of Things” (IIoT) is transforming established factories into smart and autonomous production [
3]. Meanwhile, a report from Accenture indicates that digitalization is inclined to bring an increment of 3.7% in GDP of China by 2020. In this context, China unveiled its first 10-year national plan for transforming China’s manufacturing, entitled “Made in China 2025” [
4], which illustrates that companies should take advantage of prominent enterprises and advance the application of Industrial Internet technology, cloud computing and big data in the whole process, including researching, production, management and marketing [
5].
The intelligent upgrades cannot be implemented smoothly without the participation of small and medium-sized enterprises, since in the upgrades they play a critical role as front-runners in their own niche market or suppliers or followers for big companies. However, there are still many obstacles to SMEs’ intelligent upgrades, such as the vulnerability in face of market risks, the fear of investment risks, and the difficulty of financing caused by banks’ preference to lend money to big companies [
6]. Past research has often focused on the overall study of Chinese manufacturing, but ignores the particularities of SMEs.
As a province dominated by small and medium-sized enterprises, Zhejiang Province has provided much room for innovation and development for SMEs with the emergence of the brand-new intelligent ecology, accelerated international cooperation, and more supportive policy environment. Therefore, this paper chooses small and medium-sized enterprises in Zhejiang Province as the research objects. We can find out the dynamic factors in the SMEs’ development, put forward corresponding suggestions to promote SMEs’ development, and provide pertinent suggestions for SMEs’ intelligent upgrades in Zhejiang Province and even in the whole country.
There are three main innovations in this paper:
First, the research object is novel. Most scholars focus on enterprise transformation and upgrades or performance. Although there are similarities between transformation and intelligent upgrades in improving efficiency, they are not completely the same. Ho outlined a scheme that used manpower from public research institutes to assist the technology upgrades of SMEs in Singapore and found the scheme of great use [
7]. However, there are few studies on the dynamic mechanism of intelligent upgrades. Therefore, delving the dynamic force and constraints of intelligent upgrades is what makes this paper different from other research.
Secondly, this paper adopts quantitative analysis. Compared with other forms of questionnaires, this paper quantifies entrepreneurs’ judgment of the market. We made a regression using two types of factors: enterprise characteristic variables and policy environment variables to make the results of empirical analysis more precise and reliable.
Thirdly, the empirical method we choose is more reasonable. Compared with using the Logit model only, this paper is based on the Logit model and also the Probit model to test the robustness, contributing to a more accurate and convincing result.
The remaining part of this paper will be divided into six sections. The following section elaborates the current scholars’ research on intelligent upgrades of SMEs. The
Section 3 of the article includes the descriptions of variables and survey data, and the introduction of the Logit Model. In the
Section 4, we make statistical analysis of data based on the binary selection model, conduct robustness tests including the Likelihood ratio test, F test, and Probit Model test, and carry out the demonstration effect test and industry heterogeneity test. The
Section 5 contains conclusions and suggestions. The
Section 6 discusses limitations and future work.
2. Literature Review about the Overview of the SMEs Studies in China
The existing scholars’ research on SMEs’ intelligent upgrades mainly focused on the factors of transformation and upgrades and seldom analyzed the dynamic factors of intelligent upgrades. Others paid attention to the factors of productivity or performance in SMEs, but had no idea of the intelligent upgrades. Specifically, previous researches have explored the following three aspects:
(1) Several studies focused on the impact of R&D or Industry 4.0 on enterprise performance. Yue adopted fixed effect regression [
8], and analyzed the innovative effects of three dimensions of R&D outsourcing: overseas R&D cooperation, establishment of R&D centers, and mergers and acquisitions. He found that the establishment of overseas R&D centers and overseas mergers and acquisitions had significant effects on the improvement of innovation performance. Sai [
9] found that internal R&D significantly promoted technological innovation in Taiwan’s medium and low-tech enterprises. In order to elevate the competitiveness of businesses, Garcia-Muiña [
10] explored the phases of the transition from a linear to a circular economy and proposed a procedure for introducing the principles of sustainability in a manufacturing environment with the assistance of key ICT technologies, such as the Internet of Things (IoT). It also has been found that industry 4.0 delivered significant business value to large multinationals [
11]. Considering five Industry 4.0 factors, namely, Big Data, Smart Factory, Cyber Physical Systems (CPS), Internet of Things (IoT), and Interoperability, Imran [
12] found that Industry 4.0 had a key role in promoting the production and services sector in Pakistan. Judit [
13] pointed out that in Hungary, companies using CPS, CPPS, and Big Data Technologies had been evaluated as having a higher level of logistic service, performing more efficiently, and harvesting higher market share. Some research has demonstrated an opposite conclusion. Lucas [
14] found that some of the Industry 4.0 technologies were seen as promising for industrial performance while some of the emerging technologies were not, which was contrary to the conventional viewpoints.
(2) Several studies paid attention to the implication of relevant factors on the transformation and upgrades of enterprises, such as wage level, enterprise scale, importing and exporting scale, and so on. The empirical results of Liu and Ren [
15] showed that there was a positive correlation between average wage level and industrial upgrades in China. Low wage level weakened the motivation of entrepreneurs for industrial upgrades. Hicks pointed out in his Wage Theory that the increase of wage would promote the substitution of capital, technology, and other production factors, and promote the transformation and upgrades of industrial structure. Jing and other scholars pointed out that importation, along with the cooperation of domestic R&D, fuels the progress of environment-friendly technology [
16] and exportation often performed otherwise. Ślusarczyk [
17] testified the willingness of entrepreneurs to implement smart manufacturing and found that the majority of the surveyed companies deemed the concept of Industry 4.0 as a great opportunity for company development, showing the significance of positive attitudes of entrepreneurs in the process of intelligent upgrades.
(3) Other studies focused on dividing and summarizing different dynamic factors, and based on which the maturity of SMEs’ intelligent upgrade conditions was evaluated. Wu believed that there were two main factors promoting the transformation and upgrades of enterprises: one was the pulling factor [
18], the other was the dynamic factor. Both of them often worked together in the process of transformation and upgrades of SMEs. However, the dividing method of factors that Schumacher [
19] put forward was slightly different from the above. They defined 9 dimensions and assigned 62 items to them for assessing Industry 4.0 maturity. The dimensions “Products”, “Customers”, “Operations”, and “Technology” were created to assess the basic enablers while the dimensions “Strategy”, “Leadership”, “Governance”, “Culture”, and “People” allowed for including organizational aspects into consideration. In order to work out determinants related to additive manufacturing adoption, Oettmeier [
20] classified factors into four interdisciplinary categories: technology-related factors, firm-related-factors, market structure-related factors, and supply chain-related factors. The above research did not distinguish factors from driving force to constraints. Julian [
21] recognized the Industry 4.0-related opportunities and challenges as drivers for Industry 4.0 implementation and found that strategic, operational, environmental, and social opportunities were positive drivers of Industry 4.0 implementation, while challenges with regard to competitiveness and future viability, as well as organizational and production fit, hindered its progress. This research has taken several important factors in the light of the company into consideration. Still, there are some missing factors worth researching which are involved in this paper, such as the profitability of enterprises, and the proportion of employees with a bachelor’s degree or above. We also consider environmental factors, including proportion of enterprises that carry out intelligent upgrades in the industry, to figure out the existence of demonstration effect.
It can be seen that at present, mainly focusing on enterprise transformation and upgrades or performance, scholars have not done much research on the stimulating factors of intelligent upgrades. Although there are similarities between transformation and upgrades and intelligent upgrades in improving productivity, they are not totally the same. Intelligent upgrades must be accompanied by enterprise upgrades, but more emphasis is placed on the integration of information technology and industrialization. Information technology is the cornerstone for intellectualization, and intellectualization is the successive emergence of more advanced productivity. Therefore, the purpose of this paper is to study the main factors affecting the intelligent upgrades of SMEs, and to provide empirical evidence for further promoting the intelligent upgrades of small and medium-sized enterprises.
3. Research Design
3.1. Variable and Data Description
In this paper, the “intelligent upgrade” is served as a dependent variable, and digital 1 represents the enterprise as having upgraded intelligently and digital 0 represents not yet. From the previous scholars’ research, it can be concluded that the dynamic mechanism and constraints affecting the intelligent upgrades of SMEs (small and medium enterprises) mainly include two aspects: enterprise characteristic variables and policy environment variables, which can be subdivided into 14 variables that may affect the intelligent upgrade process of SMEs, and the specific variables are shown in
Table 1.
The enterprise characteristic variables include 7 items. The variable “Industry” is used to identify whether the enterprise belongs to manufacturing industry, and digital 1 represents that the enterprise belongs to manufacturing industry while digital 0 represents that the enterprise belongs to non-manufacturing industry. We also use the variable “Annual Output Value” as an indicator of productivity of the company, and number 1 stands for less than 10 million, 2 for 10 million to 20 million, 3 for 20 million to 30 million, 4 for 30 million to 40 million, and 5 for more than 40 million. We employ the variable “Asset-Liability Ratio” to reflect the capital structure, and number 1 stands for 0 to 20%, 2 for 20% to 40%, 3 for 40% to 60%, 4 for 60% to 80%, and 5 for 80% to 100%. “Wage Ratio” is deployed to illustrate the percentage of salary cost among total cost. The number 1 stands for 0 to 20%, 2 for 20% to 40%, 3 for 40% to 60%, 4 for 60% to 80%, 5 for 80% to 100%, and 2.5 for unclear. In addition to this, “Net Profit” is used to demonstrate the profitability of the corporation, and number 1 stands for less than 1 million, 2 for 1 million to 5 million, 3 for 5 million to 8 million, and 4 for more than 8 million. Finally, we take “Proportion of Bachelor Degree or Above” and “R&D Personnel Ratio” into consideration to reveal the relationship between human capital and intelligent upgrades. The number 1 stands for 0 to 20%, 2 for 20% to 40%, 3 for 40% to 60%, 4 for 60% to 80%, and 5 for 80% to 100%.
As for policy environment variables, we apply variable “Prospects for Development” to unveil the development stages of the industry. Number 1 represents germination stage, number 2 represents expansion period, and number 3 represents maturity. “Government Support” is used to convey the government’s attitude towards the industry with a growing number from 1 to 5 showing the attitude shifting from “opponent” to “very supportive”. In addition to this, we deploy variable “Operational Condition” and “Business Environment” to showcase whether the whole industry is running healthily. Number 1 means very bad and number 5 means very good. The difficulty of financing for SMEs is an important problem that has plagued China’s economic development for a long time [
22]. “The Difficulty of Financing” is also applied in the model and a measuring scale ranging from 1 to 5 shows the extent of difficulty. The same scale is also applied when measuring “Pressure of High Environmental Standards”. The final variable is “Proportion of Intelligent Upgrade Enterprises in the Industry” in which number 1 stands for 0 to 20%, 2 for 20% to 40%, 3 for 40% to 60%, 4 for 60% to 80%, and 5 for 80% to 100%.
Among them,
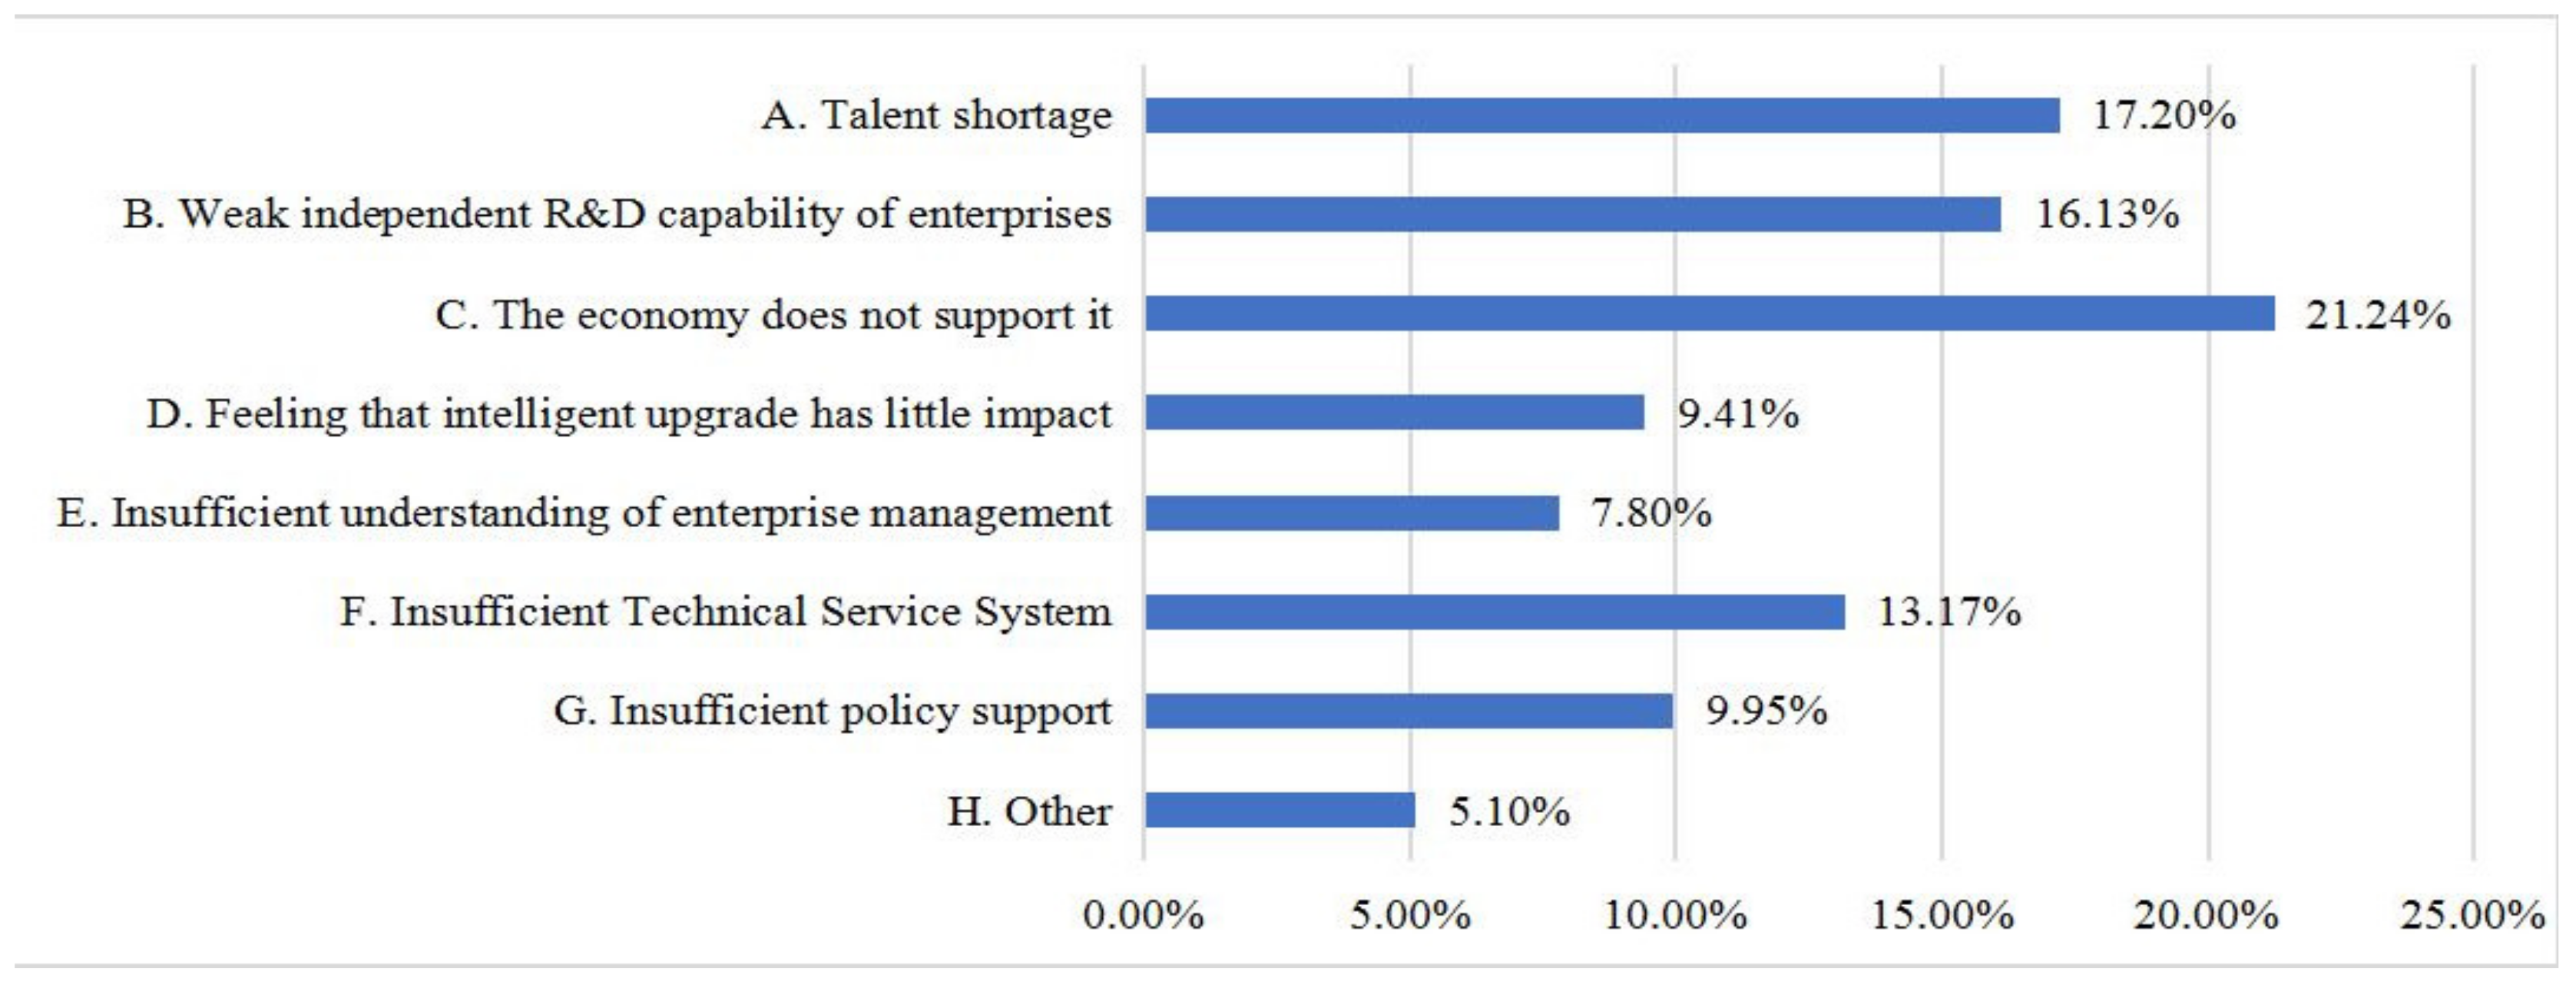
Figure 1 shows the reason why the relevant SMEs have intelligently upgraded. Based on
Figure 1, economic strength is the major reason, followed by talent shortage, weak capability of researching independently, and the imperfection of technical service system. The result is consistent with our intuition: scarcity of financial strength and shortage of high-educated talents hold back the willingness of enterprises to carry out intelligent upgrades independently. In addition, lacking in independent capabilities of R&D, enterprises have to purchase high-tech equipment with huge sum of money. However, multitudinous enterprises are short of money, thus making them fail to carry out intelligent upgrades.
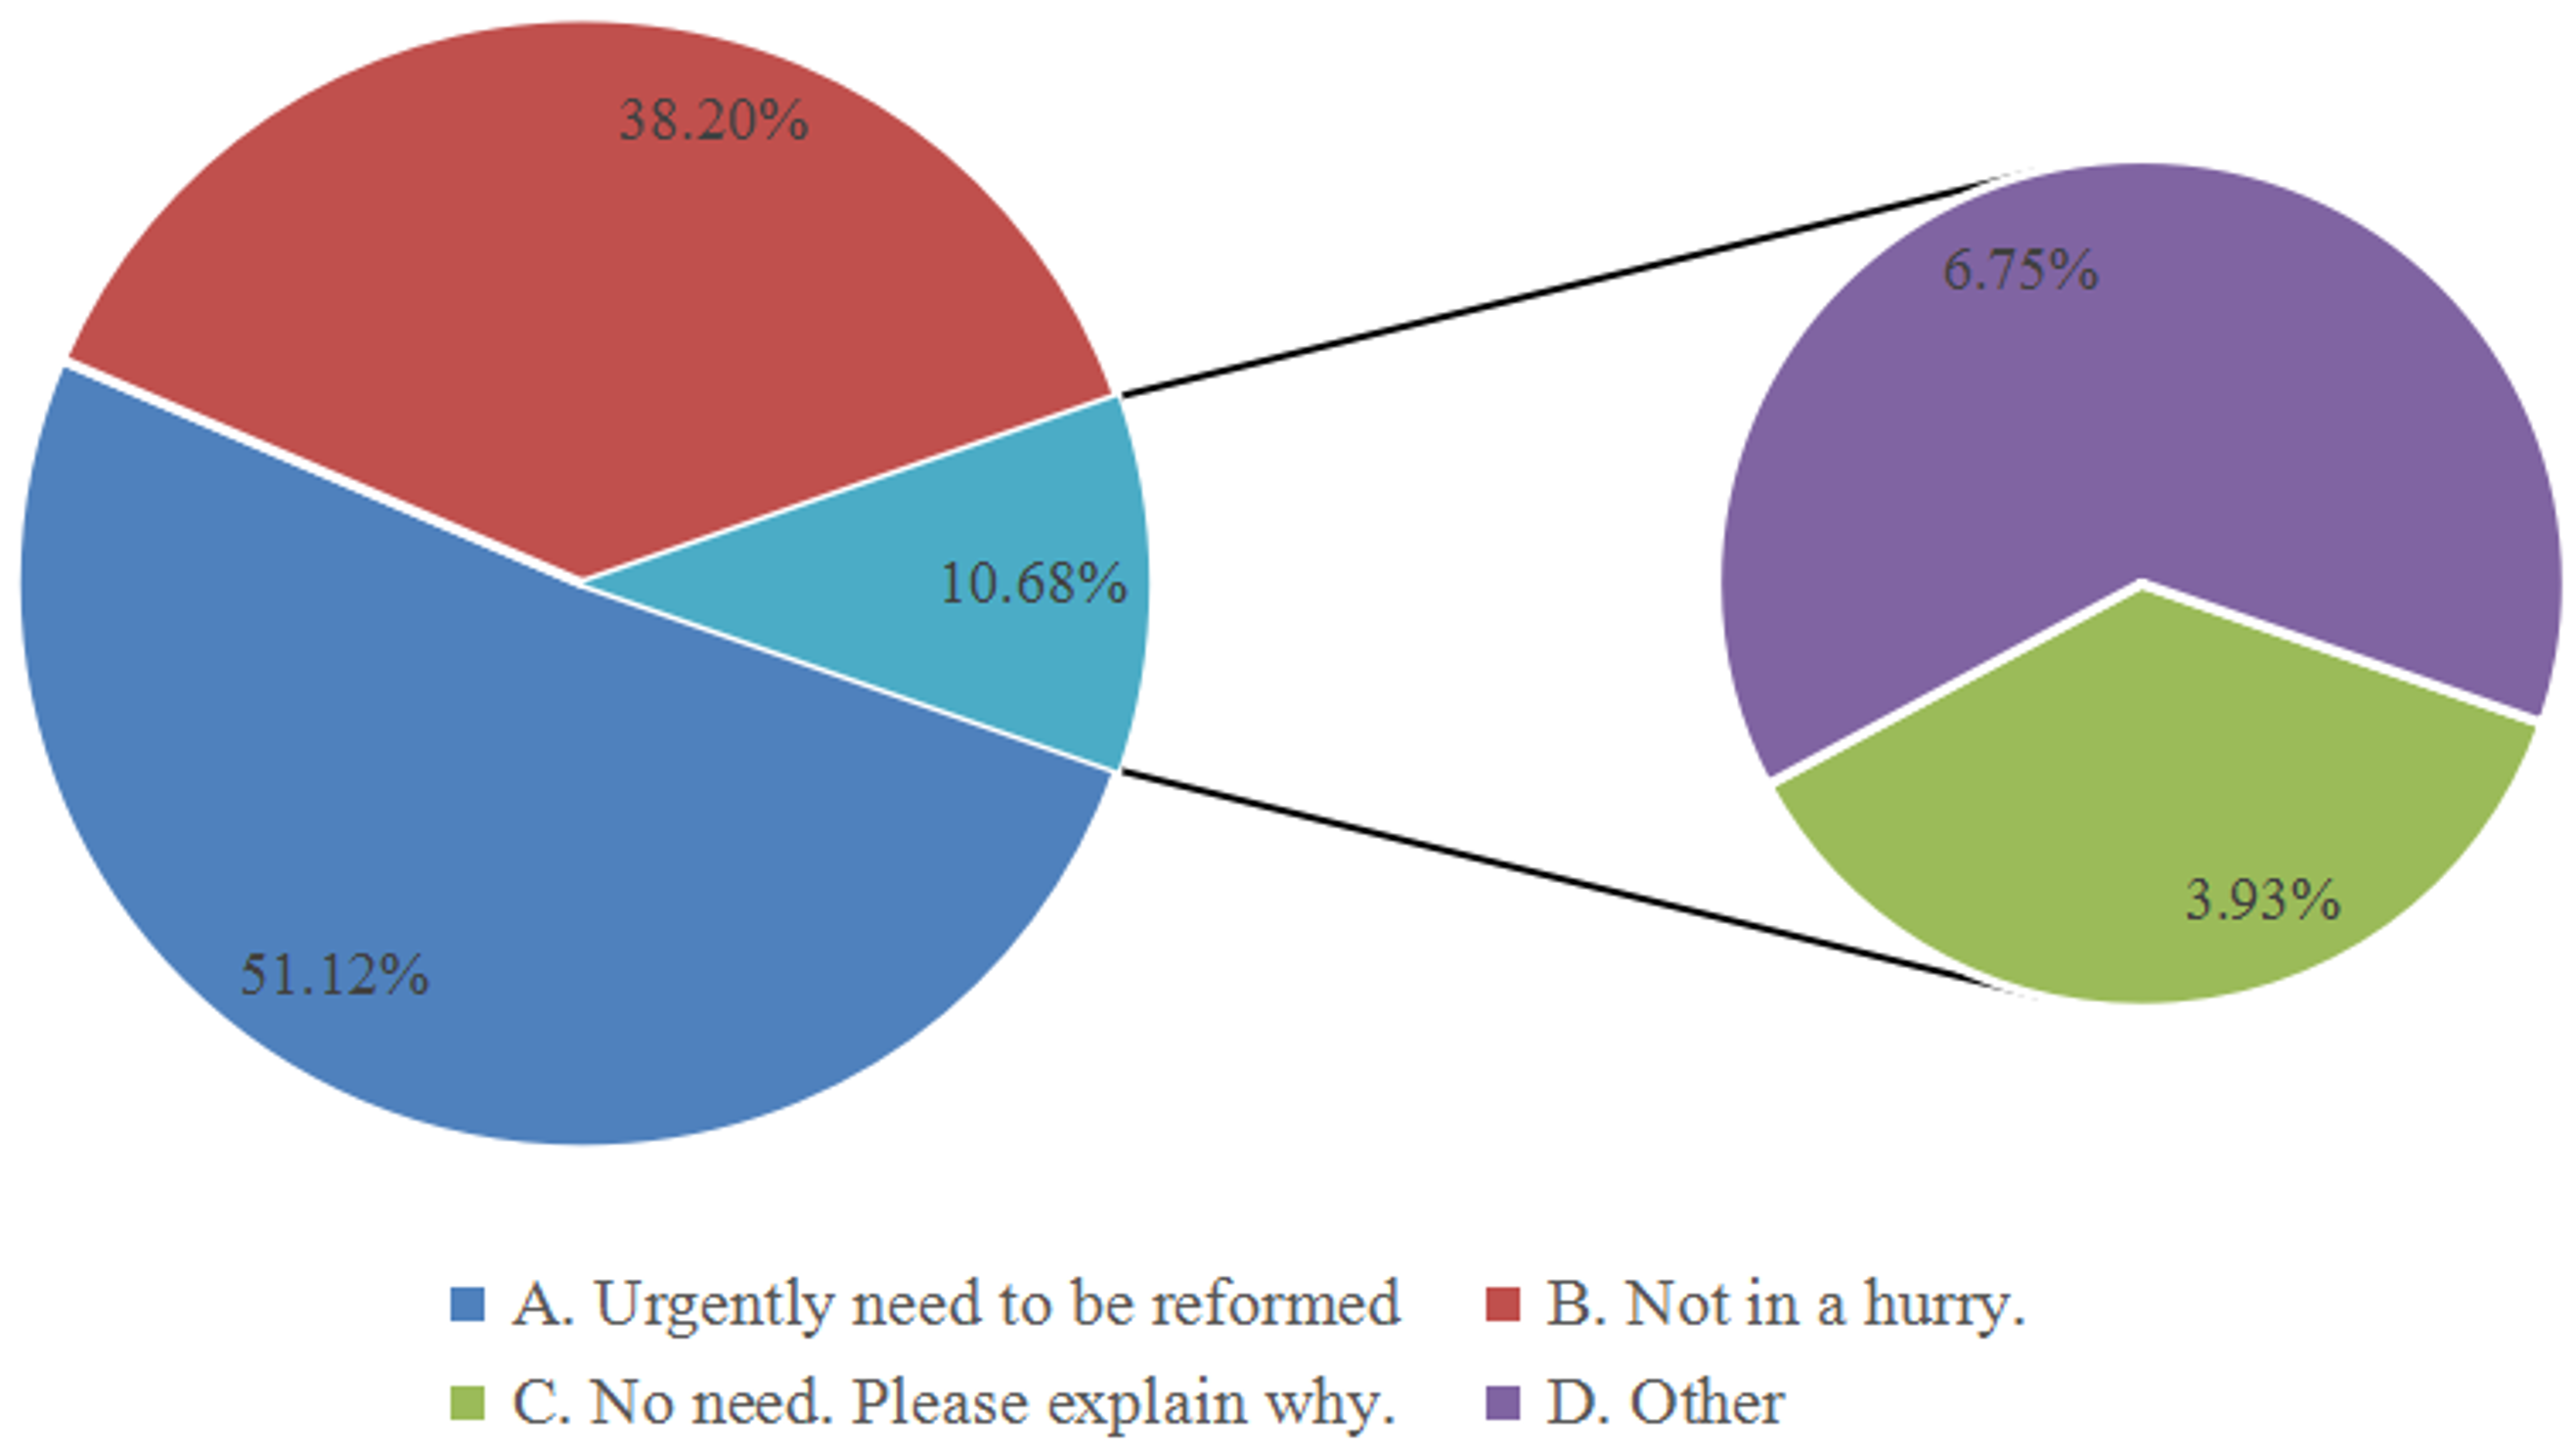
Figure 2 exhibits the result of a survey of intelligent willingness of enterprises that have not yet intelligently upgraded. 51% of enterprises believe that intelligent upgrades are an urgent task. Most enterprises are aware of the benefits of intelligent upgrades to enterprises. However, owing to various reasons, the process of intelligent upgrades is suspended. The conclusions drawn in this paper can just provide targeted suggestions for this part of enterprises and promote the intelligent upgrades.
3.2. Research Hypothesis
In order to study the key factors of intelligent upgrades of Chinese SMEs, we make the following assumptions:
Hypothesis 1: The dynamic factors affecting the intelligent upgrades of SMEs mainly include the proportion of members with an undergraduate or higher degree, net profit of the enterprise, the proportion of enterprises that finished intelligently upgraded in certain industry, and the government support. Restriction factors mainly include the asset–liability ratio of the enterprise, the salary of the employees and the pressure from high environmental standards.
Hypothesis 2: There is industry heterogeneity in the dynamic mechanism and constraints that affect the intelligent upgrades of SMEs, and there may be different dynamic mechanism and constraints for different industries.
Hypothesis 3: There will be a demonstration effect in the process of intelligent upgrades of SMEs. Enterprises that carry out intelligent upgrades in the industry will promote the intelligent upgrades of other SMEs in the same industry.
3.3. Econometric Model
As a generalized linear regression analysis model, the Logit model was first derived by Luce [
23] according to IIA characteristics, and has been widely used in psychology, sociology, economics, and transportation. The Logit model shows great superiority in prediction. Zhu [
24] once predicted the credit risk of China’s small and medium-sized enterprises for financial institutions in the supply chain financing by applying the Logit model. Although the Probit model requires that the unobservable parts are subject to normal distribution [
25], the basic principle of Probit is consistent with that of Logit, so a variable that shows significance in the Probit model should also be significant in the Logit model. Hence, the result of the Probit model can serve as a robustness test of the Logit model.
While studying the dynamic mechanism and constraints of intelligent upgrades of SMEs, we divide SMEs into two categories (ones are the enterprises that have been or are undergoing intelligent upgrades, with a value of 1, and the others are the enterprises that have not carried out intelligent upgrades, with a value of 0). Therefore, the dependent variable is whether to carry out intelligent upgrades. The independent variables include enterprise characteristic variables, such as employee qualification, funds, policies, and policy environment variables. Then through the Logit model regression analysis, we can get the weight of each independent variable, so that we can roughly understand which factors affect the intelligent upgrades of SMEs significantly and distinguish dynamic factors from constrains. At the same time, the possibility of intelligent upgrades can be predicted according to the key factors of SMEs.
The specific process of the Logit model is as follows:
represents the latent value according to different
i (1, 2, 3, …,
n), and the real value cannot be observed.
represents the specific value of the corresponding
group of independent variables.
represents the corresponding parameter to be estimated;
is a random explanatory variable.
The probability of
is
where,
is the state parameter;
is the boundary point of the interval;
is the standard positive cumulative distribution function.
Likelihood Ratio Test (LRT) is used to evaluate a relatively complex model compared to a simple model to test whether it can be significantly adapted to a particular random data set [
26,
27,
28,
29]. The formula for the LRT test is as follows:
The F test [
30] is also called the joint hypotheses test. Under null hypothesis (H0), we can use it to analyze statistical models with more than one parameter to determine whether all or parts of the parameters in the model are suitable for estimating the dependent variable. The formula for the F test is as follows:
In order to eliminate the influence of endogenous variables, based on the Logit model, this paper further uses the Probit model to test its robustness.
The specific process of the Probit model is as follows:
represents the value of the latent variable on and cannot observe the specific value. represents the specific value of the corresponding set of independent variables. represents the corresponding parameter to be estimated; is a random explanatory variable.
The probability of
Yi = 0, 1, 2… getting easily is:
Based on the basic Logit model, we study the influence of different variable groups on the intelligent upgrades of SMEs by adding variables one by one, observing the changes of R-squared and the changes of significance in each variable. With Logit serving as the benchmark model, the robustness test is carried out with the Probit model, LRT, and F test to make the regression results more robust to meet the requirements of this paper.
4. Empirical Conclusion
4.1. Benchmark Model
Table 2 shows the basic regression results using the Logit model. It can be seen that with the increase of explanatory variables, R-squared increases gradually. Manufacturing enterprises are more inclined to carry out intelligent upgrades, and net profit is the most influential factor to promote the intelligent upgrades of SMEs.
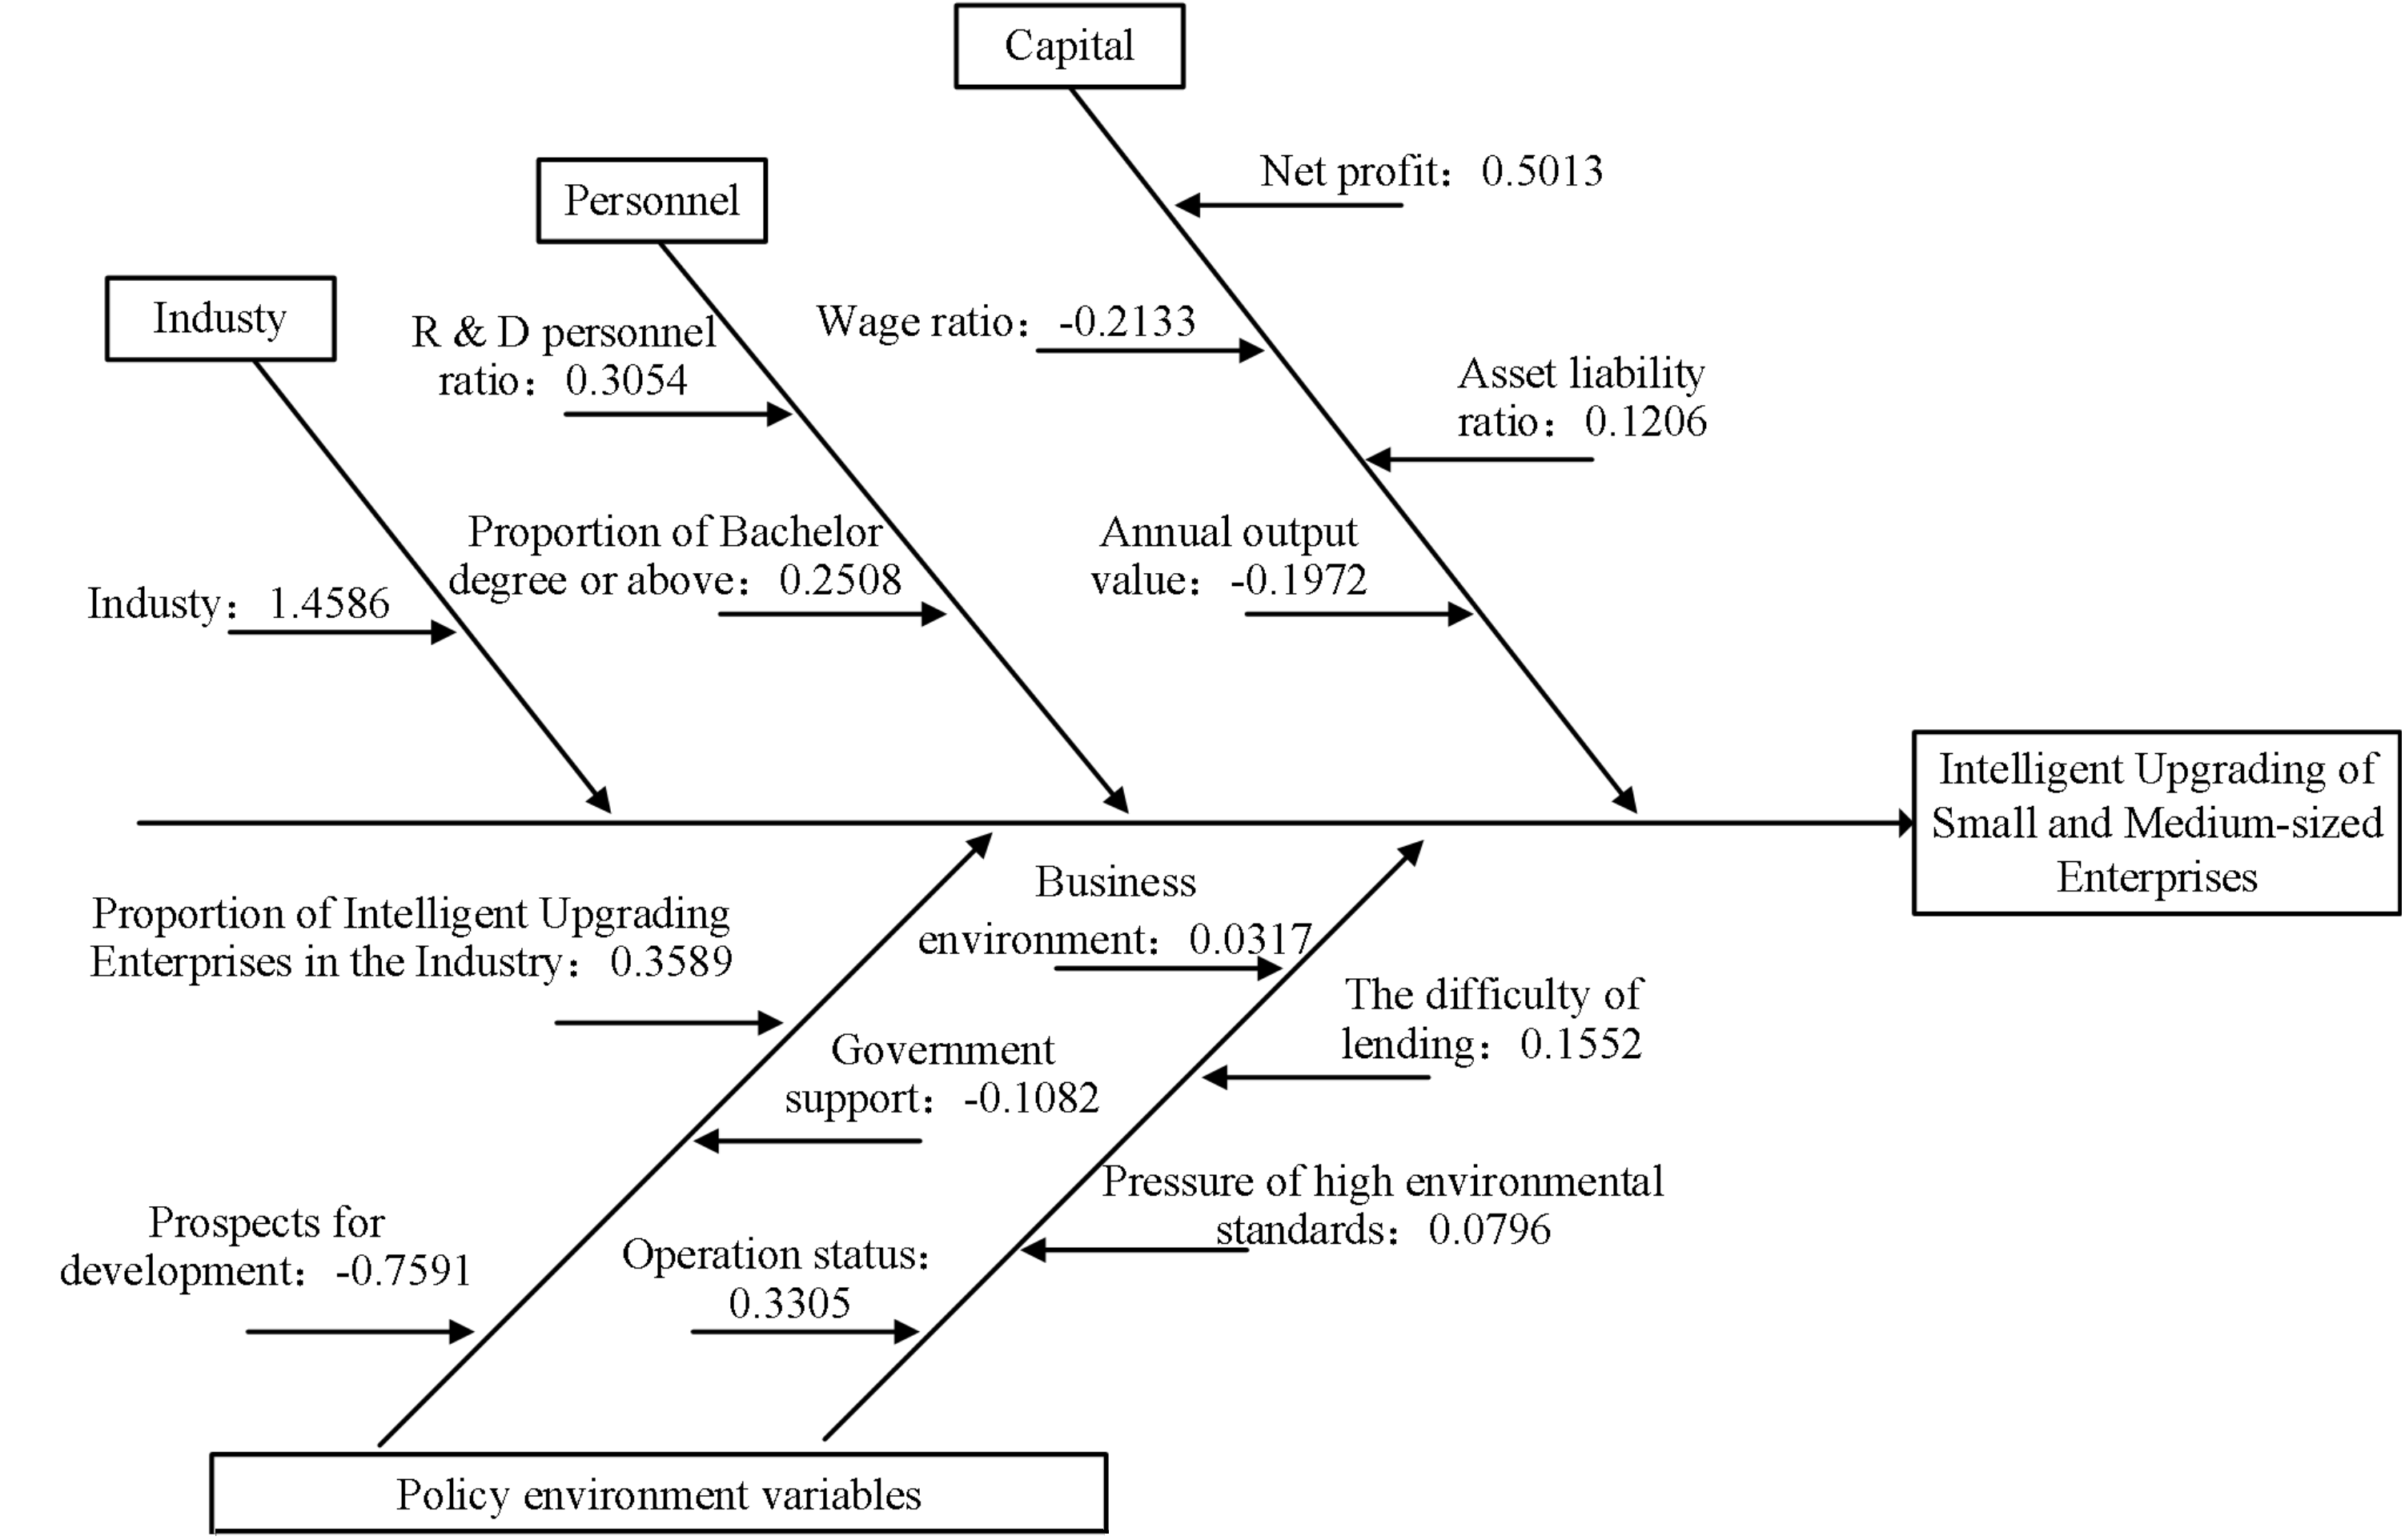
Figure 3 shows the ishikawa diagram of the factors affecting the intelligent upgrades. It can be concluded that enterprises with a higher asset–liability ratio and better industrial development prospects are more reluctant to carry out intelligent upgrades. This is because the higher the asset–liability ratio, the risker for enterprises to borrow more funds to support its intelligent upgrades. Besides, a better development prospect makes entrepreneurs more reluctant to upgrade intelligently.
In order to optimize the model, we adopt a stepwise regression method to eliminate variables that are weak or have no explanatory power for the model. In the regression model with all variables added, the factors with poor significance are eliminated gradually, and then the regression is performed until all the variables are significant. This process is also called backward screening. The regression result is shown in
Table 3.
According to the data in
Table 3, manufacturing enterprises are more prone to carry out intelligent upgrades. Higher net profit manifests that the demand for intelligent upgrades of enterprises can be satisfied to a certain extent. One former research [
31] pointed out that firms with high annual sales volume were more likely to invest in R&D activity, which supports our standpoint. However, with better development prospects of the industry, enterprises will be inhibited to carry out intelligent upgrades. This may be because enterprises at this stage have already obtained sufficient profits. Lacking attractive marginal benefits, they lose the demand for intelligent upgrades. Enterprises with a higher proportion of employees above the bachelor degree are more conducive to the intelligent upgrades. This result is in line with our hypothesis 1 and it is also accordance with previous research that underlined the indispensability of qualified workers in the process of intelligent upgrades [
32,
33,
34,
35].
From the Logit regression results above, it can be seen that the coefficient of the proportion of upgraded enterprises in the industry is positive, indicating that enterprises in an industry with a higher proportion of intelligently upgraded companies are more liable to implement intelligent upgrades. Besides, by observing the results of the backward screening, this factor turns out to be significant, which further confirms the existence of the “demonstration effect”.
The “demonstration effect” [
36] means that when people are making decisions, they will be influenced by the decisions of people around them. In this paper, the decisions on whether to carry out intelligent upgrades or not will be affected by the decisions of surrounding enterprises. “Demonstration effect” has been testified by several researchers, such as Han and Wang [
37]. Kristoffer once illustrated that demonstration plants could affect innovation in the backdrop of advanced biofuel technology [
38]. Similarly, our findings reveal the existence of “demonstration effect” in intelligent upgrades and the third hypothesis is supported.
4.2. Likelihood Ratio Test and F Test
On this basis, we carry out the likelihood ratio test. A chi-square test of the constructed Logit model shows that the
P value is 0.00, which is significant at the 5% level, indicating that the model is statistically significant. The left 5 variables show a significant impact on the intelligent upgrades of SMEs. The specific result is shown in
Table 4.
Because there may be cases in which a single variable is not significant, but will be significant when joint with other variables, we use F test to study the significance in different groups of variables. The study assumes that the coefficient of the same group of variables is zero, and if we reject the null hypothesis after testing, we can deduce that each group has an impact on promoting intelligent upgrades.
Table 5 shows the results of the F-test after gradually introducing variables. From the results, it can be seen that, as a whole, the enterprise characteristic variables are significant at the level of 5%, and the policy environment variables are also significant at the level of 10%. Therefore, it can be concluded that the industry, capital, employee qualification, and policy environment have an impact on the intelligent upgrade process of SMEs.
4.3. Robustness Test: Probit Model
In this paper, the Probit model is used to test the results for further robustness. The specific result is shown in
Table 6.
As can be seen from the data in
Table 6, with the addition of variables, the R-squared of the whole model increases gradually, and the robustness regression results are significantly consistent with the regression results of the Logit model. The coefficients are also consistent, which indicates that the robustness of the parameters is verified.
4.4. Industry Heterogeneity Test
In order to test whether the dynamic mechanism and constraints of intelligent upgrades are the same in the manufacturing and non-manufacturing industries, we use the Logit model to conduct an industry heterogeneity test by distinguishing manufacturing industry from non-manufacturing industry.
Table 7 is the result of the regression of the manufacturing and non-manufacturing models respectively. It is clear from the table that the proportion of intelligent upgrades in the industry has the most significant impact on the intelligent upgrades for non-manufacturing industries, but for manufacturing, the impact of net profit and industry development prospects on whether enterprises will carry out intelligent upgrading is the most significant. Therefore, we can deduce that in the process of intelligent upgrades of SMEs, there is industry heterogeneity indeed. Factors may vary for different industries.
5. Conclusions and Suggestions
Based on the theoretical basis and the data obtained from field visits and questionnaires, this paper establishes a mathematical model for SMEs by using the binary selection model, obtains the dynamic mechanism and constraints affecting, and carries out rigorous robustness tests, demonstration effect test and industry heterogeneity test. The following conclusions are drawn:
(1) Enterprise characteristic variables and policy environment variables will affect the intelligent upgrades of SMEs. Through F-test and backward screening, it is concluded that the dynamic mechanism that significantly affects SMEs’ intelligent upgrades includes the profitability of enterprises, the proportion of employees with a bachelor’s degree or above and the proportion of enterprises that carry out intelligent upgrades in the industry, while the restrictive factor that significantly affects SMEs’ intelligent upgrades is the excellent development of the industry. From the analysis, it can be concluded that the manufacturing enterprises with higher profits, higher education staff, and higher proportion of intelligent upgrades in the industry and general industry development are more inclined to carry out intelligent upgrades.
(2) For different industries, the dynamic mechanism and constraints of SMEs’ intelligent upgrades are different, which means it exists industry heterogeneity. By classifying enterprises according to whether they are manufacturing enterprises or not, this paper concludes that the proportion of intelligent upgrade enterprises in the industry has a significant impact on non-manufacturing enterprises, while for manufacturing industry, net profit and industry development have a significant impact on it.
(3) In the process of intelligent upgrades of SMEs, there is a demonstration effect, and enterprises will follow the example of other enterprises to carry out intelligent upgrades. By analyzing the results of Logit regression and Probit robust regression, it is concluded that the proportion of intelligent upgrades in the industry has a significant impact on the intelligent upgrades of SMEs, and the coefficient is positive, which means it exists a demonstration effect.
Based on the conclusions drawn, the suggestions are as follows:
(1) Implement pilot projects of intelligent upgrades of small and medium-sized enterprises in various places to promote intelligent upgrades of the same industry and region. Through the test of demonstration effect, it is concluded that enterprises in the process of intelligent upgrades will be affected by enterprises that have already carried out intelligent upgrades in the industry. Therefore, the government should implement the pilot of intelligent upgrades of small and medium-sized enterprises in various places to drive the process of intelligent upgrades in the industry.
(2) Simplify the examination and approval process, increase financial and taxation support, broaden financing channels, and ensure capital investment. Capital, as the dynamic mechanism of SMEs’ intelligent upgrades, can promote the smooth progress of intelligent upgrades. Therefore, the government should increase support for SMEs, broaden financing channels, and ensure that SMEs successfully complete the intelligent upgrades.
(3) Encourage the cultivation of high-tech talents, develop entrepreneurship and innovation, improve the level of intelligence of small and medium-sized enterprises and sustain healthy development. The quality of human capital plays a significant role in promoting the intelligent upgrades of small and medium-sized enterprises. The government encourages the training of high-tech talents and enhances the proportion of highly educated talents in enterprises, which is helpful to the process of intelligent upgrades of enterprises.
(4) Adopt different policies for different industries to promote the intelligent upgrades of small and medium-sized enterprises. Through the test of industry heterogeneity, it is concluded that for different industries, there are different dynamic mechanisms and constraints affecting the process of SMEs’ intellectualization. Taking different policies for different industries will help solve the problems in the industry and maximize the promotion of enterprise’s intelligent upgrades.
6. Limitation and Future Research
There are several limitations that are worth consideration for future research.
Firstly, intelligent upgrade is still a young terminology, and there is a blurred line between concepts of “Industry 4.0”, “Smart Manufacture”, and “Industrial Internet of Things” (IIoT). Since there is no unified perspective on what the term implies, entrepreneurs’ criteria of judging whether the company has implemented intelligent upgrades may vary from person to person tremendously. Therefore, our further research will try to reach an explicit definition and add this criterion into the questionnaire.
Secondly, the sample size is not large enough and there may be some contingencies. Hence, we will further contact the national SME Bureau, strive to promote cooperation, obtain more data of SMEs and expand the sample size. Besides, we are intended to trace the upgrading process of these companies, validate the findings of this study, and collect panel data for further research.
Thirdly, we will further classify enterprises according to the International Standard Industrial Classification of All Economic Activities [
39] to determine whether there are significant differences in the degree of demonstration effects and discern specific characteristics of industry heterogeneity in other types of industries. By using the above measures, we are liable to provide targeted suggestions about intelligent upgrades for SMEs in different industries, and hopefully accelerate the process of intelligent upgrade of SMEs in China.


