Article

Variability and Site Dependence of Grain Mineral Contents in Tetraploid Wheats

1
Department of Biological and Environmental Sciences and Technologies (Di.S.Te.B.A.), University of Salento, via Monteroni, 73100 Lecce, Italy
2
Institute of Sciences of Food Production (ISPA), National Research Council (CNR), via Monteroni, 73100 Lecce, Italy
3
Inter-University Consortium for Research on Chemistry of Metals in Biological Systems (C.I.R.C.M.S.B.), Lecce Research Unit, 73100 Lecce, Italy
4
Department of Soil, Plant & Food Sciences, Genetics and Plant Breeding Section, University Aldo Moro, via G. Amendola, 165/a 70126 Bari, Italy
*
Author to whom correspondence should be addressed.
Sustainability 2019, 11(3), 736; https://0-doi-org.brum.beds.ac.uk/10.3390/su11030736
Submission received: 10 December 2018 / Revised: 12 January 2019 / Accepted: 28 January 2019 / Published: 31 January 2019

Abstract

:
Crop production and natural resource use, especially in developing countries, represents one of the most important food sources for humans. In particular, two wheat species (tetraploid, which is mostly used for pasta and hexaploid, which is primarily used for bread) account for about 20% of the whole calories consumed worldwide. In order to assess the mineral accumulation capability of some popular tetraploid wheat genotypes, a metabolomic (metallomic) approach was used in this study. The metallomic profile related to micro- (Zn, Fe, Cu, Mn, Ni and Cr), macro- (Ca, Mg and K) and toxic trace elements (Cd and Pb) was obtained by ICP-AES analysis in a large set of tetraploid wheat genotypes (Triticum turgidum L.) that were grown in two different experimental fields. Correlations and multivariate statistical analyses were performed, grouping the samples under two wheat sets, comprising cultivated durum cultivars (T. turgidum subsp. durum) and wild accessions (T. turgidum subsp. dicoccum and subsp. dicoccoides). The site dependence ranking for the selected genotypes with the highest nutrient accumulation was obtained. The significantly higher content of Mg (among the macronutrients) and the highest levels of Mn, Fe and Zn (among the micronutrients) were found for wild accessions with respect to durum cultivars. Moreover, the former genotypes were also the ones with the lowest level of accumulation of the trace toxic elements, in particular Cd. According to the performed statistical analyses, the wild accessions appeared also to be less influenced by the different environmental conditions. This is in accord with literature data, indicating the superiority of “old” with respect to modern wheat cultivars for mineral content. Although further studies are required on a wider range of genotypes to confirm these findings, the obtained results could be used to better select the less demanding and better performing cultivars in specific target wheat growing environments.

1. Introduction

Wheat is one of the most important commodities, with a world production of 750 million tons and 220 million ha harvested in 2016, as reported by Faostat [1]. Interestingly, wheat consumption is closely related with the adoption of a “western lifestyle” [2], as well as some countries that are not climatically adapted to wheat cultivation, such as some Sub-Saharan Africa areas [3].
Among the wheat species, two types are prevalent: tetraploid wheat (2n = 28, genome AABB), which is mostly used for pasta, and hexaploid wheat (2n = 42, genome AABBDD), which is primarily used for bread. Together, these wheats account for about 20% of the whole calories that are consumed worldwide. Considering both types, wheat cultivation occurs in a wide range of environmental and soil conditions, and wheat growers face several challenges to reaching high yield and quality standards that are also sustainable and economically feasible. Among the major challenges, there is the identification of agronomical practices or genotypes that may help in reducing the inputs of fertilizers, herbicides and chemical treatments to counteract biotic or abiotic diseases.
Among tetraploid wheat (Triticum turgidum L.), the subsp. durum is the most cultivated and economically important typically rainfed crop and adapted to the semiarid conditions of the Mediterranean Basin. Indeed, the species T. turgidum also includes other subspecies, displaying a large variability for many traits, such as plant adaptability and defence, or quality traits. This variability is still largely unexplored for genes that could meet the needs for a more sustainable management of wheat cultivation. For instance, the subspecies dicoccoides (Körn. ex Asch. et Graebner) Thell.), the wild progenitor of durum wheat, is well known to accumulate more proteins and minerals in mature grains [4]. Also, the subspecies dicoccum, the direct domesticated progenitor of durum wheat, may carry other interesting traits related to plant adaptability that could be easily transferred into the durum background through breeding programs [5]. The occurrence of such variability could be of particular significance to improve yield, especially in those countries that are undergoing urbanization and industrialization, or to address market expectations with respect to quality, nutrition and health issues.
In general, wheat grains have been considered a primary source of energy (carbohydrates), proteins, vitamins and minerals (especially micronutrients, such as iron and zinc) in human diets [2,3,6,7,8,9,10]. Indeed, the potential benefits of wheat on human health are well known and have been extensively studied [6,11,12,13]. Besides the major components, several phytochemicals conferring antioxidant properties [14,15,16,17] and dietary fibers contribute to reduce the risks for cardiovascular disease and colon cancers [2]. The high variability in those health-promoting components was shown to be influenced by both genetic and environmental factors [2,13,18,19].
To increase the content of minerals in wheat grains, in recent years, several biofortification breeding efforts were undertaken, mainly focused on hexaploid wheat. Those studies led to the release of bred varieties having competitive grain yields and about 30–40% more Zn compared with other varieties [20]. Those results were possibly due to the identification of wheat genotypes with elevated Zn contents [21] that were subsequently crossed with modern elite wheat lines that generally do not vary much in terms of mineral contents [22].
Similar studies are mostly missing for tetraploid wheats [17,23]. So far, investigations are urgent to assess the current mineral levels in durum cultivars and in other tetraploid wheats subspecies to underpin the extent of genetic variability that is available within the primary gene pool. In fact, the assessment of genetic variation for mineral content is essential for the success of breeding activities that are aimed at developing new micronutrient-rich wheat genotypes that also display high grain yields [24,25]. Some literature data [26,27,28] indicated the superiority of “old” with respect to modern high-yielding wheat cultivars for mineral contents, however a comprehensive survey in tetraploid wheats is still lacking [28]. Also, more efforts devoted to investigate the influence of different growing sites on mineral accumulation in durum wheat grains would be important to identify precise genotype x environment combinations resulting in higher contents of some micronutrients, such as Fe, Zn, Mn and Cu, which have important physiological functions in humans [2,3,12,14,15,18,19,24,25,26,28,29,30].
In order to investigate the genetic variability for mineral content in tetraploid wheats, this study was conducted with the following objectives: (1) to evaluate, by ICP-AES analysis, the metallomic profile related to micro- (Zn, Fe, Cu, Mn, Ni and Cr), macro- (Ca, Mg and K) and toxic trace elements (Cd and Pb) in a collection of tetraploid wheats, including durum cultivars and dicoccoides and dicoccum accessions; (2) to investigate the site dependence features exhibited by durum and wild wheat by both univariate and multivariate statistical analyses, and (3) to evaluate a possible ranking of exhibited site-dependence among the considered subspecies.

2. Materials and Methods

2.1. Data Collection

The wheat collection that was analyzed in this study was composed of 25 tetraploid wheat genotypes comprising dicoccum, dicoccoides and durum subspecies of T. turgidum (Table 1). The plant material was grown under conventional farming in the experimental fields of the Department of Soil, Plant and Food Sciences at Valenzano, Italy (site-A) in 2013–2014 [31], and at Policoro, Italy (site B) in 2014–2015 [32]. The plants were grown in a randomized complete block design with three field replicates and plots consisting of 1m rows that were 30 cm apart, with 50 germinating seeds per plot. During the growing season, 120 kg/ha N were applied and standard cultivation practices were adopted. Plots were hand-harvested at maturity.

2.2. Determination of Metal Concentration

The concentration of macronutrients (Ca, Mg, K), micronutrients (Zn, Fe, Cu, Mn, Ni, Cr) and toxic trace elements (Cd, Pb) was determined using the Inductively Coupled Plasma Atomic Emission Spectroscopy (ICP-AES) in the whole grains of 25 wheat accessions and cultivars for each site. Wheat samples were mineralized following standard procedures [33]. Briefly, in a Teflon vessel, 0.5 g of each sample were added with 6 mL of super pure HNO3 69% and 4mL H2O2 and were digested at 180 °C for 10 min using a Milestone START D microwave digestion system. After mineralization, the samples were cooled at room temperature, diluted to a final volume of 30 mL with super pure water and filtered. The solutions that were obtained after the mineralization process were subsequently analyzed by a Thermo Scientific iCAP 6000 ICP-AES spectrometer. It should be noted that the obtained metallomic profiles refer to the whole grain wheat mass (upon chemical digestion and ICP analyses). Therefore, no kernel related adjustments were considered since a simple metabolomic approach was used in this study in order to assess the bioaccumulation ability of different wheat species groups.

2.3. Statistical Analysis

Standard analysis of variance (One Way-ANOVA) with Tukey’s honestly significant difference (HSD) post hoc test was applied to compare the means between the two cultivation sites and for multiple comparisons of groups (wheat type) using the R statistical environment, Version 3.5.1 on a 64 bit Windows machine [34]. The levels of statistical significance were at least at p-values < 0.05 with a 95% confidence level. Moreover, the correlation matrix based on Pearson’s coefficient was calculated for all the measured elements by using MetaboAnalyst 4.0, which is a web-based tool for the visualization of metabolomics [35,36]. This approach is the most widely used in this type of data [31,37] in order to assess the existence of a possible linear relationship between minerals for both the two cultivation sites [38]. Multivariate statistical analyses and graphics were obtained using SIMCA 14 software, (Sartorius Stedim Biotech, Umeå, Sweden) [39]. Specifically, exploratory data analysis was performed using Principal Component Analysis (PCA), while Projection to Latent Structures (PLS)-based methods were used for discriminant analysis and data set comparison. The models were validated using an internal cross-validation default method (7-fold) and were further evaluated with a permutation test (400 permutations) [40,41]. The quality of the models was described by R2, Q2 and p values (p[CV-ANOVA], at a 95.0% confidence level, which were obtained from the analysis of variance testing of cross-validated predictive residuals (CV-ANOVA) [41,42]). To investigate the role of the measured variables in classification, a combination of loadings, variable influence on projection (VIP) parameters and p(corr) were analyzed. Loadings describe the correlations that the Principal or PLS component has with the original variables. VIP parameters summarize the overall contribution of each variable to the model and p(corr) represents the loadings scaled as a correlation coefficient (ranging from −1.0 to 1.0) between the model and the original data [43].

3. Results

Mineral Composition of Durum and Wild Wheat

The 25 wheat genotypes were used to assess the potential similarities and/or differences in the mineral content for the considered two harvesting sites (A, Valenzano, Bari, and B, Policoro, Matera) and among the different cultivars. All samples were grown in both the two harvesting sites and three replicates were collected for each sample, reaching a total of 148 (73 and 75 for site A and B, respectively). According to the wheat type, samples were also classified into durum (63 for each site, for a total of 126 samples) and wild (10 and 12 for site A and B, for a total of 22 samples).
Average and standard deviation values for concentrations of macro- (Ca, K, Mg), micro- (Cr, Cu, Fe, Mn, Zn) and toxic elements (Cd, Pb), which were expressed in part per million (ppm), were measured for all the studied cultivars and sites and are reported in Supplementary material (Tables S1 and S2). A summary clustering all of the studied cultivars according to the different wheat species (durum and wild) and the two cultivation sites (A and B) is reported in Table 2 and Figure 1. Tukey HSD test was applied for multiple comparisons of groups (wheat type) and One-way ANOVA was applied to compare the means between the two cultivation sites. As expected [44,
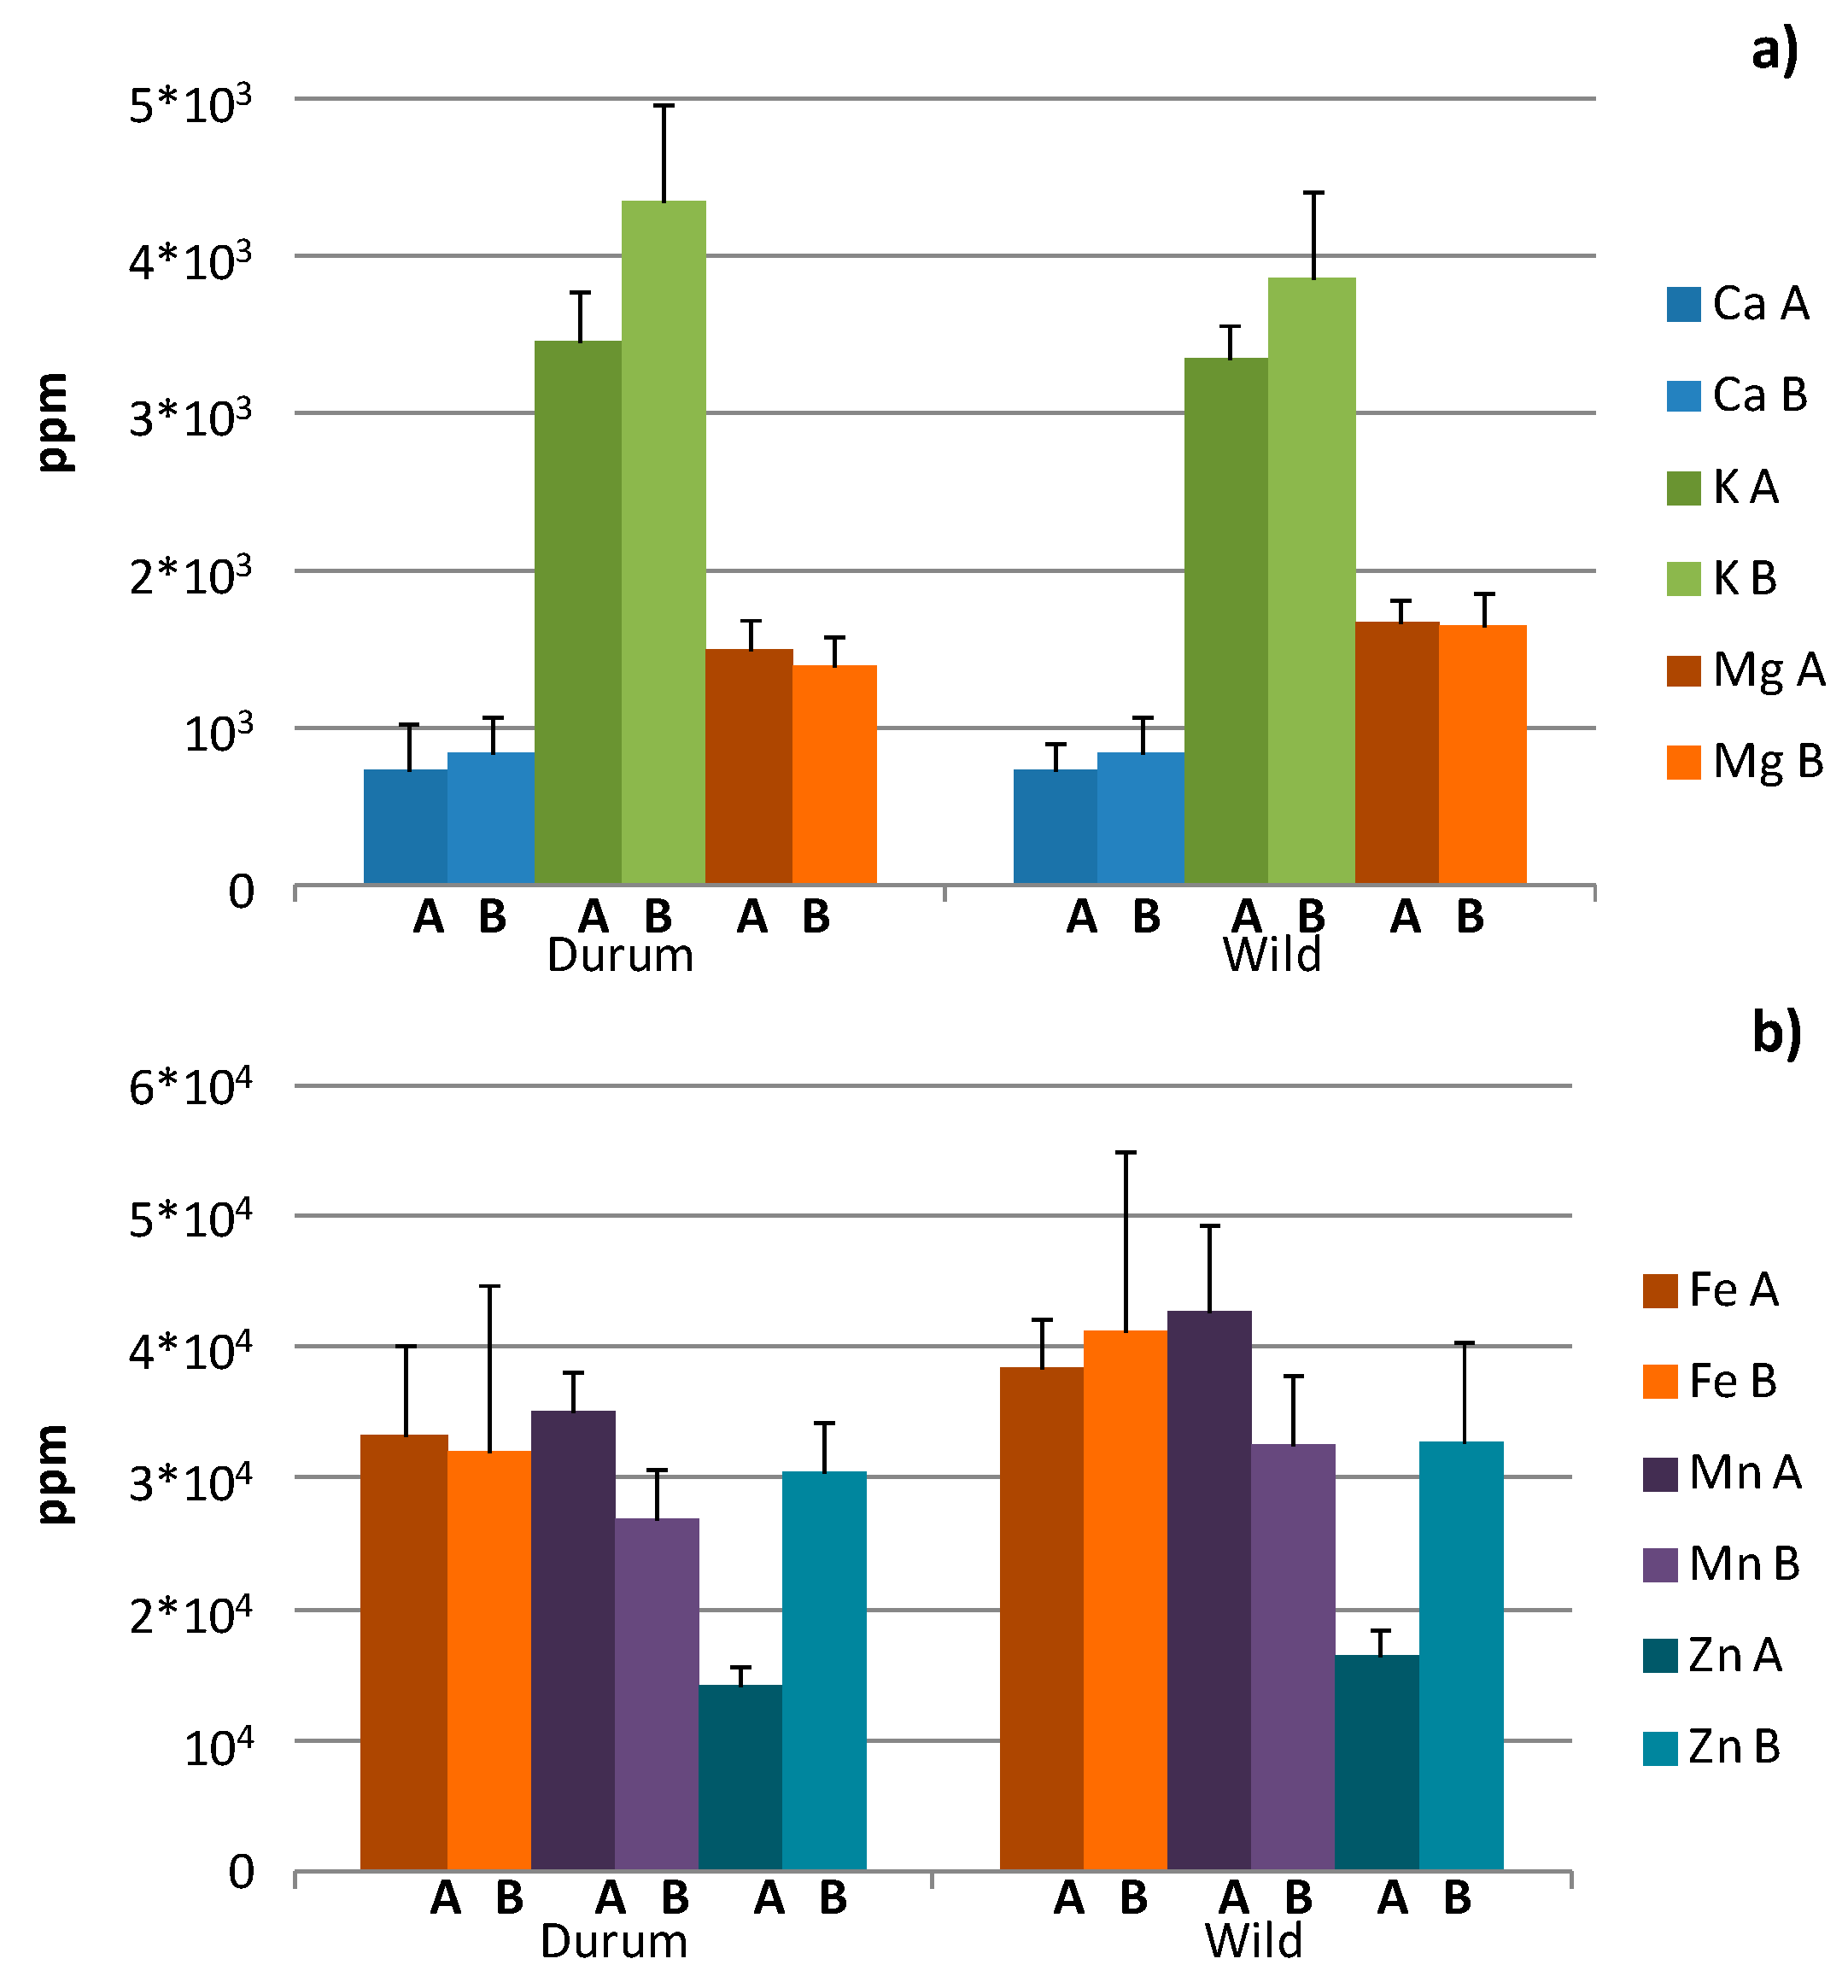
45], among all the measured elements, the highest concentration was found for K, followed by Mg and Ca for all the examined wheat types. In particular, the highest K average value was found for durum wheat (4357.19 ± 618.72 ppm), followed by wild wheat (3864.32 ± 561.39 ppm). On the other hand, the highest Mg content resulted for wild wheat, with a similar content for the two cultivation sites (1665.97 ± 147.10 and 1651.89 ± 203.23 ppm for site A and B, respectively). Moreover, for durum wheat, a significantly lower value for Mg content was found in site B with respect to site A. Average Ca values were comparable in the two wheat types, with the highest content for durum wheat samples (833.08 ± 240.16 ppm) being significantly different from the durum wheat of site A (731.11 ± 295.70 ppm). It should be noted that for each type of tetraploid wheats, the average content of the macro-elements had the expected sequence K > Mg > Ca when considering both the harvesting sites [45]. Regarding micro-elements, in accordance with the literature data [27,37,45,46], higher levels of Mn, Fe and Zn and lower Cu and Cr, with Ni (Ni data not shown), in very low traces for all the samples were found in wild wheat. Interestingly, the highest Mn and Fe values were measured in wild wheat, followed by durum genotypes for both the harvesting sites. Generally higher values of Mn resulted in site A with respect to site B, while similar content of Fe was measured in the two sites. Very significant and site-dependent differences were found only for Zn, with significantly higher levels for the three tetraploid subspecies in site B with respect to site A. Moreover, the highest Zn content was found in wild (32.86 ± 7.50 ppm), followed by durum (30.59 ± 3.69 ppm), all from site B. Finally, higher Cd and Pb levels were found in durum wheat genotypes, with the highest in samples of site A (Cd = 0.10 ± 0.04 ppm, Pb = 0.09 ± 0.04 ppm), followed by wild for both the two harvesting sites.
A further level of investigation was performed by calculating the correlation matrix based on Pearson’s coefficient for all the measured elements. An overview about the potential linear relationship between the metals (macronutrients, Ca, Mg, K, micronutrients, Zn, Fe, Cu, Mn and toxic trace elements, Cd, Pb) was obtained for each tetraploid genotype (durum and wild) and for each cultivation site, A and B (Table 3, Table 4, Table 5 and Table 6). Although a simple correlation analysis, especially considering that a large data set should be carefully used for expressing nutrient relationships, we could find and will discuss a limited range of significant correlations that were obtained in this study. A high level of correlation was observed for durum wheat for both the two sites: in particular six couples of elements (Cu/Zn, Mg/Zn with significance at p < 0.001 and Cu/Mg, Cu/Mn, Zn/Mn, Cr/Fe with significance at p < 0.01) for site A and seven couples of elements (K/Cu, K/Mg, K/Mg, Cu/Mg, Cu/Mn, Cr/Fe with significance at p < 0.001 and Ca/Cd with significance at p < 0.01) for site B (Table 3 and Table 5), while wild wheat showed a low number of correlations in both the two sites (Cr/Cu, Fe/Mn with significance at p < 0.001 and Cr/Fe, Cr/Mg, Cd/Mn and Ca/Mg with significance at p < 0.01 for site A; Cr/Fe with significance at p < 0.001 and Ca/Cd, K/Zn, K/Cr, K/Fe, Cr/Fe with significance at p < 0.01 for site B, Table 4 and Table 6). It should also be noted that in some cases, more significant or positive correlation values for other elements (i.e., Mn/Mg) were expected, although comparable results to those that were obtained in this work were also reported in literature [28,37,47,48].
Multivariate statistical analysis (PCA and OPLS-DA) was used to deeply investigate the variation in macronutrients (Ca, Mg, K), micronutrients (Zn, Fe, Cu, Mn) and toxic trace elements (Cd, Pb) for the whole dataset of 25 wheat accessions and cultivars (three replicates for each cultivar studied) that is representative of durum and wild species in the two cultivation sites. The whole data were studied by OPLS-DA in order to evaluate the potential effect of the different pedoclimatic conditions on the wheat species (Figure 2). In particular, two OPLS-DA models were built using the same number of components (OPLS-DA model of site A: 1 + 2 + 0, R2X = 0.48, R2Y = 0.59, Q2 = 0.43, p[CV-ANOVA] = 2.40612 × 10⁻⁶; for OPLS-DA model of site B: 1 + 2 + 0, R2X = 0.56, R2Y = 0.83, Q2 = 0.78, p[CV-ANOVA] = 2.10965 × 10⁻¹⁹). This approach showed that different pedoclimatic conditions characterize the two sites. Samples cultivated in site A (Valenzano, Bari) were homogeneously distributed in the space of the OPLS-DA graph, while those cultivated in site B (Policoro, Matera) appeared well differentiated in two groups (durum, wild).
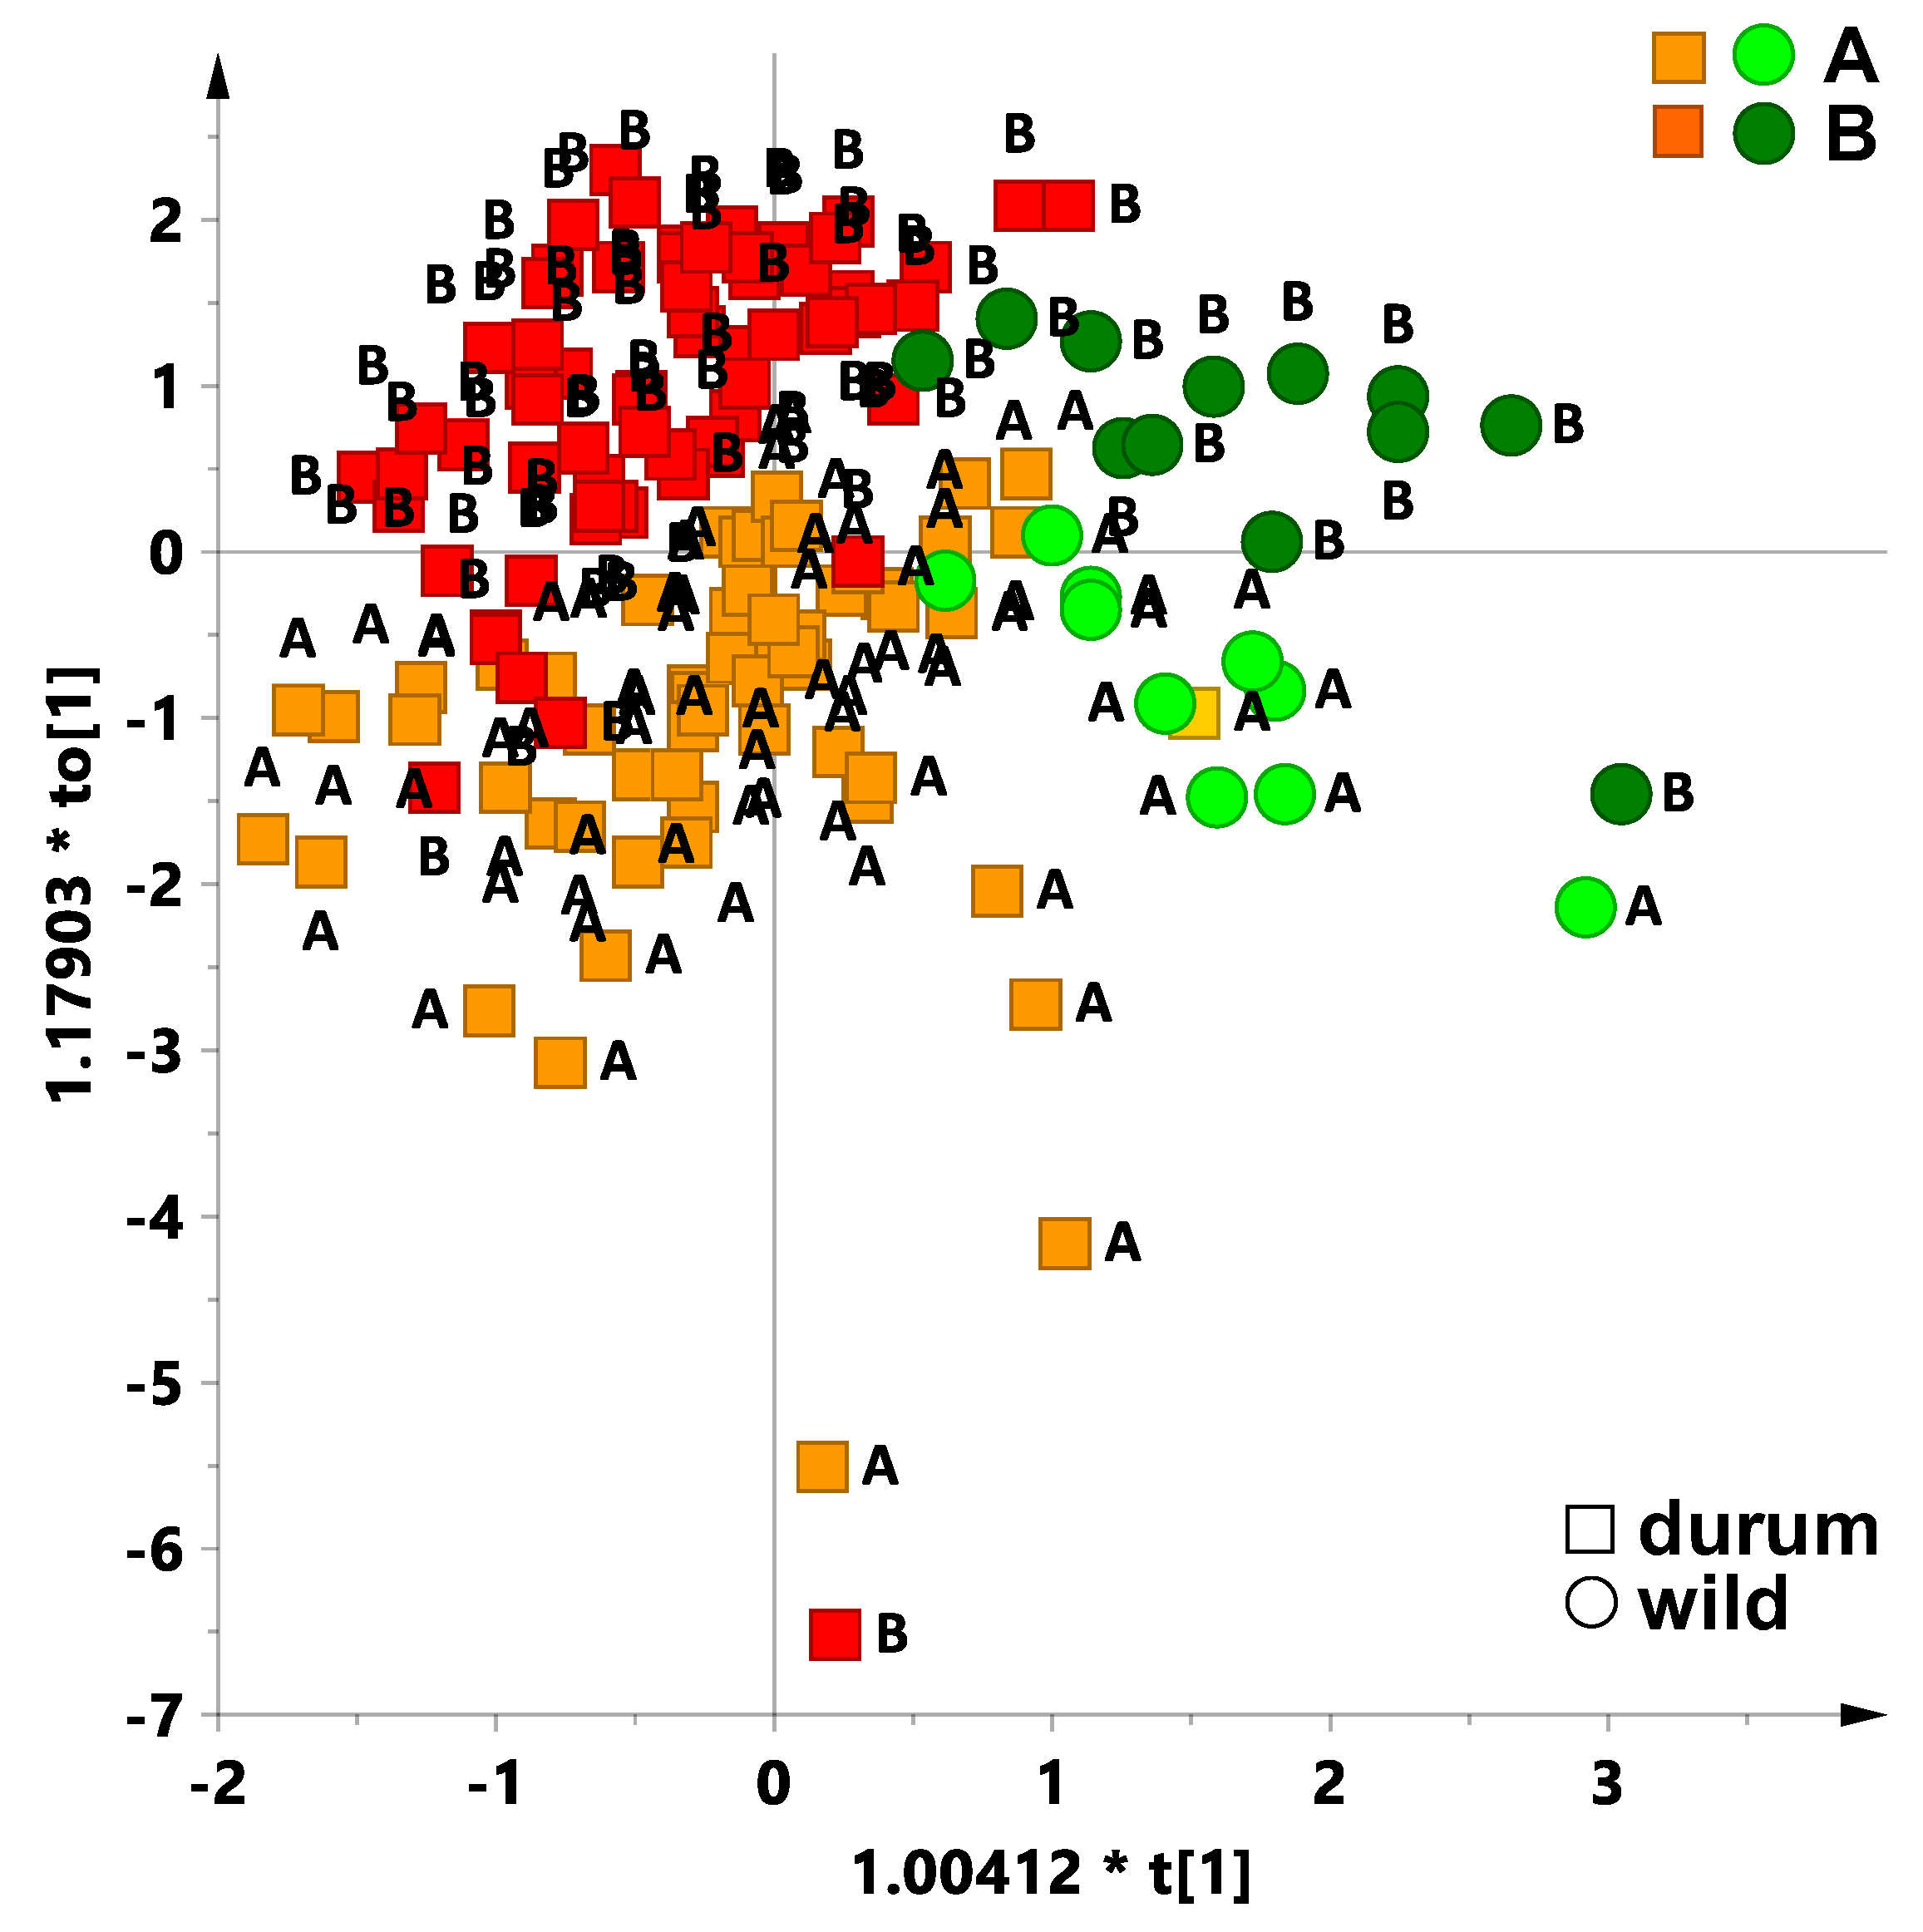
With the aim to assess the different element uptake ability of the studied tetraploid wheat subspecies, an OPLS-DA analysis was performed for the whole data. In the first place, the dataset was analysed by differentiating in the model two different categories, the durum and the wild wheat types. The resulting OPLS-DA model, which was built with one predictive (t[1]) and three orthogonal components (1 + 3 + 0) beside the observed classification parameters for the two categories (R2X = 0.58, Q2 = 0.49) gave an interesting hint for the sample distribution among the two sites (Figure 3). Indeed, this appears to be the natural discrimination (R2Y = 0.53) observed in the first orthogonal component (to[1]). The colour encoded sample distribution among the two sites is clearly observed in Figure 3. The OPLS-DA scoreplot showed that durum wheat genotypes were mainly distributed at negative values of the predictive component t[1], while the intra-class variation resulted in a large distribution of the data along the predictive component to[1] in a wide range of values (from −7 to 3). On the other hand, wild wheat accessions were clustered both at positive values of t[1] and in a range of −2 and +2 of to[1].
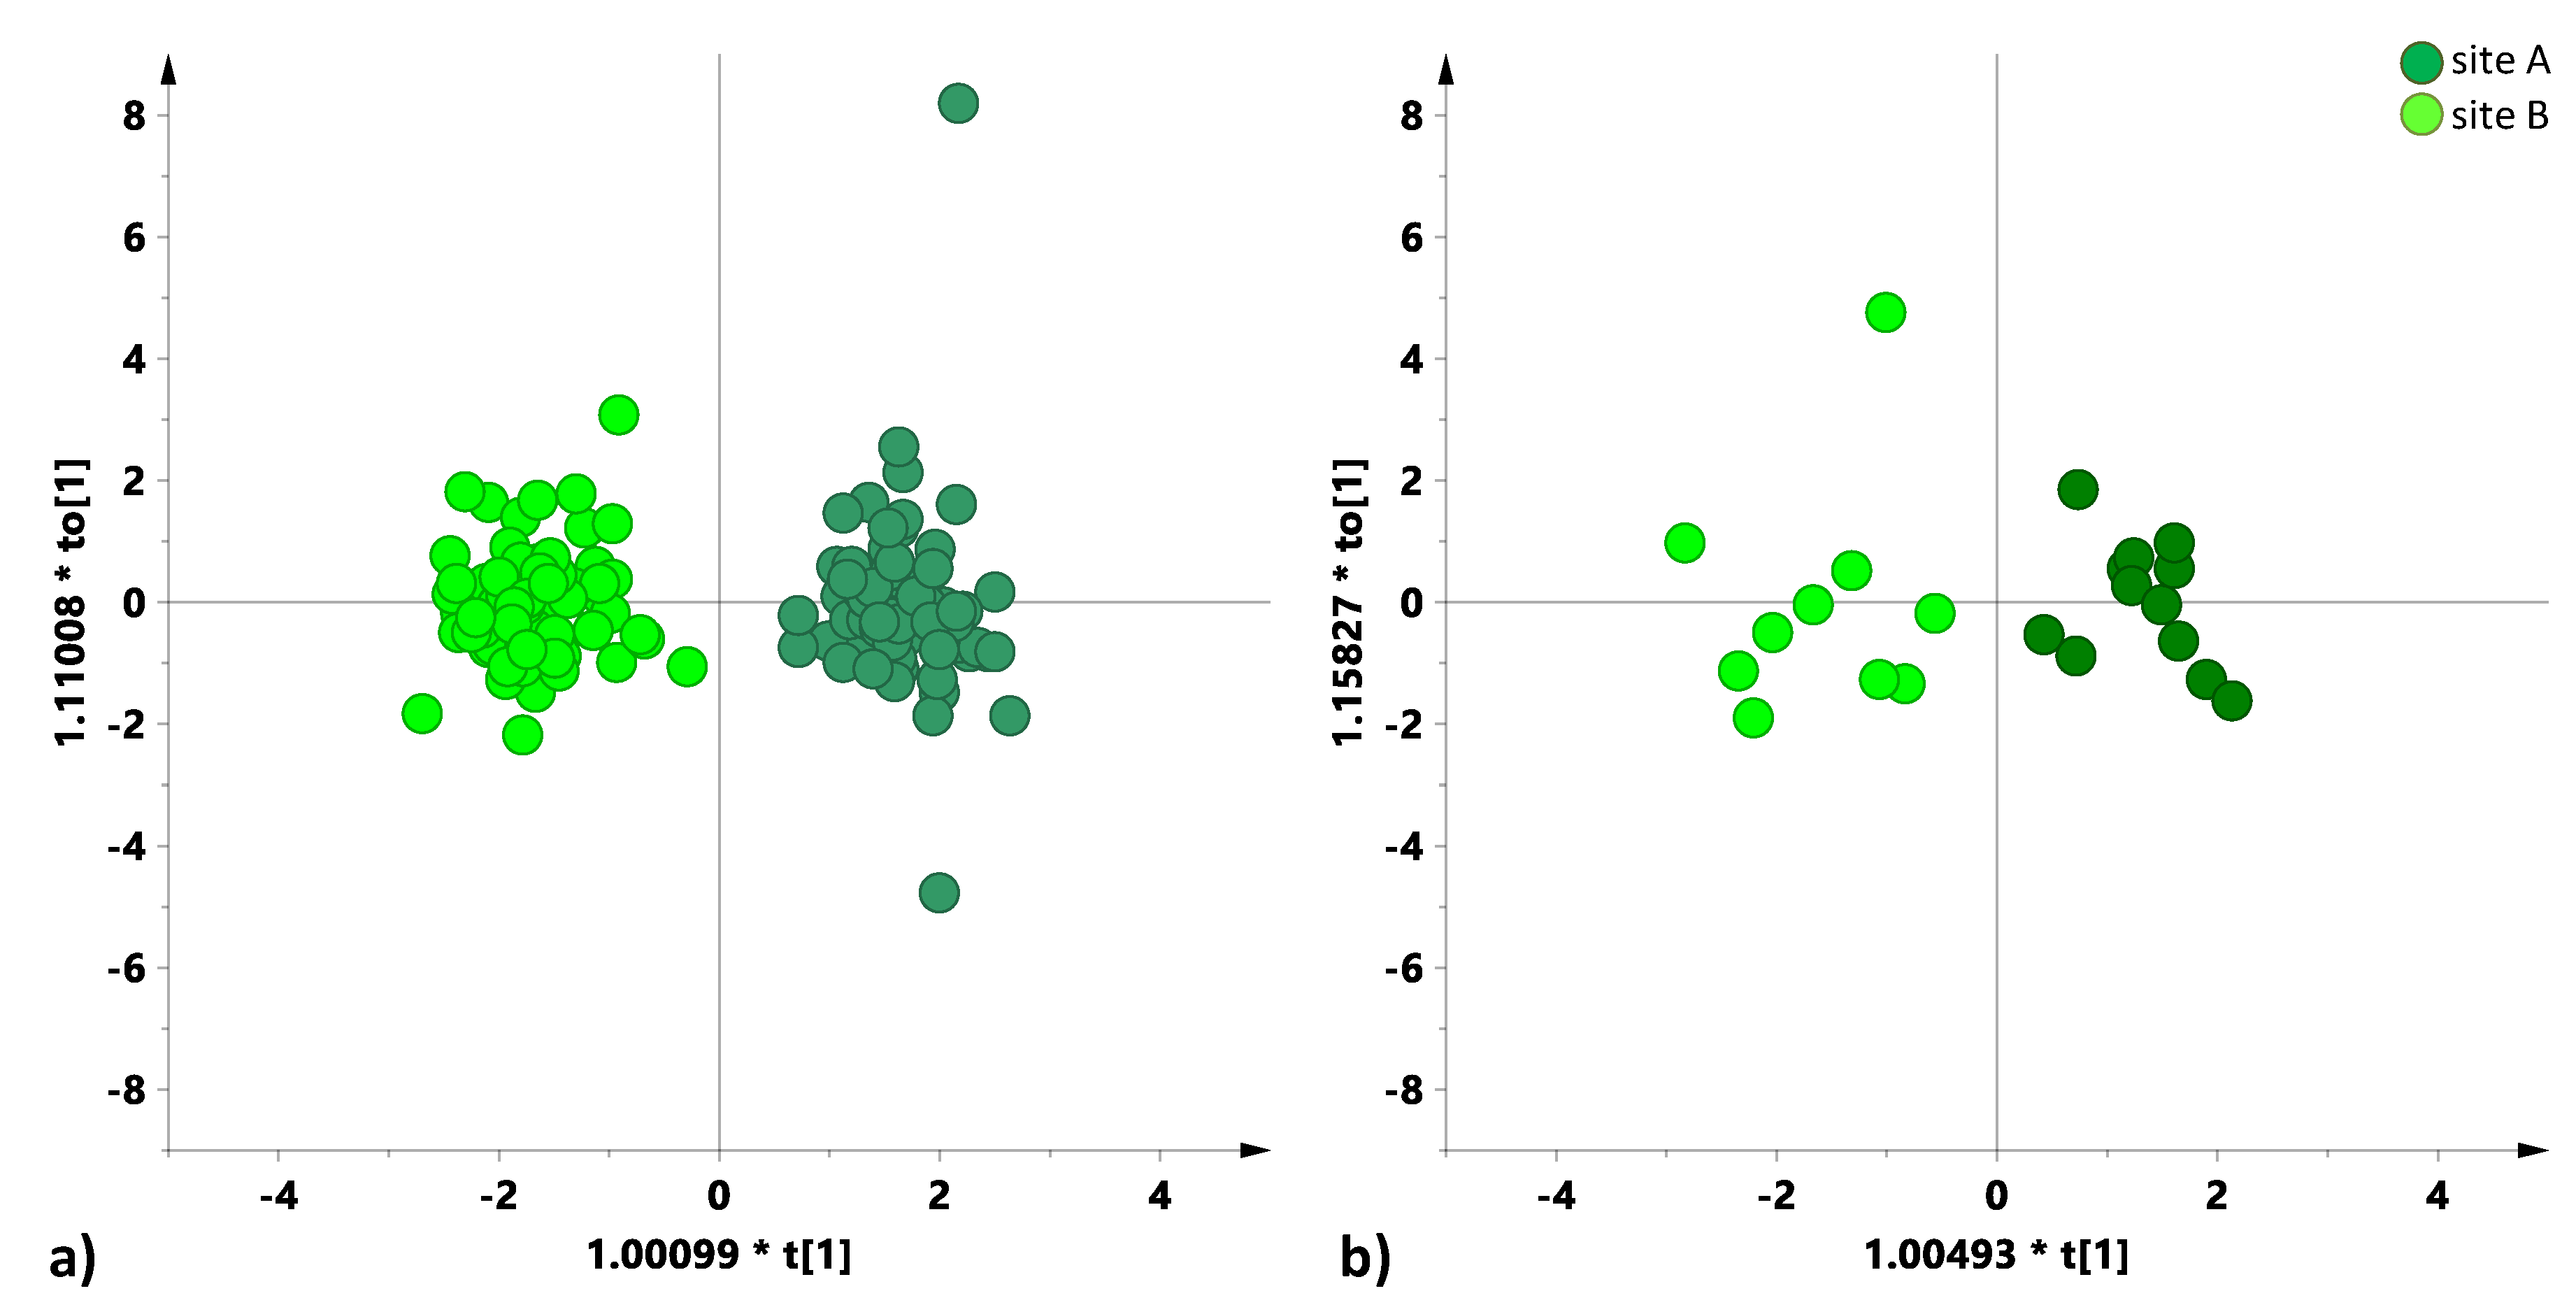
A further MVA was then performed with the aim to differentiate, according to the cultivation site, durum and wild wheat types. For this purpose, two independent PCA and OPLS-DA models were built using the cultivation site as discrimination class. Both for the PCA (data not shown) and OPLS-DA (Figure 4) models, the two wheat groups resulted differently for the two cultivation sites. According to the OPLS-DA models that are depicted in Figure 4, and relative model parameters (in particular Q2 values), the more pronounced separation among the two cultivation sites was observed for durum (Q2 = 0.92) with respect to wild type (Q2 = 0.75) wheat. Moreover, due to a different sample size of durum (126 samples) in comparison with wild (22 samples) statistical models, a further cross check was applied to assess the soundness of the obtained parameters for the OPLS-DA models that are reported in Figure 4. By using the Weka open-source data mining software (v. 3.8.3, University of Waikato New Zealand) [49], a filter was applied to randomly remove a given percentage of samples from the durum sample set. For this purpose, 80% of durum samples were randomly excluded in order to obtain a comparable sample size for durum set (25) with respect to wild (22) samples. Subsequently, a Naïve Bayes classification was applied separately for both the durum and wild sets. The models’ reliability (indicated with “Correctly Classified Instances” Tables S3 and S4), resulted with 87.5% and 71.4% for durum and wild samples, respectively, confirming our hypothesis that wild wheat is the less site sensitive species. This result suggested that a profitable search for the less site sensitive species had to be performed within the considered wild wheat cultivars.
Finally, new OPLS-DA models were then calculated by using the four available data sets (three replicates for each of the two cultivation sites) for the four wild wheat accessions. The cultivation site was chosen as the discriminating class for each of the four OPLS-DA models. The obtained calculated quality model parameters are reported in Table 7, showing the lowest (MG29896) and highest (MG5323) cultivation site differentiation. Among the genotypes of wild wheat tetraploids, MG29896 resulted as the least affected from the cultivation site, having the lowest predictive ability, expressed as Q2 value, followed by MG4330, MG5323.

4. Discussion

Variation in mineral micronutrient concentrations were found in the grains of wheat lines of diverse origin [50], and significant differences between wheat genotypes were found for grain Fe and Zn, however not Se concentration. Spelt, einkorn and emmer wheat appeared to contain higher Se concentration in their grains than bread and durum wheat. Other studies found that the genetic variability available in the modern wheat pool is moderate, and it would be necessary to use other wheat genetic resources in the breeding process [23]. In this respect, Cakmak et al. and Gomez-Becerra et al. [19,22] have shown that the ssp. dicoccoides and ssp. dicoccum could be a good source of high micronutrients concentration [51]. Ficco et al. [52] estimated the magnitude of genotype × environment interaction effects in a collection of Italian durum wheat cultivars that were evaluated for the mineral elements concentration and suggested that the breeding activity for Fe and Zn would be difficult because G × E interaction is prevalent, though multi-location evaluation of germplasm collection might help to identify superior genotypes.
Analysis of the contents of bioactive components in a wheat diversity panel grown in six diverse environments showed that the extent of variation due to variety and the environment differed significantly between components [53]. However, significant correlations were found between bioactive components and environmental factors, with even highly heritable components differing in amount between grain samples grown in different years on different sites [10]. Detailed analyses of bioactive components were carried out under the EU FP6 HEALTHGRAIN program on a wheat collection grown on a single site, and principal component analysis allowed us to classify the wheat genotypes on the basis of the bioactive components and to clearly separate wheat species (bread, durum, spelt, emmer and einkorn wheat) from related cereals (barley, rye and oats) [53]. It is also important to consider the evolutionary differences of wheat with different ploidy levels. Indeed, the comparison of photosynthesis and antioxidant defense systems in wheat with different ploidy levels showed significant differences in diploid, tetraploid and hexaploid wheats, suggesting an important regulatory role in photosystems and antioxidative systems of plants [16]. Several investigations have shown wide variation in phytochemical composition between genotypes, with important effects of environmental factors and genotypes x environment interactions, and indicated that ancient wheats have health benefits compared with the current cultivated wheat. However, recent reviews on the health benefits of ancient and modern wheat have ascertained that most studies were not comparable in terms of genetic materials, growth conditions and processing, and reached the conclusion that further studies are required by different research groups and should consider a wider range of genotypes of ancient and modern wheat species grown together in the same field experiments [11,54].
In the present study, the data obtained by ICP-AES (macro-, micronutrients and toxic trace elements) were analyzed for different single wheat genotypes belonging to the three different T. turgidum wheat subspecies, under different pedoclimatic conditions (two sites, two growing seasons). The significantly higher content of Mg (among the macronutrients) and the highest levels of Mn, Fe and Zn (among the micronutrients) were found for wild accessions with respect to durum wheat cultivars for both the two pedoclimatic conditions (two sites, two growing seasons). Moreover, wild types were also the wheat ones with the lowest level of accumulation of the trace toxic elements, in particular for Cd concentration. It should be noted that, in all the measured wheat samples, cadmium levels never exceeded the EU maximum allowed level of this contaminant in cereals and cereal products intended for human consumption (European Commission Regulation 2006) [55]. On the other hand, we found that among all the elements, the Zn levels that resulted were mainly affected by the cultivation site in all the measured wheat samples. This is mainly due to specific Zn bioaccumulation capacities of the soil [56] and, therefore, resulted in a very different uptake behaviour in the three wheat species, with the highest level in wild wheat species.
The above reported results, obtained by applying both correlation studies and multivariate analysis, also demonstrated that wild tetraploid wheats appeared the less affected from the pedoclimatic conditions which characterized the two cultivation sites (and their intrinsic mineral bioavailability).
Indeed, according to correlation studies, durum wheat appeared as the “most demanding” species (with respect to wild), showing a high number of correlations among elements for both the two cultivation sites. Therefore, for this intrinsic characteristic, durum wheat genotypes could be less prone to adaptation in different agricultural sites. The obtained results were also confirmed by the evidence that was also found by other authors [57,58,59], that both the concentrations of the analyzed elements and the relationships between them are species-specific. As reported in literature [55], antagonistic as well as synergistic interactions of elements are determined by the level of each nutrient, both in the soil and plant species, and sometimes even among cultivars of the same species, suggesting that some elements are translocated in plants in a similar way [37]. As a consequence, the hypothesis that the presence of a high level of correlations among elements (with consequent constraints in their uptake) could result in a wheat genotypes with a higher demanding character for simultaneous micro-nutrients availability could be reasonable. Finally, multivariate analysis (OPLS-DA) was also applied in order to establish the site dependence ranking among the considered durum and wild tetraploid wheats. For this reason, the statistic supervised model was built first using the durum and the wild wheat genotypes, and subsequently the cultivation site as the discriminating category. This approach allowed the focusing on the wild wheat species as the less site sensitive in the site dependence ranking. Despite the small sample size, multivariate analysis (OPLS-DA) was then applied in order to establish the existence of a ranking among all the studied wild cultivars. Consequently, OPLS-DA models using the two cultivation sites as a discriminating category were built for each of the wild wheat accessions and the obtained predictive ability (expressed by Q2 values) that was evaluated. This operating system could be successfully used in order to reveal potential differences between the wild wheat genotypes with respect to their cultivation site-dependence [60]. Among the wild wheat types, the MG29896 accession was the least affected from the cultivation site, having the lowest Q2, followed by MG4330, MG4343, MG5323. The lowest predictability (Q2 value) of the MG29896 OPLS-DA model corresponded to the lowest difference of samples, which were cultivated in two different pedoclimatic conditions (two sites, two growing seasons). Among the genotypes of the present study, wild appeared as the most remarkable for higher content of Mg (among the macronutrients), higher levels of Mn, Fe and Zn (among the micronutrients) and lower level of Cd accumulation. According to correlation studies and MVA analyses, wild wheat also appeared the less demanding for simultaneous micro-nutrients availability and environmental conditions sensitivity. Therefore, the wild tetraploid wheats could be recommended for improvement and biofortification breeding programs in order to satisfy human nutrition requirements, as also reported by other authors [25,26,27,28,37,61]. Although both macro- and micro-nutrient concentration in wheat are very important for increasing the productivity and efficiency of a crop’s yield, it is worth noting that micronutrient balance represents a very crucial point, since micronutrients deficiency in soil is a global phenomenon [62]. Therefore, bioavailability and their correlation should be considered [37]. In general, the present analysis of cultivar differences, and within wheat classes and subclasses, in different environmental conditions gave promising results. The differences are reflected in mineral concentration and absorption capability, and accumulation could also be useful in cross linkage studies. Nevertheless, further and more detailed studies are required, particularly on a wider range of genotypes of ancient and modern wheat species.

Supplementary Materials

Author Contributions

Formal analysis, L.D.C.; Investigation, B.L. and D.M.; Methodology, R.S. and F.P.F.; Resources, F.P.F.; Validation, D.M.; Visualization, L.D.C.; Writing—original draft, L.D.C., B.L. and G.M.; Writing—review & editing, L.D.C. and F.P.F.

Funding

This research received no external funding.

Acknowledgments

This work was supported by PON (PONa3_00334) “Human and Environment Health Research 329 Center (2HE—Research Center). The authors gratefully acknowledge Prof. Antonio Blanco (Department of Soil, Plant & Food Sciences, Genetics and Plant Breeding Section, University Aldo Moro, Bari, Italy) for critical reading of the manuscript.

Conflicts of Interest

The authors declare no conflict of interest.

References

  1. Faostat, F. Statistical Databases; Food and Agriculture Organization of the United Nations: Rome, Italy, 2018. [Google Scholar]
  2. Shewry, P.R.; Hey, S.J. The contribution of wheat to human diet and health. Food Energy Secur. 2015, 4, 178–202. [Google Scholar] [PubMed] [Green Version]
  3. Shewry, P.R.; Hey, S. Do “ancient” wheat species differ from modern bread wheat in their contents of bioactive components? J. Cereal Sci. 2015, 65, 236–243. [Google Scholar] [CrossRef] [Green Version]
  4. Uauy, C.; Distelfeld, A.; Fahima, T.; Blechl, A.; Dubcovsky, J. A NAC gene regulating senescence improves grain protein, zinc, and iron content in wheat. Science 2006, 314, 1298–1301. [Google Scholar] [CrossRef] [PubMed]
  5. Faris, J.D. Wheat domestication: Key to agricultural revolutions past and future. In Genomics of Plant Genetic Resources; Springer: Berlin, Germany, 2014; pp. 439–464. [Google Scholar]
  6. Filipčev, B.; Kojić, J.; Krulj, J.; Bodroža-Solarov, M.; Ilić, N. Betaine in cereal grains and grain-based products. Foods 2018, 7, 49. [Google Scholar] [CrossRef]
  7. Merah, O.; Deleens, E.; Nachit, M.; Monneveux, P. Carbon isotope discrimination, leaf characteristics and grain yield of interspecific wheat lines and their durum parents under Mediterranean conditions. Cereal Res. Commun. 2001, 29, 143–149. [Google Scholar]
  8. Merah, O.; Deleens, E.; Al Hakimi, A.; Monneveux, P. Carbon isotope discrimination and grain yield variations among tetraploid wheat species cultivated under contrasting precipitation regimes. J. Agron. Crop Sci. 2001, 186, 129–134. [Google Scholar] [CrossRef]
  9. Merah, O. Carbon isotope discrimination and mineral composition of three organs in durum wheat genotypes grown under Mediterranean conditions. Comptes Rendus De L’académie Des Sci. 2001, 324, 355–363. [Google Scholar] [CrossRef]
  10. Shewry, P.R.; Hawkesford, M.J.; Piironen, V.; Lampi, A.-M.; Gebruers, K.; Boros, D.; Andersson, A.A.; Åman, P.; Rakszegi, M.; Bedo, Z. Natural variation in grain composition of wheat and related cereals. J. Agric. Food Chem. 2013, 61, 8295–8303. [Google Scholar] [CrossRef] [PubMed]
  11. Shewry, P.R. Do ancient types of wheat have health benefits compared with modern bread wheat? J. Cereal Sci. 2017, 79, 469–476. [Google Scholar] [CrossRef]
  12. Kärkkäinen, O.; Lankinen, M.A.; Vitale, M.; Jokkala, J.; Leppänen, J.; Koistinen, V.; Lehtonen, M.; Giacco, R.; Rosa-Sibakov, N.; Micard, V.; et al. Diets rich in whole grains increase betainized compounds associated with glucose metabolism. Am. J. Clin. Nutr. 2018, 108, 971–979. [Google Scholar] [CrossRef]
  13. Godfrey, D.; Hawkesford, M.J.; Powers, S.J.; Millar, S.; Shewry, P.R. Effects of crop nutrition on wheat grain composition and end use quality. J. Agric. Food Chem. 2010, 58, 3012–3021. [Google Scholar] [CrossRef] [PubMed]
  14. Laddomada, B.; Caretto, S.; Mita, G. Wheat bran phenolic acids: Bioavailability and stability in whole wheat-based foods. Molecules 2015, 20, 15666–15685. [Google Scholar] [CrossRef] [PubMed]
  15. Laddomada, B.; Durante, M.; Minervini, F.; Garbetta, A.; Cardinali, A.; D’Antuono, I.; Caretto, S.; Blanco, A.; Mita, G. Phytochemical composition and anti-inflammatory activity of extracts from the whole-meal flour of Italian durum wheat cultivars. Int. J. Mol. Sci. 2015, 16, 3512–3527. [Google Scholar] [CrossRef] [PubMed]
  16. Brestic, M.; Zivcak, M.; Hauptvogel, P.; Misheva, S.; Kocheva, K.; Yang, X.; Li, X.; Allakhverdiev, S.I. Wheat plant selection for high yields entailed improvement of leaf anatomical and biochemical traits including tolerance to non-optimal temperature conditions. Photosynth. Res. 2018, 136, 245–255. [Google Scholar] [CrossRef] [PubMed]
  17. Mao, H.; Chen, M.; Su, Y.; Wu, N.; Yuan, M.; Yuan, S.; Brestic, M.; Zivcak, M.; Zhang, H.; Chen, Y. Comparison on Photosynthesis and Antioxidant Defense Systems in Wheat with Different Ploidy Levels and Octoploid Triticale. Int. J. Mol. Sci. 2018, 19, 3006. [Google Scholar] [CrossRef] [PubMed]
  18. Laddomada, B.; Durante, M.; Mangini, G.; D’Amico, L.; Lenucci, M.S.; Simeone, R.; Piarulli, L.; Mita, G.; Blanco, A. Genetic variation for phenolic acids concentration and composition in a tetraploid wheat (Triticum turgidum L.) collection. Genet. Resour. Crop Evol. 2017, 64, 587–597. [Google Scholar] [CrossRef]
  19. Gomez-Becerra, H.F.; Yazici, A.; Ozturk, L.; Budak, H.; Peleg, Z.; Morgounov, A.; Fahima, T.; Saranga, Y.; Cakmak, I. Genetic variation and environmental stability of grain mineral nutrient concentrations in Triticum dicoccoides under five environments. Euphytica 2010, 171, 39–52. [Google Scholar] [CrossRef]
  20. Velu, G.; Singh, R.; Arun, B.; Mishra, V.; Tiwari, C.; Joshi, A.; Virk, P.; Cherian, B.; Pfeiffer, W. Reaching out to farmers with high Zinc wheat varieties through public-private partnerships–An Experience from Eastern-Gangetic Plains of India. Adv. Food Technol. Nutr. Sci 2015, 1, 73–75. [Google Scholar] [CrossRef]
  21. Guzmán, C.; Medina-Larqué, A.S.; Velu, G.; González-Santoyo, H.; Singh, R.P.; Huerta-Espino, J.; Ortiz-Monasterio, I.; Peña, R.J. Use of wheat genetic resources to develop biofortified wheat with enhanced grain zinc and iron concentrations and desirable processing quality. J. Cereal Sci. 2014, 60, 617–622. [Google Scholar] [CrossRef]
  22. Cakmak, I.; Pfeiffer, W.H.; McClafferty, B. Biofortification of durum wheat with zinc and iron. Cereal Chem. 2010, 87, 10–20. [Google Scholar] [CrossRef]
  23. Magallanes-López, A.M.; Hernandez-Espinosa, N.; Velu, G.; Posadas-Romano, G.; Ordoñez-Villegas, V.M.G.; Crossa, J.; Ammar, K.; Guzmán, C. Variability in iron, zinc and phytic acid content in a worldwide collection of commercial durum wheat cultivars and the effect of reduced irrigation on these traits. Food Chem. 2017, 237, 499–505. [Google Scholar] [CrossRef] [PubMed]
  24. Yan, J.; Xue, W.-T.; Yang, R.-Z.; Qin, H.-B.; Zhao, G.; Tzion, F.; Cheng, J.-P. Quantitative Trait Loci Conferring Grain Selenium Nutrient in Durum Wheat× Wild Emmer Wheat RIL Population. Czech J. Genet. Plant Breed. 2018, 54, 52–58. [Google Scholar] [CrossRef]
  25. Awan, S.; Ahmad, S.; Ali, M.; Ahmed, M.; Rao, A. Use of multivariate analysis in determining characteristics for grain yield selection in wheat. Sarhad J. Agric. 2015, 31, 139–150. [Google Scholar] [CrossRef]
  26. Shewry, P.R.; Pellny, T.K.; Lovegrove, A. Is modern wheat bad for health. Nat. Plants 2016, 2, 16097. [Google Scholar] [CrossRef] [PubMed]
  27. Arzani, A.; Ashraf, M. Cultivated Ancient Wheats (Triticum spp.): A Potential Source of Health-Beneficial Food Products. Compr. Rev. Food Sci. Food Saf. 2017, 16, 477–488. [Google Scholar] [CrossRef]
  28. Murphy, K.M.; Reeves, P.G.; Jones, S.S. Relationship between yield and mineral nutrient concentrations in historical and modern spring wheat cultivars. Euphytica 2008, 163, 381–390. [Google Scholar] [CrossRef]
  29. Kaur, K.D.; Jha, A.; Sabikhi, L.; Singh, A. Significance of coarse cereals in health and nutrition: A review. J. Food Sci. Technol. 2014, 51, 1429–1441. [Google Scholar] [CrossRef]
  30. Srinivasa, J.; Arun, B.; Mishra, V.K.; Singh, G.P.; Velu, G.; Babu, R.; Vasistha, N.K.; Joshi, A.K. Zinc and iron concentration QTL mapped in a Triticum spelta × T. aestivum cross. Theor. Appl. Genet. 2014, 127, 1643–1651. [Google Scholar] [CrossRef]
  31. Pasqualone, A.; Piarulli, L.; Mangini, G.; Gadaleta, A.; Blanco, A.; Simeone, R. Quality characteristics of parental lines of wheat mapping populations. Agric. Food Sci. 2015, 24, 118–127. [Google Scholar] [CrossRef]
  32. Mzid, N.; Todorovic, M.; Albrizio, R.; Cantore, V. Remote Sensing Based Monitoring of Durum Wheat under Water Stress Treatments; Spatial Analysis and GEOmatics: Rouen, France, 2017. [Google Scholar]
  33. Scortichini, M.; Jianchi, C.; De Caroli, M.; Dalessandro, G.; Pucci, N.; Modesti, V.; L’Aurora, A.; Petriccione, M.; Zampella, L.; Mastrobuoni, F.; et al. A zinc, copper and citric acid biocomplex shows promise for control of Xylella fastidiosa subsp. pauca in olive trees in Apulia region (southern Italy). Phytopathol. Mediterr. 2018, 57, 48–72. [Google Scholar]
  34. R Development Core Team. R: A Language and Environment for Statistical Computing; R Foundation for Statistical Computing: Vienna, Austria, 2013. [Google Scholar]
  35. Xia, J.; Psychogios, N.; Young, N.; Wishart, D.S. MetaboAnalyst: A web server for metabolomic data analysis and interpretation. Nucleic Acids Res. 2009, 37, W652–W660. [Google Scholar] [CrossRef]
  36. Xia, J.; Wishart, D.S. Using MetaboAnalyst 3.0 for comprehensive metabolomics data analysis. Curr. Protoc. Bioinform. 2016, 55. [Google Scholar] [CrossRef] [PubMed]
  37. Pandey, A.; Khan, M.K.; Hakki, E.E.; Thomas, G.; Hamurcu, M.; Gezgin, S.; Gizlenci, O.; Akkaya, M.S. Assessment of genetic variability for grain nutrients from diverse regions: Potential for wheat improvement. SpringerPlus 2016, 5, 1912. [Google Scholar] [CrossRef] [PubMed]
  38. Hauke, J.; Kossowski, T. Comparison of values of Pearson’s and Spearman’s correlation coefficients on the same sets of data. Quaest. Geogr. 2011, 30, 87–93. [Google Scholar] [CrossRef]
  39. Bro, R.; Smilde, A.K. Principal component analysis. Anal. Methods 2014, 6, 2812–2831. [Google Scholar] [CrossRef] [Green Version]
  40. Trygg, J.; Wold, S. Orthogonal projections to latent structures (O-PLS). J. Chemom. 2002, 16, 119–128. [Google Scholar] [CrossRef]
  41. Triba, M.N.; Le Moyec, L.; Amathieu, R.; Goossens, C.; Bouchemal, N.; Nahon, P.; Rutledge, D.N.; Savarin, P. PLS/OPLS models in metabolomics: The impact of permutation of dataset rows on the K-fold cross-validation quality parameters. Mol. Biosyst. 2015, 11, 13–19. [Google Scholar] [CrossRef] [PubMed]
  42. Aru, V.; Pisano, M.B.; Savorani, F.; Engelsen, S.B.; Cosentino, S.; Marincola, F.C. Data on the changes of the mussels׳ metabolic profile under different cold storage conditions. Data Brief 2016, 7, 951–957. [Google Scholar] [CrossRef] [PubMed] [Green Version]
  43. Wheelock, Å.M.; Wheelock, C.E. Trials and tribulations of ‘omics data analysis: Assessing quality of SIMCA-based multivariate models using examples from pulmonary medicine. Mol. Biosyst. 2013, 9, 2589–2596. [Google Scholar] [CrossRef] [PubMed]
  44. Pettigrew, W.T. Potassium influences on yield and quality production for maize, wheat, soybean and cotton. Physiol. Plant. 2008, 133, 670–681. [Google Scholar] [CrossRef]
  45. Tejera, R.L.; Luis, G.; González-Weller, D.; Caballero, J.M.; Gutiérrez, Á.J.; Rubio, C.; Hardisson, A. Metals in wheat flour; comparative study and safety control. Nutr. Hosp. 2013, 28, 506–513. [Google Scholar] [PubMed]
  46. Garnett, T.P.; Graham, R.D. Distribution and remobilization of iron and copper in wheat. Ann. Bot. 2005, 95, 817–826. [Google Scholar] [CrossRef] [PubMed]
  47. Peleg, Z.; Cakmak, I.; Ozturk, L.; Yazici, A.; Jun, Y.; Budak, H.; Korol, A.B.; Fahima, T.; Saranga, Y. Quantitative trait loci conferring grain mineral nutrient concentrations in durum wheat× wild emmer wheat RIL population. Theor. Appl. Genet. 2009, 119, 353–369. [Google Scholar] [CrossRef] [PubMed]
  48. Hakki, E.E.; Dograr, N.; Pandey, A.; Khan, M.K.; Hamurcu, M.; Kayis, S.A.; Gezgin, S.; ÖLMEZ, F.; Akkaya, M.S. Molecular and elemental characterization of selected Turkish durum wheat varieties. Not. Bot. Horti Agrobot. Cluj-Napoca 2014, 42, 431–439. [Google Scholar] [CrossRef]
  49. Witten, I.H.; Frank, E.; Hall, M.A.; Pal, C.J. Data Mining: Practical Machine Learning Tools and Techniques; Morgan Kaufmann: San Francisco, CA, USA, 2016. [Google Scholar]
  50. Zhao, F.; Su, Y.; Dunham, S.; Rakszegi, M.; Bedo, Z.; McGrath, S.; Shewry, P. Variation in mineral micronutrient concentrations in grain of wheat lines of diverse origin. J. Cereal Sci. 2009, 49, 290–295. [Google Scholar] [CrossRef]
  51. Monasterio, I.; Graham, R.D. Breeding for trace minerals in wheat. Food Nutr. Bull. 2000, 21, 392–396. [Google Scholar] [CrossRef]
  52. Ficco, D.; Riefolo, C.; Nicastro, G.; De Simone, V.; Di Gesu, A.; Beleggia, R.; Platani, C.; Cattivelli, L.; De Vita, P. Phytate and mineral elements concentration in a collection of Italian durum wheat cultivars. Field Crop. Res. 2009, 111, 235–242. [Google Scholar] [CrossRef]
  53. Shewry, P.R.; Piironen, V.; Lampi, A.-M.; Edelmann, M.; Kariluoto, S.; Nurmi, T.; Fernandez-Orozco, R.; Andersson, A.A.; Åman, P.; Fras, A. Effects of genotype and environment on the content and composition of phytochemicals and dietary fiber components in rye in the HEALTHGRAIN diversity screen. J. Agric. Food Chem. 2010, 58, 9372–9383. [Google Scholar] [CrossRef]
  54. Dinu, M.; Whittaker, A.; Pagliai, G.; Benedettelli, S.; Sofi, F. Ancient wheat species and human health: Biochemical and clinical implications. J. Nutr. Biochem. 2018, 52, 1–9. [Google Scholar] [CrossRef]
  55. Fageria, V. Nutrient interactions in crop plants. J. Plant Nutr. 2001, 24, 1269–1290. [Google Scholar] [CrossRef]
  56. He, Z.L.; Yang, X.E.; Stoffella, P.J. Trace elements in agroecosystems and impacts on the environment. J. Trace Elem. Med. Biol. 2005, 19, 125–140. [Google Scholar] [CrossRef] [PubMed]
  57. Suchowilska, E.; Wiwart, M.; Kandler, W.; Krska, R. A comparison of macro-and microelement concentrations in the whole grain of four Triticum species. Plant Soil Environ. 2012, 58, 141–147. [Google Scholar] [CrossRef]
  58. Moreira-Ascarrunz, S.D.; Larsson, H.; Prieto-Linde, M.L.; Johansson, E. Mineral nutritional yield and nutrient density of locally adapted wheat genotypes under organic production. Foods 2016, 5, 89. [Google Scholar] [CrossRef] [PubMed]
  59. Matthews, S.B.; Santra, M.; Mensack, M.M.; Wolfe, P.; Byrne, P.F.; Thompson, H.J. Metabolite profiling of a diverse collection of wheat lines using ultraperformance liquid chromatography coupled with time-of-flight mass spectrometry. PLoS ONE 2012, 7, e44179. [Google Scholar] [CrossRef] [PubMed]
  60. Righetti, L.; Rubert, J.; Galaverna, G.; Folloni, S.; Ranieri, R.; Stranska-Zachariasova, M.; Hajslova, J.; Dall’Asta, C. Characterization and discrimination of ancient grains: A metabolomics approach. Int. J. Mol. Sci. 2016, 17, 1217. [Google Scholar] [CrossRef] [PubMed]
  61. Garcia-Oliveira, A.L.; Chander, S.; Ortiz, R.; Menkir, A.; Gedil, M. Genetic basis and breeding perspectives of grain iron and zinc enrichment in cereals. Front. Plant Sci. 2018, 9, 937. [Google Scholar] [CrossRef] [PubMed]
  62. Dimkpa, C.O.; Bindraban, P.S. Fortification of micronutrients for efficient agronomic production: A review. Agron. Sustain. Dev. 2016, 36, 7. [Google Scholar] [CrossRef]
Figure 1. Average and standard deviation content of (a) macro- (Ca, K, Mg) and (b) higher micro- (Fe, Zn, Mn) elements, calculated for the samples of two types of wheat (expressed as part per million, ppm) and for each site (A, Valenzano, Bari and B, Policoro, Matera).
Sustainability 11 00736 g001
Figure 2. OPLS-DA scoreplots for each site (A, left, B, right). For OPLS-DA model of site A: 1 + 2 + 0, R2X = 0.48, R2Y = 0.59, Q2 = 0.43, p[CV-ANOVA] = 2.40612 × 10⁻⁶; for OPLS-DA model of site B: 1 + 2 + 0, R2X = 0.56, R2Y = 0.83, Q2 = 0.78, p[CV-ANOVA] = 2.10965 × 10⁻¹⁹.
Sustainability 11 00736 g002
Figure 3. OPLS-DA scoreplot for the whole data considering the two sites (A and B) as discriminating class (1 + 3 + 0, R2X = 0.58, R2Y = 0.53, Q2 = 0.49, p[CV-ANOVA] = 3.9421 × 10⁻¹⁷).
Sustainability 11 00736 g003
Figure 4. OPLS-DA scoreplots for each of the types of wheat (durum, wild) when they were considered separately in order to evaluate the effect of the site on the wheat species ((a). OPLS-DA model for durum wheat: 1 + 1 + 0, R2X = 0.453, R2Y = 0.933, Q2 = 0.921, p[CV-ANOVA] = 0; (b). OPLS-DA model for wild wheat: 1 + 1 + 0, R2X = 0.47, R2Y = 0.85, Q2 = 0.75, p[CV-ANOVA] = 6.05943 × 10⁻⁵).
Sustainability 11 00736 g004
Table 1. Taxonomic classification of the wheat genotypes considered in the study.
GenotypeTaxonomic Classification
MG5323T. turgidum L. subsp. dicoccum
MG4343T. turgidum L. subsp. dicoccoides
MG4330T. turgidum L. subsp. dicoccoides
MG29896T. turgidum L. subsp. dicoccoides
Anco Marzio, Aureo, AC Avonlea, Ciccio, Duilio, Fiore, Grecale, Iride, Isildur, Latino, Latinur, Liberdur, Messapia, Neolatino, Normanno, Preco, Primadur, Saragolla, Svevo, Tiziana, UC1113T. turgidum L. subsp. durum
Table 2. Average and standard deviation (SD) levels of macro-, micro- and toxic trace elements, calculated for the samples of three subspecies of tetraploid wheats (expressed as part per million, ppm) and for each site (A, Valenzano, Bari and B, Policoro, Matera). Tukey HSD test was applied for multiple comparisons of groups (wheat type). Letters (a, b) indicate significant differences for Tukey HSD test at least for 5% statistical probability (a significant difference between durum and wild in site A; b significant difference between durum and wild in site B). One-way ANOVA was applied to compare the means between the two cultivation sites (significant codes: *** p-value < 0.001; ** p-value < 0.01; * p-value < 0.05).
Type of WheatDurumWild
Macroelements
CaA731.11 ± 295.70 *728.73 ± 181.26
B833.08 ± 240.16 *836.73 ± 232.90
KA3458.34 ± 329.72 ***3362.44 ± 195.09 *
B4357.19 ± 618.72 ***,a3864.32 ± 561.39 *,a
MgA1510.34 ± 176.55 ***,a1665.97 ± 147.10 a
B1398.73 ± 184.45 ***,b1651.89 ± 203.23 b
Microelements
CrA0.05 ± 0.060.06 ± 0.05
B0.03 ± 0.020.04 ± 0.02
CuA4.12 ± 0.57 ***,a5.32 ± 2.11 a
B5.77 ± 0.80 ***5.29 ± 0.63
FeA33.31 ± 6.87 a38.51 ± 3.77 a
B31.96 ± 12.7541.32 ± 13.79
MnA35.11 ± 3.13 ***,a42.85 ± 6.57 **,a
B26.93 ± 3.89 ***,b32.66 ± 5.24 **,b
ZnA14.03 ± 1.75 ***,a16.35 ± 2.34 ***,a
B30.59 ± 3.69 ***,b32.86 ± 7.50 ***,b
Toxic trace elements
CdA0.10 ± 0.04 ***0.08 ± 0.03 ***
B0.07 ± 0.04 ***,a0.035 ± 0.01 ***,a
PbA0.09 ± 0.04 **0.08 ± 0.03
B0.07 ± 0.02 **,b0.10 ± 0.05 b
Table 3. Pearson correlation matrix among all the variables of durum wheat genotypes grown in the A site (Valenzano, Bari). *, **, *** indicate significance at p < 0.05, p < 0.01 and p < 0.001, respectively.
CaKCuZnCrFePbCdMg
K0.06
Cu0.030.23
Zn−0.030.000.50 ***
Cr0.030.070.28 *0.09
Fe−0.050.080.28 *0.170.35 **
Pb0.110.05−0.010.100.180.08
Cd−0.200.210.090.17−0.080.220.03
Mg0.060.29 *0.39 **0.45 ***0.25 *0.220.13−0.02
Mn−0.04−0.170.36 **0.36 **0.200.27 *0.070.30 *0.29 *
Table 4. Pearson correlation matrix among all the variables of wild wheat genotypes grown in the A site (Valenzano, Bari). *, **, *** indicate significance at p < 0.05, p < 0.01 and p < 0.001, respectively.
CaKCuZnCrFePbCdMg
K0.14
Cu−0.49−0.42
Zn0.46−0.16−0.41
Cr−0.49−0.460.93 ***−0.20
Fe−0.08−0.410.610.190.80 **
Pb0.39−0.25−0.180.290.040.33
Cd0.44−0.490.400.210.390.620.09
Mg0.66 **0.34−0.450.10−0.66 **−0.51−0.380.26
Mn0.26−0.360.510.160.620.87 ***0.330.80 **−0.18
Table 5. Pearson correlation matrix among all the variables of durum wheat genotypes grown in the B site (Policoro, Matera). *, **, *** indicate significance at p < 0.05, p < 0.01 and p < 0.001, respectively.
CaKCuZnCrFePbCdMg
K0.03
Cu0.030.55 ***
Zn−0.010.720.60
Cr−0.17−0.17−0.27 *−0.21
Fe−0.140.04−0.06−0.080.82 ***
Pb0.03−0.06−0.130.000.06−0.02
Cd0.32 **0.26 *0.29 *0.28 *0.000.05−0.10
Mg0.080.86 ***0.46 ***0.65−0.24−0.05−0.030.29 *
Mn0.120.46 ***0.45 ***0.54−0.20−0.05−0.170.21 *0.24 *
Table 6. Pearson correlation matrix among all the variables of wild wheat genotypes grown in the B site (Policoro, Matera). *, **, *** indicate significance at p < 0.05, p < 0.01 and p < 0.001, respectively.
CaKCuZnCrFePbCdMg
K0.48
Cu0.010.10
Zn0.62 *0.78 **0.15
Cr0.090.73 **0.490.67 *
Fe0.080.74 **0.60 *0.65 *0.97 ***
Pb−0.16−0.390.19−0.11−0.08−0.09
Cd0.74 **0.350.200.560.260.19−0.01
Mg0.200.44−0.080.70 *0.540.460.090.12
Mn0.430.370.460.160.320.35−0.330.50−0.40
Table 7. R2X, R2Y and Q2 parameters reported for every OPLS-DA model performed on the single wild tetraploid wheat genotypes (three replicates for each of the two cultivation sites).
GenotypeModelR2XR2YQ2
MG53231 + 1 + 00.660.990.94
MG43431 + 1 + 00.820.980.93
MG43301 + 1 + 00.810.950.85
MG298961 + 1 + 00.740.990.82

