Examining Travelers’ Acceptance towards Car Sharing Systems—Peshawar City, Pakistan


School of Transportation and Logistics, Dalian University of Technology, Dalian 116024, China
*
Author to whom correspondence should be addressed.
Sustainability 2019, 11(3), 808; https://0-doi-org.brum.beds.ac.uk/10.3390/su11030808
Submission received: 7 January 2019
/
Revised: 17 January 2019
/
Accepted: 21 January 2019
/
Published: 4 February 2019
(This article belongs to the Special Issue Smart Mobility for Future Cities)
Abstract
:In recent years, car sharing has emerged as a novel alternative to private car ownership in urban areas worldwide. Potential benefits of this system include improved mobility and reduced congestion, vehicle ownership, parking issues, and greenhouse gas (GHG) emissions. This study aimed to investigate travelers’ acceptance of car sharing systems through a stated preference survey in the city of Peshawar, Pakistan. The questionnaires were distributed online via a Google form. Questions were designed from numerous aspects of car sharing systems, such as awareness of car sharing systems, attributes related to travel modes in the choice set, and demographic characteristics. A total of 453 valid responses were received. The Multinomial and Nested Logit models were employed for evaluation and analysis of survey responses. Demographic characteristics including gender, job, and income were found to be significant. Service attributes including travel time, travel cost, registration fees, and capital cost, were also significant. The multinomial logit model based on both car-owners and non-car-owners fit a little better than the nested logit model. Our findings in the present study could be beneficial for transport planners and policy makers to timely implement car sharing systems in cities in order to mitigate increased car ownership and traffic congestion.
1. Introduction
Urban transportation has become a major concern with the rapid urbanization across major metropolitan areas in Pakistan [1]. These cities are becoming more densely populated and congested than ever before. The pace of expanding existing road infrastructures is too slow to cope with the increasing transportation demands [2]. With inadequate and poor public transportation services, more people prefer to travel by private vehicles. Thus, auto-ownership has been on the rise, posing a serious threat to transport policy makers, planners, and other concerned authorities. Rapid motorization has several negative impacts, including longer delays/travel time, increased travel cost, severe congestions, greater safety concerns, more polluted atmosphere, increased fuel consumption, and overall reduced transport system efficiency. This, in turn, has resulted in millions of dollars of loss to the country’s economy. An active and efficient transportation system is considered to significantly contribute to a country’s economy [1].
Peshawar is the 6th largest city in Pakistan. The city faces serious traffic congestion issues and environmental pollution. Estimates predict a more intense situation in the near future due to the lack of planned development. The great number of private vehicles is considered to be one of the main causes of congestion and pollution [3]. At times, average peak hour travel speeds have been observed to be as low as 10 km/h in the city [4]. Peshawar city is one of the most polluted and congested cities of Pakistan [5]. Slow vehicular movement has become a daily issue in Peshawar city, where private car numbers have increased by ~229% over the past decade. During peak hours, one cannot exit the city in less than an hour [3,6]. The motorization growth in Peshawar is shown in Table 1.
Introduction of car sharing systems in Peshawar city could be one potential solution to alleviating the issues of increased car ownership, congestion, and environmental pollution. The successful operation of such a system depends on sufficient demand, which remains a question in Pakistan. The term “car sharing” is defined as an environment-friendly alternative to car ownership. In concept, car sharing is a kind of car rental model where people usually rent a car for a short period of time. To access and drive a shared vehicle, users are required to become a member of the car sharing organization and reserve the cars over the Internet. Car sharing first appeared in Europe in the 1940s before spreading to Australia, North America, and Asia [7], which was introduced in the mid-1990s in Canada [8], and has spread to more than 20 major urban regions in the U.S. and Canada. In July 2009, car sharing, as an industry, had more than 378,000 memberships serviced by 9818 vehicles around North America [9]. Recent growth in car sharing vehicles and membership in North America is shown in Figure 1. In North America, car sharing systems often charge a 300–500 US dollars monthly fee or deposit which is refundable. The usage fee is calculated based on duration and miles, with the average rate being 1.00–2.00$ per hour, and 0.25–0.40$ per mile, respectively. These fares include fuel, insurance, and other related operating costs [10]. Car sharing systems attract travelers who are usually public transport users and sometimes car users, and thus have great potential to reduce traffic congestion and vehicle ownership, resulting in lesser requirement for personal and street parking [11,12,13,14]. In 2010, 26 countries introduced the car sharing system as a new transportation mode to reduce transportation expenses and to reduce its adverse environmental impacts, such as congestion, energy consumption, and vehicle emissions [15,16]. Previous studies suggest that car sharing can potentially reduce the yearly household Greenhouse Gas (GHG) emissions from 0.84 metric tons to 0.58 metric tons [17,18]. In US and Canada, car sharing replaced between 9–13 vehicles off the road, and 25–71% of car sharing members avoided an auto purchase [9,19]. Car sharing systems have been successfully implemented in Canada, where 15–29% of Canadians sold their personal vehicles to join car sharing systems, while in the U.S., 11–26% of the car-sharing community got rid of their personal vehicles after joining the new transport system [7,9]. One of the major benefits of becoming a member of a car sharing system is to save money by avoiding capital, maintenance, and parking costs. This allows people to use “car sharing” at a lower cost than using their own car [20,21,22].
Considering the social aspect, car sharing contributes to more efficient and rational mobility, especially for people who do not own a vehicle [7,9,10,23,24]. Car sharing encourages increased use of green travel modes, such as biking, walking, and public transport, which not only decrease traffic congestion and parking demand, but also improve general public health in urban areas [17]. Electric car sharing can provide economic and environmental benefits by reducing environmental pollution [25,26,27,28,29,30]. A stated preference experiment regarding one-way and round-trip car sharing systems was conducted in Beijing to examine which factors influence the use of car sharing systems [31]. The results showed that people who are non-car-owners preferred using car sharing for round-trips. In Hangzhou, the Chefenxiang car sharing organization which offers round-trip services, has 79 parking locations throughout the city [32]. Shaheen and Martin conducted survey to investigate citizens’ attitudes towards car sharing systems [33], and the results indicate that younger and well-educated people are more likely to use car sharing systems. At present, car sharing is in operation in many major cities around the world, bringing several social and environmental benefits [12]. Globally, car sharing has continued to expand over the last decade, with average annual growth rates of members and vehicles at approximately 35% and 30%, respectively (Figure 2).
2. Data and Methods
2.1. Survey Design
Car sharing has not been introduced in Pakistan yet. Thus to collect data about the awareness and willingness-to-use, the stated preference (SP) survey for this unavailable travel alternative was adopted for the present study. The SP approach has been used by numerous previous studies for collecting data regarding travelers’ behavior and acceptance of new transport modes [8,21,36,37,38,39,40,41,42,43]. The SP survey was conducted in four distinct sections. In the first section, travelers were briefly introduced to car sharing systems. Detailed brochures, including several aspects of car sharing were sent to the respondents (Figure 3). In the survey’s second section, travelers’ awareness and perception regarding car sharing systems were recorded. Questions asked during this section were evaluated on the five-point Likert skill (almost certainly, probably, probably not, almost certainly not, and unknown). In the survey’s third section, travelers were asked to state their mode preferences from available alternatives including car sharing systems, private cars, taxies, and buses, in different choice scenarios. Choice experiments were generated through Taguchi design principle using Minitab. A total of 24 choice experiments were generated, which were divided into three different groups. Figure 4 presents one of the choice experiments from the questionnaire. Service attributes for all alternatives considered, with their corresponding levels, are illustrated in Table 2. Lastly, the respondents’ socio-demographic characteristics, including gender, age, education, job, and monthly income were requested.
2.2. Data Collection
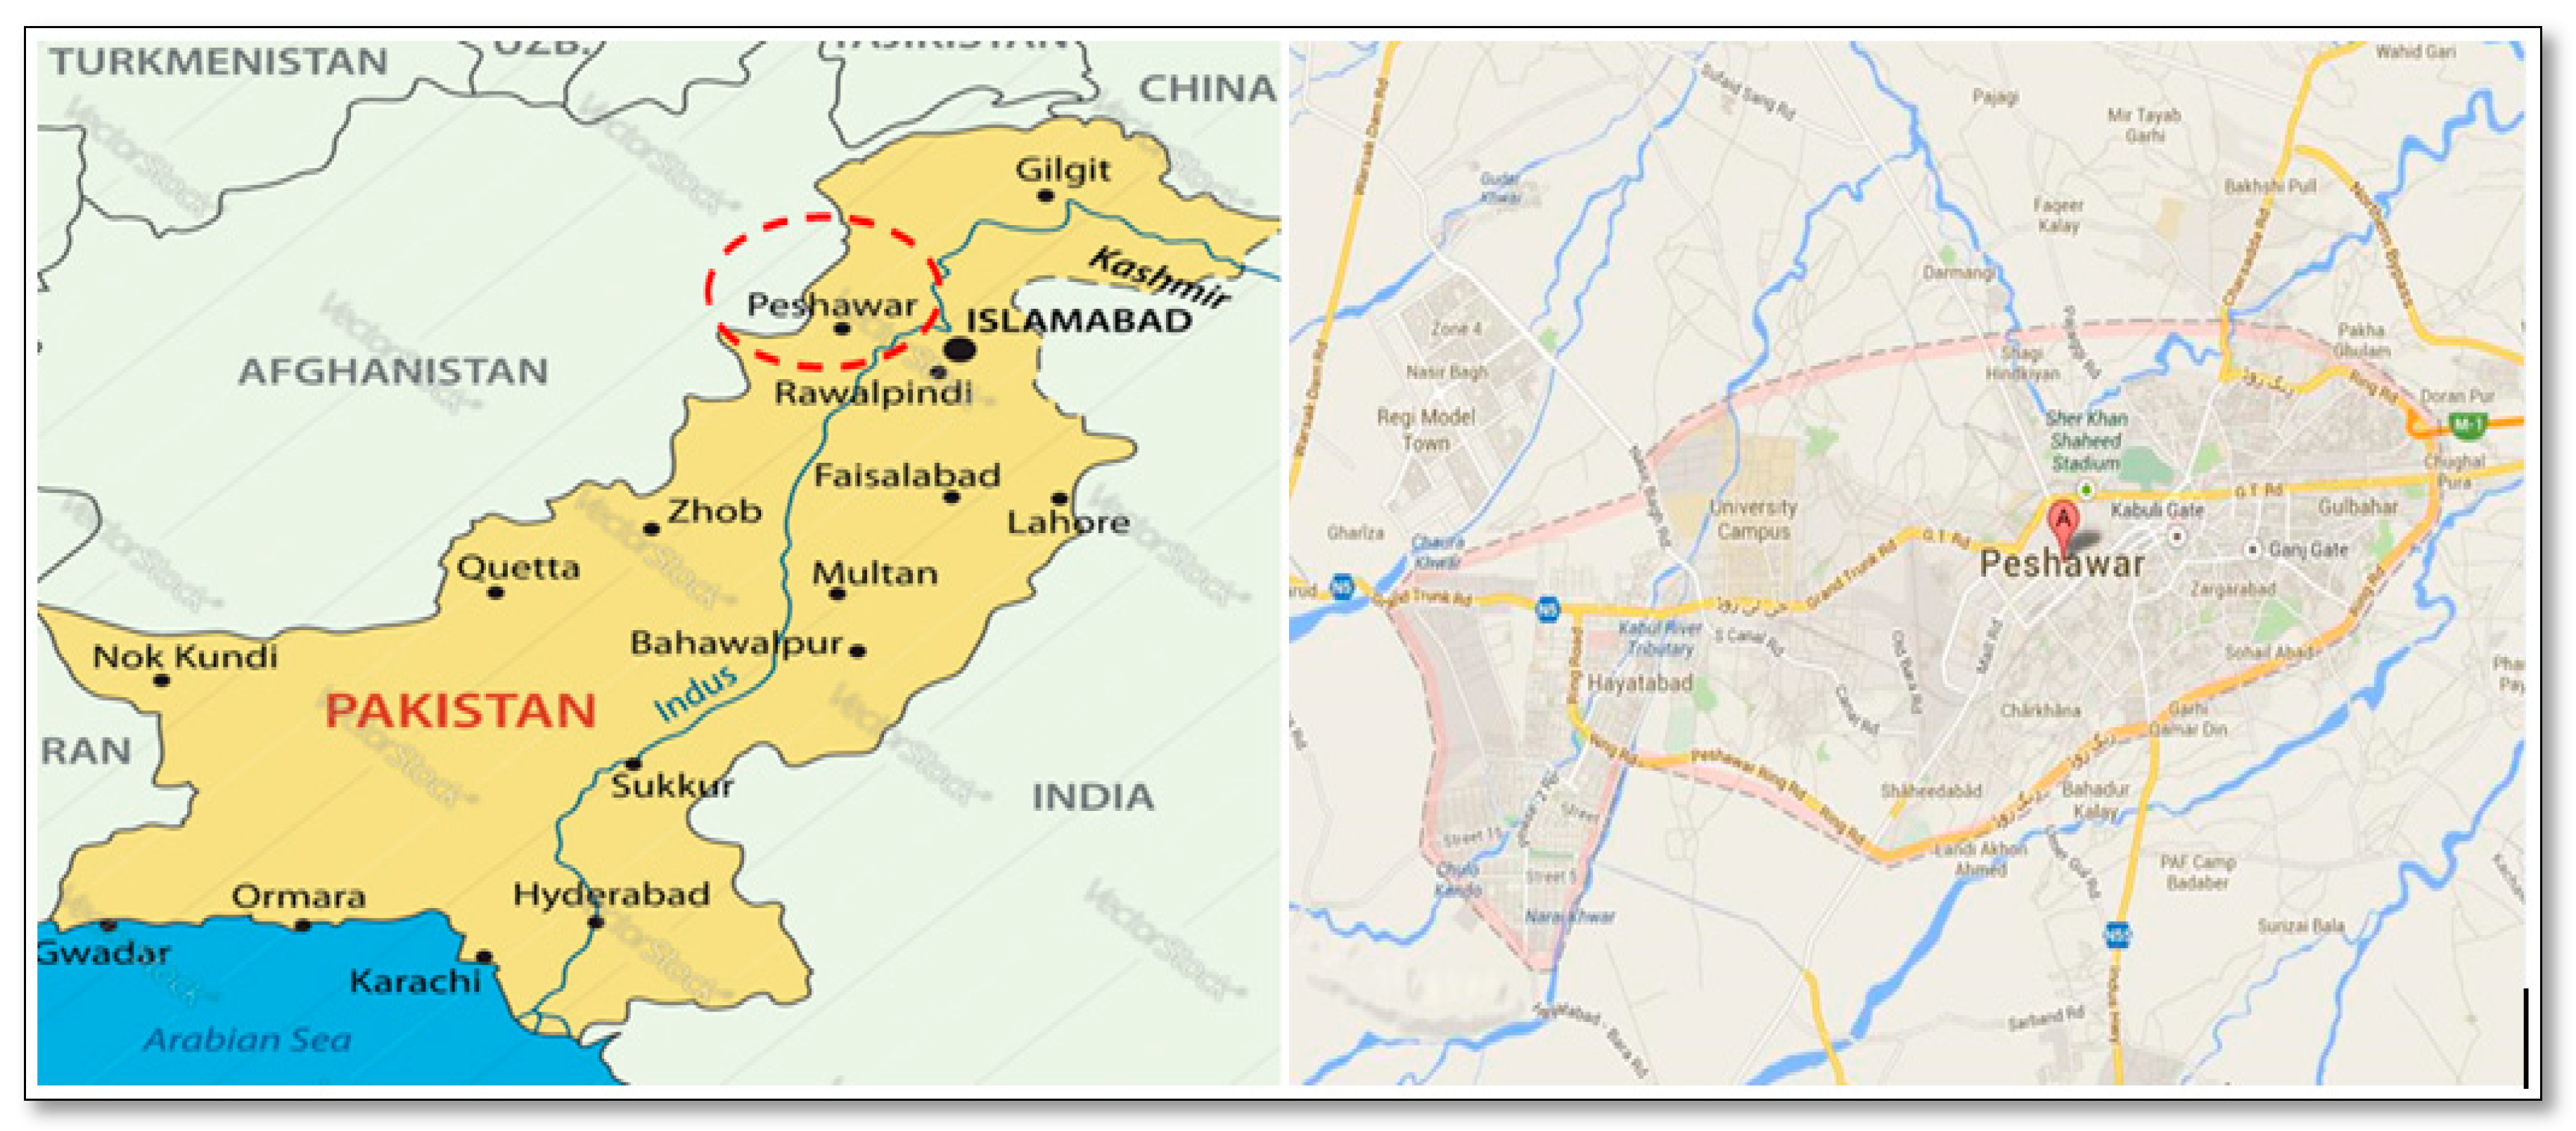
Peshawar, the capital city of the province of Khyber Pakhtunkhwa, has an area ~1275 km2 and population of 4.65 million [6]. The city map is shown in Figure 5. To collect information about travelers’ perceptions towards car sharing systems in the city, a questionnaire survey was conducted using a professional online Google form, and delivered through social media sources and emails to randomly selected residents throughout the city. A number of previous studies have conducted surveys in a similar way, for instance, in Greece an electronic questionnaire through Google forms was conducted for understanding peoples’ perception towards car and bike sharing services [44]. Wang et al. (2017) used online-based questionnaires to collect information about individual travelers’ acceptance of car sharing systems in China [45]. Questionnaires were divided into three separate groups. Respondents were requested to complete the online questionnaire within two months from the date of receipt. Online surveys have great advantages; because they are easy for people to complete during their free time without any hurdle [45]. Our survey was completed in August 2018. A total of 453 valid responses were received (185 were car-owners; and 268 were non-car-owners), each respondent faced four different scenarios, which were accumulated to 1812 observations as per Slovin’s formula:
where; n = sample size, N = population size, and E = error tolerance.
The confidence level was 95% and the margin of error was 5%. According to the formula, a minimum sample size of 400 respondents was desired for Peshawar city’s population.
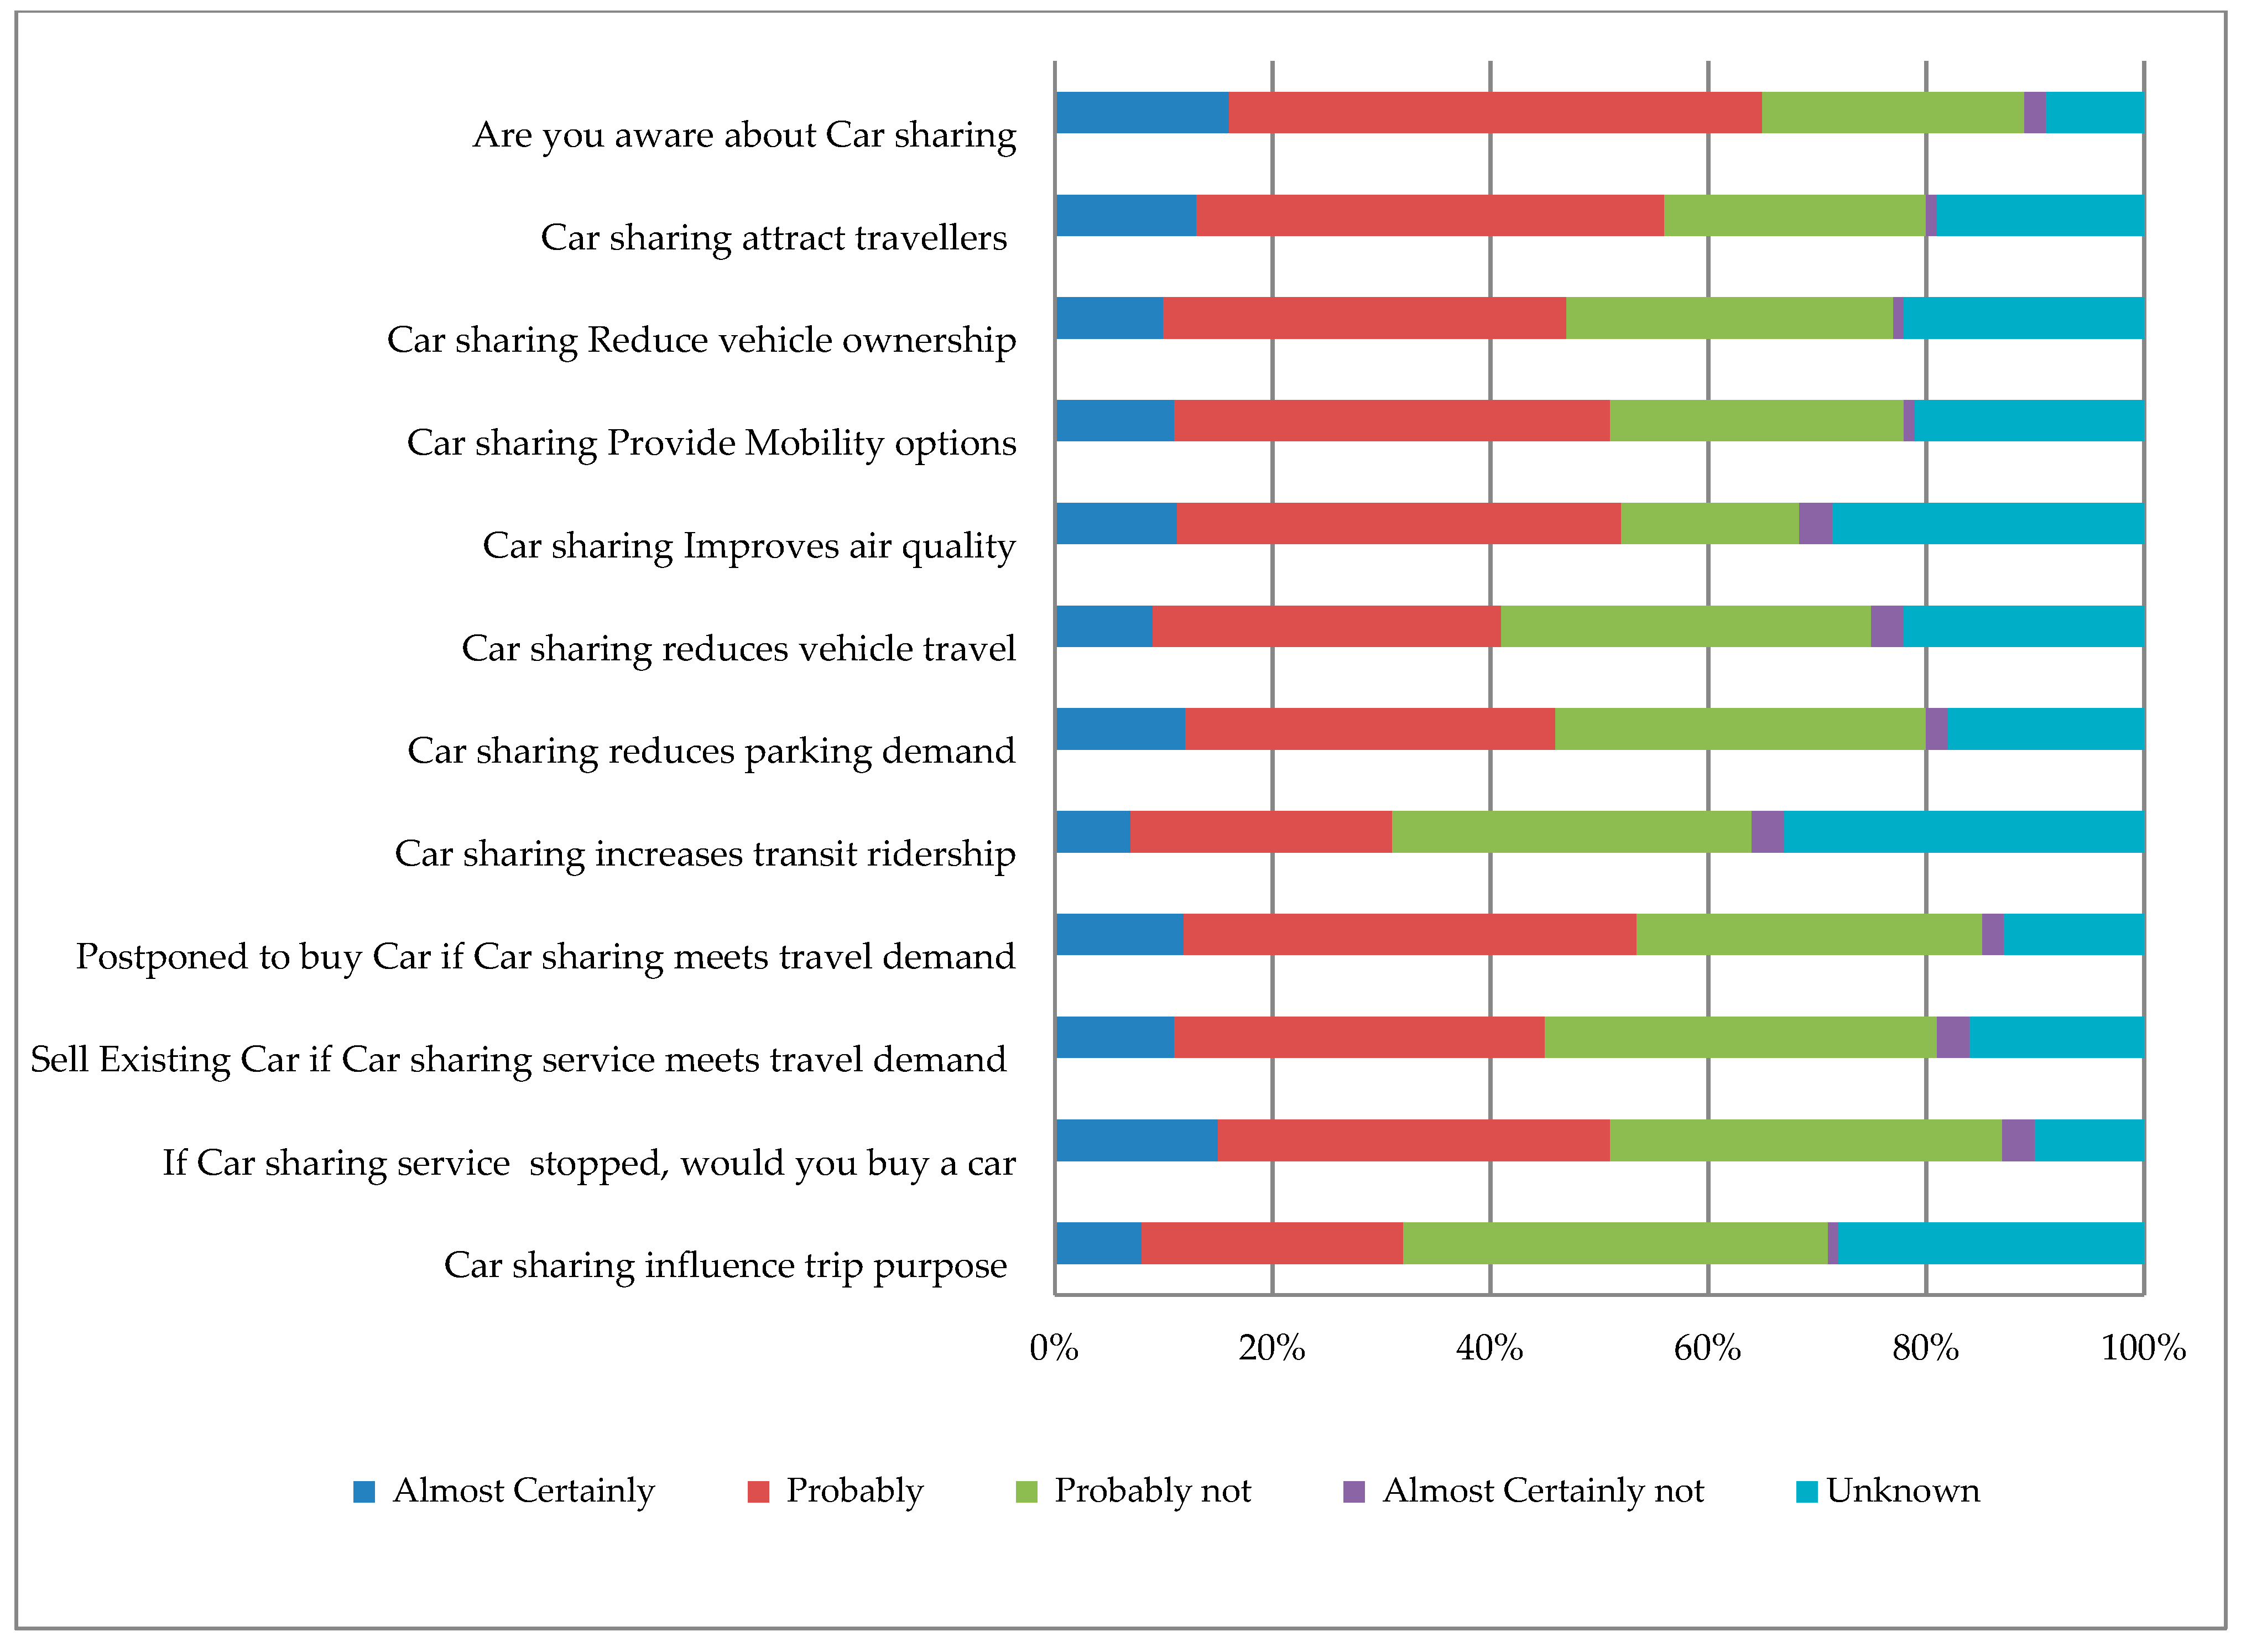
Males constituted approximately 68% of total respondents, while the rest were females. The survey received respondents from a good proportion of various age groups to avoid any substantial bias. Approximately 25% of total respondents were 18–30 years old, 31% were 31–40 years, and 23% were 41–50 years, while the remaining 21% were above 50 years of age. According to the job category, 62% of the respondents were employees of public or private companies, 23% were students, and 12% were entrepreneurs, while the remaining 3% were unemployed. Among all the respondents, 22% were graduates with a master degree and above, 50% were undergraduate, and 24% were had matric level certificates, while only 4% were below high school education. It was also observed that the majority of respondents had their household income in the middle-income level (31,000–60,000 PKR). The socio-demographic characteristics of the respondents are shown in Table 3. Figure 6 illustrates respondent’s awareness and perception for car sharing systems. It may be noted from Figure 6 that 65% of respondents had prior knowledge of car sharing systems, while 35% of respondents were unaware. Almost 50% of respondents agreed that car sharing will attract travelers, reduce vehicle ownership, improve air quality, and provide better mobility option. Furthermore, most respondents had similar views, that they would postpone buying a new car or sell their existing car, if car sharing meets their travel demands. Past studies revealed that attitudes play a key role in peoples’ perception and acceptance of car sharing systems [46,47]. Previous studies suggest that people familiar with car sharing are more likely to join this system [12,43,48].
2.3. Model Estimation
In this study, the Multinomial Logit (MNL) model and Nested Logit (NL) model were used to analyze public acceptance towards car sharing systems. In previous studies, different discrete choice models have been developed, such as MNL Model, Mixed Logit model, Bivariate Ordered Probit model, and Binomial Logit model [8,38,39,41,49], to investigate choice behavior under various circumstances. Phoowarawuthipanich et al. (2005) used the Binary Logit Model to analyze travelers’ attitudes towards car sharing systems in Bangkok [48], while Beria et al. (2017) used the MNL model to analyze peer to peer car sharing in Milan [50].
2.3.1. MNL Model
The structure of the MNL model defines each choice alternative by using the utility function which is presented by Equation (2):
where, Usi represent the overall utility of respondent s; choosing alternative i, Xsi represent the observed variables; βsi represent the parameter coefficients; and εsi represent the error terms.
The general expression for the probability of choosing an alternative i (i = 1, 2, … J) from a set of J alternatives is:
where, Pr(i) is the probability of the decision-maker choosing alternative i, and Vj is the systematic component of the utility of alternative j.
The structure of the MNL model describes each choice alternative through a utility function presented below.
Car sharing:
Private car:
Taxi:
Bus:
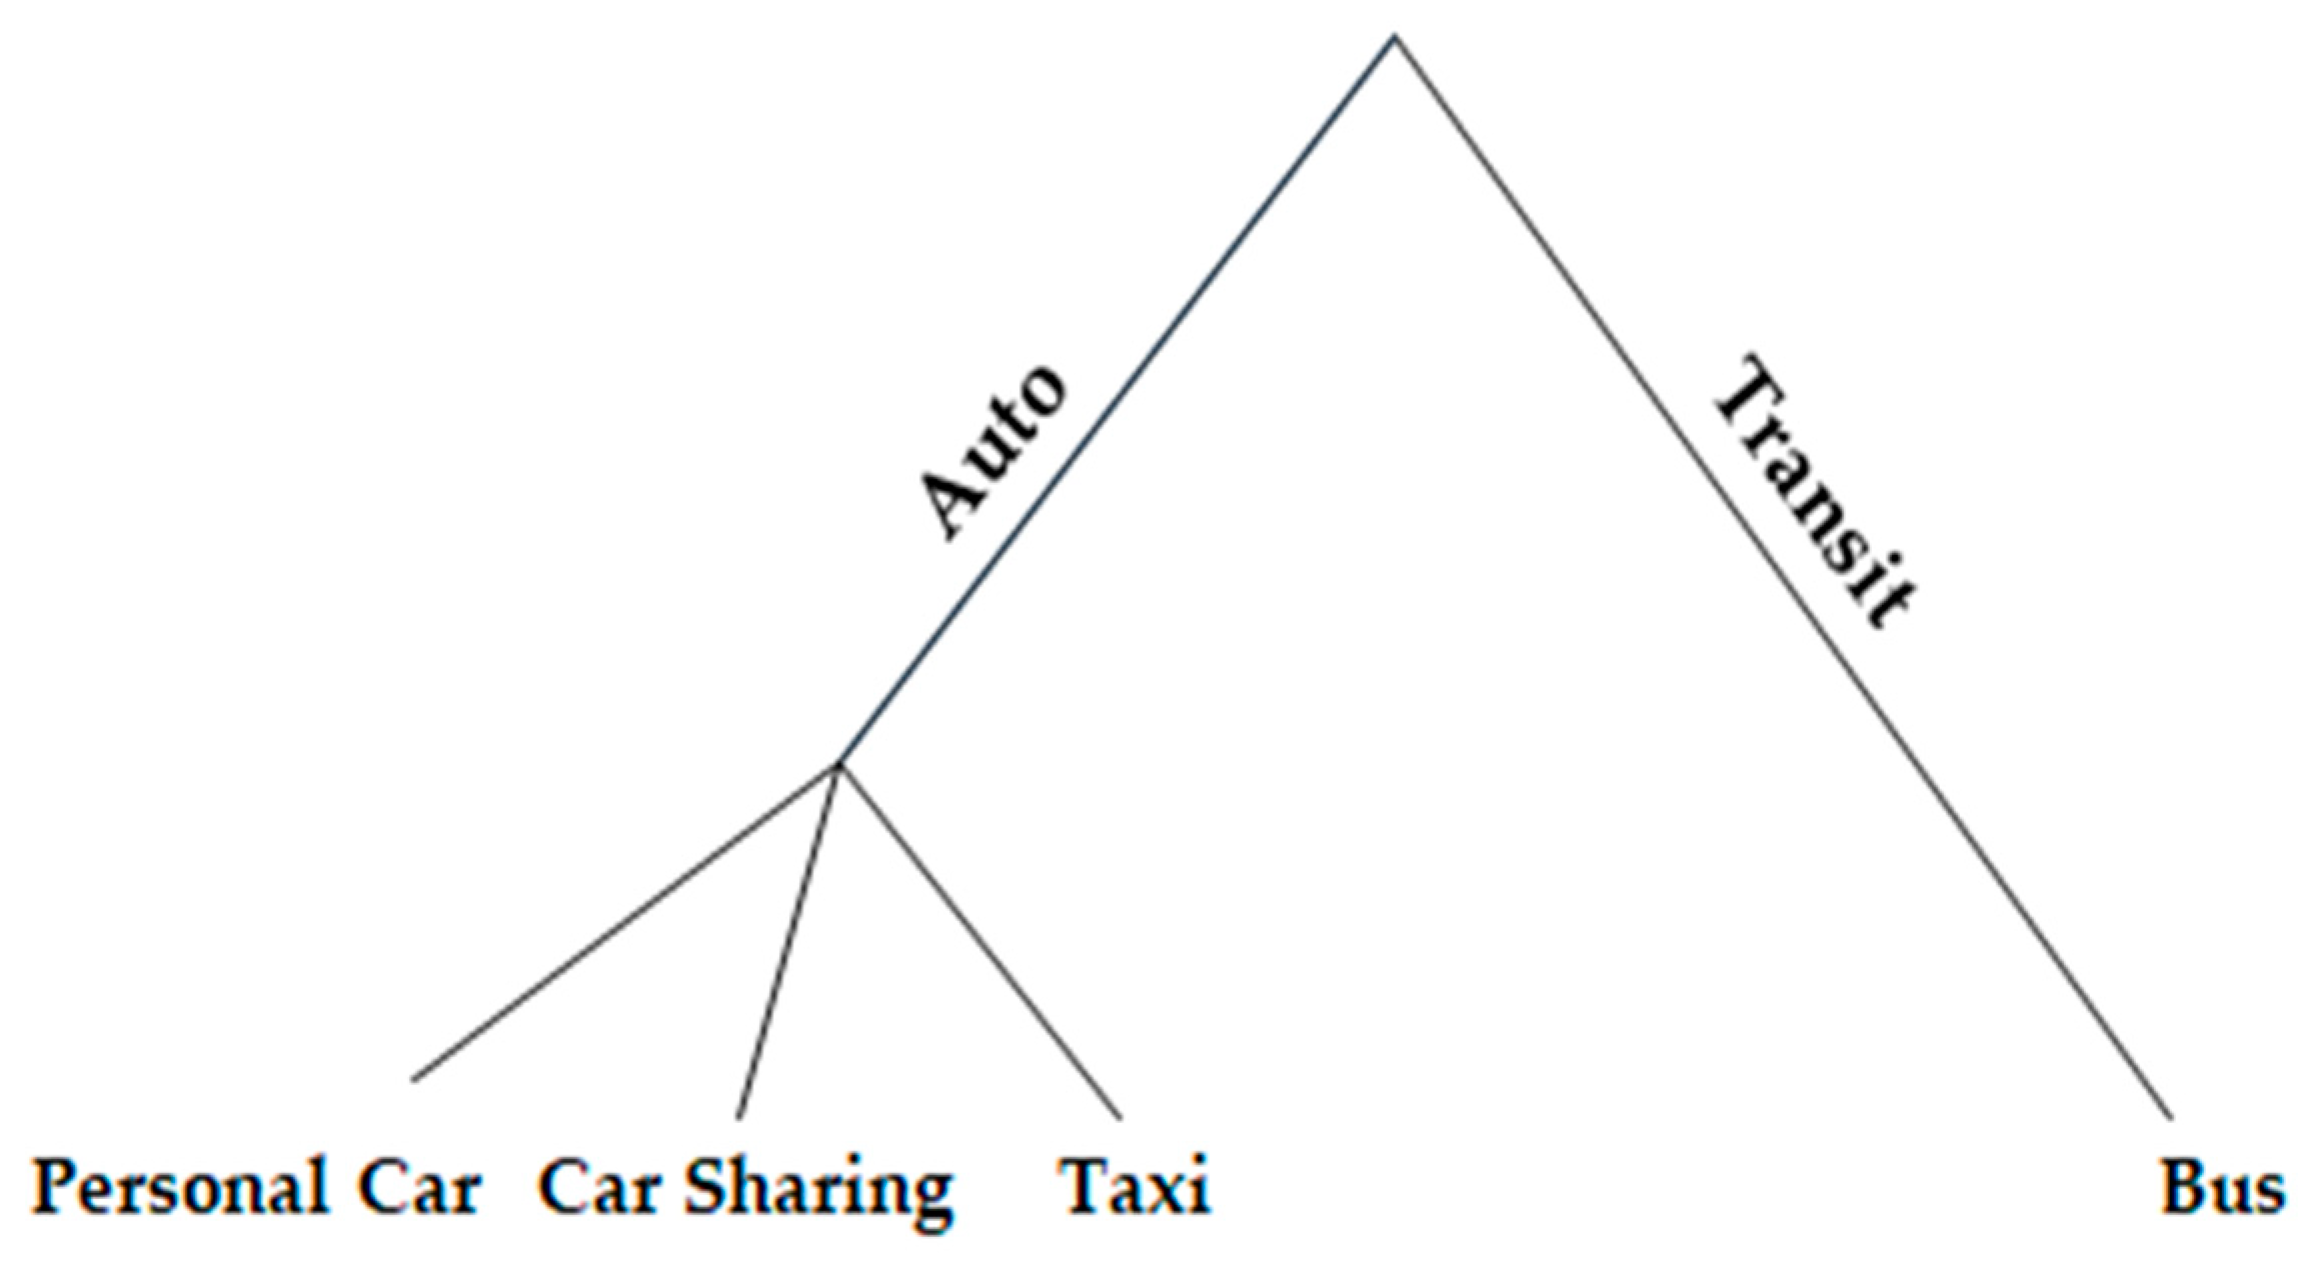
2.3.2. Nested logit Model
The NL model is based on the concept of grouping similar alternative. The NL model’s structure is shown in Figure 7. The general expression for the probability for an alternative j in nest n (j ∈ Bn) is:
where V’s are the systematic utilities of the alternative; m is the number of nests; and λ’s are additional parameters to be estimated. The NL model also introduced additional parameter’s λn, one per nest.
3. Results and Discussion
The model was estimated using the maximum likelihood function method. Discrete choice models were estimated using the Biogeme software. The MNL model has the inherent advantage in a sense that the variables are easily interpretable and can overcome bias if all the variables are inputted in the model. MNL model estimation based on the IIA (Independent of Irrelevant Alternative) assumption and NL model have been used to test the correlation among all the alternatives. All the variables were put into the model in a stepwise manner for achieving better model fit. Insignificant variables were discarded from the final model. The MNL and NL models with linear parameters were estimated with the four alternatives including personal car, car sharing, taxi, and bus. The bus was taken as the reference alternative in the estimation process. The model estimation results are given in Table 4 and Table 5. Comparing these models, the fit for the MNL model was better than the NL model, both for car-owner and non-car-owner travelers. The result indicated that the McFadden’s pseudo were 0.17 and 0.15 for car-owners and non-car-owners by the MNL model, respectively, and those were 0.13 and 0.14 for car-owners and non-car-owners by NL model, respectively. Therefore, the subsequent discussion will be based on the estimation results of the MNL model. Furthermore, Table 4 and Table 5 indicated that model fit based on travelers owning personal cars was better compared to that for travelers who do not have a private car.
The alternative specific constant was higher for car sharing among other alternatives in both models, which proved its higher utility compare to other alternatives. It can also be seen from the model estimation results that all the generic variables including (travel time, travel cost, registration fee, and capital cost) except for the maintenance cost, had the expected signs and were highly significant. Likewise, the NL model estimation results indicate that all these generic variables were highly significant except for the maintenance cost, which was not significant for non-car-owners, for car-owners all the generic variables were insignificant. Model results showed that females were more likely to choose car sharing modes than a personal car. Females in Pakistan do not like to hire taxis for traveling due to privacy constraints. Several studies in North America and Europe have found that women are likely to join car sharing systems [41,43,51]. The variables of age, education, and driving license were not significant, and thus discarded from model estimation results. It can be observed from the Table 4 that job status significantly affected the choice of car sharing and taxi. Students and unemployed travelers were more attracted towards car sharing only for car-owners. This was due to the fact that these travelers could not afford the maintenance and other costs for personal cars. The job parameter was insignificant in the NL model estimation results for both groups of peoples. The income variable in both MNL and NL models was significant and positively associated with the dependent variable for all the travel modes, except car sharing only for car-owners. High income people preferred to travel using their personal cars [39]. Trip distance was a significant delimiter for car sharing only for non-car-owners in MNL model. Car sharing was preferred by a large proportion of travelers for trip distances of 10 km or less. For longer distances, travelers preferred to use their own personal cars [38]. The NL model results showed that trip distance was significant for all travel modes for non-car-owners. The variable trip distance for both models was insignificant for car-owners. For non-car-owners, the trip distance variable was significant in the MNL model. These results show that travelers were more likely to choose car sharing for schooling and working trips. Some previous studies suggest that car-owners are more likely to choose car sharing for commuting and shopping trips with relative preference for trip distance ranging from 3 to 10 km [42,43,45]. The traveler’s occupancy variable in the MNL model was highly significant and negatively associated with response variable for car sharing only for car-owners, while this variable was highly significant and positively associated with the response variable for personal car only for non-car-owners. In the NL model, the trip occupancy variables were highly and positively significant for all travel modes only for non-car-owners. In conclusion, most of variables are significant for both car-owners and non-car-owner in the MNL model compared to NL model.
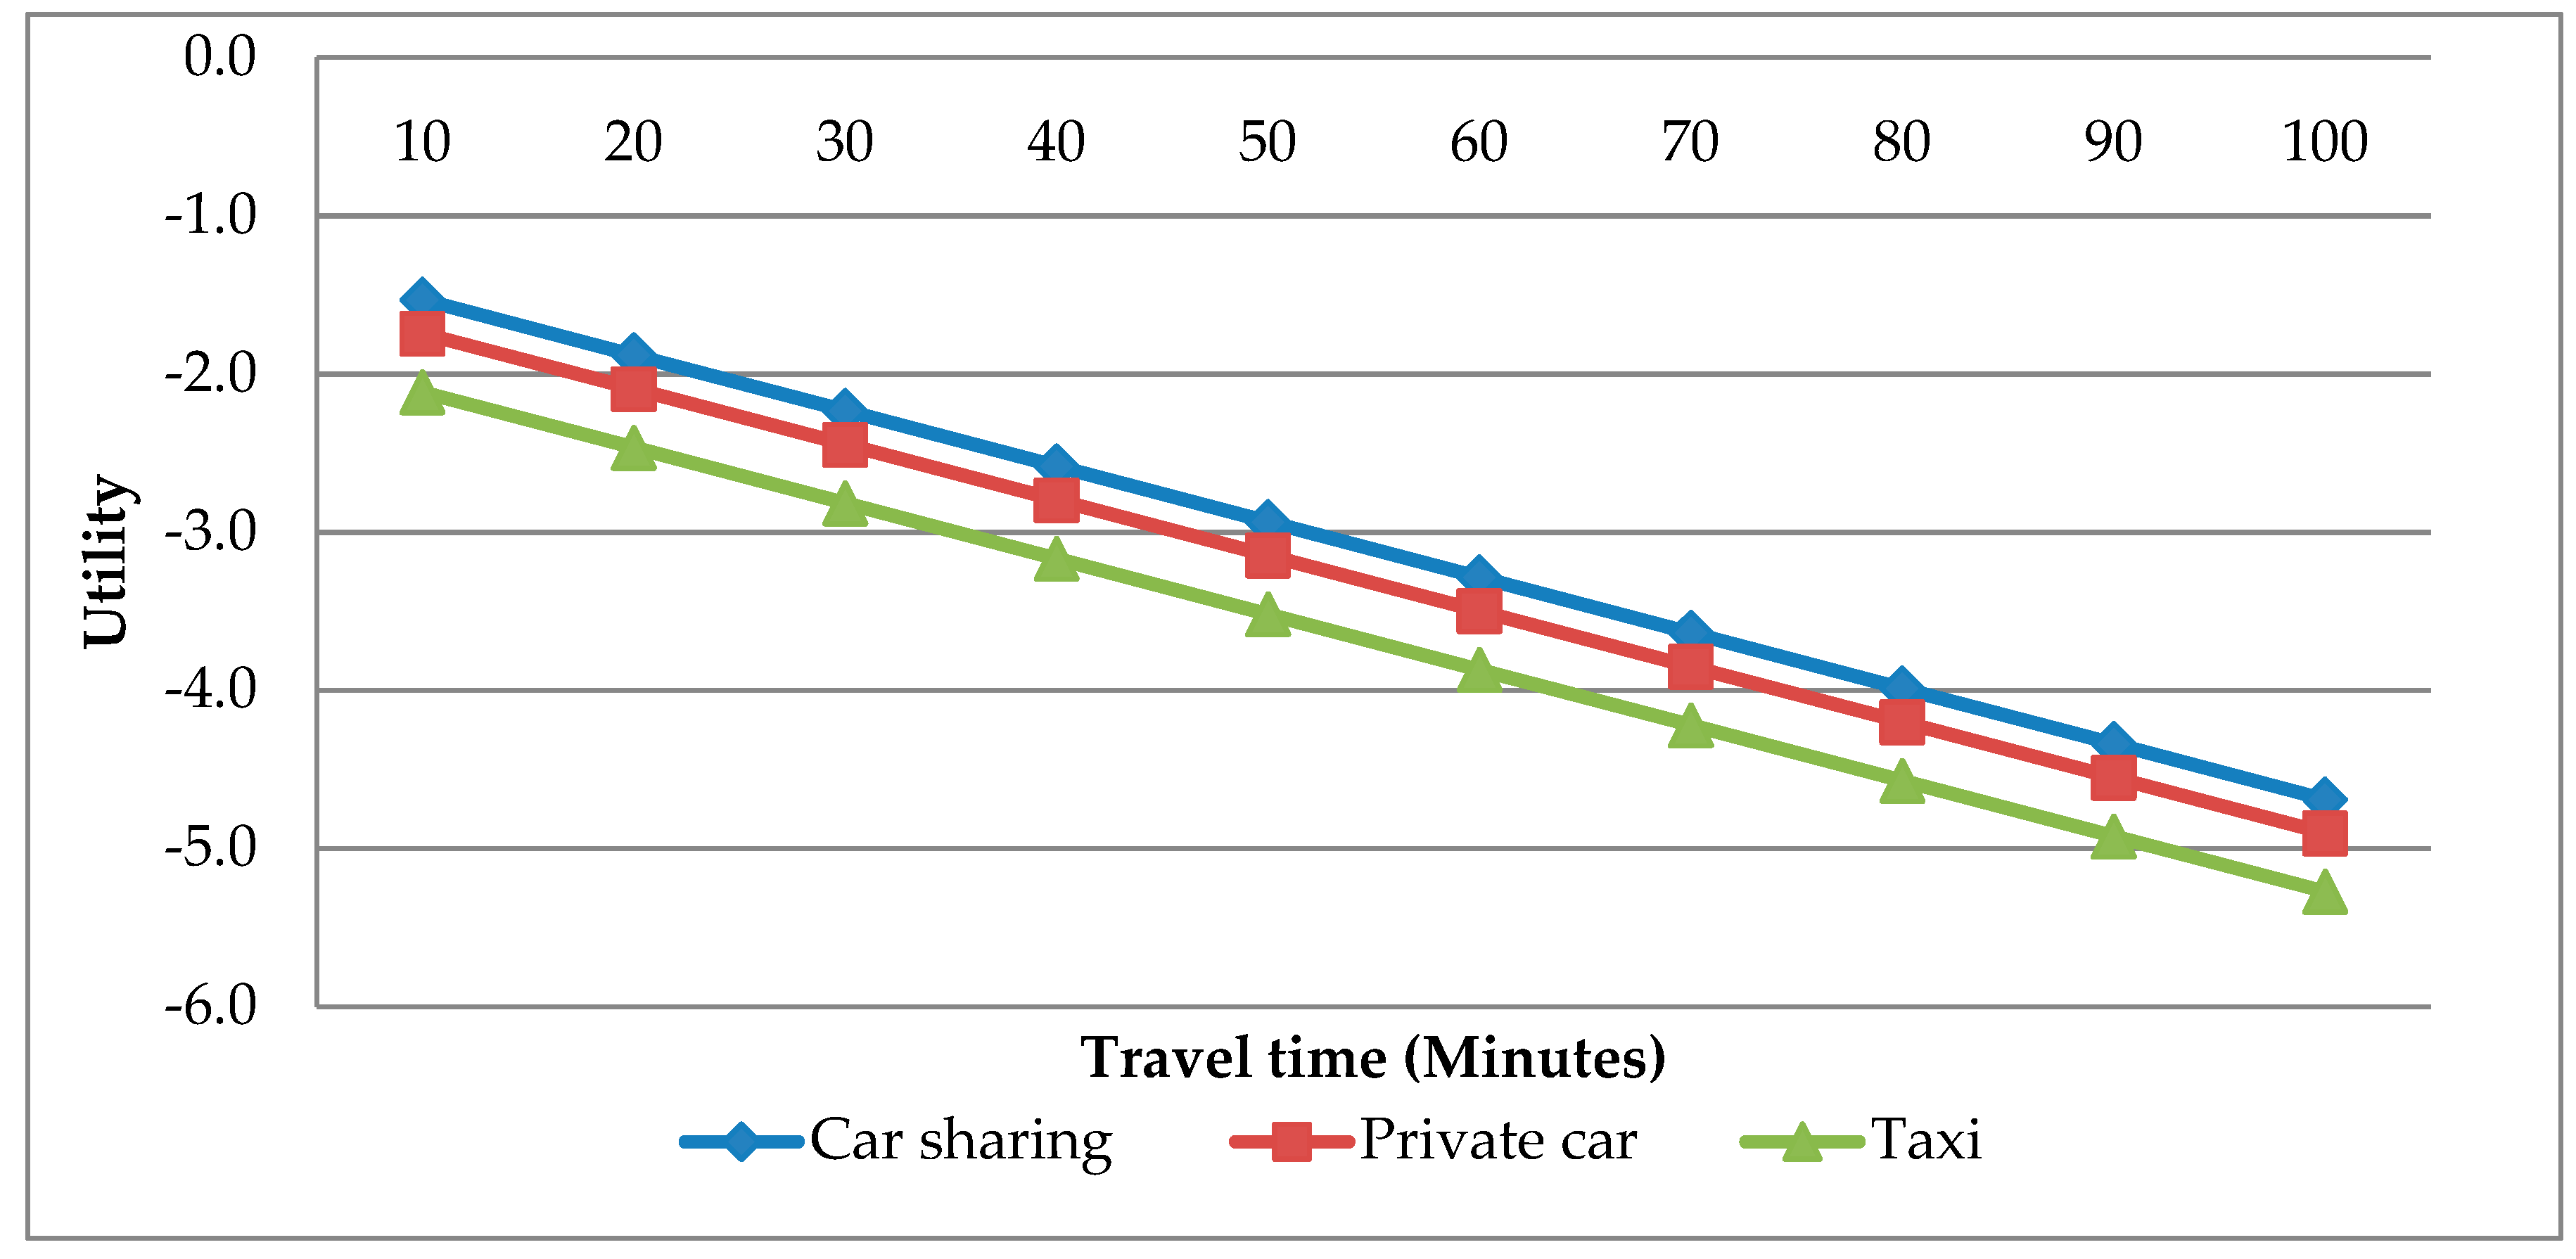
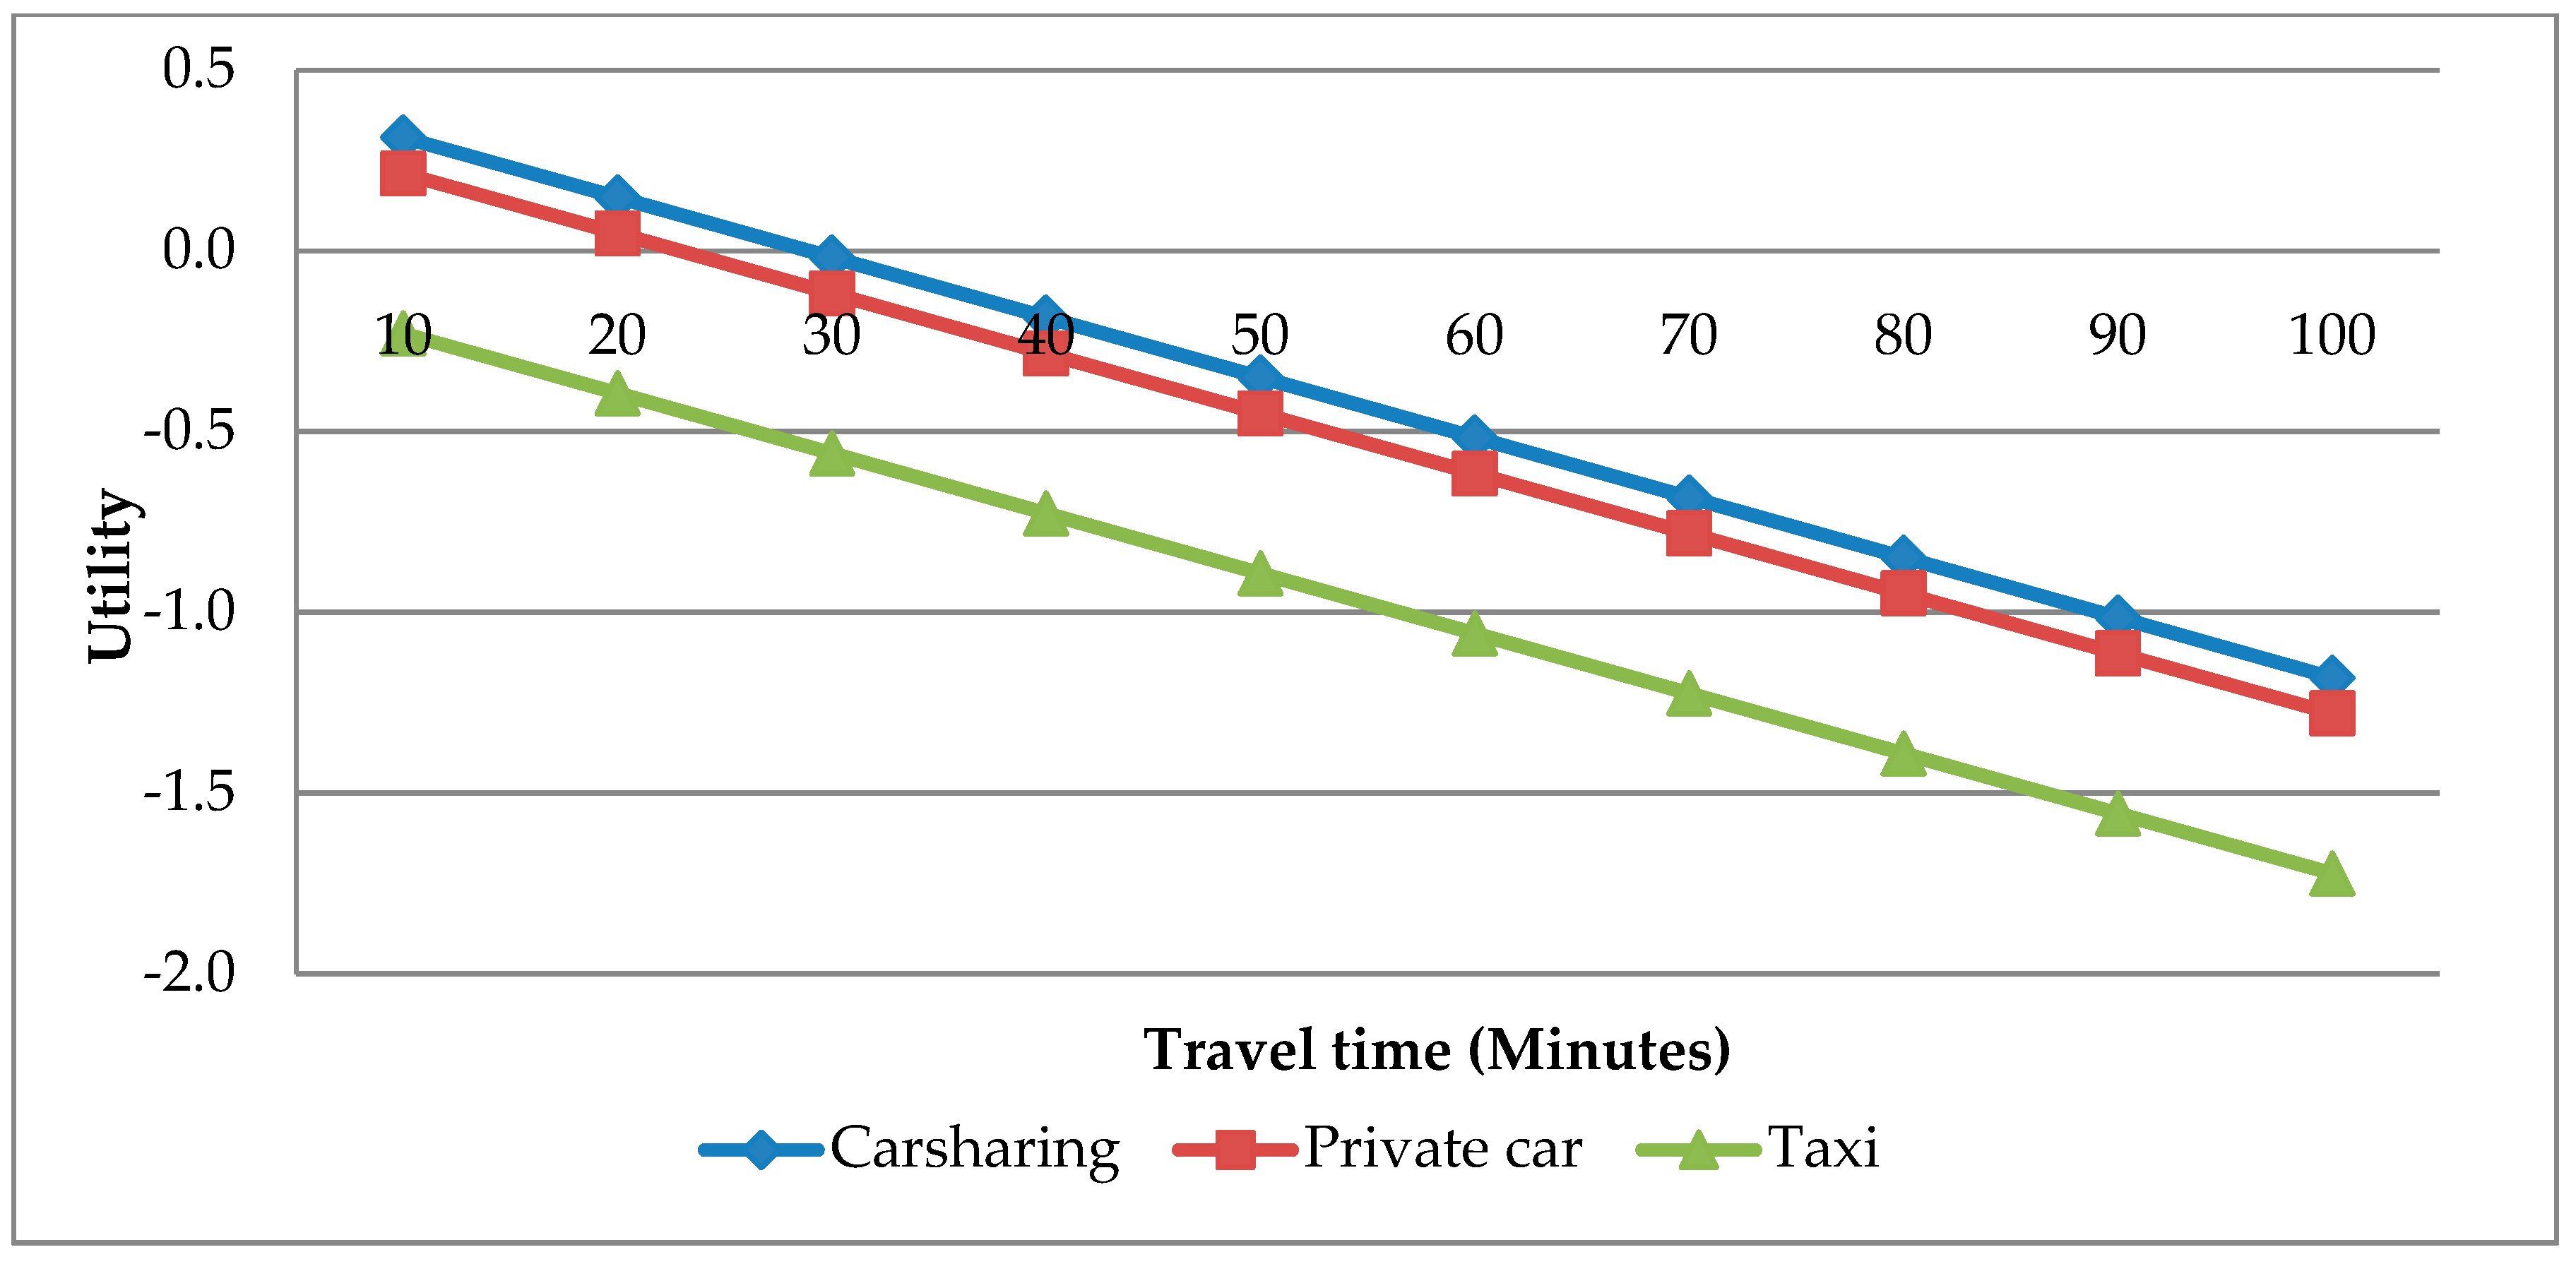
Utility maximization models were employed to verify the experimental result. Alternatives with maximum utility were selected. Travel time was taken as a reference ranging from 10 to 100 min, travel cost (350 PKR), and registration fee (20,000 PKR) for car sharing were rationally assumed. Similarly, for private car the travel cost (300 PKR), maintenance cost (50,000 PKR), and capital cost (1,300,000 PKR) were chosen. The travel cost for taxis was considered 550 PKR for typical commuting trip. The trip distance was considered more than 10 km while the trip purpose was predominantly considered as schooling and working. The trip occupancy variables were considered; such as travelling with friend and family. For comparing utility of present alternative males, employees, and high income people were considered.
However, for car-owners the utility of car sharing was lower than private car if the travel cost per trip was reduced to 300 PKR, more people were likely to join car sharing systems (Figure 8). It may be noted from Figure 9 that the utility of car sharing towards non-car-owners was slightly higher than other alternatives. Bus utility was not considered for comparison.
4. Conclusions
The purpose of this study is to explore the public’s acceptance of car sharing through a case study in Peshawar, Pakistan. It has identified the reasons and incentives for developing car sharing systems, and the role of individual behaviors in switching to new mobility mode. The study also sought to know whether car sharing was able to overcome the growth of private car ownership, which has become a major challenge in the city recently.
The MNL and NL models revealed several significant factors which affect travelers’ acceptance towards car sharing systems. It was concluded that some demographics factors affect the acceptance of car sharing systems. The model estimation results indicated that gender, employment, and income have a significant effect on travelers’ acceptance or willingness-to-use. In addition, some situational parameters including trip distance, trip occupants, and trip purpose were also perceived significant to the car sharing acceptability. Similarly, the service attributes including travel cost, travel time, capital cost, and registration fees are highly significantly associated to car sharing systems. Moreover descriptive result suggests that the peoples who are aware of car sharing systems have positive effects on the choice of car sharing systems. The study indicated that the car sharing systems could diminish the growth of car ownership, as the results showed a high tendency of car owners towards adopting this system, people who usually travel by private car may abandon their own car and use the car sharing systems [9,24]. It is also revealed that if car sharing is initiated, although people want to buy a car, can be attracted towards using car sharing systems. However car sharing could help increase the mobility in urban areas for those who cannot afford to buy a car.
Moreover it is important to study public perception regarding car sharing acceptance before the system is commercially available. In Peshawar, car sharing systems are still a new idea with limited public awareness. People are not able to physically see the car sharing systems, which may generate bias in results. Female respondents in this study are fewer compared to male respondents (one-third of the sample size). However, this uncontrollable factor has limited effects on the model estimation because the sample size is enough for discrete choice modeling. It would be interesting to introduce various car sharing services such as one-way services, peer to peer services, and free floating services to find out which one could be more successfully implemented. Moreover, electric car sharing that is becoming popular, is a new research topic to alleviate environmental problems. Future researches will be conducted along these directions.
Understanding the travelers’ acceptance towards car sharing systems will help to implement suitable policies to apply and develop the concept, as well as identify the potential target markets. Government should allocate suitable parking spots for car sharing companies considering the local travel habits, and it will be better to support the cooperation between different car sharing companies. The rate of growing motorbikes in Peshawar seems to be high, so motor bike should be prohibited in city center. With the support and encouragement of planners, car sharing systems can continue to raise and boom in walkable inhabitants through the country, improving the quality of people’s life and accelerating the process to a more sustainable transportation in future. It is recommended that future studies should focus on several policies which can widely promote the usage of car sharing in Pakistan.
Author Contributions
The main framework for the research was developed by I.U. and K.L.; T.V. contributed to the survey design; I.U. collected the data, performed analyses, and wrote the paper; K.L. reviewed and made correction to improve the paper.
Acknowledgments
This research was funded by the joint research program of the Institute of Materials and Systems for Sustainability, Nagoya University, Japan. The authors would like to acknowledge the support funding from the National Natural Science Foundation of China (Grant Nos. 51378091 and 71871043), National Natural Science Foundation of Liaoning Province, China (Grant No. 20170540187), and Fundamental Research Funds for the Central Universities, China (Grant No. DUT18GJ204).
Conflicts of Interest
The authors declare no conflicts of interest.
References
- Tahir Masood, M.; Khan, A.A.; Naqvi, H. Transportation Problems in Developing Countries Pakistan: A Case-in-Point. Int. J. Bus. Manag. 2011, 6. [Google Scholar] [CrossRef]
- Faiez, H.S. Urban Transportation Problems in Pakistan. 2017. Available online: http://faiezseyal.com/post/urban-transportation-problems-in-pakistan/ (accessed on 29 November 2018).
- Ali, Z.; Shah, S.A.A.; Hussain, A. Growing Traffic in Peshawar: An Analysis of Causes and Impacts. South Asian Stud. (1026-678X) 2012, 27, 409–420. [Google Scholar]
- Economic and Financial Analysis; Peshawar Sustainable Bus Rapid Transit Corridor Project (RRP PAK48289). Available online: https://www.adb.org/sites/default/files/linked-documents/48289-002-efa.pdf (accessed on 29 November 2018).
- Farooq, A.; Local, P.; Transport, P. Peshawar Local Public Transport Strategy and Organization (Pakistan). Int. J. Eng. Dev. Res. 2017, 3, 1–7. [Google Scholar]
- Khan, A.; Arshad, M.A. Study of Various Mass Transit Options for Study of Various Mass Transit Options for Peshawar City by Life Cycle Cost Analysis. In Proceedings of the 1st International Multi-Disciplinary Conference, The University of Lahore, Gujrat, Pakistan, 23–24 November 2017. [Google Scholar]
- Shaheen, S.; Cohen, A. Growth in Worldwide Carsharing: An International Comparison. Transp. Res. Rec. J. Transp. Res. Board 2007, 1992, 81–89. [Google Scholar] [CrossRef]
- Wang, M.; Martin, E.; Shaheen, S. Carsharing in Shanghai, China. Transp. Res. Rec. J. Transp. Res. Board 2012, 2319, 86–95. [Google Scholar] [CrossRef]
- Martin, E.; Shaheen, S.; Lidicker, J. Impact of Carsharing on Household Vehicle Holdings Results from North American Shared-Use Vehicle Survey. Transp. Res. Rec. J. Transp. Res. Board 2010, 2143, 150–158. [Google Scholar] [CrossRef]
- Litman, T. Evaluating Carsharing Benefits. Transp. Res. Rec. J. Transp. Res. Board 2000, 1702, 31–35. [Google Scholar] [CrossRef]
- Glotz-Richter, M. Car-Sharing—“Car-on-call” for reclaiming street space. Procedia Soc. Behav. Sci. 2012, 48, 1454–1463. [Google Scholar] [CrossRef]
- Shaheen, S.A.; Cohen, A.P.; Roberts, J.D. Carsharing in North America. Market growth, current developments, and future potential. Transp. Res. Rec. J. Transp. Res. Board 2006, 1986, 116–124. [Google Scholar] [CrossRef]
- Alfian, G.; Rhee, J.; Kang, Y.-S.; Yoon, B. Performance Comparison of Reservation Based and Instant Access One-Way Car Sharing Service through Discrete Event Simulation. Sustainability 2015, 7, 12465–12489. [Google Scholar] [CrossRef] [Green Version]
- Keyvanfar, A.; Shafaghat, A.; Muhammad, N.; Ferwati, M. Driving Behaviour and Sustainable Mobility—Policies and Approaches Revisited. Sustainability 2018, 10, 1152. [Google Scholar] [CrossRef]
- Shaheen, S.A.; Cohen, A.P. Carsharing and Personal Vehicle Services: Worldwide Market Developments and Emerging Trends. Int. J. Sustain. Transp. 2013, 7, 5–34. [Google Scholar] [CrossRef]
- Rabbitt, N.; Ghosh, B. A study of feasibility and potential benefits of organized car sharing in Ireland. Transp. Res. Part D 2013, 25, 49–58. [Google Scholar] [CrossRef]
- Martin, E.; Shaheen, S. The Impact of Carsharing on Public Transit and Non-Motorized Travel: An Exploration of North American Carsharing Survey Data. Energies 2011, 4, 2094–2114. [Google Scholar] [CrossRef] [Green Version]
- Martin, E.W.; Shaheen, S.A. Greenhouse Gas Emission Impacts of Carsharing in North America. IEEE Trans. Intell. Transp. Syst. 2011, 12, 1074–1086. [Google Scholar] [CrossRef] [Green Version]
- Shaheen, S.; Cohen, A.; Chung, M. North American Carsharing, 10-Year Retrospective. Transp. Res. Rec. J. Transp. Res. Board 2009, 2110, 35–44. [Google Scholar] [CrossRef]
- Kumar, V.P.; Bierlaire, M. Optimizing Locations for a Vehicle Sharing System. In Proceedings of the Swiss Transport Research Conference, Phoenix, AZ, USA, 16–18 May 2012. [Google Scholar]
- Ohta, H.; Fujii, S.; Nishimura, Y.; Kozuka, M. Analysis of the Acceptance of Carsharing and Eco-Cars in Japan. Int. J. Sustain. Transp. 2013, 7, 449–467. [Google Scholar] [CrossRef]
- Jung, J.; Koo, Y. Analyzing the Effects of Car Sharing Services on the Reduction of Greenhouse Gas (GHG) Emissions. Sustainability 2018, 10, 539. [Google Scholar] [CrossRef]
- Baptista, P.; Melo, S.; Rolim, C. Energy, Environmental and Mobility Impacts of Car-sharing Systems. Empirical Results from Lisbon, Portugal. Procedia Soc. Behav. Sci. 2014, 111, 28–37. [Google Scholar] [CrossRef] [Green Version]
- Huwer, U. Public transport and car-sharing—Benefits and effects of combined services. Transp. Policy 2004, 11, 77–87. [Google Scholar] [CrossRef]
- Galiveeti, H.R.; Goswami, A.K.; Dev Choudhury, N.B. Impact of plug-in electric vehicles and distributed generation on reliability of distribution systems. Eng. Sci. Technol. Int. J. 2018, 21, 50–59. [Google Scholar] [CrossRef]
- Shaheen, S.; Cano, L.; Camel, M. Exploring electric vehicle carsharing as a mobility option for older adults: A case study of a senior adult community in the San Francisco Bay Area. Int. J. Sustain. Transp. 2016, 10, 406–417. [Google Scholar] [CrossRef]
- Liu, K.; Yamamoto, T.; Morikawa, T. Impact of road gradient on energy consumption of electric vehicles. Transp. Res. Part D 2017, 54, 74–81. [Google Scholar] [CrossRef]
- Liu, K.; Wang, J.; Yamamoto, T.; Morikawa, T. Exploring the interactive effects of ambient temperature and vehicle auxiliary loads on electric vehicle energy consumption. Appl. Energy 2018, 227, 324–331. [Google Scholar] [CrossRef]
- Zhang, R.H.; He, Z.C.; Wang, H.W.; You, F.; Li, K.N. Study on Self-Tuning Tire Friction Control for Developing Main-Servo Loop Integrated Chassis Control System. IEEE Access 2017, 5, 6649–6660. [Google Scholar] [CrossRef]
- Sun, X.; Zhang, H.; Meng, W.; Zhang, R.; Li, K.; Peng, T. Primary resonance analysis and vibration suppression for the harmonically excited nonlinear suspension system using a pair of symmetric viscoelastic buffers. Nonlinear Dyn. 2018, 94, 1243–1265. [Google Scholar] [CrossRef]
- Yoon, T.; Cherry, C.R.; Jones, L.R. One-way and round-trip carsharing: A stated preference experiment in Beijing. Transp. Res. Part D 2017, 53, 102–114. [Google Scholar] [CrossRef]
- Qian, C.; Li, W.; Ding, M.; Hui, Y.; Xu, Q.; Yang, D. Mining Carsharing Use Patterns from Rental Data: A Case Study of Chefenxiang in Hangzhou, China. Transp. Res. Procedia 2017, 25, 2587–2606. [Google Scholar] [CrossRef]
- Shaheen, S.A.; Martin, E. Demand for carsharing systems in Beijing, China: An exploratory study. Int. J. Sustain. Transp. 2010, 4, 41–55. [Google Scholar] [CrossRef]
- Shaheen, S.A. Carsharing Trends and Research Highlights. 2017. Available online: https://www.epa.gov/sites/production/files/2017-06/documents/05312017-shaheen.pdf (accessed on 29 November 2018).
- Shaheen, S.; Cohen, A.; Jaffee, M. Innovative Mobility: Carsharing Outlook. Carsharing market overview, analysis and trends. Transp. Sustain. Res. Cent.—Univ. California, Berkeley. 2018. Available online: https://cloudfront.escholarship.org/dist/prd/content/qt49j961wb/qt49j961wb.pdf?t=pa6fa3&nosplash=e639bfe77bf0225c53f3e63ca050e628 (accessed on 29 November 2018). [CrossRef]
- Ciari, F.; Axhausen, K.W. Choosing carpooling or carsharing as a mode: Swiss stated choice experiments. In Proceedings of the Transportation Research Board 91st Annual Meeting, Washington, DC, USA, 22–26 January 2012. [Google Scholar]
- Abraham, J. A Survey of Carsharing Preferences. World Transp. Policy Pract. 1999, 5, 189–200. [Google Scholar]
- De Luca, S.; Di Pace, R. Modelling the Propensity in Adhering to a Carsharing System: A Behavioral Approach. Transp. Res. Procedia 2014, 3, 866–875. [Google Scholar] [CrossRef] [Green Version]
- Kato, H.; Inagi, A.; Igo, T. Potential Choices of Travel Mode including Carsharing and Carsharing Membership: Evidences from Four Japanese Cities. J. East. Asia Soc. Transp. Stud. 2013, 10, 630–646. [Google Scholar]
- Zhou, B.; Kockelman, K.M. Opportunities for and Impacts of Carsharing: A Survey of the Austin, Texas Market. Int. J. Sustain. Transp. 2011, 5, 135–152. [Google Scholar] [CrossRef] [Green Version]
- De Luca, S.; Di Pace, R. Modeling users’ behavior in inter-urban car sharing program: A stated preference approach. Transp. Res. Part A Policy Pract. 2015, 71, 59–76. [Google Scholar] [CrossRef]
- Fukuda, T.; Kashima, S.; Fukuda, A.; Narupiti, S. Analysis of Car Sharing Application on Consumer Orientation and their Modal Selection in Bangkok. J. East. Asia Soc. Transp. Stud. 2005, 6, 1971–1986. [Google Scholar]
- Zheng, J.; Scott, M.; Rodriguez, M.; Sierzchula, W.; Platz, D.; Guo, J.Y.; Adams, T.M. Carsharing in a University Community: Assessing Potential Demand and Distinct Market Characteristics. Transp. Res. Rec. J. Transp. Res. Board 2009, 2110, 18–26. [Google Scholar] [CrossRef]
- Efthymiou, D.; Antoniou, C.; Waddell, P. Factors Affecting the Adoption of Vehicle Sharing Systems. Transp. Policy 2013, 29, 64–73. [Google Scholar] [CrossRef]
- Wang, Y.; Yan, X.; Zhou, Y.; Xue, Q.; Sun, L. Individuals’ Acceptance to Free-Floating Electric Carsharing Mode: A Web-Based Survey in China. Int. J. Environ. Res. Public Health 2017, 14, 476. [Google Scholar] [CrossRef]
- Rodier, C.; Shaheen, S.A. Carsharing and Carfree Housing: Predicted travel, emission, and economic benefits. In Proceedings of the 83th Annual Meeting of the Transportation Research Board, Washington, DC, USA, 11–15 August 2003. [Google Scholar]
- Shaheen, S.A.; Martin, E. Assessing Early Market Potential for Carsharing in China: A Case Study of Beijing; UC Davis: Davis, CA, USA, 2006. [Google Scholar]
- Phoowarawuthipanich, A.; Fukuda, T.; Narupiti, S.; Fukuda, A. Investigating Travel Behavior Associated with the Introduction of Carsharing System in Bangkok. J. East. Asia Soc. Transp. Stud. 2005, 6, 1929–1942. [Google Scholar]
- Dias, F.F.; Lavieri, P.S.; Garikapati, V.M.; Astroza, S.; Pendyala, R.M.; Bhat, C.R. A behavioral choice model of the use of car-sharing and ride-sourcing services. Transportation 2017, 44, 1307–1323. [Google Scholar] [CrossRef]
- Beria, P.; Laurino, A.; Maltese, I.; Mariotti, I.; Boscacci, F. Analysis of Peer-to-Peer Car Sharing Potentialities. In Electric Vehicle Sharing Services for Smarter Cities; Bignami, D.F., Colorni Vitale, A., Lué, A., Nocerino, R., Rossi, M., Savaresi, S.M., Eds.; Springer International Publishing: Cham, Switzerland, 2017; pp. 59–77. ISBN 978-3-319-61963-7. [Google Scholar] [Green Version]
- Giesel, F.; Nobis, C. The impact of carsharing on car ownership in German cities. Transp. Res. Procedia 2016, 19, 215–224. [Google Scholar] [CrossRef]
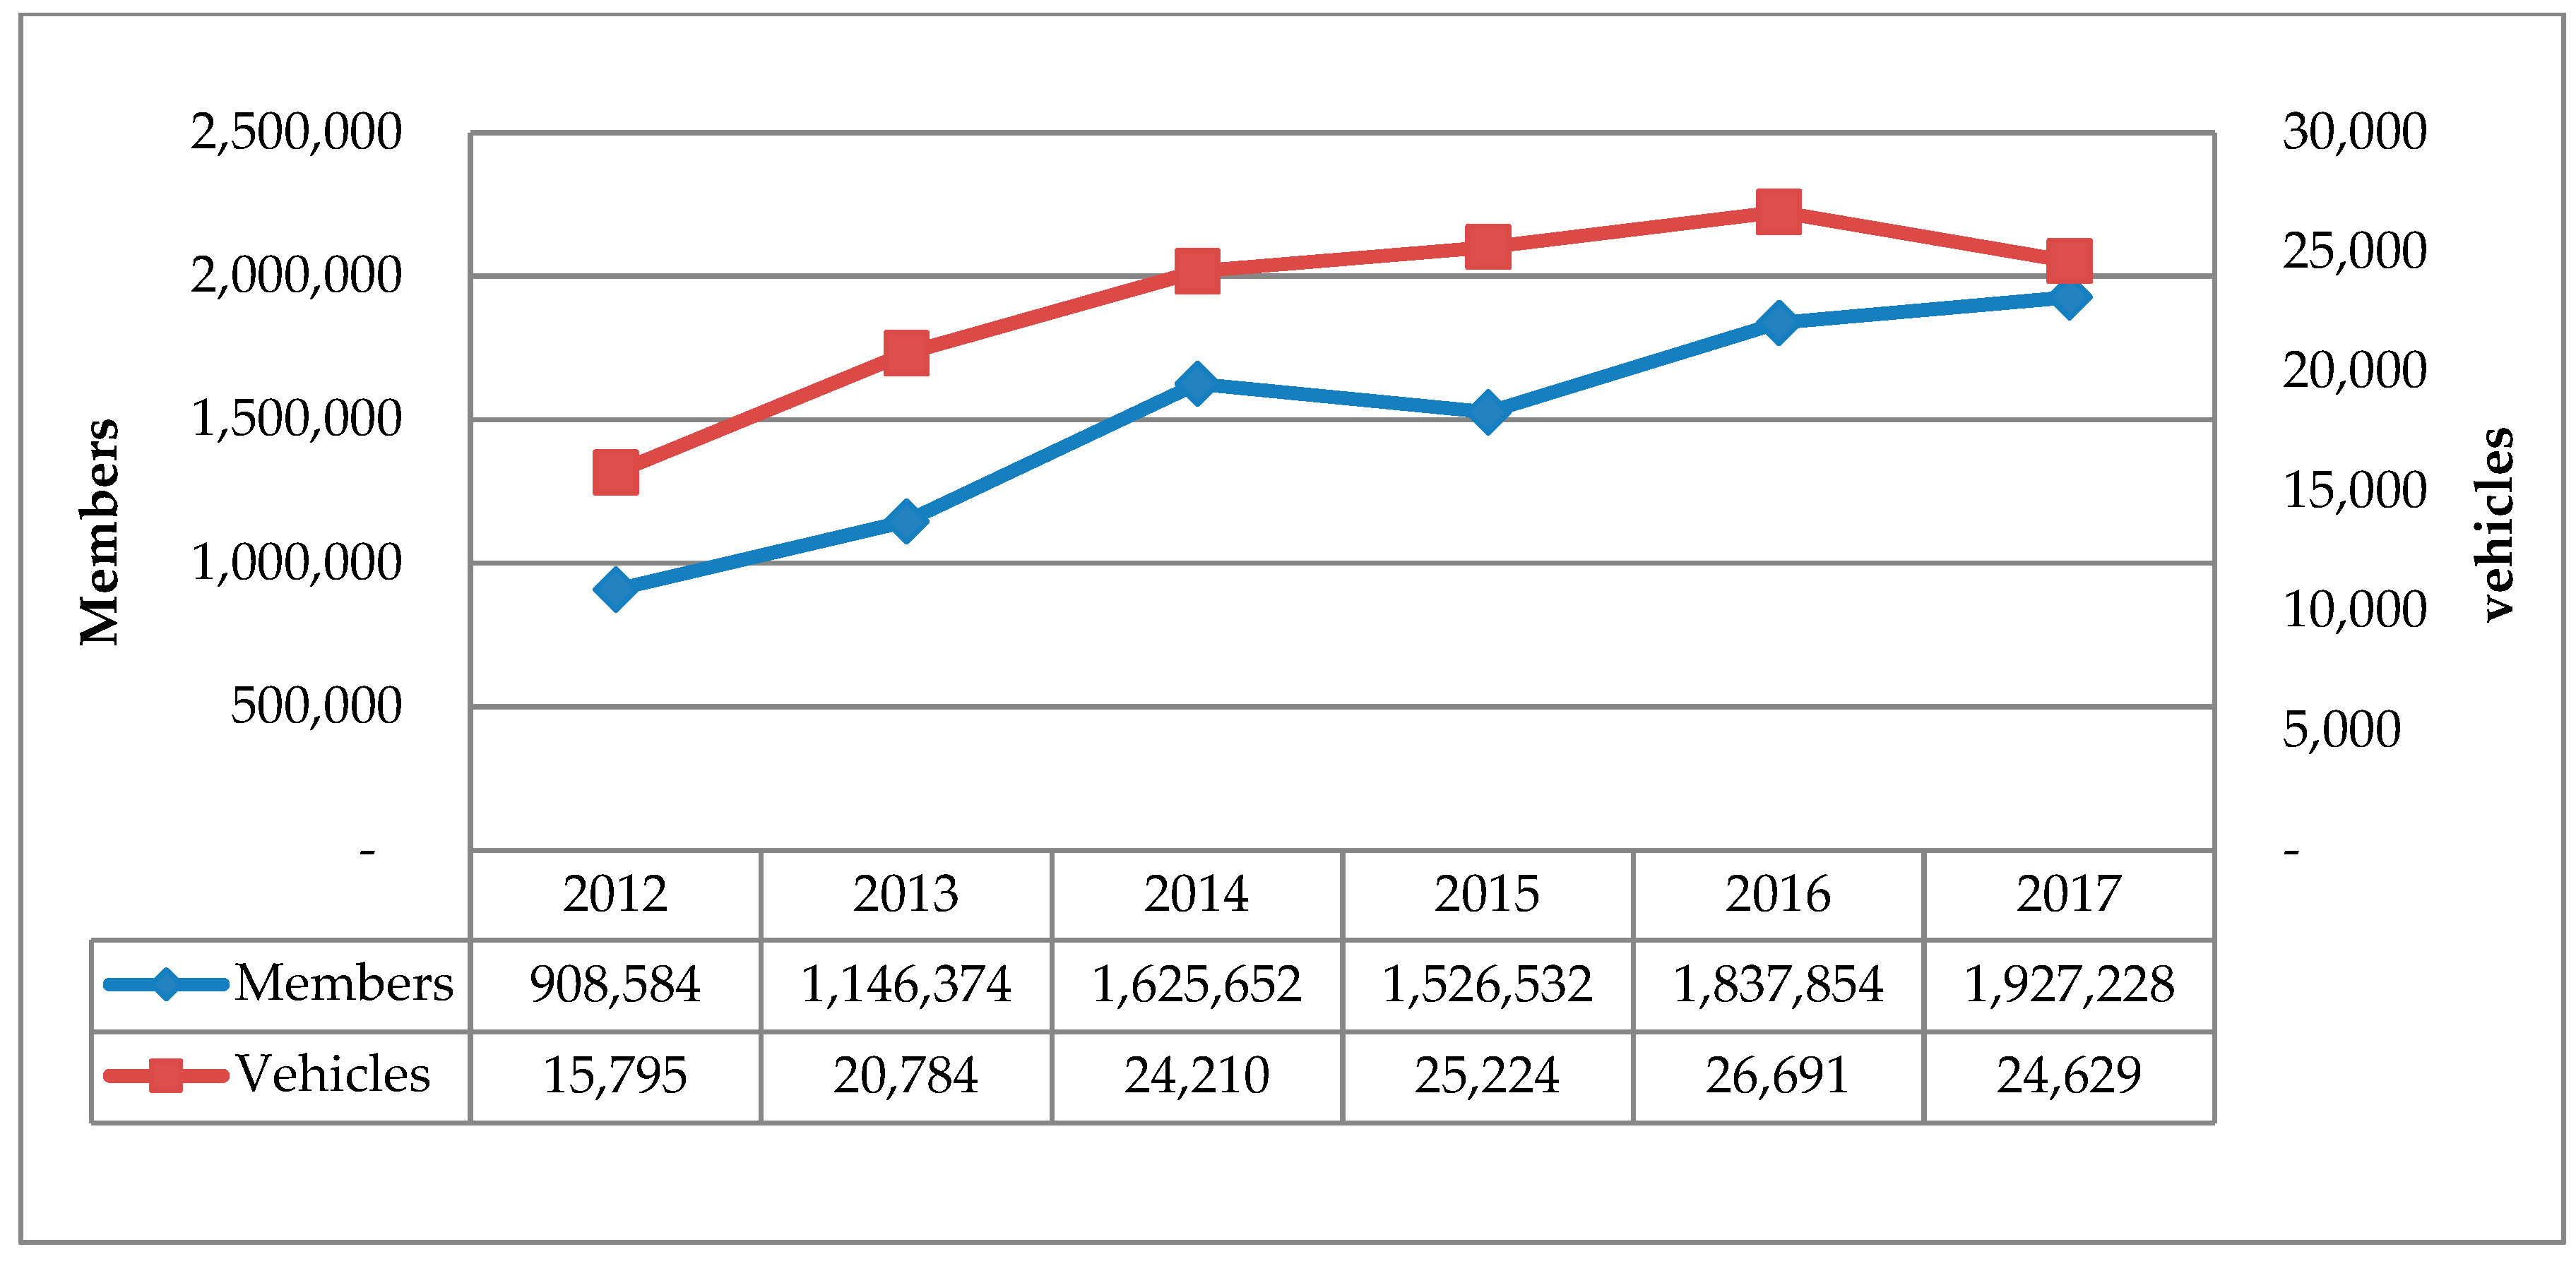
Figure 1.
Growth of car sharing in North America (Source: Shaheen, 2017) [34].
Figure 1.
Growth of car sharing in North America (Source: Shaheen, 2017) [34].

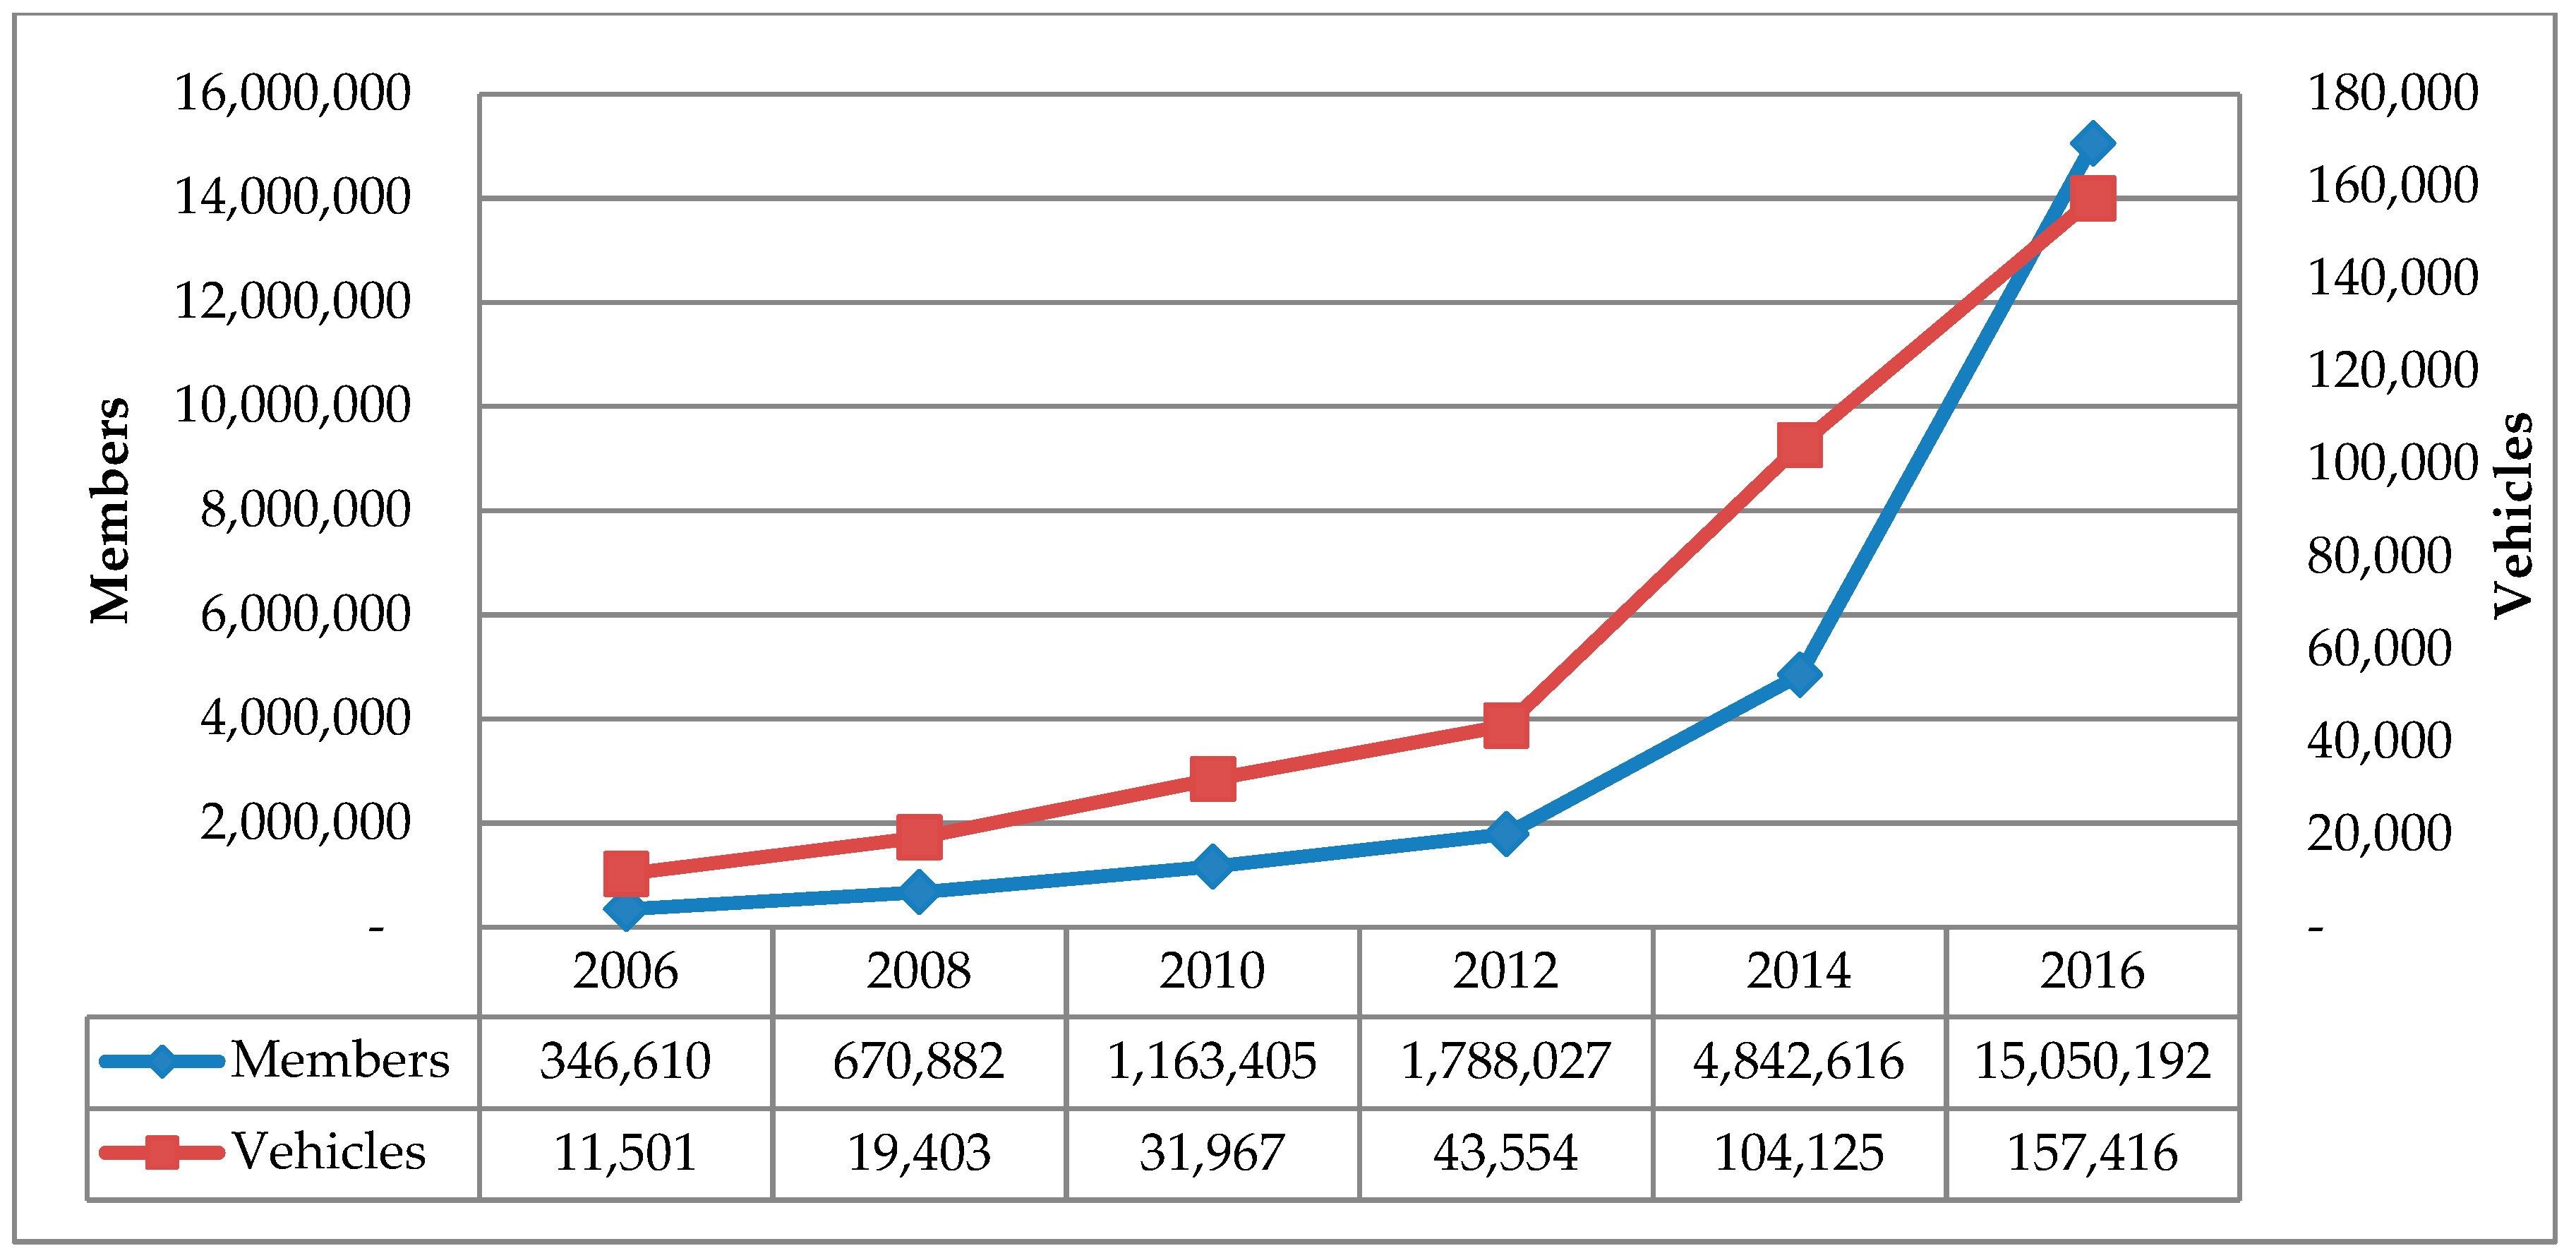
Figure 2.
Growth of car sharing worldwide (Source: Shaheen, Cohen, 2018) [35].
Figure 2.
Growth of car sharing worldwide (Source: Shaheen, Cohen, 2018) [35].

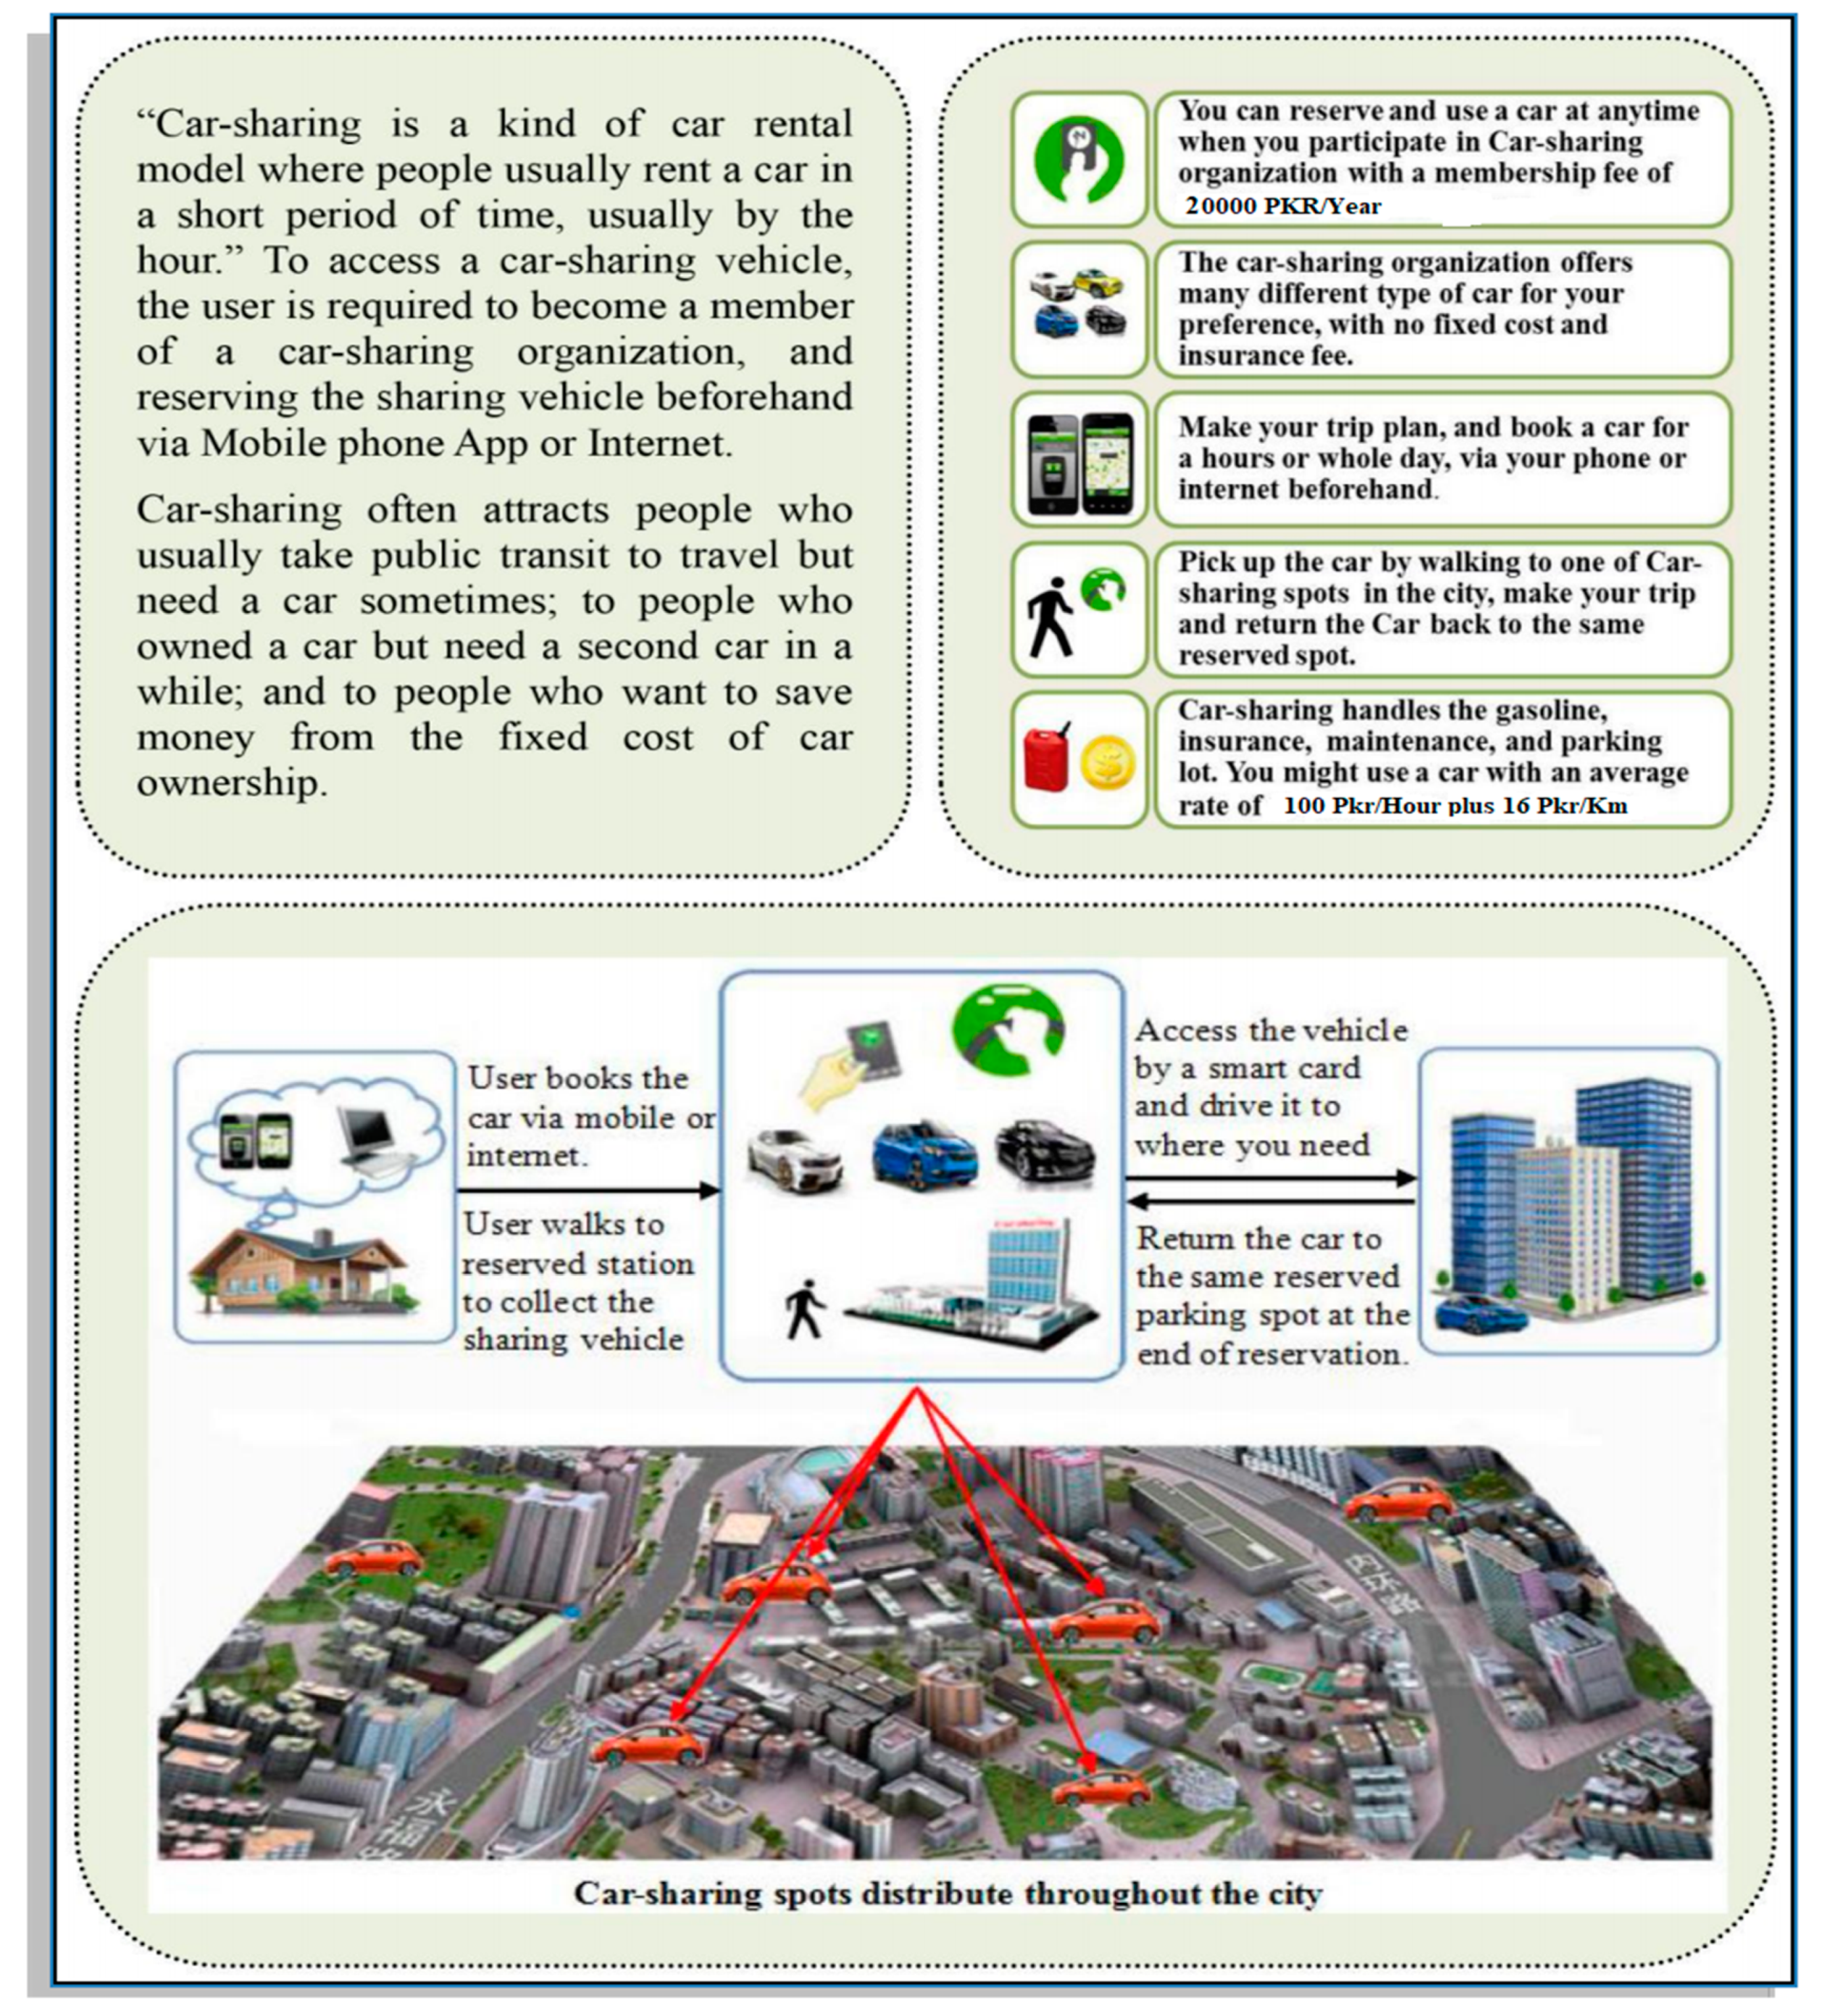
Figure 3.
Brochure of car sharing survey in Peshawar.

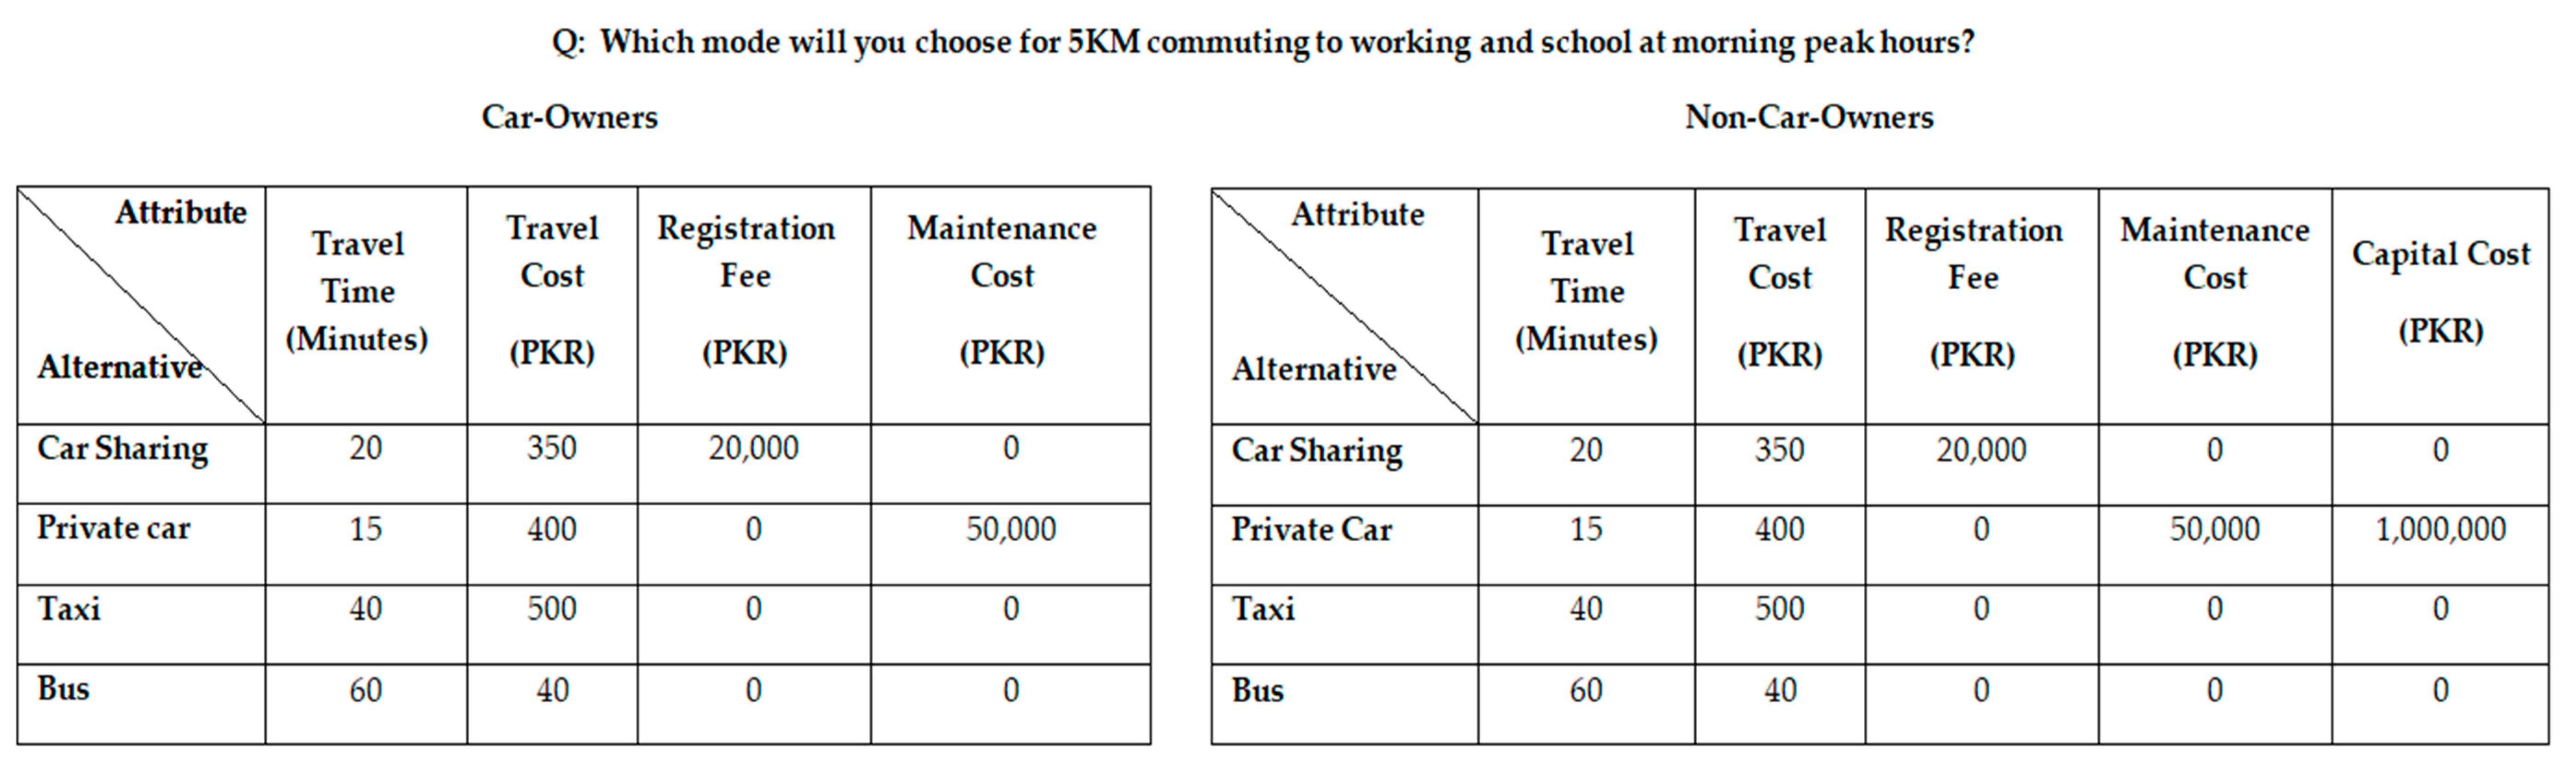
Figure 4.
Example of SP choice experiment (PKR, Pakistani Rupees; 1 PKR ≈ 0.008 USD).

Figure 5.
Peshawar city (Source: Google map).

Figure 6.
Car sharing awareness and perception.

Figure 7.
Diagram for mode choice.

Figure 8.
Utility of three alternatives for car–owners with increasing travel time.

Figure 9.
Utility of three alternatives for non-car–owners with increasing travel time.


Table 1.
Growth of motorization in Peshawar (Source development statistics of Khyber Pakhtunkhwa).
| Years | Motor Bikes | Motor Cars | Tractors | Buses | Taxies | Public Carrier (Trucks) | Other Vehicles | Total Vehicles |
|---|---|---|---|---|---|---|---|---|
| 2011 | 115,857 | 86,935 | 7753 | 20,384 | 37,298 | 28,340 | 102,620 | 399,187 |
| 2012 | 147,552 | 89,736 | 8012 | 20,822 | 43,287 | 29,726 | 121,233 | 460,368 |
| 2013 | 178,441 | 95,095 | 8164 | 21,416 | 47,487 | 30,357 | 140,190 | 521,150 |
| 2014 | 212,439 | 95,703 | 8223 | 21,446 | 49,665 | 30,769 | 158,987 | 577,232 |
| 2015 | 238,005 | 96,973 | 8301 | 21,497 | 51,979 | 31,078 | 159,276 | 607,109 |
Table 2.
Attributes design for all four alternatives.
| Level | Car Sharing | Personal Car | Taxi | Bus | |||||||
|---|---|---|---|---|---|---|---|---|---|---|---|
| Travel Time (Minutes) | Travel Cost (PKR) | Registration Fee (PKR) | Travel Time (Minutes) | Travel Cost (PKR) | Maintenance Cost (PKR) | Capital Cost (PKR) | Travel Time (Minutes) | Travel Cost (PKR) | Travel Time (Minutes) | Travel Cost (PKR) | |
| 1st | 20 | 350 | 20,000 | 15 | 300 | 30,000 | 1,000,000 | 40 | 500 | 60 | 20 |
| 2nd | 30 | 400 | 30,000 | 25 | 350 | 40,000 | 1,300,000 | 50 | 550 | 75 | 30 |
| 3rd | 40 | 450 | 40,000 | 35 | 400 | 50,000 | 1,600,000 | 60 | 600 | 90 | 40 |
Table 3.
Statistical description of socio-demographic characteristics.
| Attribute | Percentage of car-owners Population | Percentage of non-car-owners Population | Percentage of Total Population |
|---|---|---|---|
| Gender | |||
| Male | 29% | 39% | 68% |
| Female | 24% | 8% | 32% |
| Job | |||
| Employee | 26% | 36% | 62% |
| Student | 9% | 14% | 23% |
| Unemployed | 1% | 2% | 3% |
| Entrepreneur | 5% | 7% | 12% |
| Monthly income (PKR) | |||
| 0 to 30,000 | 10% | 19% | 29% |
| 31,000 to 60,000 | 11% | 20% | 31% |
| 61,000 to 90,000 | 12% | 9% | 21% |
| 91,000 to 120,000 | 7% | 4% | 11% |
| More then 120,000 | 6% | 2% | 8% |
| Driving license | |||
| Yes | 35% | 19% | 54% |
| No | 2% | 44% | 46% |
| Age groups | |||
| 18 To 30 Years | 11% | 14% | 25% |
| 31 To 40 Years | 12% | 19% | 31% |
| 41 T0 50 Years | 8% | 15% | 23% |
| More then 50 | 8% | 13% | 21% |
| Education background | |||
| Undergraduate | 18% | 32% | 50% |
| Master and above | 12% | 10% | 22% |
| High School | 9% | 15% | 24% |
| Under High School | 1% | 3% | 4% |
| Travel in one week | |||
| 1–2 days | 5% | 14% | 19% |
| More than 2 days | 35% | 46% | 81% |
Table 4.
Estimation results of car-owners.
| Variables | Multinomial Logit Model | Nested Logit Model | |||||||
|---|---|---|---|---|---|---|---|---|---|
| Car Sharing | Personal Car | Taxi | Bus | Car Sharing | Personal Car | Taxi | Bus | ||
| Coef t-Value | Coef t-Value | Coef t-Value | Coef t-Value | Coef t-Value | Coef t-Value | Coef t-Value | Coef t-Value | ||
| β0 | Constant | 5.82 (5.98 ***) | 2.94 (2.77 *) | 3.90 (3.35 ***) | - | 2.85 (3.27 ***) | 2.10 (3.138 ***) | 2.55 (3.49 ***) | - |
| βgd | Gender 1 = Male, 0 = Female | −0.679 (−2.47 *) | −0.589 (−2.34 *) | −0.482 (−1.62) | - | −0.580 (−2.3193 *) | −0.549 (−2.2162 *) | −0.561 (−2.22 *) | - |
| βinc | Income 1 = More then 61,000, 0 = Otherwise | 0.151 (0.55) | 0.569 (2.30 *) | 0.703 (2.33 *) | - | 0.399 (1.3131) | 0.452 (1.9290′) | 0.529 (2.0708 *) | - |
| βjob | Job 1 = Employee, 0 = Otherwise | −0.736 (−2.32 *) | −0.082 (−0.27) | −0.842 (−2.42 *) | - | −0.473 (−1.547) | −0.292 (−0.8793) | −0.491 (−1.5683) | - |
| βtd | Trip Distance 1 = More than 10 km, 0 = Otherwise | −0.220 (−0.72) | 0.259 (0.97) | 0.477 (1.25) | - | −0.409 (−1.4365) | −0.243 (−06080) | −0.567 (−1.0653) | - |
| βto | Trip Occupants 1 = Travelling with friend and family, 0 = Otherwise | −1.12 (−2.98 **) | −0.657 (−1.91′) | −0.378 (−0.89) | - | 0.567 (−1.0653) | 0.0433 (−0.8922) | −0.339 (−0.8922) | - |
| βtp | Trip Purpose 1 = Working, schooling, 0 = Otherwise | −0.517 (−1.30) | 0.110 (0.58) | −1.28 (−2.71 *) | - | 0.0146 (0.2553) | 0.0369 (0.7583) | 0.00680 (−0.0968) | - |
| βrf | Registration fee | −8.86 × 10⁻⁵ (−5.46 ***) | - | - | - | −2.1437 × 10⁻⁵ (−1.0287) | - | - | - |
| βmc | Maintenance Cost | - | −2.97 × 10⁻⁵ (−1.91′) | - | - | - | −7.4906 × 10⁻⁶ (−1.0198) | - | - |
| βtc | Travel Cost | −0.00702 (−3.48 ***) | −2.1059 × 10⁻³ (−1.0193) | ||||||
| βtt | Travel Time | −0.0351 (−3.96 ***) | −1.4930 × 10⁻² (−1.0370) | ||||||
| Inclusive value (iv) | _ | 2.7414 × 10⁻¹ (1.0425) | |||||||
| Observation: 740 Initial log likelihood = −1009.222 Final log likelihood = −836.470 McFadden = 0.17 | Observation: 740 Initial log likelihood = −962.88 Final log likelihood = −831.71 McFadden = 0.13 | ||||||||
′, *, **, and *** indicate statistical significance of p < 0.1, p < 0.05, p < 0.01, and p < 0.001, respectively.
Table 5.
Estimation results of non-car-owners.
| Variables | Multinomial Logit Model | Nested Logit Model | |||||||
|---|---|---|---|---|---|---|---|---|---|
| Car Sharing | Personal Car | Taxi | Bus | Car Sharing | Personal Car | Taxi | Bus | ||
| Coef t-Value | Coef t-Value | Coef t-Value | Coef t-Value | Coef t-value | Coef t-Value | Coef t-Value | Coef t-Value | ||
| β0 | Constant | 3.85 (5.41 ***) | 2.02 (1.70′) | 2.54 (2.94 **) | - | 1.70 (5.62 ***) | 1.77 (5.83 ***) | 1.69 (5.57 ***) | _ |
| βgd | Gender 1 = Male, 0 = Female | −0.556 (−3.21 *) | −0.072 (−0.33) | −0.451 (−2.78 *) | - | −0.412 (2.4600 *) | −0.421 (−2.5111 *) | −0.414 (−2.4697 *) | - |
| βinc | Income 1 = More then 61,000, 0 = Otherwise | 0.0379 (0.21) | 2.02 (0.00) | 0.099 (0.58) | - | 0.125 (0.7026) | 0.123 (0.6961) | 0.234 (0.6934) | - |
| βjob | Job, 1 = Employee, 0 = Otherwise | −0.299 (−1.39) | −0.082 (−1.26) | −0.254 (−1.26) | - | −0.251 (−1.096) | −0.253 (−1.1040) | −2.531 (−1.1019) | - |
| βtd | Trip Distance 1 = More than 10 km, 0 = Otherwise | −1.14 (−4.88 ***) | 0.096 (0.36) | 0.266 (−0.76) | - | −0.829 (−4.87 ***) | −0.851 (−5.01 ***) | −0.857 (−5.04 ***) | - |
| βto | Trip Occupants 1 = Travelling with friend and family, 0 = Otherwise | 0.380 (1.12) | 1.62 (4.37 ***) | 0.552 (−1.72′) | - | 1.139 (4.99 ***) | 1.37 (4.92 ***) | 1.39 (4.97 ***) | - |
| βtp | Trip Purpose 1 = Working, schooling, 0 = Otherwise | 0.545 (2.32 *) | −0.659 (−1.80′) | −0.840 (−3.29 ***) | - | −0.497 (−0.286) | −0.460 (−0.266) | −0.21 (−0.1212) | - |
| βrf | Registration fee | −8.40 × 10⁻⁵ (−6.32 ***) | - | - | - | −9.3607 × 10⁻⁸ (−3.1059 ***) | - | - | - |
| βcc | Capital Cost | - | −2.33 × 10⁻⁷ (−3.54 ***) | - | - | - | −2.8334 × 10⁻⁶ (−4.74 ***) | - | - |
| βmc | Maintenance Cost | - | −2.81 × 10⁻⁵ (−1.53) | - | - | - | −8.1666 × 10⁻⁸ (−0.2227) | - | - |
| βtc | Travel Cost | −0.00359 (−2.15 *) | −1.2857 × 10⁻⁴ (−3.7862 ***) | ||||||
| βtt | Travel Time | −0.0166 (−1.94′) | −1015 × 10−3 (−4.9093 ***) | ||||||
| Inclusive (iv) | - | −1.6471 × 10⁻² (−4.0298) | |||||||
| Observation: 1072 Initial log likelihood = −1486.108 Final log likelihood = −1268.840 McFadden = 0.15 | Observation: 1072 Initial log likelihood = −1473.37 Final log likelihood = −1267.1 McFadden = 0.14 | ||||||||
′, *, **, and *** indicate statistical significance of p < 0.1, p < 0.05, p < 0.01, and p < 0.001, respectively.
© 2019 by the authors. Licensee MDPI, Basel, Switzerland. This article is an open access article distributed under the terms and conditions of the Creative Commons Attribution (CC BY) license (http://creativecommons.org/licenses/by/4.0/).
Share and Cite
MDPI and ACS Style
Ullah, I.; Liu, K.; Vanduy, T. Examining Travelers’ Acceptance towards Car Sharing Systems—Peshawar City, Pakistan. Sustainability 2019, 11, 808. https://0-doi-org.brum.beds.ac.uk/10.3390/su11030808
AMA Style
Ullah I, Liu K, Vanduy T. Examining Travelers’ Acceptance towards Car Sharing Systems—Peshawar City, Pakistan. Sustainability. 2019; 11(3):808. https://0-doi-org.brum.beds.ac.uk/10.3390/su11030808
Chicago/Turabian StyleUllah, Irfan, Kai Liu, and Tran Vanduy. 2019. "Examining Travelers’ Acceptance towards Car Sharing Systems—Peshawar City, Pakistan" Sustainability 11, no. 3: 808. https://0-doi-org.brum.beds.ac.uk/10.3390/su11030808
Note that from the first issue of 2016, this journal uses article numbers instead of page numbers. See further details here.