Environmental Factors and Sustainability of the Circular Economy Model at the European Union Level


1
Faculty of Agrifood and Environmental Economics, The Bucharest University of Economic Studies, 6 Piata Romana, 1st district, 010374 Bucharest, Romania
2
Faculty of Management, The Bucharest University of Economic Studies, 6 Piata Romana, 1st district, 010374 Bucharest, Romania
*
Author to whom correspondence should be addressed.
Sustainability 2019, 11(4), 1114; https://0-doi-org.brum.beds.ac.uk/10.3390/su11041114
Submission received: 30 December 2018
/
Revised: 1 February 2019
/
Accepted: 14 February 2019
/
Published: 20 February 2019
Abstract
:In this paper, we develop a methodology for studying the sustainability of the circular economy model based on environmental factors. In open-end systems, waste is converted back to materials and objects through recycling; hence, a linear economy is transformed into a circular economy. Environmental factors support an argument for the sustainable implementation of a circular economy. As humans are producing and using more and more matter and energy for the economy, the environment and recycling become more and more important factors affecting public health. The aim of this study is to present the economic factors of the sustainable development of a circular economy, based on the findings of the economic literature in the field. Starting with the Mankiw–Romer–Weil model of economic growth based on resource productivity, environmental employment, recycling rate and environmental innovation, three statistical hypotheses were validated through a panel data model with the use of the statistical software EViews 9. An econometric analysis was performed for 27 European Union countries between 2007 and 2016. The results highlight that the extended Mankiw–Romer–Weil model is determined by resource productivity, environmental employment, recycling rate and environmental innovation. Investing in recycling infrastructure and innovative resources is essential for the econometric model presented in our analysis, which is in line with the aims of environmental protection and sustainable economic growth.
1. Introduction
The limited amount of resources is a concern for economists as well as for governments, who are faced with finding the best solution to respond to the challenges of increasingly growing consumerist economies and climate change. Involving many countries in combating pollution and ratifying the Kyoto Protocol creates a premise for achieving a cleaner and more sustainable environment.
A circular economy, based on recycling, reconditioning and reusing processes, has the potential to increase sustainable economic growth, contribute to job creation for the economy and eventually drive entrepreneurs to invest in supporting programs [1,2].
The economic literature of the past two decades abounds with economic and econometric studies quantifying the impact of waste and environment management programs on economic development of countries, with respect to a general equilibrium model.
For instance, in Sweden, Ljunggren Söderman et al. [3] analysed the interconnection of solid waste program management in the context of a general equilibrium model in order to find the right answer to the request of the Swedish Parliament for a percentage reduction in the amount of waste in relation to the growth indicator [4]. We acknowledge that Sweden is one of the countries with a high degree of waste reuse, being among the top-ranking Member States of the European Union (EU). Other economists [5] studied the influence on the Gross Domestic Product (GDP) of the dangerous waste fees resulting from mining activities in South Africa. It should be mentioned that the two continents of Asia and Africa rank last in terms of their waste reuse rate, while North America and Europe are the top-ranking continents and include the most highly industrialized countries.
The assessment of the effects generated by environmental policies on economic growth has been conducted by various active international organizations, such as the Organization on Economic Cooperation and Development (OECD) [6] or by European institutions, such as the European Commission [7].
Other economists [8,9] analysed the influence of dangerous waste fees on the GDP of South Africa, resulting from mining activities. It is worth mentioning that the two continents of Europe and North America have the highest waste reuse rates, while Asia and Africa have the lowest rates, as these continents include some of the least industrialized countries worldwide.
The C2C (cradle to cradle) concept, which is specific to a regenerative sustainable circular economy, was first introduced by the economists Braungart and McDonough [10] and involves the recycling of waste and its transformation to new products. It is used in models which evaluate the production of renewable and clean energy, the diversity of ecosystems and the use of the green energy sources [11,12]. In contrast to this, other authors [13,14] have criticized the C2C formula used in industrial processes, where products are transformed to waste, usually without being reused.
- Regulatory tools, consisting of rules adopted by the public authorities regarding environmental protection;
- Economic tools, consisting of taxes and fees collected by governments in order to stimulate green production;
- Administrative tools, including the procedures used for the control of installations and the authorization for waste treatment; and
- Communication tools, which enforce the use of ecolabels and the collection of separated materials for further use.
Maintaining a sustainable ecosystem should be a worldwide policy priority. The environmental programs developed by the United Nations (UN) reflect these concerns and propose adequate tools to enhance the benefits of maintaining a green planet. The Ellen MacArthur Foundation, a well-known organization created in 2010, made a valuable contribution to the appraisal of European policies for a sustainable environment. In its report [17], the organization underlines that a sustainable circular economy would help Europe to increase its productivity by up to 3 percentage points annually. According to the study, this will generate a primary resource benefit of up to 0.6 trillion euros by 2030, producing a 7-percentage point GDP growth at the EU level, compared to the current development, with assured growth in employment.
This paper has the following structure. In the first part, we conduct an analysis of the key factors of the circular economy in EU countries. Then, the multiple linear regression model is estimated. The hypotheses of the research are presented and further tested. The regression model is subsequently developed as an extension of the growth model developed by Mankiw, Romer and Weil, based on the Cobb–Douglas production function. Limitations of the study, further research and conclusions are summarized in the last section of the article.
2. Theory and Methods
The relationship between economic growth and the circular economy has been analysed in a number of research articles. It has been demonstrated that there is a close link between resource productivity, recycling rate and economic growth [18,19]. Other authors [20,21] concluded that human capital and innovation for environmental benefits have a positive impact on economic growth.
A description of the indicators used in our analysis is presented in the following section.
2.1. Descriptive Analysis of the Evolution of the Economic Indicators Specific to a Circular Economy at the EU Level
A sustainable circular economy, in contrast to a linear economy, is based on economic models and renders additional economic value and use of resources. In this paper we use several economic indicators which have a direct and significant impact on economic growth to describe a circular economy. These indicators are used as proxy variables in the multilinear regression model described in the next section.
Econometric analyses of the sustainable circular economy at the EU level have been modelled in a number of research papers. It has been proved that there is a link between economic growth and the circular economy [22,23,24]. Other authors [25,26,27] concluded that renewable energy use, the degree of recycling and the degree of the environmental innovation have positive impacts on the economic growth.
Figure 1, Figure 2, Figure 3 and Figure 4 give us an overview of the circular economy use and the degree of development in European Union countries.
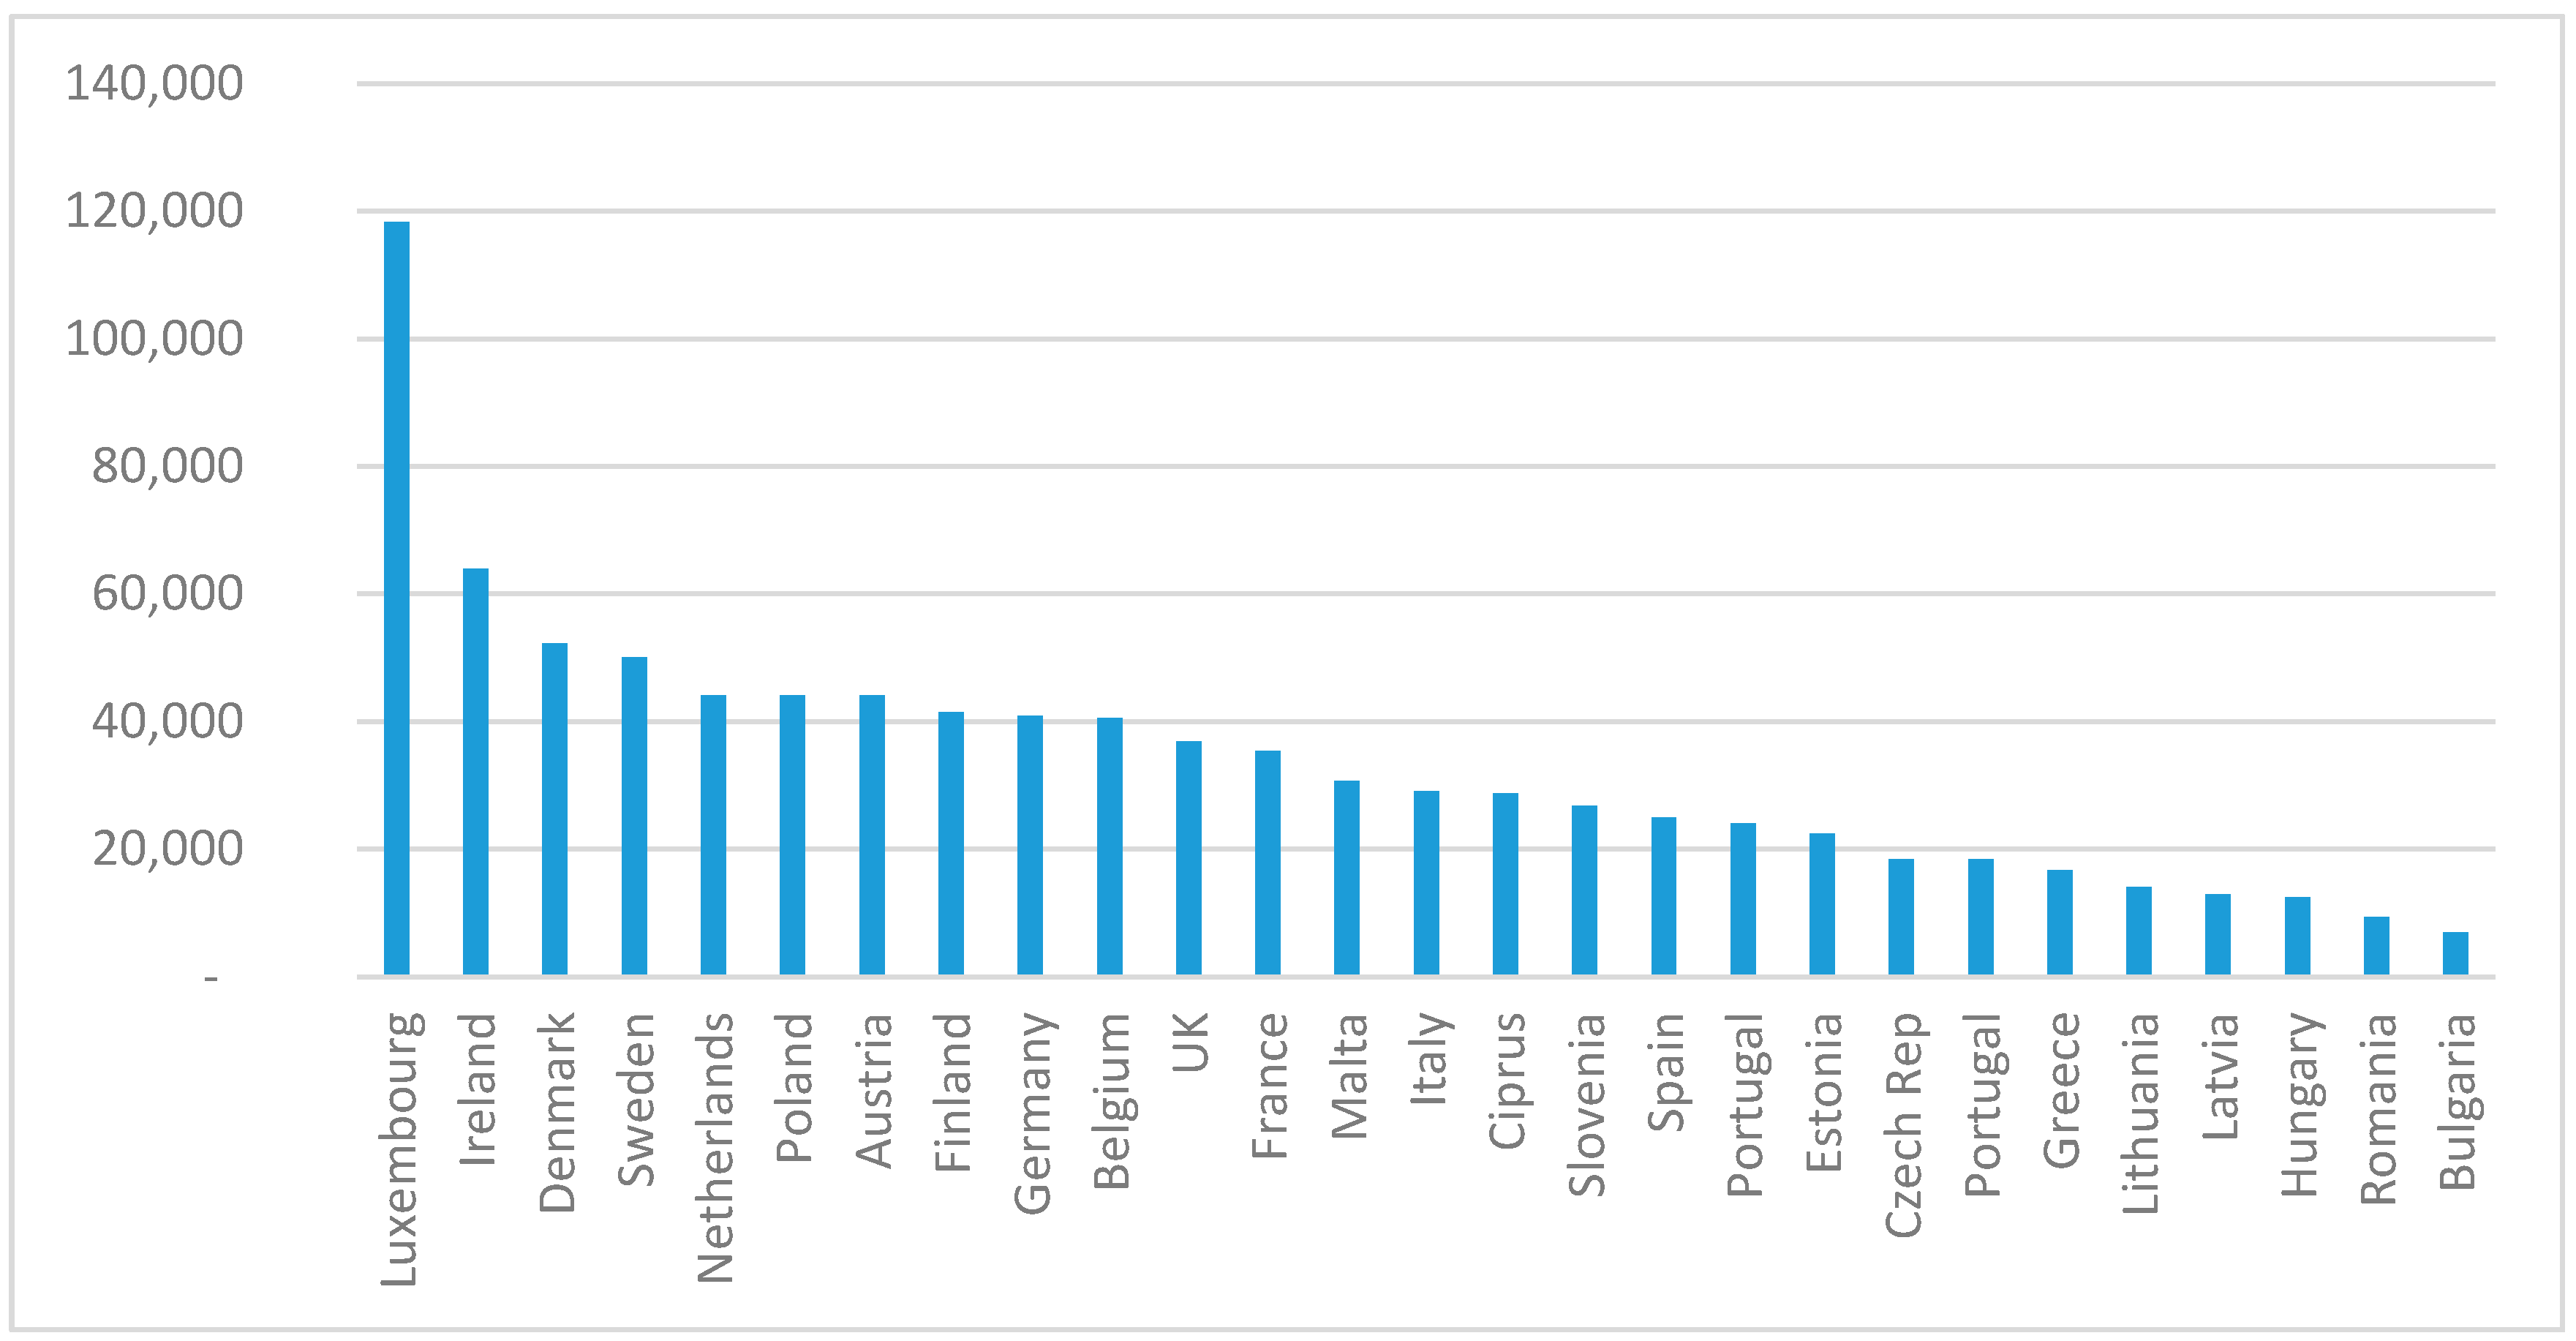
In Figure 1, the GDP per capita in EU countries in 2017 is displayed.
The graph above reveals the fact that, in 2017, the countries with the least GDP per capita were Hungary, Romania and Bulgaria, while the countries with the highest GDP per capita were Luxembourg, Ireland and Denmark.
Figure 2 gives an image of the recycling rates of municipal waste in EU countries in 2017.
From this graph, according to Eurostat, we concluded that highest recycling rates of e-products were in Bulgaria (58.2%), Sweden (55.6%) and Denmark (51.3%), while the lowest recycling rates were in Romania (21.2%), Cyprus (12.2%) and Malta (11.8%).
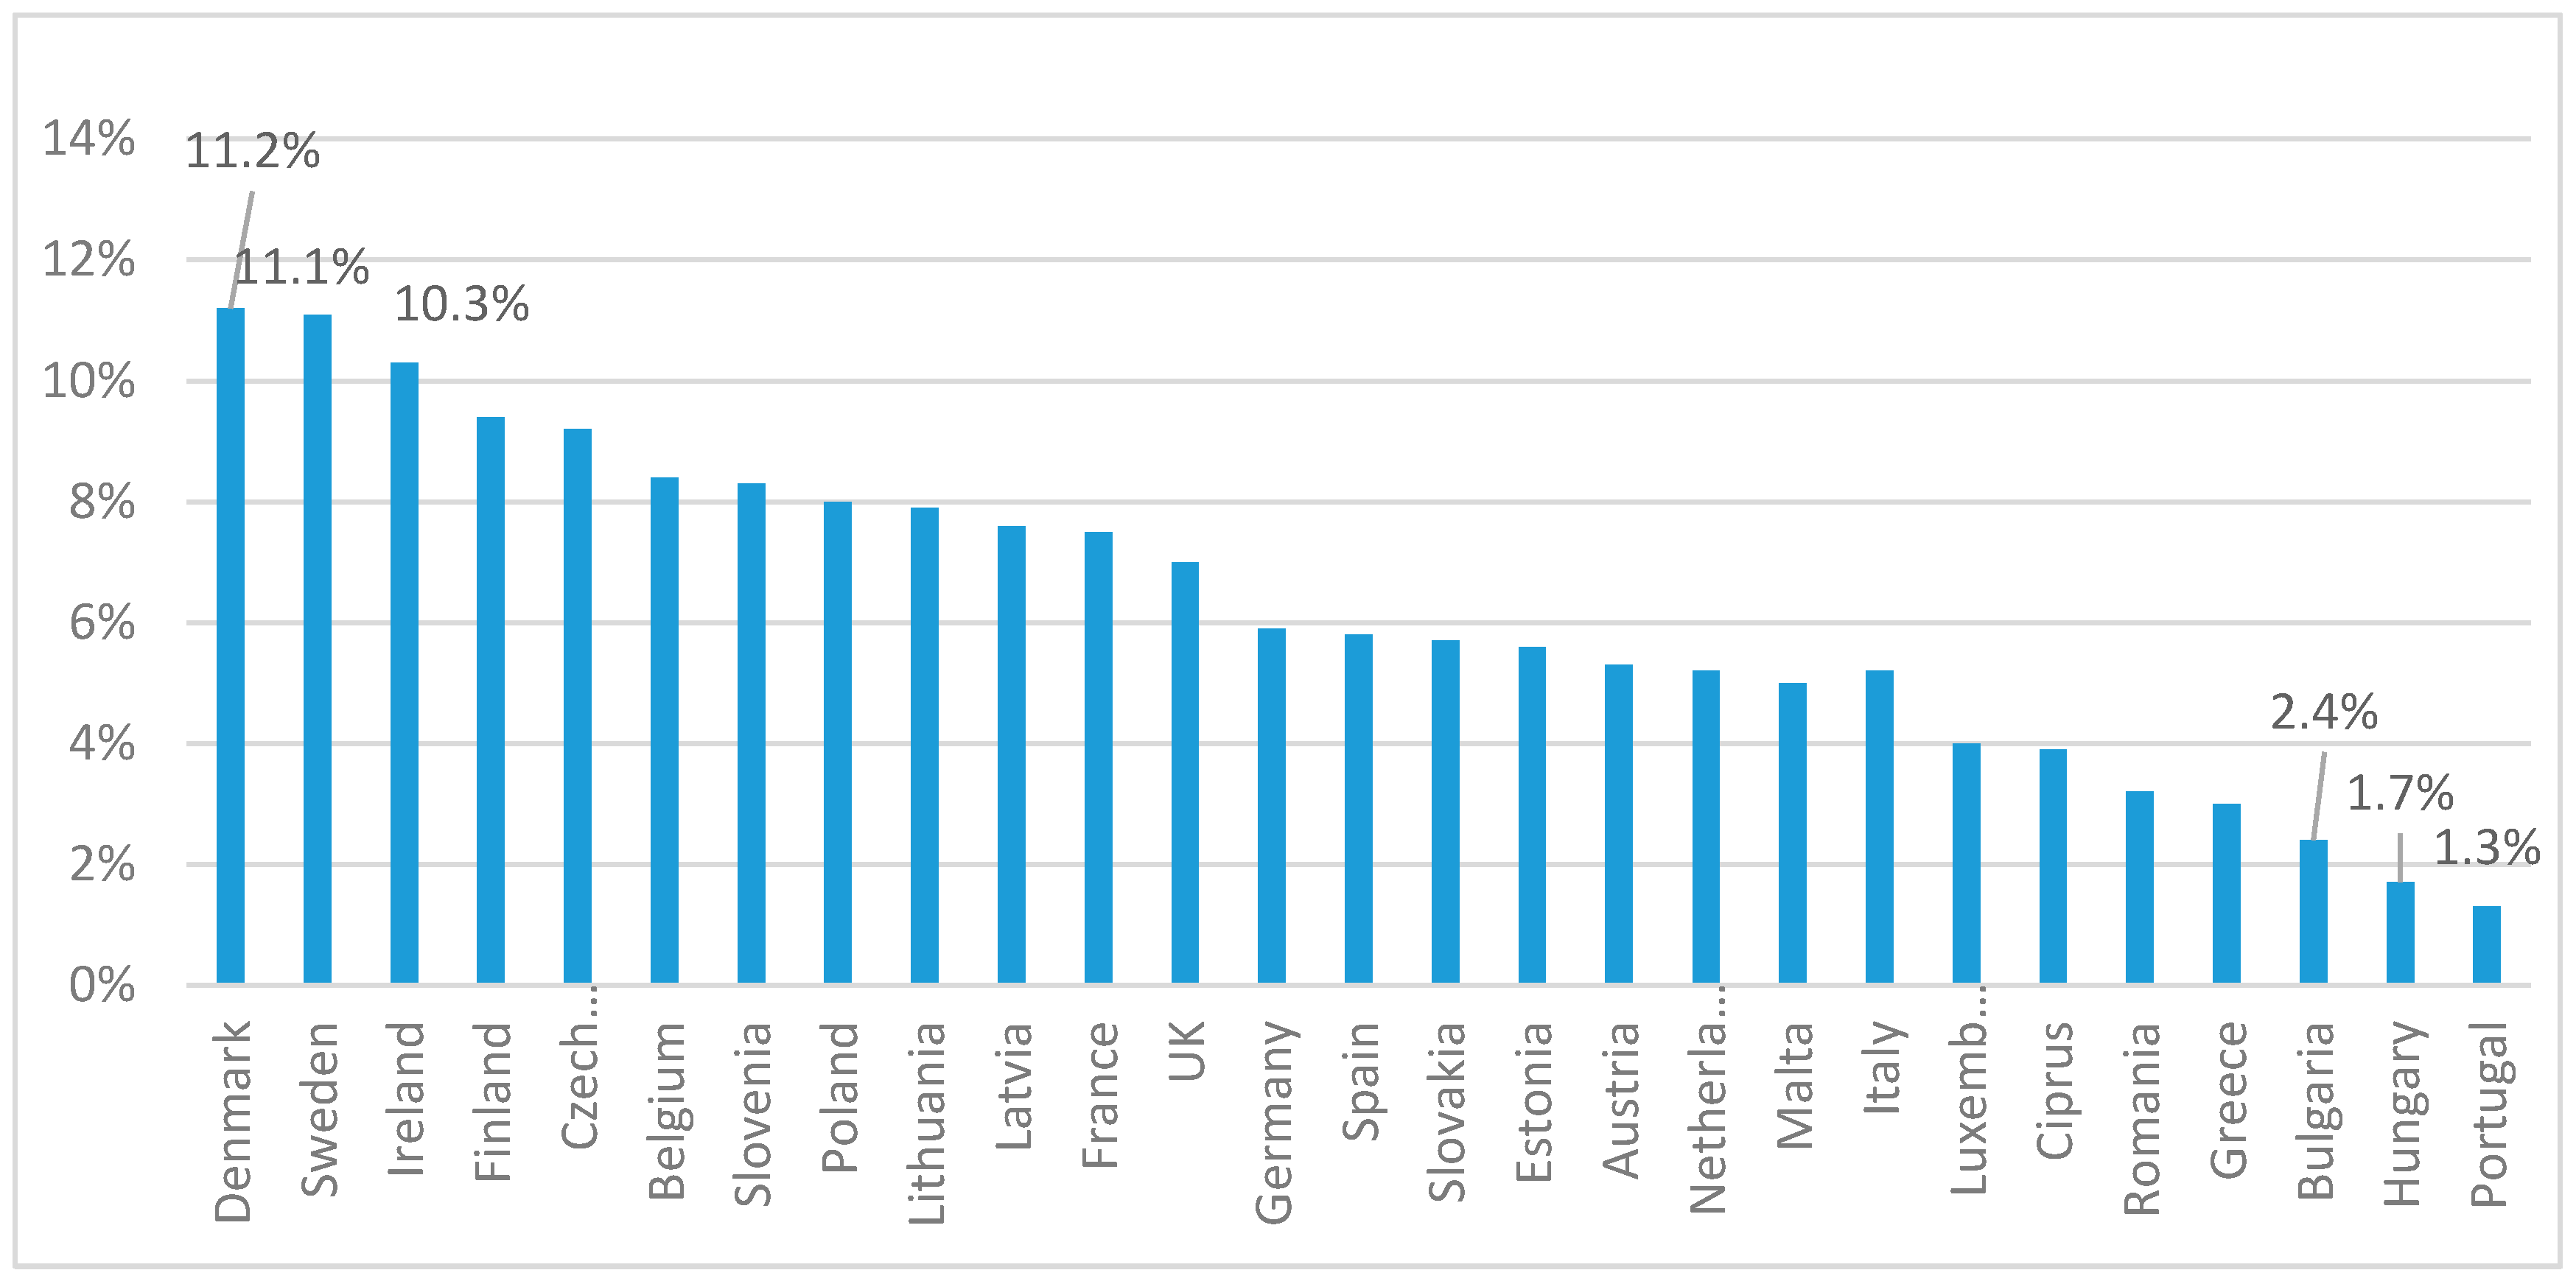
An important factor of the circular economy, as it is illustrated by the economic literature, is “the labour force employed in the production of goods and services for environmental protection.” The values of this indicator at the EU level in 2017 are illustrated in Figure 3.
This chart reveals the fact that the EU countries with the lowest percentages of employees in this area were Bulgaria (2.4%), Hungary (1.7%) and Portugal (1.3%), while the countries with the highest percentages of workers employed in the production of goods and services for environmental protection, out of the total active population, were Denmark (11.2%), Sweden (11.1%) and Ireland (10.3%).
Another relevant indicator for sustainable circular economy development is the share of innovative undertakings that have introduced innovations for environmental benefit in EU countries. The results (as of 2017) are shown in Figure 4.
From the graph above, we can see that Germany ranked first (62.6%), followed by Austria (61.3%) and Finland (60.2%). Romania and Bulgaria were positioned in the last places among EU member states, with shares of 23.3% and 19.6% of companies which brought innovative new products with environmental benefits on the market, respectively. However, the reduced rates could be explained by the existent traditional linear economies of these countries, which are based on the use of natural resources.
Another important circular economy indicator is resource productivity. It is measured as the percentage of domestic consumption of the materials from the GDP. This ultimately shows the economic efficiency of EU member states in using domestic materials to produce a sustainable economy. Figure 5 shows the values of this indicator for all 28 EU countries (as of 2017) expressed in percentages.
From Figure 5, we can see that the most efficient member states with respect to the use of materials, with reduced and efficient consumption, were Luxembourg (4.2%), the Netherlands (4.03%) and Italy (3.7 %), while on the last three places were filled by Latvia (0.47%), Romania (0.35%) and Bulgaria (0.31%).
Hence, the descriptive analysis of the indicators used to analyse the sustainability of the circular economy indicated that the Nordic countries are the closest to achieving a circular economy. On the other hand, owing to the European Directives which are required to be implemented by all 28 EU member states, all mentioned countries have made considerable steps in implementing a sustainable circular economy through investments in environmental protection and infrastructure and by increasing the recycling of e-products.
The economic indicators described above reveal the importance of resource productivity, recycling rate, environmental employment and innovation as circular economy factors at the EU level. Thus, a quantitative factorial analysis on the impact of these factors on economic growth can be made.
2.2. The Concrete Panel Data Model for the EU Circular Economy between 2007 and 2016
The EU has 28 member states which joined the union at different times. In the past 20 years, there were three moments when new countries joined the EU: in 2004, 10 new member states joined the EU; in 2007, 2 new states joined the EU; and in 2013, one new state joined the EU. Due to data availability, our analysis covers the period from 2007, the year when Romania and Bulgaria joined the European Union, to 2016.
The impact of the circular economy on economic growth has been studied by many researchers. Some economists [28] argued that there is a close connection between a circular economy and economic growth. Some authors [29,30,31] demonstrated that innovation for environmental benefit and human capital have a direct and strong impact on economic growth, while other economists concluded that recycling activity is one of the main factors of a circular economy with a significant impact on economic growth [32,33] The productivity of resources is a fundamental concept for the circular economy, which relates to the identification of necessary measures to keep natural inputs and resources within the economic cycle for as long as possible [34]. Out of the variables that define the circular economy concept, we used the productivity of resources, expressed as a ratio of the GDP to domestic material consumption. As a measure of the reinsertion of used materials into production activities, we used the recycle rate of electronic products. As a circular economy is mainly based on research and innovation, we used two indicators in this field, namely innovation with environmental benefit and the number of employees in environmental protection activities. These indicators have been used to assess the impact on some standard macroeconomic variables associated with sustainable development, such as the real GDP growth rate.
Starting with these empirical results, we focused our analysis on the research question: “What are the factors that positively impact the EU’s economic growth and to what extent does a circular economy affect this growth indicator?” To answer this question, we estimated which of the following four independent variables, that is, resource productivity, labour force employed in the production of goods and services for environmental protection, recycling rate and percentage of undertakings that have introduced innovations for environmental benefit on the market, has a significant impact on the dependent variable.
In order to analyse the statistical impacts of the exogenous variables on the endogenous one, we formulated three statistical hypotheses (Table 1).
Interconnected aspects between the three hypotheses were revealed by previous studies [35,36,37] which argue that there is a strong connection between recycling, environmental protection and innovation which should be always considered when analysing the impact of a circular economy on economic growth.
The hypotheses formulated above were tested using an econometric model starting from the production function developed by Mankiw–Romer–Weil. The regression equation is modelled in the next section. This function helped us to create a multiple linear regression model in which the endogenous variable is economic growth while resource productivity, environmental employment, recycling rate and environmental innovation are the exogenous variables.
A multiple linear regression model that has economic growth as a dependent variable should use both predictive and control variables as independent variables [38]. The model could be used for a wide range of applications, such as covariance and average estimation, although it has a simple parametric structure. Considering that there were only 27 member states in the EU at the starting point of 2007, the statistical research was based on a panel-data analysis. Hence, the independent variables used in the model were split into prediction variables (recycling rate and environmental innovation) and control variables (resource productivity and environmental employment).
Thus, the multiple linear regression model [39] is defined as follows:
where:
- t = time; T = number of years (T = 10);
- i = transversal section index; N = number of countries (N = 27);
- = endogenous variable;
- = the “it” observation of the exogenous variables;
- = fixed or random effects;
- = column vector of parameters; ;
- = white noise.
Using the dependent and independent variables described above, our regression equation becomes:
in which:
Economic growth = β0 + β1 (resource productivity)t + β2 (environmental employment)t +
β3 (recycling rate)t + β4 (environment innovation)t
β3 (recycling rate)t + β4 (environment innovation)t
- Economic growth—the explained variable—is computed as the increasing rate of GDP/capita;
- GDP/capita was implemented in the model to define the effect of the convergence between EU countries [40];
- Resource productivity is the ratio between GDP and domestic material consumption. In our model it was used as a proxy variable for labour productivity.
- Environmental employment is the human capital employed in activities related to environmental protection. This reveals the economic growth of each country due to capital increases. We expected that this variable would have a positive impact on economic growth;
- Recycling rate of electronic products is computed for each EU member state. In this case, we expected a positive coefficient in the multilinear regression model;
- Environment innovation represents the percentage of the undertakings that have brought innovations for environmental benefit.
Data gathered for these dependent and independent variables were based on data from The Statistical Office of the European Union (EUROSTAT).
2.3. Estimation of the Econometric Model
In 1992, economists Gregory Mankiw, David Romer and David Weil [38] created a macroeconomic model to compute the impact of long-term economic growth from a number of economic variables such as capital and human capital accumulation, active population growth countries, the variation of the labour force as an expression of technological innovation and entrepreneurial rate. This model explains that the reduction of gaps between more or less developed countries can be achieved through innovation and the development of information technology. The model represents an extension of the growth model developed by Solow [41] and Swan [42], based on the Cobb–Douglas production function.
in which:
Y(t) = K(t)αH(t)β(A(t)L(t)))1−α−β
- t = the time interval;
- α, β = elasticity coefficients, 0 < α + β < 1;
- Y(t) = total output;
- K(t) = total capital;
- H(t) = human capital;
- A(t) = the technological labour force; and
- L(t) = the labour force.
Equation (1) can be rewritten as:
Y(t) = A(t)1−α−βK(t)αH(t)β(L(t)))1−α−β
By dividing both members into L(t), we obtain:
Y(t)/L(t) = A(t)1−α−β(K(t)/L(t))α (H(t)/L(t))β
To linearize this exponential equation, we log both members of the equation above:
ln(Y(t)/L(t)) = (1 − α − β) ln(A(t)) + α ln((K(t)/L(t)) + βln(H(t)/L(t))
To achieve the Y/L growth rate, we calculate the first-order differential of the previous equation and thus obtain:
∆ln(Y(t)/L(t)) = ∆ln(A(t)) + α[∆ ln((K(t)/L(t))] + β[∆ln(H(t)/L(t))]
In the context of the interstate relations, the factor (Y(t)/L(t)) is included in the model to capture the low convergence effect of low-growth EU member states [43]. Also, the effect of the cyclical economy is given by the predictive variables described in the regression model (1).
∆ln(Y(t)/L(t)) = ∆ln(A(t)) + α[∆ ln((K(t)/L(t))] + β[∆ln(H(t)/L(t))] + θ[∆ln(R(t)/L(t))]
In the regression model, analysed using the SPSS 22 statistical software, we used:
- ∆ln(Y(t)/L(t)) as the percentage increase of ln(Y(t)/L(t))
- ∆ln(K(t)/L(t)) as the percentage increase of ln(K(t)/L(t))
- ∆ln(R(t)/L(t)) as the percentage increase of ln(R(t)/L(t))
In order to homogenize annual fluctuations, mean values were used for a period of 7 years.
3. Results
A description of the statistics used in our analysis (minimum, maximum, mean, median and standard deviation) can be seen in Table 2. These measures of central tendency are indicators of how close the data points are to a normal distribution. Moreover, for normal dispersion data values, the mean and median approximate each other [44]. From Table 2, we can see that for all variables in the model, the median and mean have close values. Hence, we can assume that the variables in our model are normally distributed.
The existence of multicollinearity between the exogenous variables used in the model was evaluated by the correlation analysis. Given that the correlation values of the coefficients of the exogenous variables in Table 3 are smaller than ±0.20, it is assumed that there are no multicollinearity problems among the independent variables [45].
To determine whether the research model in Equation (1) has random effects, fixed effects or pooled data, an F-Test and a Lagrange Multiplier Breusch–Pagan Test were performed. The F-test was used to test the pooled model validity from the intended fixed effect model against the static panel data models [46]. To perform this test, unrestricted and restricted models are required.
Restricted model:
Unrestricted model:
If the null hypothesis is rejected (it will be βi ≠ β in such a case), a solution would be made with pooled data techniques. Conversely, if the null hypothesis is accepted, the model with fixed effects would be used.
The statistical results of the F-test can be seen in Table 4. The null hypothesis is accepted since the p-value is greater than the threshold of 0.05. Hence, we concluded that the fixed effect model should not be used in our analysis.
At this point, to make a choice between the random models and pooled method, we performed the Lagrange Multiplier Breusch–Pagan Test [47]. The null and alternative hypotheses could be written as follows—H0: ; H1: .
If the null hypothesis is rejected, which indicates that the variance of the unit effects is significantly different than zero, the pooled model would be used in our analysis. The values of the Breusch–Pagan Test are listed in Table 5.
Since the probability values in the table above are all less than 0.05, we concluded that the null hypothesis could be accepted. Hence, the random effect model was not suitable for our analysis but the pooling data techniques were suitable for Equation (1).
The pooled least square (PLS) method was used to test the statistical hypotheses described in Table 1. We used this method to estimate the impact of a circular economy on economic growth at the EU level, between 2007 and 2016.
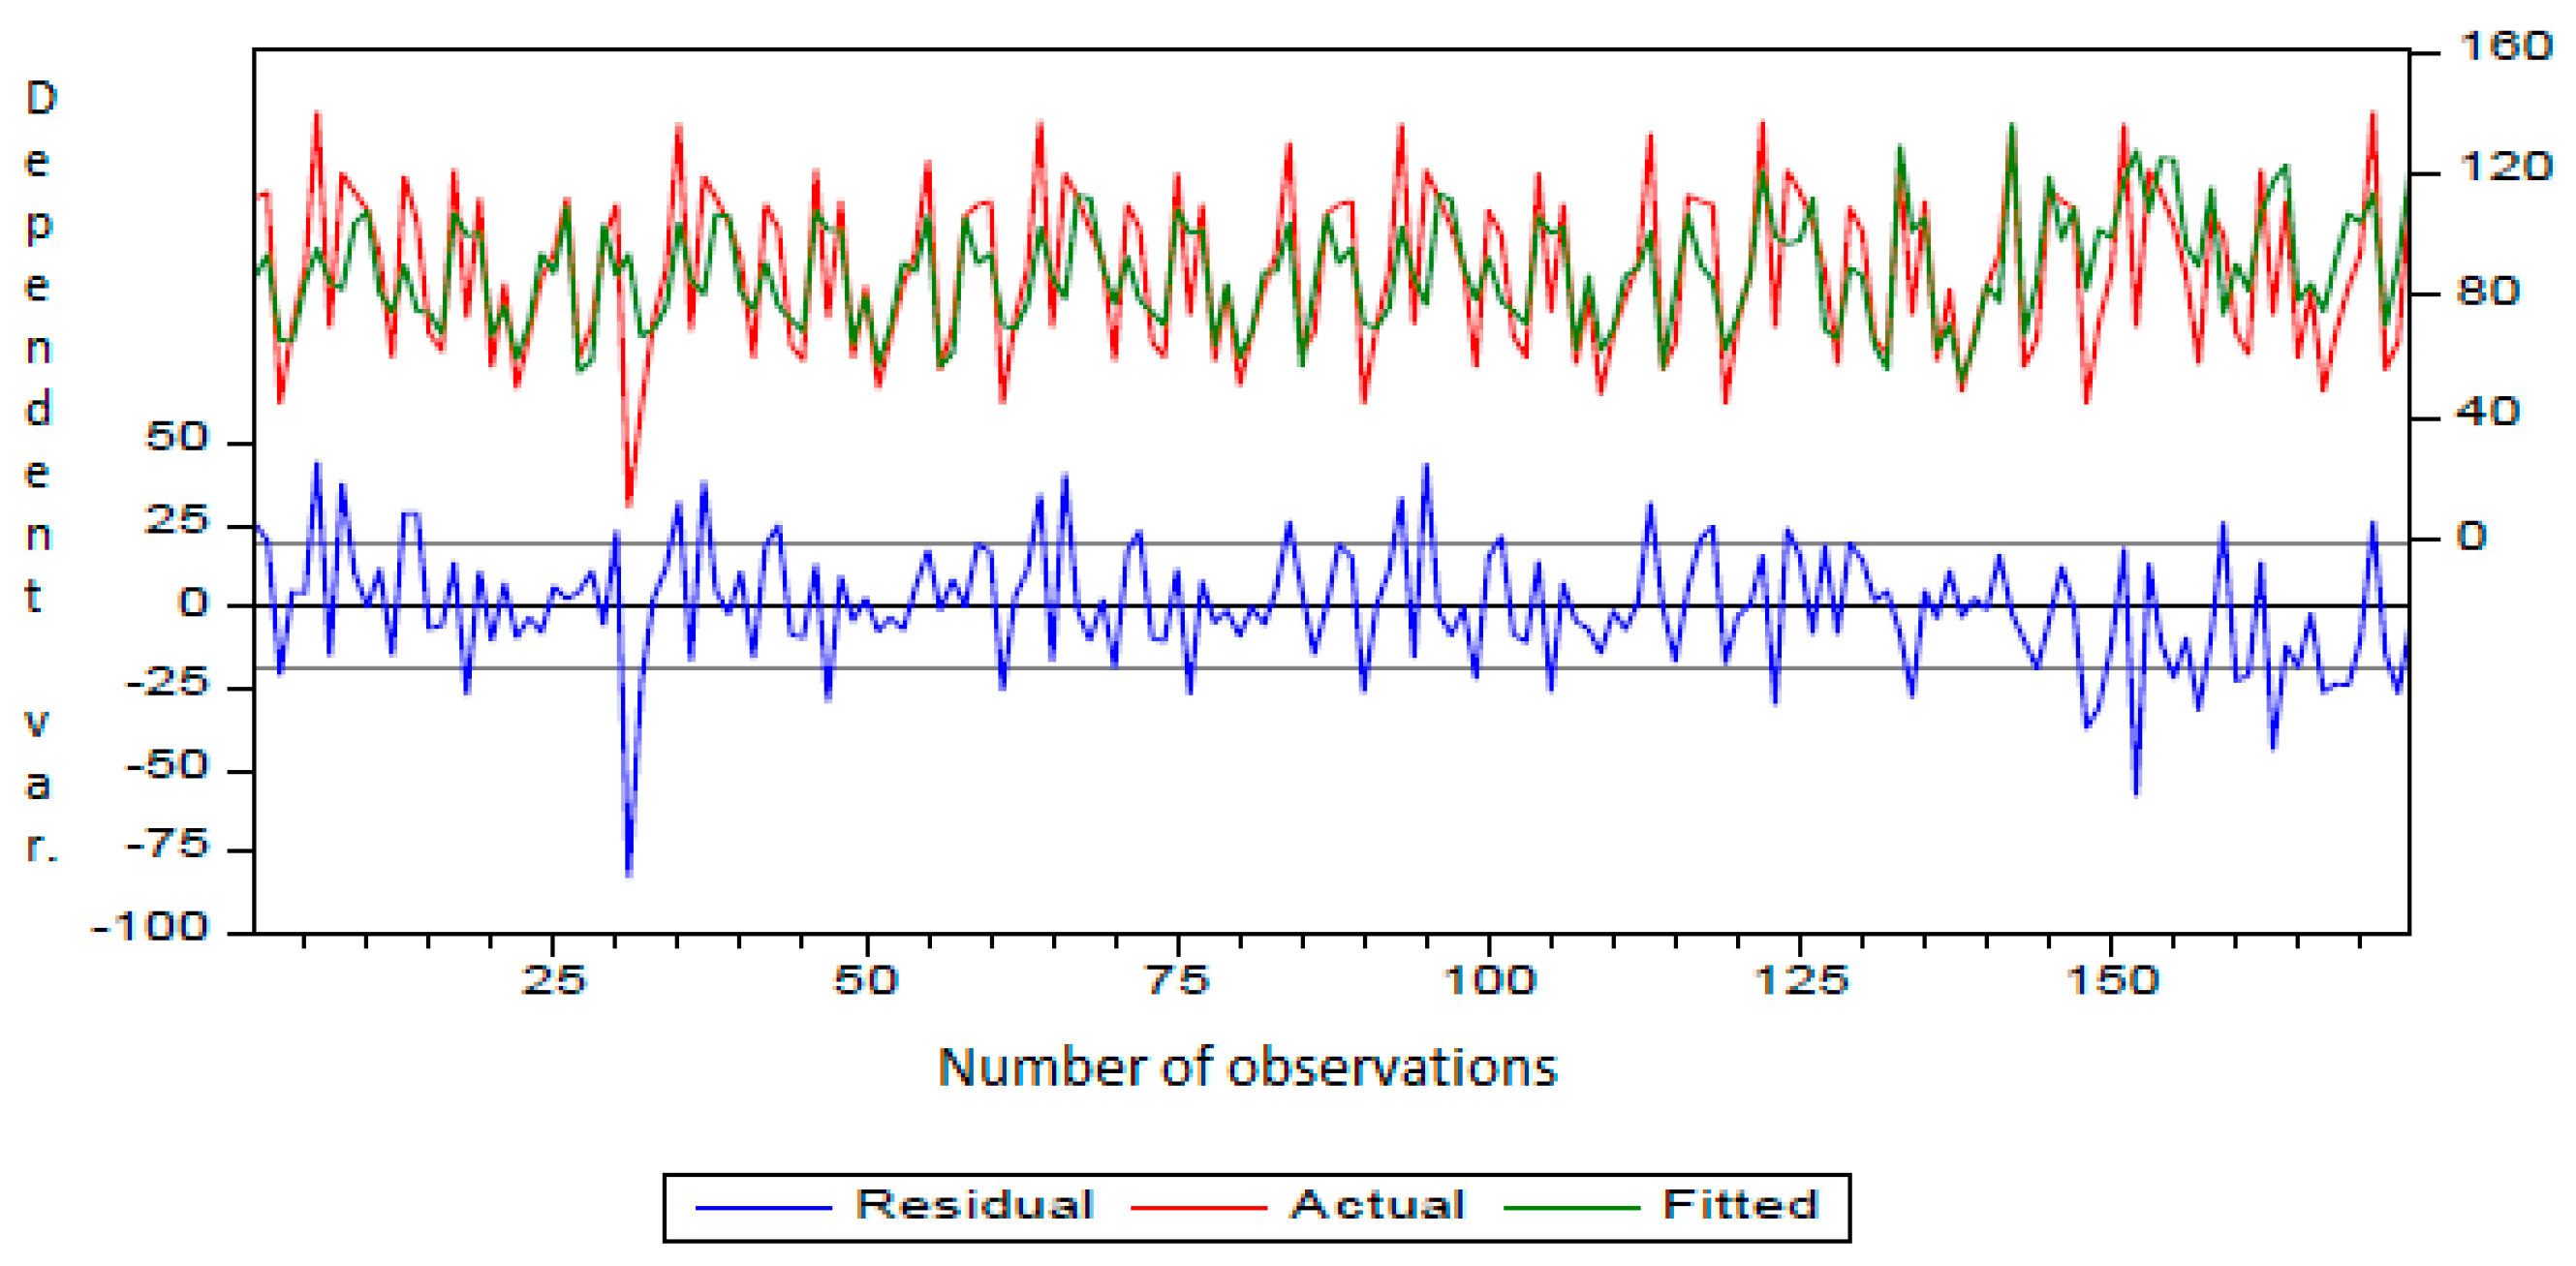
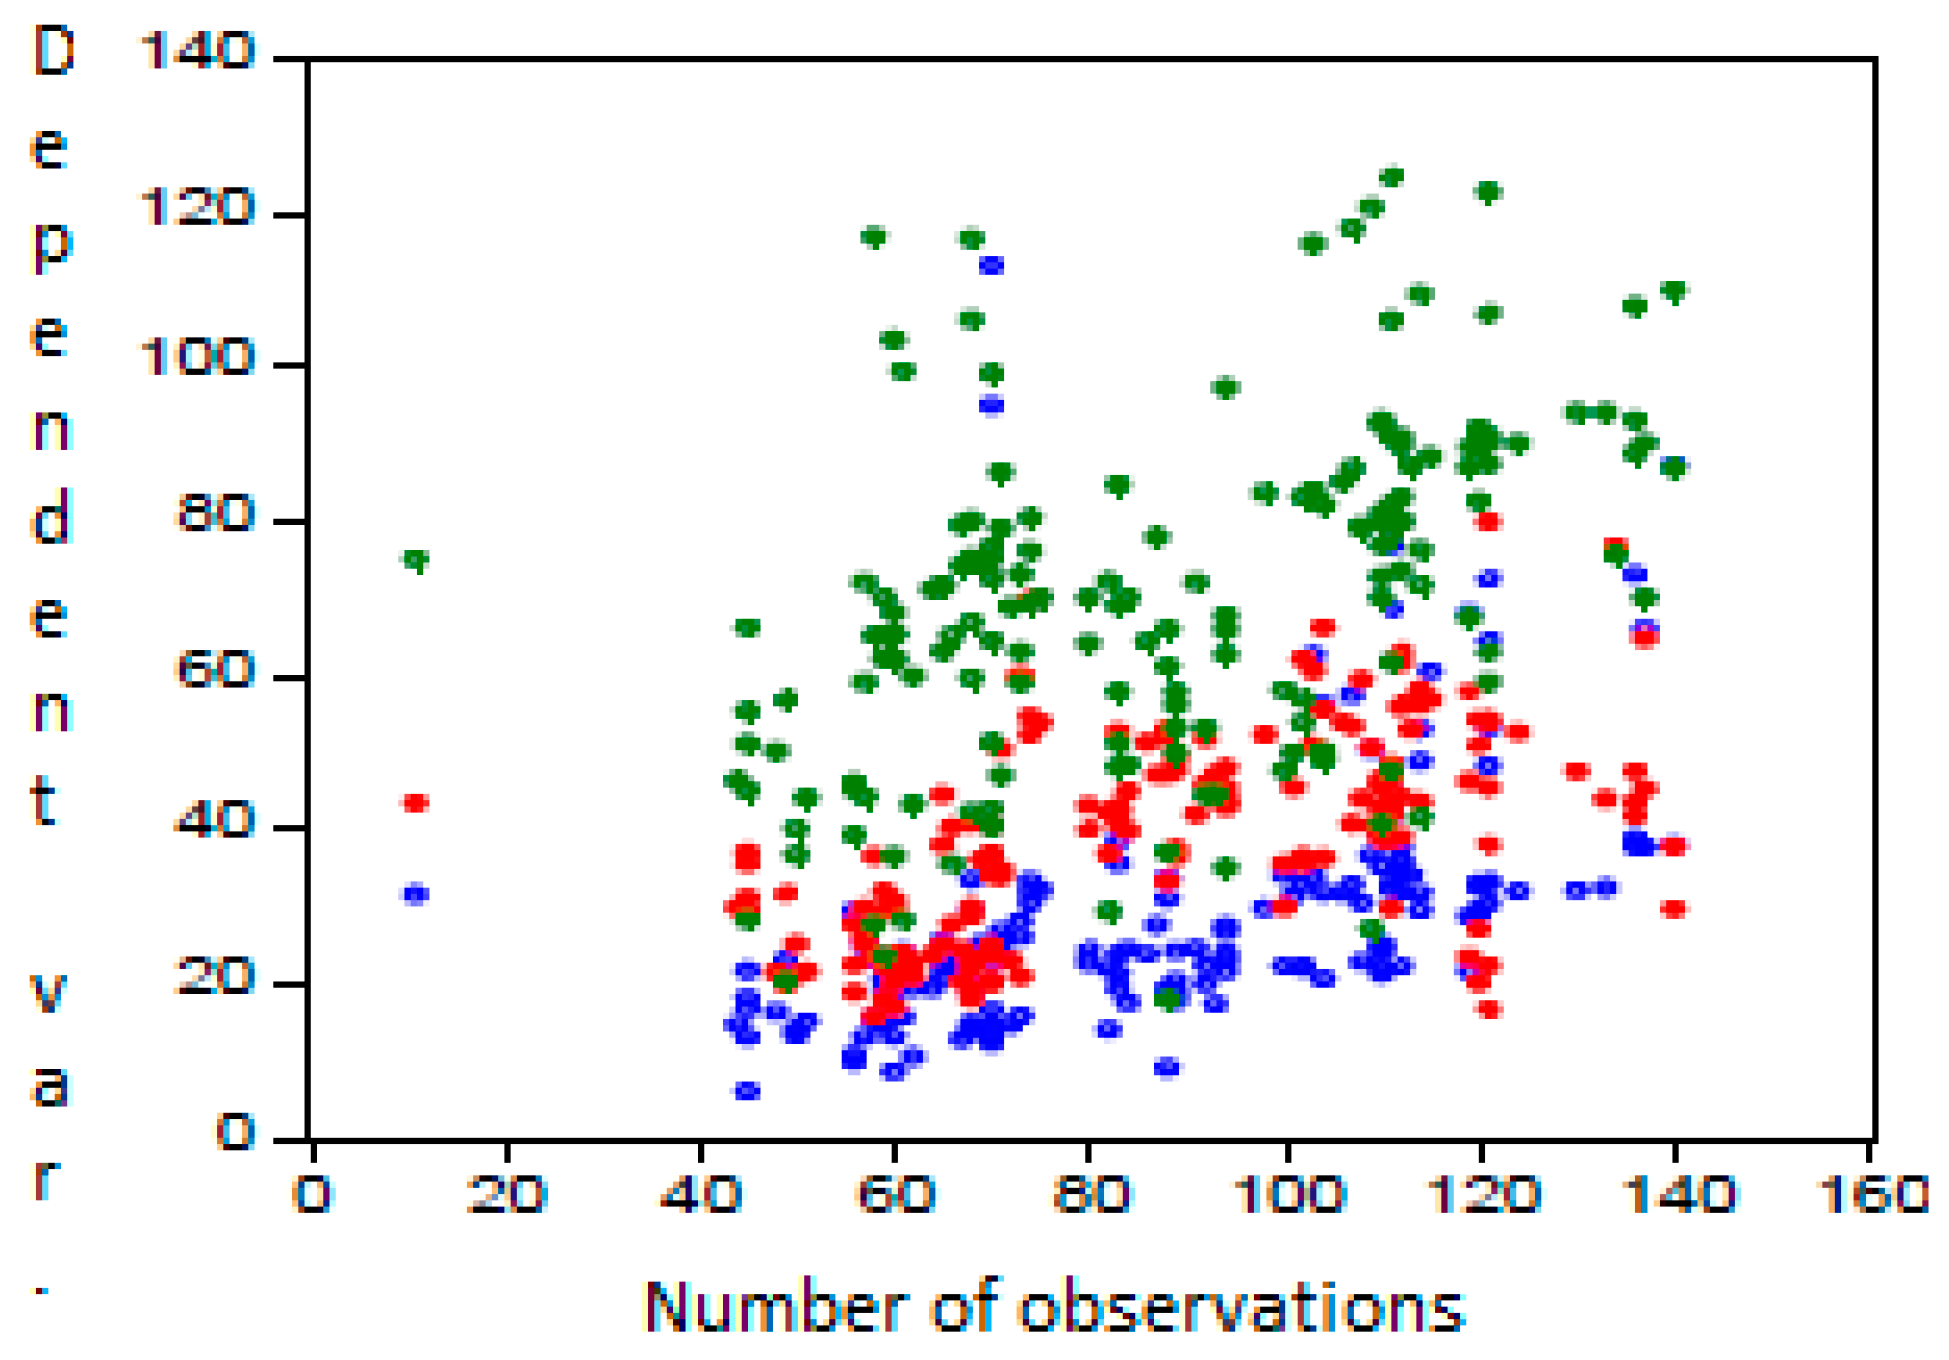
For the regression analysis, the economic growth was considered as the dependent variable (y) influenced by a set of four independent factors (regressors) as independent variables. These independent variables were the labour productivity (x1), the labour force engaged in services and production of environmental goods (x2), the recycling rate (x3) and the share of innovative enterprises that brought innovative new products to the market with environmental benefit (x4). Through a multiple linear regression analysis, we established a description of the regression model, estimated the parameters of the model and checked the accuracy of the results. From the actual, fitted and residual graph (Figure 6) as well as the scatter diagram (Figure 7) below, we could observe that the correlation function between the independent variables which characterize the economic growth was approximately linear.
The multilinear regression model was analysed using EViews software. The estimation of the parameters, validity of the model, correlation between the variables and residual analysis (checking the independence and the normality of the distribution of the errors) are summarized in Table 6.
The following results were obtained, based on the evolution of the economic growth during the period of 2007–2016 at the EU level, according to the independent variables evolution (see Table 6):
where:
Y = −2.013 + 1.517 X1 + 1.043X2 + 0.369X3 + 0.420X4
- Y = growth of GDP per capita
- X1 = resource productivity
- X2 = environmental employment
- X3 = recycling rate of e-products
- X4 = environmental innovation
Looking into the results in Table 6, we concluded that all the variables used in the model were statistically significant at a 95% level of confidence as the p-values (Prob.) were all less than 0.05. Moreover, R-squared was 0.869, which implies that 86.9% of the variability of the dependent variable was explained by the variability of the independent variables. Also, the value of the Durbin–Watson test (Durbin–Watson stat = 2.12) was close to 2, which means that the model did not have collinearity problems between the exogenous variables.
Thus, according to the statistical analysis results, all three statistical assumptions were valid. A description of the regression variables can be observed in Table 2.
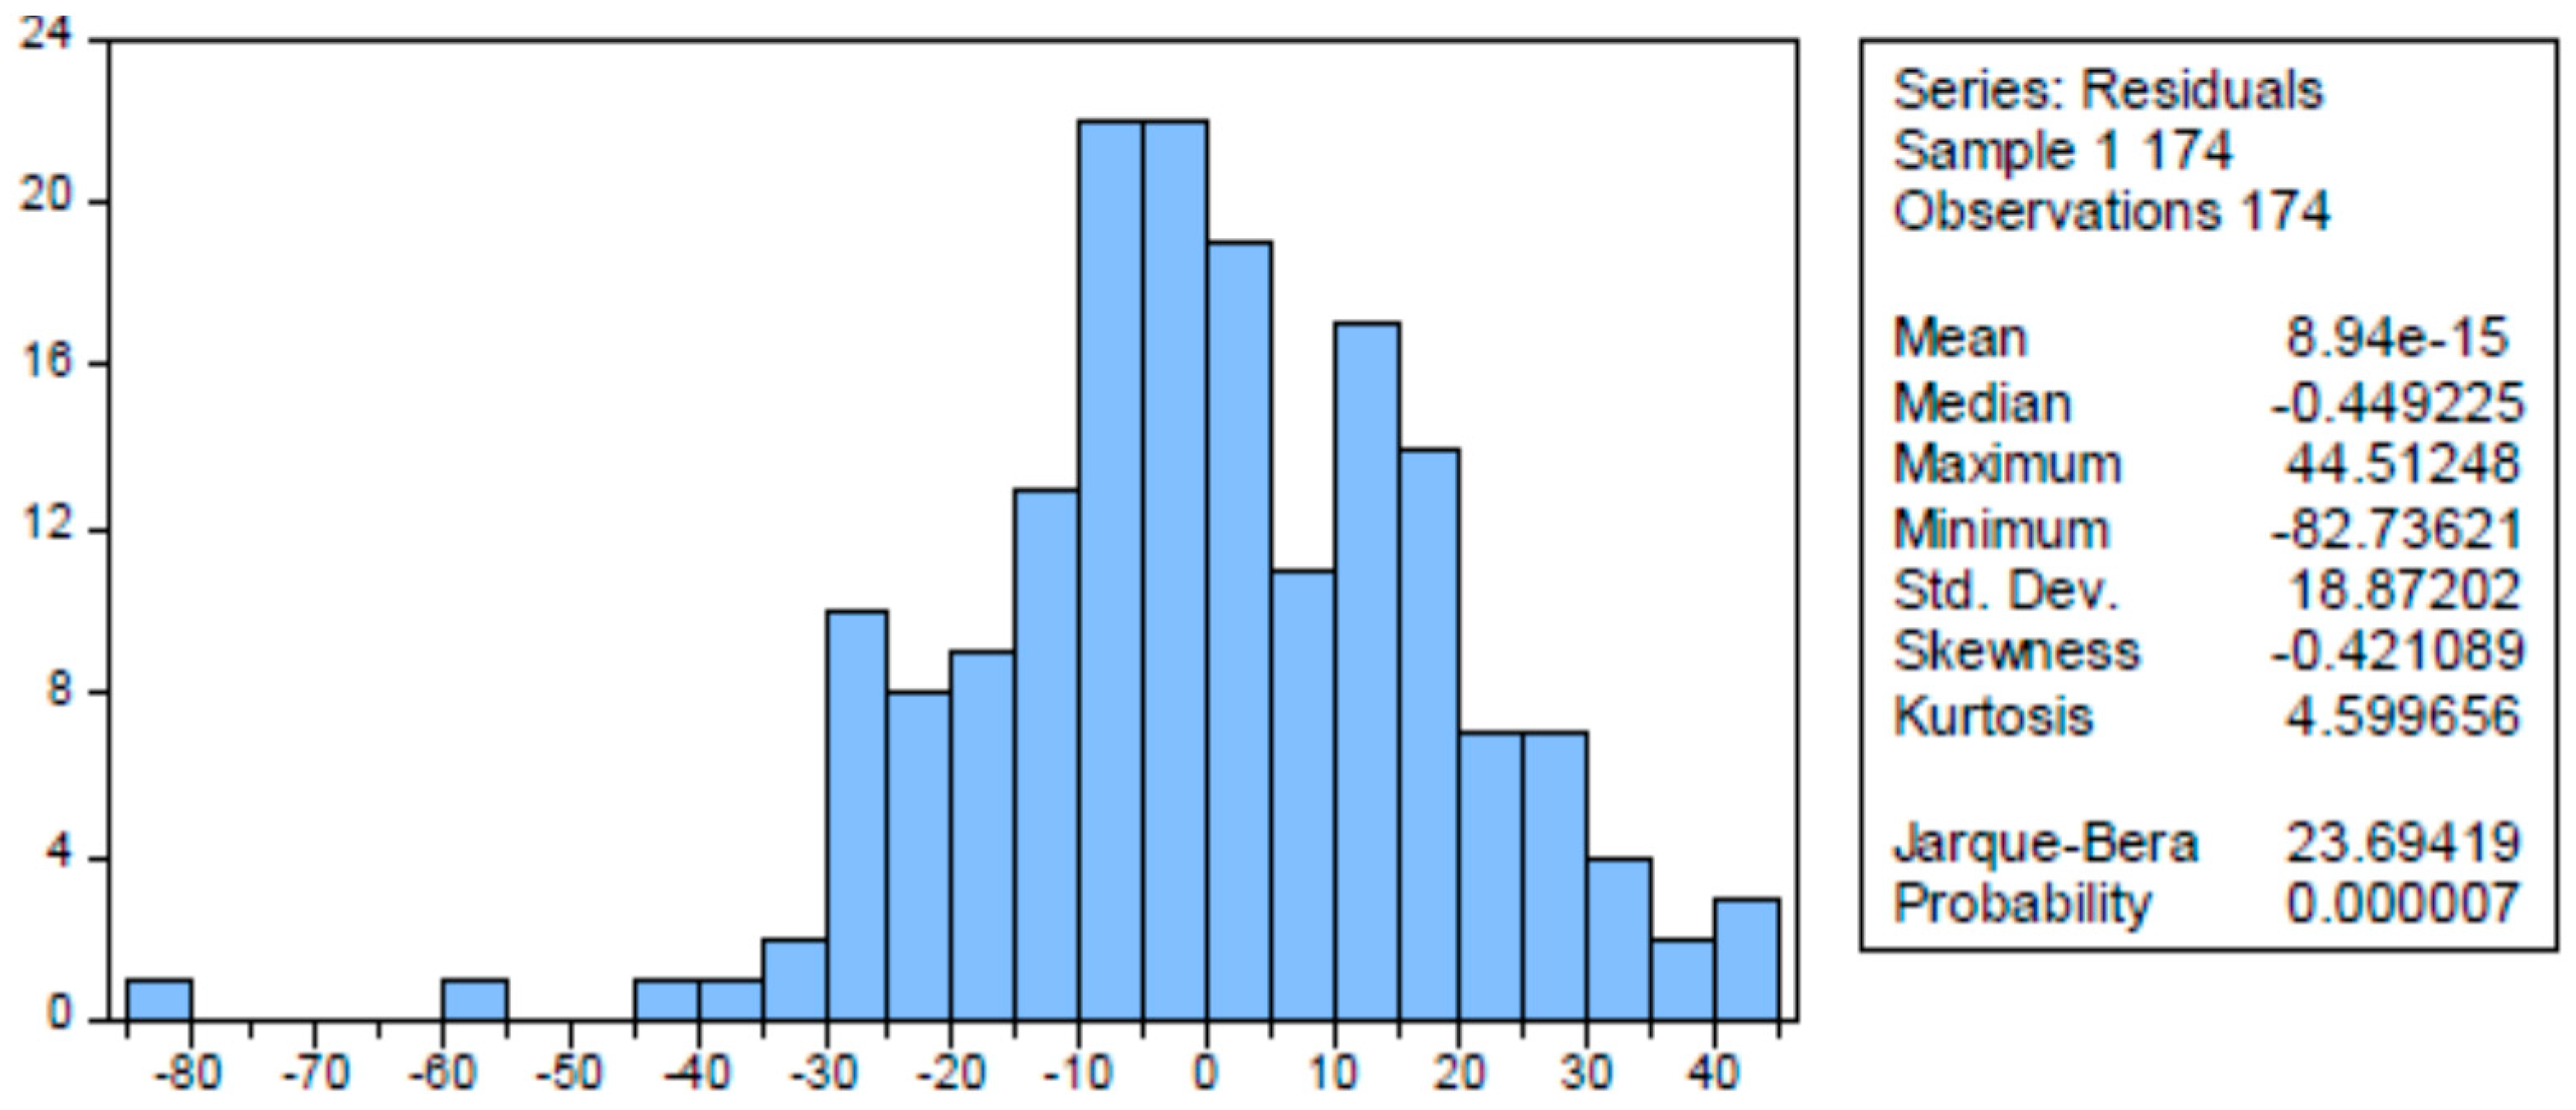
The results of our regression analysis are consistent with those of a previous study [48] which developed a multilinear regression model with economic growth as a dependent variable, partly explained by the independent factors of the circular economy. Normal distribution of the errors could be seen in Figure 8, while the results of the Breusch–Godfrey test for multiple regression model are revealed in Table 7.
To detect errors, we made use of the autocorrelation based on empirical methods, such as the Breusch–Godfrey test. With this test, we evaluated the existence of the autocorrelation order k, k ≠ 1. It is assumed that the error of the regression model is given by the following equation:
the residuals are not correlated.
or or ; the residuals are correlated.
The regression model analysis revealed that the model was correctly specified and valid and the circular economy and the studied environmental factors were significant indicators of economic growth in all 27 EU countries, since the values of the regression estimated coefficients were significantly different than zero and most of the variation of economic growth in EU countries was explained by the model. The results of the paper are in line with recent studies of circular economy impact on economic growth [49,50,51].
4. Discussion and Conclusions
The environmental policy report of the European Commission indicates the importance of reusing resources at the EU level. To implement a circular economy model, member states are required to make significant investments in the protection of environmental infrastructure in order to develop effective tools towards reaching their environmental goals.
Shortcomings are noted in relation to the labour employment and the resource productivity employed in the environmental protection area. Beyond the current state of the sustainable circular economy, this paper underlines the advantages of implementing a conceptual model with regard to sustainable economic growth based on the responsible and efficient use of the resources.
Several studies on developed economies revealed multiple benefits resulting from the education of the society on protecting the environment, while also investing in infrastructure for the sorting, collecting and recycling of resource materials. The circular economy’s positive effects include the constant increase of the revenues of municipalities, as well as the profits earned by companies with strong environmental infrastructures and labour forces.
The most important asset of applying a sustainable circular economy model is obvious from the perspective of human life. Making an analogy between the lives of products and human life, one can observe how environmentally sustainable factors are propagated in the quality of our life.
The econometric analysis employed in this paper explains the impact of the exogenous indicators, which are determinant factors of sustainable, circular economic growth. Simultaneously, the predictive variables have a higher impact on the dependent variable than the control variables. This means that the recycling rate and the degree of innovation play more important roles with respect to the impact on economic growth, as compared to the impact of the recycling rate and the GDP per capita on increasing human capital in the sector.
We hypothesized that the factors of a circular economy have a strong and positive impact on economic growth at the EU level and this was confirmed by the results of the econometric model. These findings are in line with the European Union’s target of increasing resource productivity by 30% in 2030. This may lead to almost a 1-percentage point increase in the GDP [7]. Moreover, the validation of the three hypotheses and the descriptive analysis revealed the interconnection between the circular economy factors and the usefulness of improving the economic indicators from our model to implement and advance circularity.
This research study could also be useful for local, regional and national public authorities that are engaged in drafting legislative sustainable environment regulations, as well as for the implementation of organizational plans according to the estimated effects for each member state of the EU.
Our analysis can be further developed using different variables to quantify characteristics of the circular economy and environmental challenges, stressing the need to better estimate and understand the effects derived from the measures and decisions realized by the European Commission to implement a circular economy. This study may also be supplemented by expanding the analysed time frame, according to the available data and by using some other statistical methods. The novelty of this study resides in the fresh outlook taken for a set of 28 relevant European countries, in order to assess the interaction between a circular economy and economic growth.
The regression analysis was based on the values of the macroeconomic indicators over a period of 10 years and, therefore, the principal limitation of this study is associated with the length of the time period was used in the econometric research. Thus, future research could encompass longer time periods and may reveal a better picture of the econometric model created by Mankiw, Romer and Weil.
Author Contributions
All authors equally contributed in designing the paper. M.B. gathered the data and estimated the regression model; C.S.B. contributed with the introduction and conducted an overview of the circular economy at the EU level; C.L.T. drafted the limitations of the study and further research as well as the conclusions and recommendations; M.B. was responsible for the overall writing process.
Funding
This research was funded by the Romanian government through CERTRAN project—The Upgrade of the Research Capacity in Economics through Development of a Transdisciplinary Research Infrastructure.
Acknowledgments
The research published in this article has been supported by the Romanian government through CERTRAN project—The Upgrade of the Research Capacity in Economics through Development of a Transdisciplinary Research Infrastructure.
Conflicts of Interest
The authors declare no conflict of interest.
References
- Cleary, J. Life cycle assessments of municipal solid waste management systems: A comparative analysis of selected peer-reviewed literature. Environ. Int. 2009, 35, 1256–1266. [Google Scholar] [CrossRef] [PubMed]
- Chang, N.-B. Economic and policy instrument analyses in support of the scrap tire recycling program in Taiwan. J. Environ. Manag. 2008, 86, 435–450. [Google Scholar] [CrossRef] [PubMed]
- Ljunggren Söderman, M.; Eriksson, O.; Björklund, A.; Östblom, G.; Ekvall, T.; Finnveden, G.; Sundqvist, J.O. Integrated economic and environmental assessment of waste policy instruments. Sustainability 2016, 8, 411. [Google Scholar] [CrossRef]
- Sjöström, M.; Östblom, G. Future Waste Scenarios for Sweden Based on a CGEmodle; Working Paper 109; National Institute of Economic Research: Stockholm, Sweden, 2009; Available online: https://econpapers.repec.org/paper/hhsnierwp/0109.htm (accessed on 11 January 2019).
- Xie, J.; Saltzman, S. Environmental policy analysis: An environmental computable general-equilibrium approach for developing countries. J. Policy Model. 2000, 22, 453–489. [Google Scholar] [CrossRef]
- OECD Publishing. The New Rural Paradigm: Policies and Governance; Organisation for Economic Co-operation and Development: Paris, France, 2006. [Google Scholar]
- EU. Regulation (EC) No 2150/2002 of the European Parliament and the Council on Waste Statistics. 2002. Available online: http://0-www-kluwerlawonline-com.brum.beds.ac.uk/abstract.php? id=EELR2003019 (accessed on 23 August 2017).
- Cicea, C.; Busu, C.; Subic, J. Investment Structural Modeling in Agriculture. Rev. Int. Comp. Manag. 2009, 1, 203–215. [Google Scholar]
- Guerrero, L.A.; Maas, G.; Hogland, W. Solid waste management challenges for cities in developing countries. Waste Manag. 2013, 33, 220–232. [Google Scholar] [CrossRef] [PubMed]
- McDonough, W.; Braungart, M. Cradle to Cradle: Remaking the Way We Make Things; North Point Press: New York, NY, USA, 2002. [Google Scholar]
- Browne, D.; O’Regan, B.; Moles, R. Use of carbon footprinting to explore alternative household waste policy scenarios in an Irish city-region. Resour. Conserv. Recycl. 2009, 54, 113–122. [Google Scholar] [CrossRef]
- Vuta, M.; Vuta, M.; Enciu, A.; Cioaca, S.I. Assessment of The Circular Economy’s Impact in the EU Economic Growth. Amfiteatru Econ. 2018, 20, 248–261. [Google Scholar]
- Ayres, R.U. Life cycle analysis: A critique. Resour. Conserv. Recycl. 1995, 14, 199–223. [Google Scholar] [CrossRef]
- De Wolf, C.; Pomponi, F.; Moncaster, A. Measuring embodied carbon dioxide equivalent of buildings: A review and critique of current industry practice. Energy Build. 2017, 140, 68–80. [Google Scholar] [CrossRef]
- Sakai, S.I.; Yoshida, H.; Hirai, Y.; Asari, M.; Takigami, H.; Takahashi, S.; Tomoda, K.; Peeler, M.V.; Wejchert, J.; Schmid-Unterseh, T.; et al. International comparative study of 3R and waste management policy developments. J. Mater. Cycles Waste Manag. 2011, 13, 86–102. [Google Scholar] [CrossRef] [Green Version]
- Morrissey, A.J.; Browne, J. Waste management models and their application to sustainable waste management. Waste Manag. 2004, 24, 297–308. [Google Scholar] [CrossRef] [PubMed]
- MacArthur, E. Towards the circular economy. J. Ind. Ecol. 2013, 23–44. Available online: https://mvonederland.nl/system/files/media/towards-the-circular-economy.pdf (accessed on 21 October 2017).
- Geng, Y.; Fu, J.; Sarkis, J.; Xue, B. Towards a national circular economy indicator system in China: An evaluation and critical analysis. J. Clean. Prod. 2012, 23, 216–224. [Google Scholar] [CrossRef]
- George, D.A.; Lin, B.C.A.; Chen, Y. A circular economy model of economic growth. Environ. Model. Softw. 2015, 73, 60–63. [Google Scholar] [CrossRef]
- Brock, W.A.; Taylor, M.S. Economic growth and the environment: A review of theory and empirics. In Handbook of Economic Growth; BBER: Cambridge, MA, USA, 2005; pp. 1749–1821. Available online: http://www.sciencedirect.com/science/article/pii/S1574068405010282 (accessed on 25 January 2019).
- Lyasnikov, N.V.; Dudin, M.N.; Sekerin, V.D.; Veselovsky, M.Y.; Aleksakhina, V.G. The national innovation system: The conditions of its making and factors in its development. Life Sci. J. 2014, 11, 535–538. [Google Scholar]
- Ghisellini, P.; Cialani, C.; Ulgiati, S. A review on circular economy: The expected transition to a balanced interplay of environmental and economic systems. J. Clean. Prod. 2016, 114, 11–32. [Google Scholar] [CrossRef]
- Dobrea, R.C.; Molănescu, G.; Buṣu, C. Food Sustainable Model Development: An ANP Approach to Prioritize Sustainable Factors in the Romanian Natural Soft Drinks Industry Context. Sustainability 2015, 7, 10007–10020. [Google Scholar] [CrossRef] [Green Version]
- De Mattos, C.; de Albuquerque, T. Enabling Factors and Strategies for the Transition Toward a Circular Economy (CE). Sustainability 2018, 10, 4628. [Google Scholar] [CrossRef]
- Trica, C.L.; Papuc, M. Green economic growth premise for sustainable development. Theor. Appl. Econ. 2013, 18, 131–140. [Google Scholar]
- Banacu, C.S.; Irimescu, E.C.; Dobrea, R.C. Eco-efficient recycling of electrical and electronic waste: Analysis of the Romanian companies. In Bucharest, Romania: Proceedings of the International Management Conference Management Challenges for Sustainable Development; Editura ASE: Bucharest, Romania, 2014. [Google Scholar]
- Ruiz-Real, J.L.; Uribe-Toril, J.; Valenciano, J.D.P.; Gázquez-Abad, J.C. Worldwide Research on Circular Economy and Environment: A Bibliometric Analysis. Int. J. Environ. Res. Public Health 2018, 15, 2699. [Google Scholar] [CrossRef]
- Geissdoerfer, M.; Savaget, P.; Bocken, N.M.; Hultink, E.J. The Circular Economy—A new sustainability paradigm? J. Clean. Prod. 2017, 143, 757–768. [Google Scholar] [CrossRef]
- Busu, C.; Busu, M. The Role of Knowledge Intensive Business Services on Romania’s Economic Revival and Modernization at the Regional Level. Sustainability 2017, 9, 526. [Google Scholar] [CrossRef]
- Grossman, G.M.; Krueger, A.B. Economic growth and the environment. Q. J. Econ. 1995, 110, 353–377. [Google Scholar] [CrossRef]
- Sandu, I.S.; Ryzhenkova, N.E.; Veselovsky, M.Y.; Solovyov, A.Y. Economic aspects of innovation-oriented market economy formation. Life Sci. J. 2014, 11, 242. [Google Scholar]
- Sjöström, M.; Östblom, G. Decoupling waste generation from economic growth—A CGE analysis of the Swedish case. Ecol. Econ. 2010, 69, 1545–1552. [Google Scholar] [CrossRef]
- Lieder, M.; Rashid, A. Towards circular economy implementation: A comprehensive review in context of manufacturing industry. J. Clean. Prod. 2016, 115, 36–51. [Google Scholar] [CrossRef]
- Hu, J.; Xaio, Z.; Zhou, R.; Deng, W.; Wang, M.; Ma, S. Ecological utilization of leather tannery waste with circular economy model. J. Clean. Prod. 2011, 19, 221–228. [Google Scholar] [CrossRef]
- Lewandowski, M. Designing the business models for circular economy—Towards the conceptual framework. Sustainability 2016, 8, 43. [Google Scholar] [CrossRef]
- Di Maio, F.; Rem, P.C. A robust indicator for promoting circular economy through recycling. J. Environ. Prot. 2015, 6, 1095–1104. [Google Scholar] [CrossRef]
- Geng, Y.; Doberstein, B. Developing the circular economy in China: Challenges and opportunities for achieving ‘leapfrog development’. Int. J. Sustain. Dev. World Ecol. 2008, 15, 231–239. [Google Scholar] [CrossRef]
- Mankiw, N.G.; Romer, D.; Weil, D.N. A contribution to the empirics of economic growth. Q. J. Econ. 1992, 107, 407–437. [Google Scholar] [CrossRef]
- Schmidheiny, K. Panel Data: Fixed and Random Effects. Basel Universität, 2016. Available online: http://www.schmidheiny.name/teaching/panel2up.pdf (accessed on 18 May 2018).
- Barro, R.J. Health and economic growth. Ann. Econ. Financ. 2013, 14, 329–366. [Google Scholar]
- Solow, R.M. A Contribution to the Theory of Economic Growth. Q. J. Econ. 1956, 70, 1–65. [Google Scholar] [CrossRef]
- Swan, T.W. Economic growth and capital accumulation. Econ. Rec. 1956, 32, 334–361. [Google Scholar] [CrossRef]
- Busu, M.; Gyorgy, A. Real Convergence, Steps from Adherence to Integration of the Countries from Central and Eastern Europe. Amfiteatru Econ. 2016, 18, 303–316. [Google Scholar]
- Pett, M.A.; Lackey, N.R.; Sullivan, J.J. Making Sense of Factor Analysis: The Use of Factor Analysis for Instrument Development in Health Care Research; Sage: London, UK, 2003. [Google Scholar]
- Weinberg, D.; Carmeli, A. Exploring the antecedents of relationship commitment in an import–export dyad. In New Perspectives in International Business Research; Feldman, M.P., Santangelo, G.D., Eds.; Emerald: Bingley, UK, 2008; pp. 113–136. [Google Scholar]
- Urban, M. The Influence of Blockholders on Agency Costs and Firm Value an Empirical Examination of Blockholder Characteristics and Interrelationships for German Listed Firms; Springer: Berlin, Germany, 2015. [Google Scholar]
- Block, J. Long-Term Orientation of Family Firms: An Investigation of R&D Investments; Downsizing Practices, and Executive Pay; Gabler: Wiesbaden, Germany, 2009. [Google Scholar]
- Puigcerver-Peñalver, M.C. The impact of structural funds policy on European regions’ growth. A theoretical and empirical approach. Eur. J. Comp. Econ. 2007, 4, 179. [Google Scholar]
- Preston, F. A Global Redesign? Shaping the Circular Economy; Chatham House: London, UK, 2012; Available online: https://www.bitcni.org.uk/wp-content/uploads/2014/11/bp0312_preston.pdf (accessed on 11 October 2017).
- Su, B.; Heshmati, A.; Geng, Y.; Yu, X. A review of the circular economy in China: Moving from rhetoric to implementation. J. Clean. Prod. 2013, 42, 215–227. [Google Scholar] [CrossRef]
- Bocken, N.M.; de Pauw, I.; Bakker, C.; van der Grinten, B. Product design and business model strategies for a circular economy. J. Ind. Prod. Eng. 2016, 33, 308–320. [Google Scholar] [CrossRef]
Figure 1.
Gross domestic product (GDP) per capita in European Union (EU) member states, in euros. Source: based on processed data provided by Eurostat.
Figure 1.
Gross domestic product (GDP) per capita in European Union (EU) member states, in euros. Source: based on processed data provided by Eurostat.

Figure 2.
Recycling rate of e-products. Source: based on processed data provided by Eurostat.

Figure 3.
Percentage of workers employed in the production of goods and services for environmental protection. Source: based on processed data provided by Eurostat.
Figure 3.
Percentage of workers employed in the production of goods and services for environmental protection. Source: based on processed data provided by Eurostat.

Figure 4.
The share of enterprises that have brought to market innovative new products with environmental benefits. Source: based on processed data provided by Eurostat.
Figure 4.
The share of enterprises that have brought to market innovative new products with environmental benefits. Source: based on processed data provided by Eurostat.

Figure 5.
Productivity of resources. Source: based on processed data provided by Eurostat.

Figure 6.
Actual, fitted and residual graph of the dependent variable.

Figure 7.
Scatter diagram of the dependent variable.

Figure 8.
Normal distribution of errors for a multiple regression model.


Table 1.
Hypotheses of the research study.
| Hypotheses | |
|---|---|
| H1 | Economic growth is positively influenced by the number of employees in environmental protection activities. |
| H2 | Recycling activity has a positive impact on economic growth. |
| H3 | Innovation with environmental benefit has a positive impact on economic growth. |
Table 2.
Statistical description of variables in the model.
| Variable | Mean | Median | Standard Deviation | N | Variable |
|---|---|---|---|---|---|
| Y | 0.1310 | 0.1420 | 0.02509 | 27 | 0.1310 |
| X1 | 9.8580 | 9.6080 | 3.21432 | 27 | 9.8580 |
| X2 | 0.1481 | 0.1881 | 0.03843 | 27 | 0.1481 |
| X3 | 0.5741 | 0.6741 | 0.08676 | 27 | 0.5741 |
| X4 | 0.8889 | 0.7649 | 0.06979 | 27 | 0.8889 |
Source: Data analysis was performed by the authors harnessing EViews 9.0.
Table 3.
Matrix of correlation.
| Variable | Y | X1 | X2 | X3 | X4 |
|---|---|---|---|---|---|
| Y | 1 | 0.697 | 0.539 | 0.616 | 0.532 |
| X1 | 0.697 | 1 | 0.028 | 0.034 | 0.109 |
| X2 | 0.539 | 0.028 | 1 | 0.052 | 0.132 |
| X3 | 0.616 | 0.034 | 0.052 | 1 | 0.098 |
| X4 | 0.532 | 0.109 | 0.132 | 0.098 | 1 |
Source: Data analysis was performed by the authors harnessing EViews 9.0.
Table 4.
Fixed effect F-test.
| F Statistics | 3.56 |
| F Stat. prob. | 0.210 |
Table 5.
Random effect test.
| Cross-Section | Time | Both | |
|---|---|---|---|
| Coefficient | 32.23 | 54.331 | 402.76 |
| Probability | 0.089 | 0.567 | 0.035 |
Table 6.
Correlations of GDP per capita growth indices and resource productivity, recycling rate, consumption and environment innovation at the EU level.
Table 6.
Correlations of GDP per capita growth indices and resource productivity, recycling rate, consumption and environment innovation at the EU level.
| Dependent Variable: GDP_PER_CAPITA_ GROWTH | ||||
| Method: Pooled least squares | ||||
| Sample: 2007–2016 | ||||
| Total panel observations: 270 GDP_PER_CAPITA_GROWTH = C(1) + C(2)*RESOURCE_PROD + C(3)*ENV_EMPL + C(4)*RECYCLING_RATE + C(5)*ENVIRONMENT_INNOVATION | ||||
| Coefficient | Std. Error | t-Statistic | Prob. | |
| C | −2.01312 | 0.245676 | 4.252243 | 0.0000 |
| Resource_Prod | 1.517032 | 1.430 | −25.58543 | 0.0000 |
| Env_Empl | 1.043210 | 1.320 | 4.188850 | 0.0001 |
| Recycling_Rate | 0.369201 | 1.009 | 9.821022 | 0.0000 |
| Environment_Innovation | 0.420312 | 0.870 | 0.328985 | 0.0427 |
| R-squared | 0.869262 | Mean dependent var | 9.8392 | |
| Adjusted R-squared | 0.838558 | S.D. dependent var | 0.5644 | |
| S.E. of regression | 0.100085 | Akaike info criterion | 1.7364 | |
| Sum squared resid | 1.312233 | Schwarz criterion | 1.6503 | |
| Log likelihood | 121.2075 | Hannan-Quinn criter. | 1.7014 | |
| Durbin-Watson stat | 2.123290 | |||
Table 7.
Breusch–Godfrey test for multiple regression model.
| Breusch–Godfrey Serial Correlation Lagrange Multiplier Test: | |||
|---|---|---|---|
| F-statistic | 0.866350 | Prob. F (3174) | 0.4162 |
| Obs*R-squared | 1.763782 | Prob. Chi-Square (3) | 0.3943 |
© 2019 by the authors. Licensee MDPI, Basel, Switzerland. This article is an open access article distributed under the terms and conditions of the Creative Commons Attribution (CC BY) license (http://creativecommons.org/licenses/by/4.0/).
Share and Cite
MDPI and ACS Style
Trica, C.L.; Banacu, C.S.; Busu, M. Environmental Factors and Sustainability of the Circular Economy Model at the European Union Level. Sustainability 2019, 11, 1114. https://0-doi-org.brum.beds.ac.uk/10.3390/su11041114
AMA Style
Trica CL, Banacu CS, Busu M. Environmental Factors and Sustainability of the Circular Economy Model at the European Union Level. Sustainability. 2019; 11(4):1114. https://0-doi-org.brum.beds.ac.uk/10.3390/su11041114
Chicago/Turabian StyleTrica, Carmen Lenuta, Cristian Silviu Banacu, and Mihail Busu. 2019. "Environmental Factors and Sustainability of the Circular Economy Model at the European Union Level" Sustainability 11, no. 4: 1114. https://0-doi-org.brum.beds.ac.uk/10.3390/su11041114
Note that from the first issue of 2016, this journal uses article numbers instead of page numbers. See further details here.