A New Sustainable Model for Risk Management—RiMM


Entrepreneurship and Management Department, University Politehnica of Bucharest, 060042 Bucharest, Romania
*
Author to whom correspondence should be addressed.
Sustainability 2019, 11(4), 1178; https://0-doi-org.brum.beds.ac.uk/10.3390/su11041178
Submission received: 30 January 2019
/
Revised: 13 February 2019
/
Accepted: 20 February 2019
/
Published: 22 February 2019
(This article belongs to the Section Sustainable Engineering and Science)
Abstract
:All activities of a company involve risk. In order to achieve its objectives, an organization must identify, analyze, evaluate and then treat all significant risks. According to ISO international standards in the risk field, risk management can be applied to an entire organization, at its many areas and levels, at any time, as well as to specific functions, projects and activities. An effective risk management helps top management of an organization to make optimum decisions and to prevent losses. This paper proposes a new sustainable model for risk management—RiMM. The Sustainable Risk Management model is based on the Monte Carlo method (adapted for risk management process) that is known in the literature but not or very rare applied for this issue of controlling the risks in an organization. There are proposed aspects regarding the design of the model (in five detailed steps—every step with sub steps), a software implementation and an example of a case study that emphasizes the way the model can be used (also to demonstrate its efficiency) for managing risks in an organization. At the end, on conclusions section, the most important points and the contributions of the paper are clearly presented.
1. Introduction
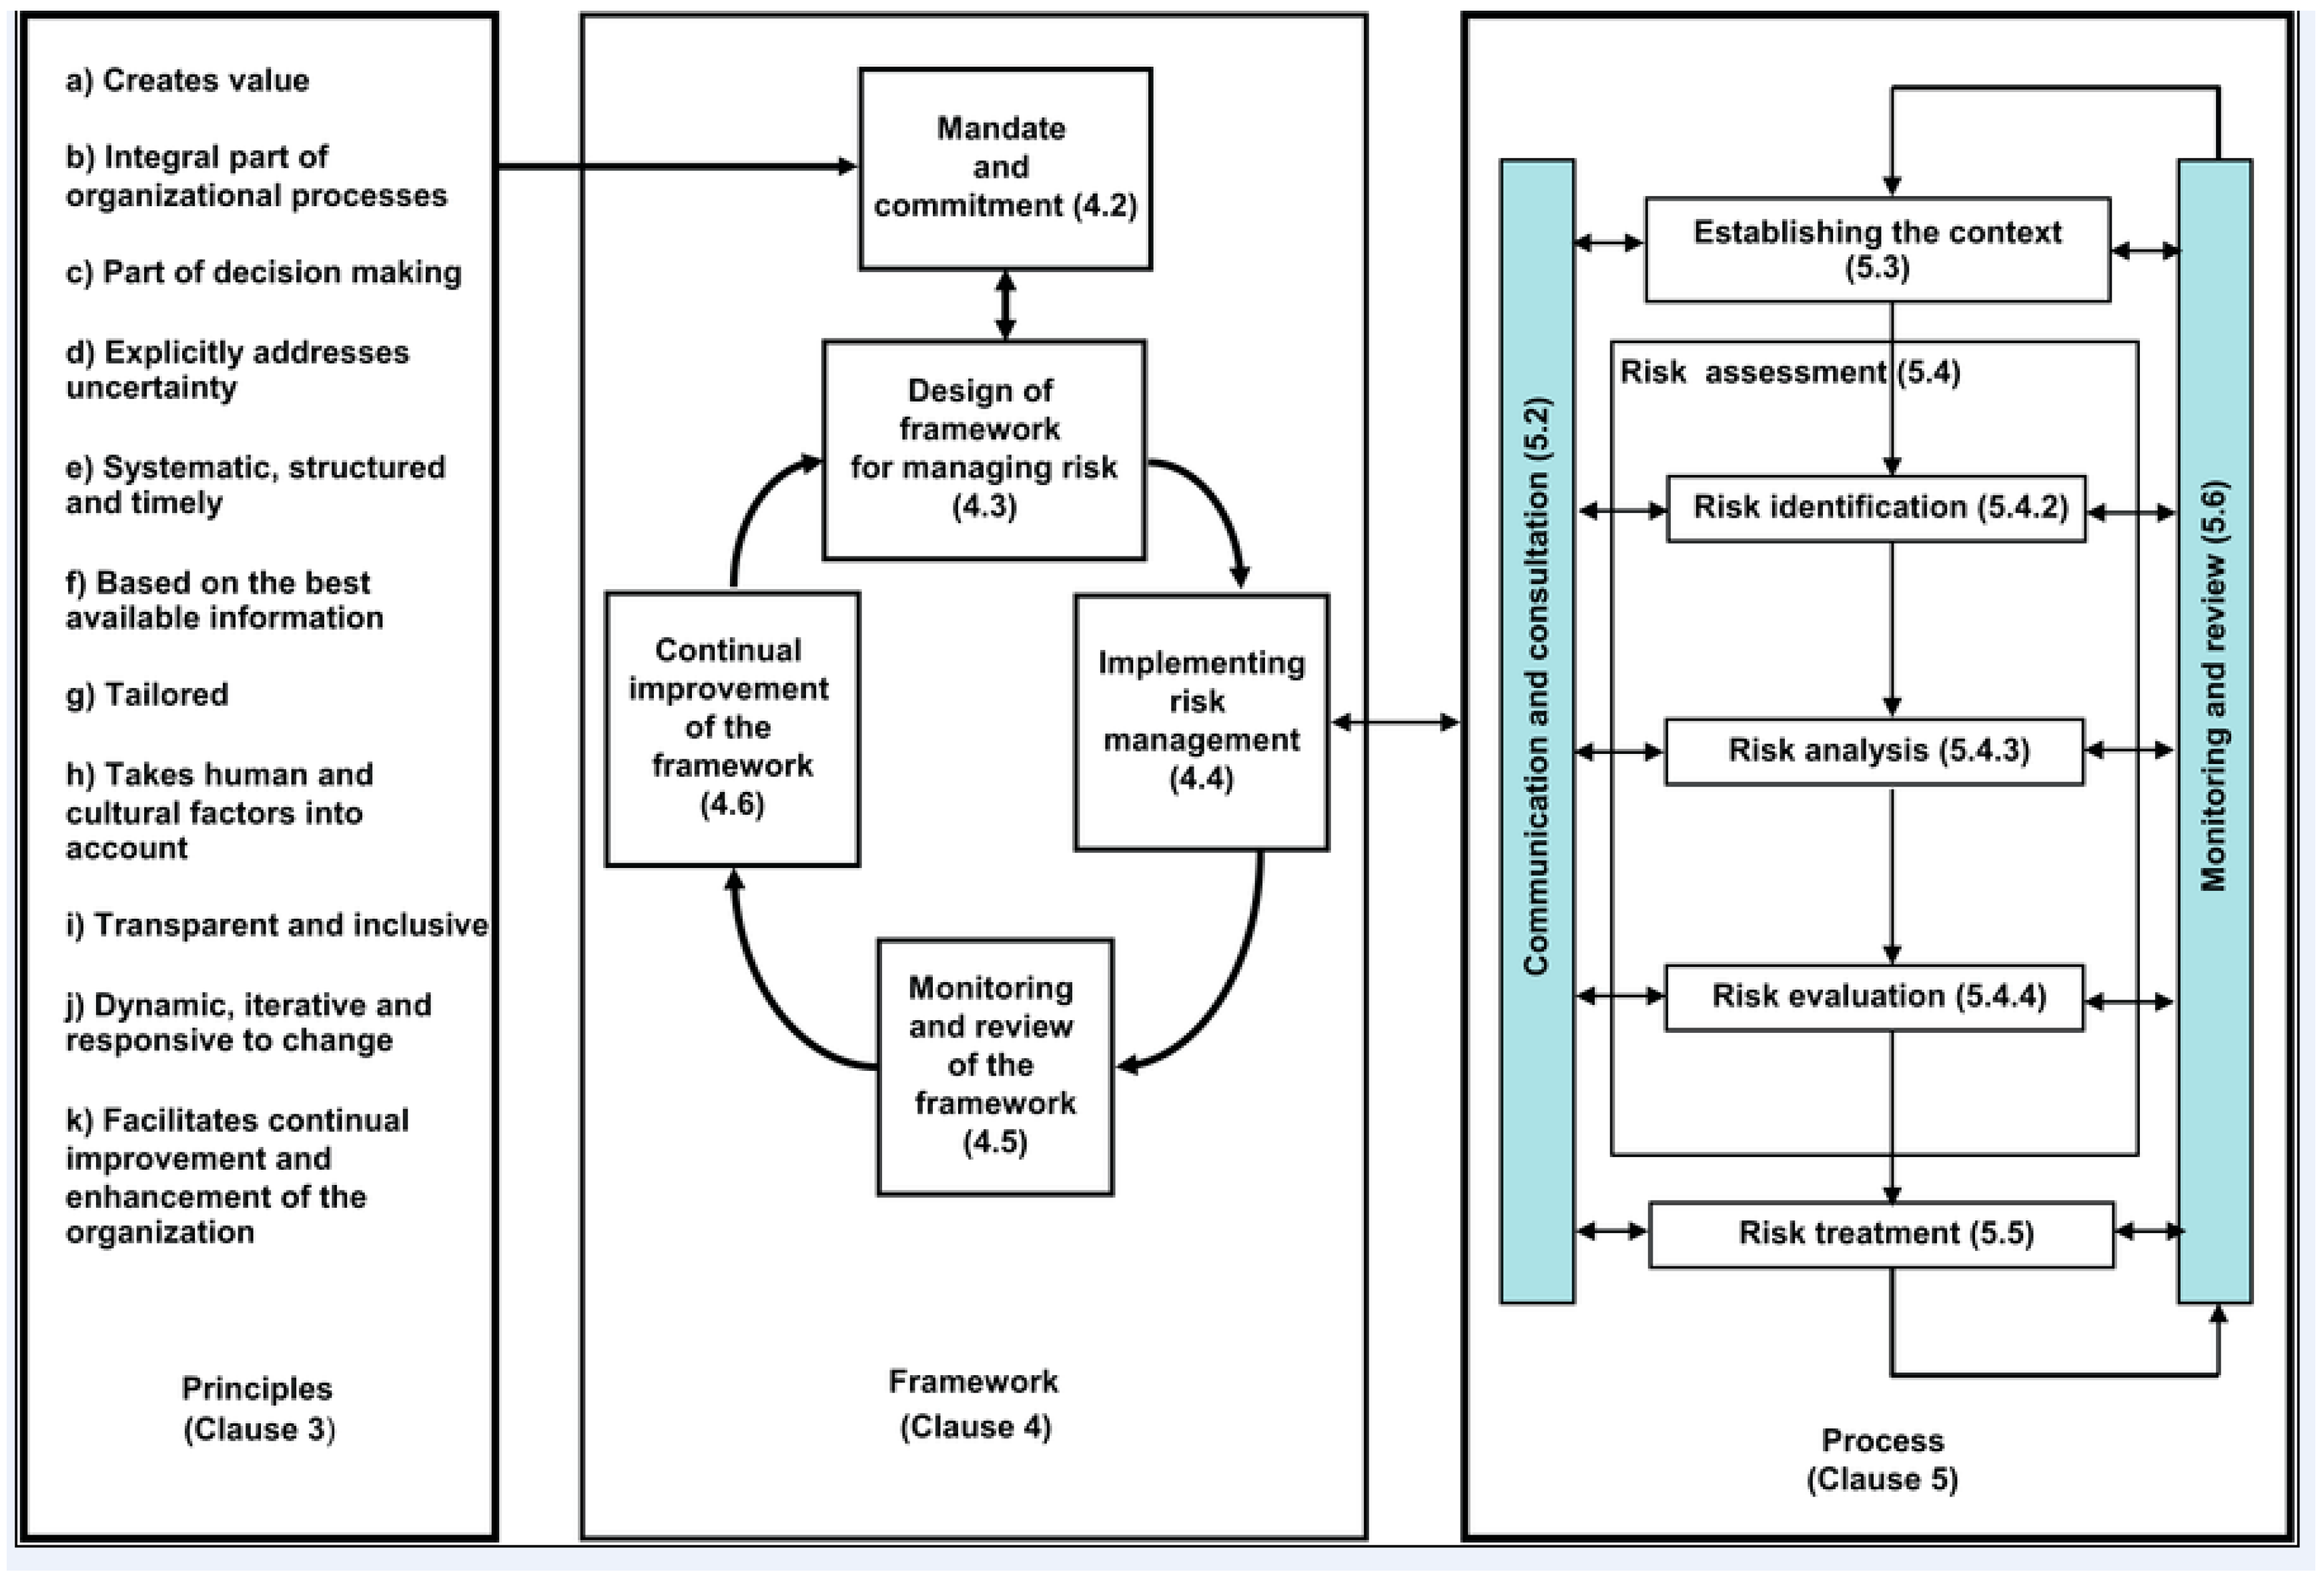
According to the ISO 31000:2009 international standard, organizations of all types and sizes face internal and external factors and influences that make it uncertain whether and when they will achieve their objectives. The effect this uncertainty has on an organization’s objectives is “risk”. The risk can be defined as “the possibility to compromise or to lose an asset” [1]. Another definition of a risk is “the combination between the likelihood and the gravity of losses” [2]. Each specific organization, sector or application of risk management brings with individual aspects (needs, criteria etc.). But it is important to understand the relationship between the “principles for managing risk, the framework in which it occurs and the risk management process”. This relationship is described in ISO 31000:2009 international standard and it is shown in Figure 1. Some advantages for managing risks in organization are [3] (selection):
- ✓
- minimize losses;
- ✓
- improve the identification of opportunities and threats;
- ✓
- encourage proactive management;
- ✓
- be aware of the need to identify and treat risk throughout the organization;
- ✓
- increase the likelihood of achieving objectives.
Green, or sustainable risk management—SRM is a process that provides a new set of tools to generate effective sustainability strategies and tactics [4].
2. RiMM, a New Model for Sustainable Risk Management—The Design/Proposal
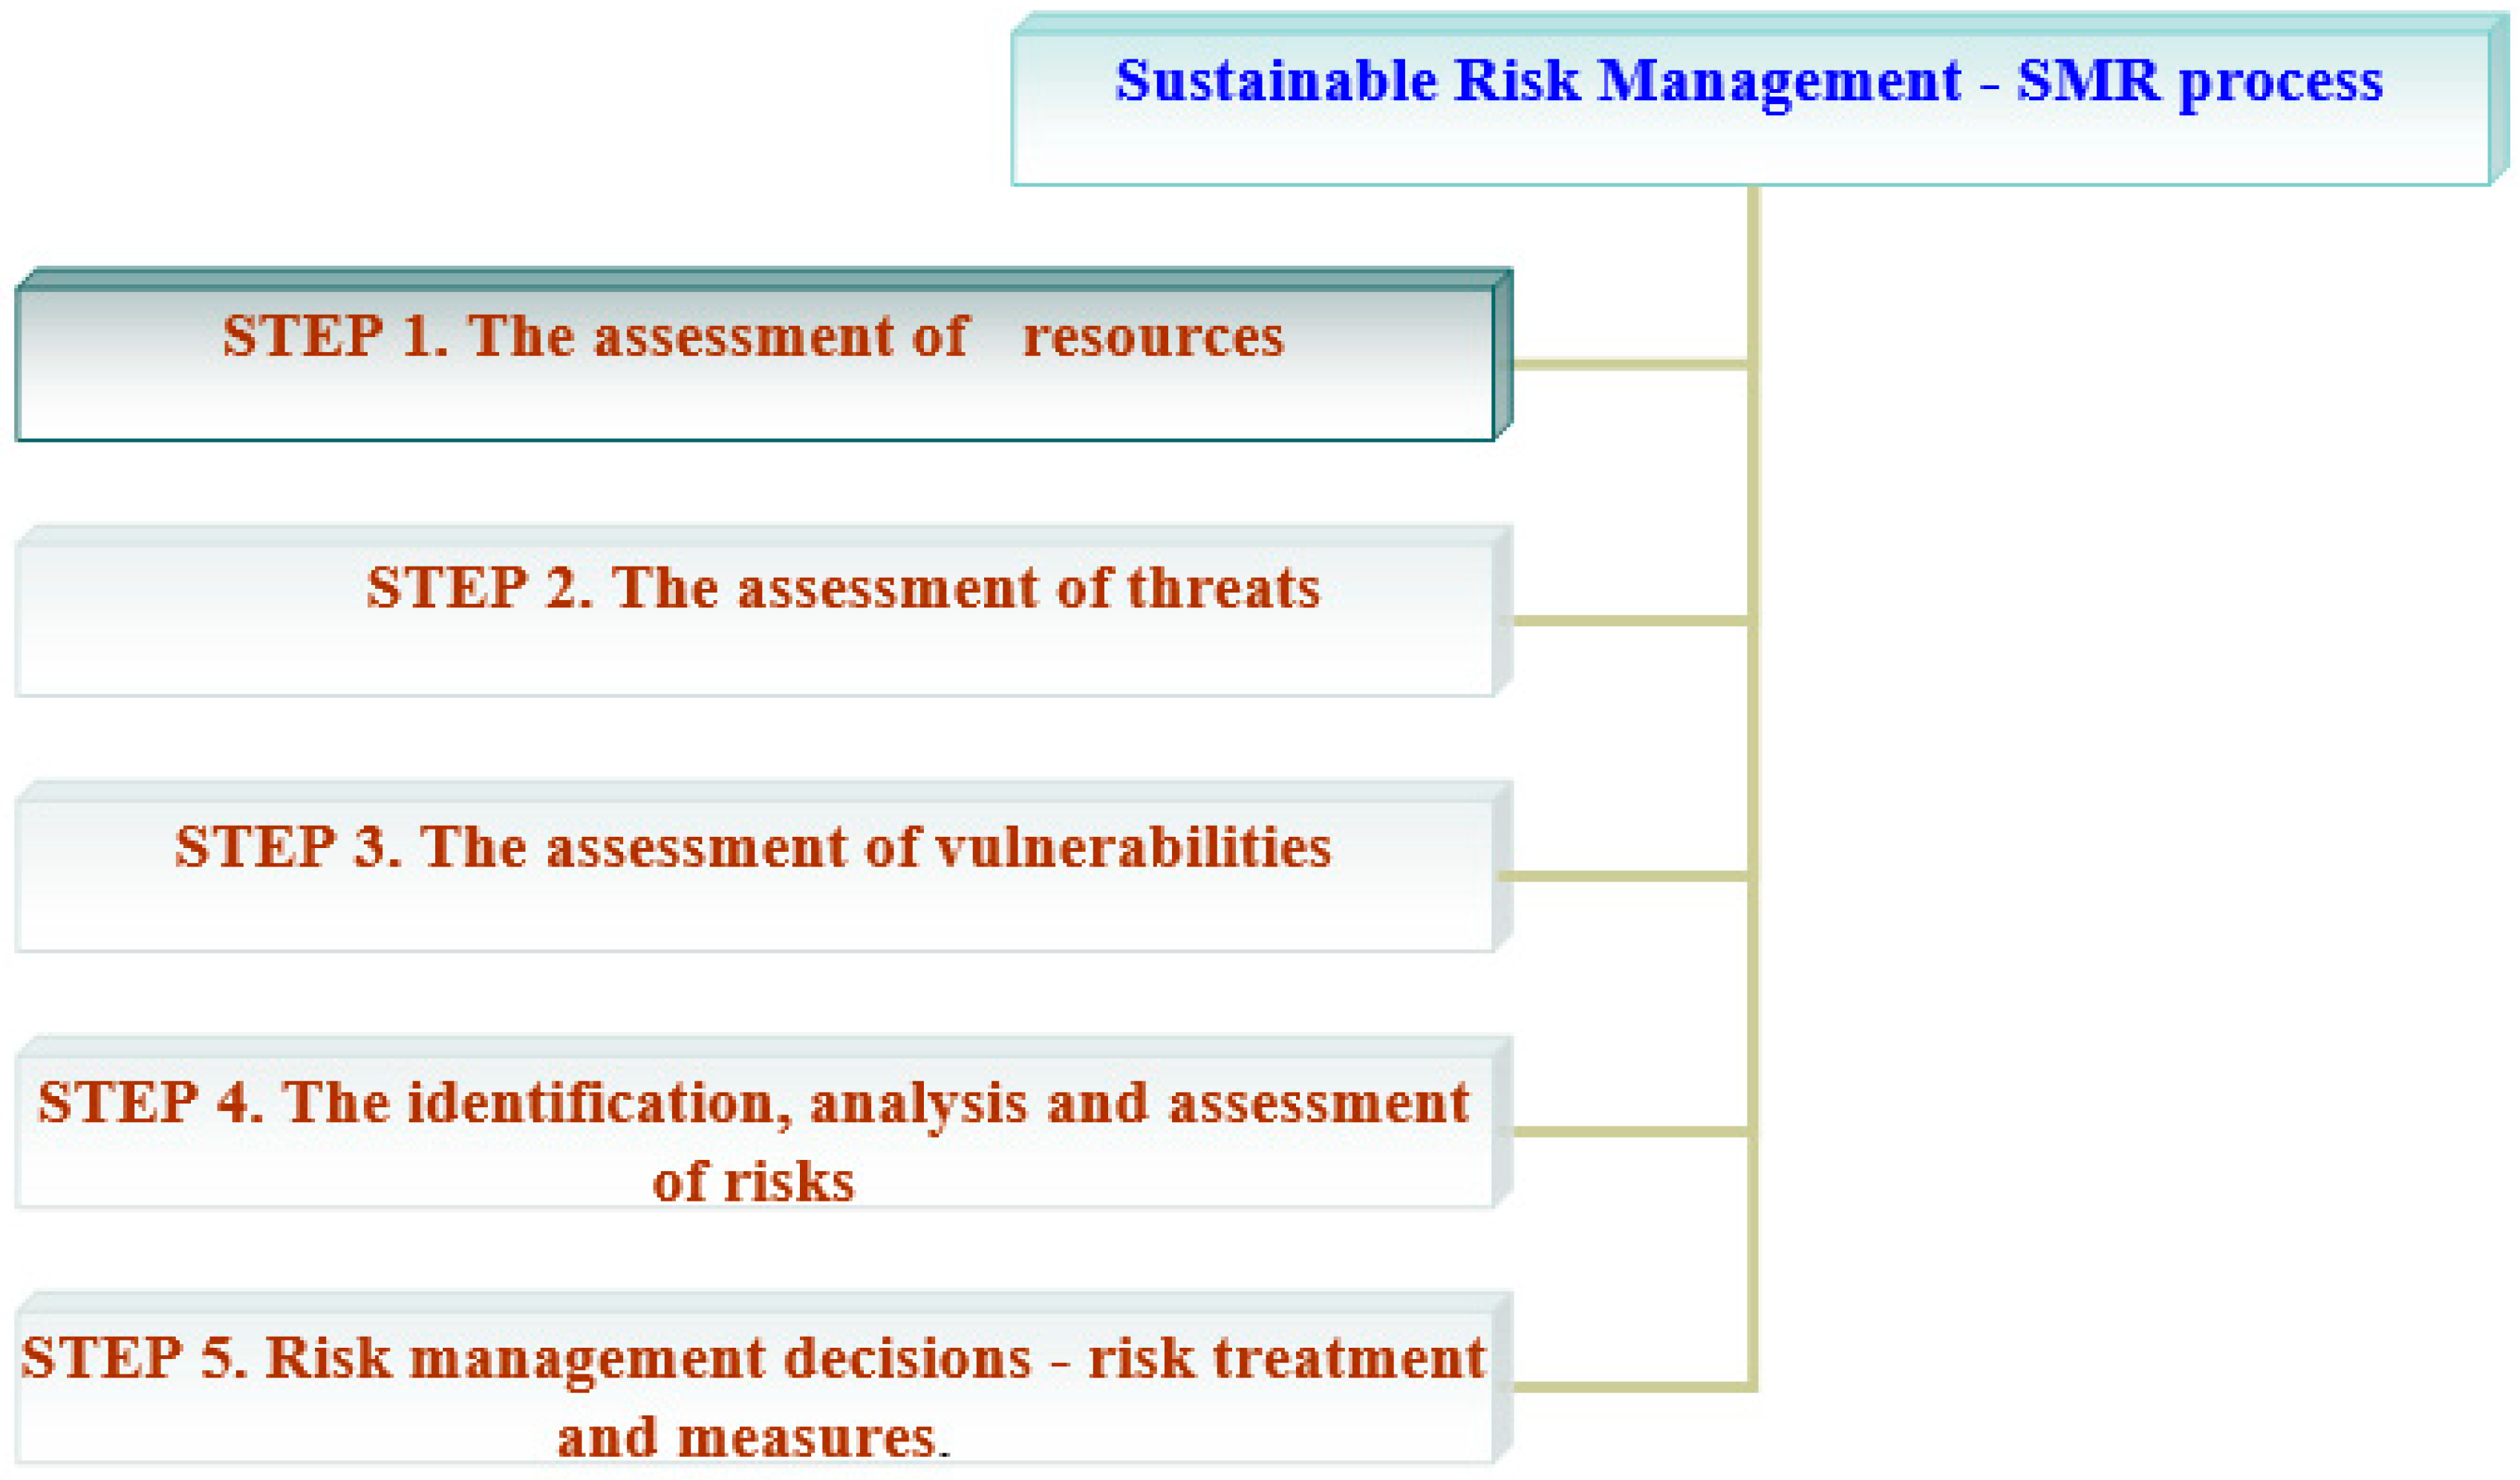
A model is the representation of a system that indicates a simplified image of reality (a system of objects, phenomena, concepts), that defines at least one its characteristic element [6]. The proposed sustainable model for risk management is in concordance with the principles for managing risk, the framework in which it occurs and the risk management process presented in the international standard ISO 31000:2009. The model is based on the recent researches (see [7] for details) regarding information security risk management and consists of the following steps (see Figure 2):
- The assessment of resources;
- The assessment of threats;
- The assessment of vulnerabilities;
- The identification, analysis and assessment of risks;
- Risk management decisions—risk treatment and countermeasures.
The proposed way to run the steps of the model is based on [2] and is described below:
1) The assessment of resources:
- The determination of critical resources (that need protection);
- The priority establishment for each resource based on the consequences of loss (1 for resources less significant, 10 for critical resources).
2) The assessment of threats (see Table 1):
- The identification of threats and categories of enemies;
- The assessment of the enemies intention and motivation;
- The assessment of enemies or threats potential;
- The determination of the occurrence frequency and threats level (regarding each critical resource) of each incidents based on statistics—according to the qualitative assessment, each threat level is calculated by frequency of occurrence:
3) The assessment of vulnerabilities (see Table 2):
- The identification of vulnerabilities (and the actual countermeasures to reduce them) regarding the critical resources;
- The estimation of the level of each vulnerability (regarding each critical resource or threat) that is calculated by probability of success:
Regarding the steps 2 and 3, an equivalence between quantitative and qualitative levels can be done: values 1 and 2 are equivalent to “very low” level; the value 3 is equivalent to low level; the value 4 is equivalent to medium level; the value 5 is equivalent to “high” level; the value 6 is equivalent to “very high” level; the value 7 is equivalent to “critical” level.
4) The identification, analysis and assessment of risks
- The estimation of the impact level regarding each critical resource;
- The estimation of the attack probability from a potential opponent;
- The estimation of the probability regarding vulnerabilities to be exploited;
- The estimation of the risk level: threat x vulnerability;
- The classification of risks identified based on an integrated evaluation.
Regarding the risk calculation, in this model the following formulas are proposed (based on [2]):
Risk = Impact x (the probability of impact)
Impact (expected) = f(RV) (function of the resource value, RV)
The probability of impact = P(I) (the probability of a resource vulnerability to be exploited through an incident I)
The level of risk is based on the value which is considered for the resource involved and on the impact of the damages regarding that resource.
It is proposed in this model for a quantitative evaluation of risks, the use of Monte Carlo method (with some modifications) that is described bellow.
2.1. The Monte Carlo Method Adapted for Risk Management Process
The Monte Carlo method is a well known method in the literature, but it is not used for risks management process. This section proposes a use of this method adapted for controlling the risks in an organization.
This method (see more in [7,8]) implies the recurrent calculation on a sample of random values and then the calculation of the average value. The method uses the Formula (1), with the following meaning: the probability of the difference between the average value calculated though this method and the average value µ to be in the error limit ε, is 99.8%.
where: N = the number of values, µ = the average value, ξ = the random variable.
The Monte Carlo method assures an estimation of the expected value for the random variables and, at the same time, the error for estimation is in proportion as the number of iterations. The total error is (see Formula (2)):
where σ is the standard deviation of the random variable, and N is the number of iterations. Superior limit for σ can be estimated through the calculation of the standard deviation between the minimum, maximum values and the random variable xi, with the Formula (3) (based on [8]):
The number of iterations for an error <2% can be calculated as follows (see Formula (4)): it is considered as a brutish value for the random variable the average between the minimum and maximum (Rmin şi Rmax of the risk), and for an error <2%, this average is divided with 50.
So, the number of iterations in order to obtain a result with an error <2% is (see Formula (5)):
The level of a risk is determined through the application of the Monte Carlo method described above and the number of iterations is done by the Formula (5). This calculation is applied for each triple values (resource, threat, vulnerability). Facultative, after this calculation for each triple values, an estimation for the standard deviation and the total error can be done. The sample of values is calculated as follows:
- ▪
- The impact is a random value between the minimum and the maximum impacts (Imin and Imax) which were defined in the first step (the assessment of resources);
- ▪
- The threat represents a random value between the minimum and the maximum levels of the threat (Amin and Amax) which were defined in the second step (the assessment of threats);
- ▪
- The vulnerability represents a random value between the minimum and the maximum apparition probability levels of an incident (Vmin and Vmax) which were defined in the third step (the assessment of vulnerabilities);
So, the Formula (6) for the risk calculation is: (Rand = the random generation of a value)
Regarding the risk evaluation, in order to find out the best risk treatment methods for the calculated risks, the impact of risks is estimated with the Formula (7):
and the probability of apparition with the Formula (8):
For the type of the risks, the following table is proposed (Table 3):
After the risk calculation, these can be viewed in a probability-impact (P-I) diagram.
5) Risk management decisions—risk treatment and countermeasures
- The treatment of identified risks and the identification of the countermeasures in order to reduce the vulnerabilities;
- The identification of the efficiency for each measure proposed;
- The estimation of the costs for each measure proposed;
- The preparation of a recommendation for the top management regarding the risks.
It is necessary to analyze the treatment method and the measures in concordance with the resource category which is exposed to a risk. It is proposed the following table (see Table 4) for risk treatment:
There are lists of countermeasures that can be reviewed with some other countermeasures identified by the evaluation team. At the end of the evaluation period (after 1 year usually), the next analysis is prepared and this action implies:
- The transfer of not treated risks;
- The transfer of not fully evaluated resources (e.g., the vulnerabilities and threats regarding a resource were not identified in time)
- The identification of new resources, threats and vulnerabilities in organization;
2.2. What Is New Regarding This Model
The model was designed by authors and it is supported by a software application and a case study during 3 months in an organization in order to validate it. The model is based on the Monte Carlo method (which it is not new) but adapted for risk management process. The contributions were outlined in the conclusions section. We have also included a special section with a comparison between RiMM and other 2 methods—see Section 2.5.
2.3. RiMM, a New Model for Sustainable Risk Management—Software Implementation, One Practical Exemplification and a Comparison with Other Methods
The software implementation (version for security risks) of the model was made for managing risks in the field of security in an organization. Details regarding the architecture of the application, the technologies used in implementation etc. can be found in [7,9].
Regarding the assumptions:
- this version of the software can be used for managing all types of risks, not only the security ones,
- the model proposed in this paper can be applied not only in classical way, without using computers, but in an automated approach (automated calculation) in order to identify, analyze, evaluate and then treat and provide countermeasures to all significant risks across an organization.
- The input data must be provided to the application which makes the analysis and assessment of security risks.
Other functionalities:
- ✓
- The probability—impact diagrams can be generated and viewed;
- ✓
- Reports generation regarding the analysis made;
- ✓
- The application allows the transition to the next analysis which implies the transfer of not treated risks and not fully evaluated resources;
Some limitations of the software application:
- The data regarding resources, threats and vulnerabilities are introduced in the application by humans—there could be errors;
- The software application provides a list of countermeasures from which the management should choose to apply in order to treat the every analyzed risk.
2.4. The Application of the RiMM Model to a Practical Example
This section presents an example regarding how the model/software was used (and can be used) to manage risks in an organization. By following the steps proposed in the previous section, we can manage all the risks in an organization. Due to confidentiality reasons, only one example of a risk, together with the measures taken by the company, is presented below:
The Description of Risk Risk_Workstation_Backup_System_of_Information:
- ✓
- STEP 1: The assessment of resources—Resource: workstations in organization and the back-up system of information—Impact min = 5; Impact max = 7;/Resource category: equipments;
- ✓
- STEP 2: The assessment of threats—Threat: to fail to do back-up of information by the IT responsible or workstations down and possible loss of data—Threat min = Low/0.34; Threat max = Medium/1;
- ✓
- STEP 3: The assessment of vulnerabilities—Vulnerability: the back-up system is not an automated one/the workstations are old with continuous working, possible loss of data—Vulnerability min = Low/0%–33%; Vulnerability max = Medium/3%–66%;
- ✓
- STEP 4: The identification, analysis and assessment of risks—Details regarding the risk Risk_Workstation_Backup_System_of_Information: see theTable 5;
- ✓
- STEP 5: Risk management decisions—risk treatment and countermeasures—Solutions adopted and implemented in organization: the acquisition of new workstations/an automated back-up system of information so that the activity of the company not to be affected by periodical back-up, usually made at night; by this automated back-up, the availability of information is assured 24/24 and the losses of data are avoided.
- ✓
- The costs for treatment of risk R_W_BSI: 0 Euro (the responsible—IT department) for the automated back-up system of information; 500 Euro*number of workstations, for the acquisition of new workstations;
- ✓
- Is risk Risk_Workstation_Backup_System_of_Information treated? = YES.
Such an analysis was made (and can be used in organizations of all types and sizes) for all risks identified in the organization in order to protect the objectives of the company (risk management is a support process for an organization in order to achieve its objectives)—there was a case study in a Romanian organization during 3 months applying the model.
2.5. A Short Comparison to Other Methods
In the literature there are other methods such as:
- ➢
- CRAMM (C.C.T.A. Risk Analysis and Management Method)—it is a method developed by the British governmental organization C.C.T.A. (Central Communication and Telecommunication Agency). Currently, CRAMM is the UK’s preferred risk analysis method.
- ➢
- OCTAVE v2.0—Operationally Critical Threat, Asset, and Vulnerability EvaluationSM defines a strategic risk-based security technique. Octave is a “self-directed” approach, meaning people in the organization assume responsibility for setting the organization’s security strategy.
Below there is a comparative table (Table 6) regarding the three methods.
3. Conclusions
The Sustainability Risk Management (SRM) process helps an organization to begin the sustainability journey. It follows the time tested risk management process, only it is modified to include sustainable opportunities and benefits [4]. The dynamic context in which an organization exists implies a high importance to the risk management process. The necessity of risk management comes from the organizational medium analysis which is in a continuous transformation. Risk management means to identify, analyze, evaluate and then treat all significant risks in order to create a framework which sustains the achievement of organizational objectives. Risk management helps the organization to define its policy in domain and implies a process for the selection and implementation of measures in order to obtain an acceptable risk level, at an acceptable cost [2]. It is easily to evaluate the losses as a consequence to an incident, but hardly to justify investments before the incident takes place. The most important contributions of the paper are:
- The proposal of the model;
- The implementation of the model;
- A case study in an organization, plus a practical exemplification;
- A short comparison to other two methods for risk management.
Author Contributions
Conceptualization, O.N.; Formal analysis, B.T.; Funding acquisition, B.T.; Project administration, M.P.; Supervision, A.N., O.N. and M.P.; Validation, M.P.; Writing—original draft, B.T.; Writing—review and editing, B.T. and A.N.
Funding
This work has been funded by University Politehnica of Bucharest, through the “ARUT Grants” Program, UPB—GNaC. Identifier: GNaC 2018, Contract: No 16/06.02.2019 RM-CYBERSEC.
Conflicts of Interest
The authors declare no conflict of interest.
References
- Roper, C. Risk Management for Security Professionals; Butterworth Heinemann: Boston, MA, USA, 1999; ISBN 0-7506-7113-0. [Google Scholar]
- Pandian, R. Applied Software Risk Management; Auerbach Publications Taylor & Francis Group: London, UK, 2007; ISBN 0-8493-0524-1. [Google Scholar]
- Risk Management—Principles and Guidelines. Available online: https://www.iso.org/obp/ui/#iso:std:iso:31000:ed-1:v1:en (accessed on 20 January 2015).
- Bushnell, S. What Is the Sustainable Risk Management Process? Available online: https://www.poplarnetwork.com/news/what-sustainable-risk-management-process (accessed on 5 January 2019).
- ISO 31000:2009 International Standard: Risk Management—Principles and Guidelines. Available online: https://www.iso.org (accessed on 5 January 2019).
- Purcărea, A.A. Management and Industrial Engineering. Mathematical Models; Niculescu Publishing House: Bucharest, Romania, 2003; 320p. [Google Scholar]
- Ţigănoaia, B. Information Security Assurance in Organizations; Strategic and Security Studies Series; European Institute Publishing House: Iasi, Romania, 2013; ISBN 978-973-611-997-2. [Google Scholar]
- Jeges, R. Monte Carlo Simulation in MS Excel. 2001. Available online: http://www.projectware.com.au/ (accessed on 5 June 2015).
- Ţigănoaia, B.; Macari, C. Application Development for Analyzing and Assessing Security Risks within an Organization; MTA Review: Bucharest, Romania, 2011; Volume XXI, pp. 175–188, No. 3 (Sep), ISSN code: 1843-3391, indexing: Ulrich’s International Periodicals Directory, Index Copernicus International, CNCSIS (cod 842), The Lancaster Index, 2011. [Google Scholar]
Figure 1.
Between the risk management principles, framework and process-ISO 31000:2009 [5].
Figure 1.
Between the risk management principles, framework and process-ISO 31000:2009 [5].

Figure 2.
The sustainable model for risk management–steps.

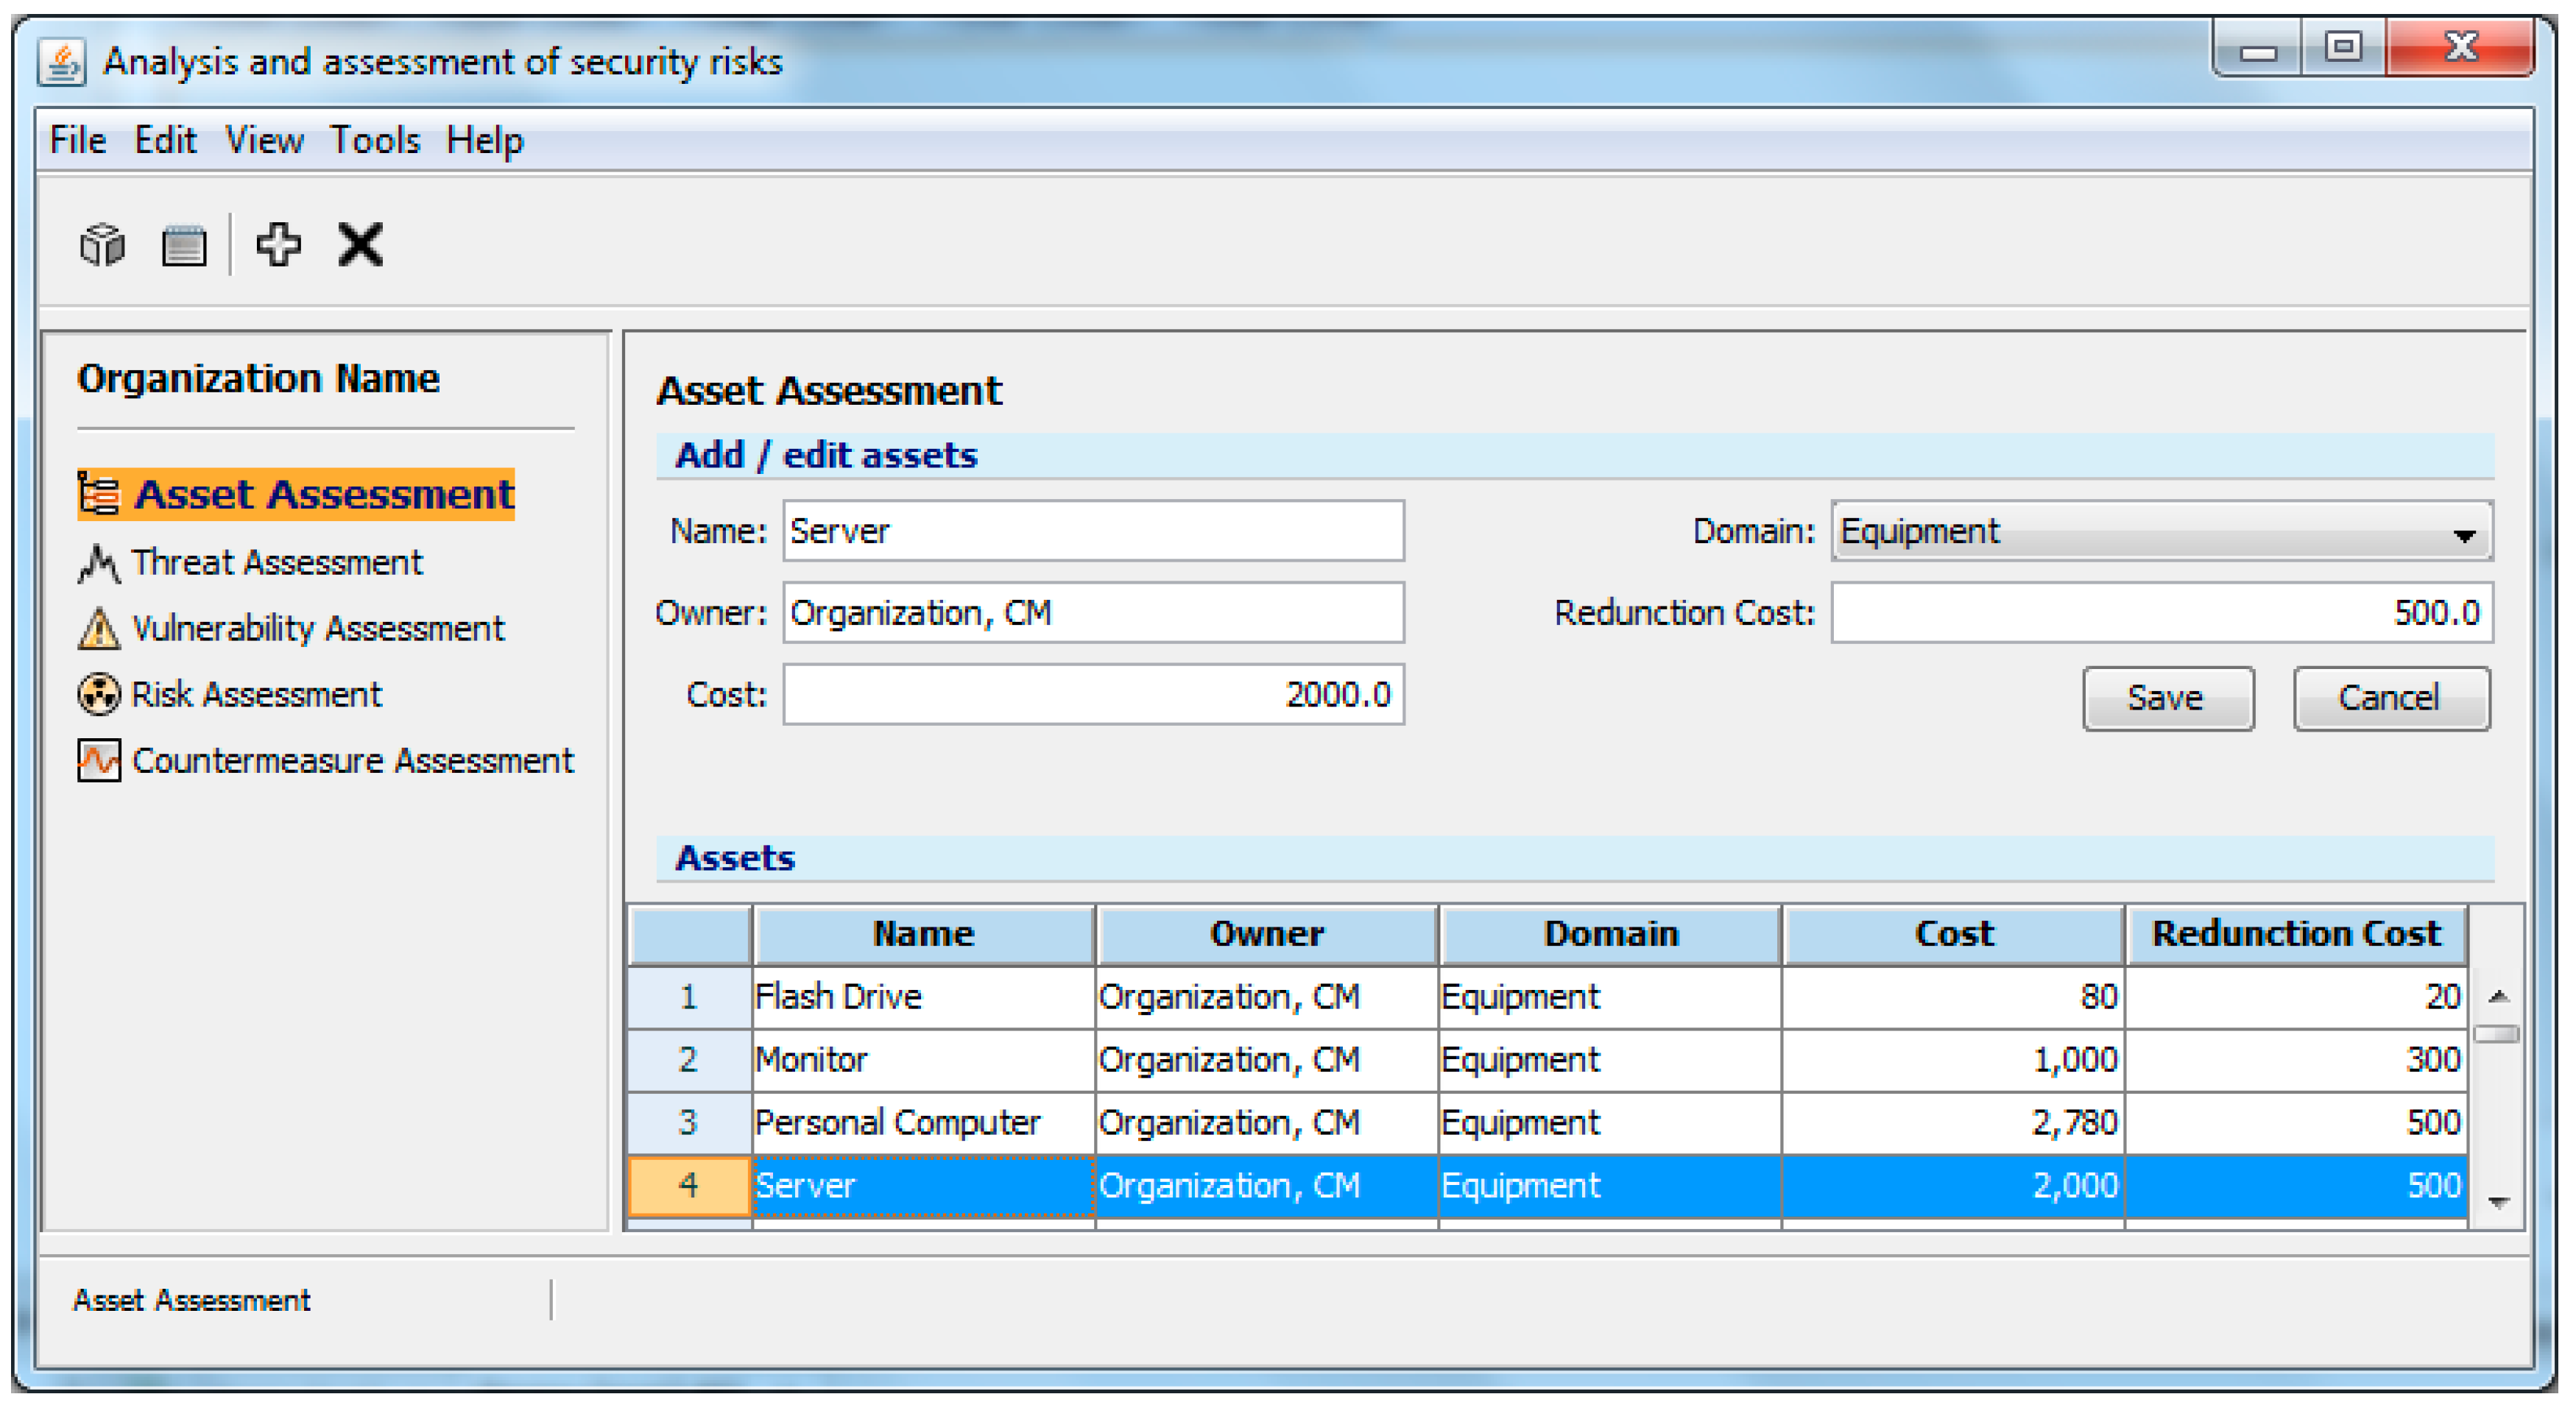
Figure 3.
The asset assessment–example.

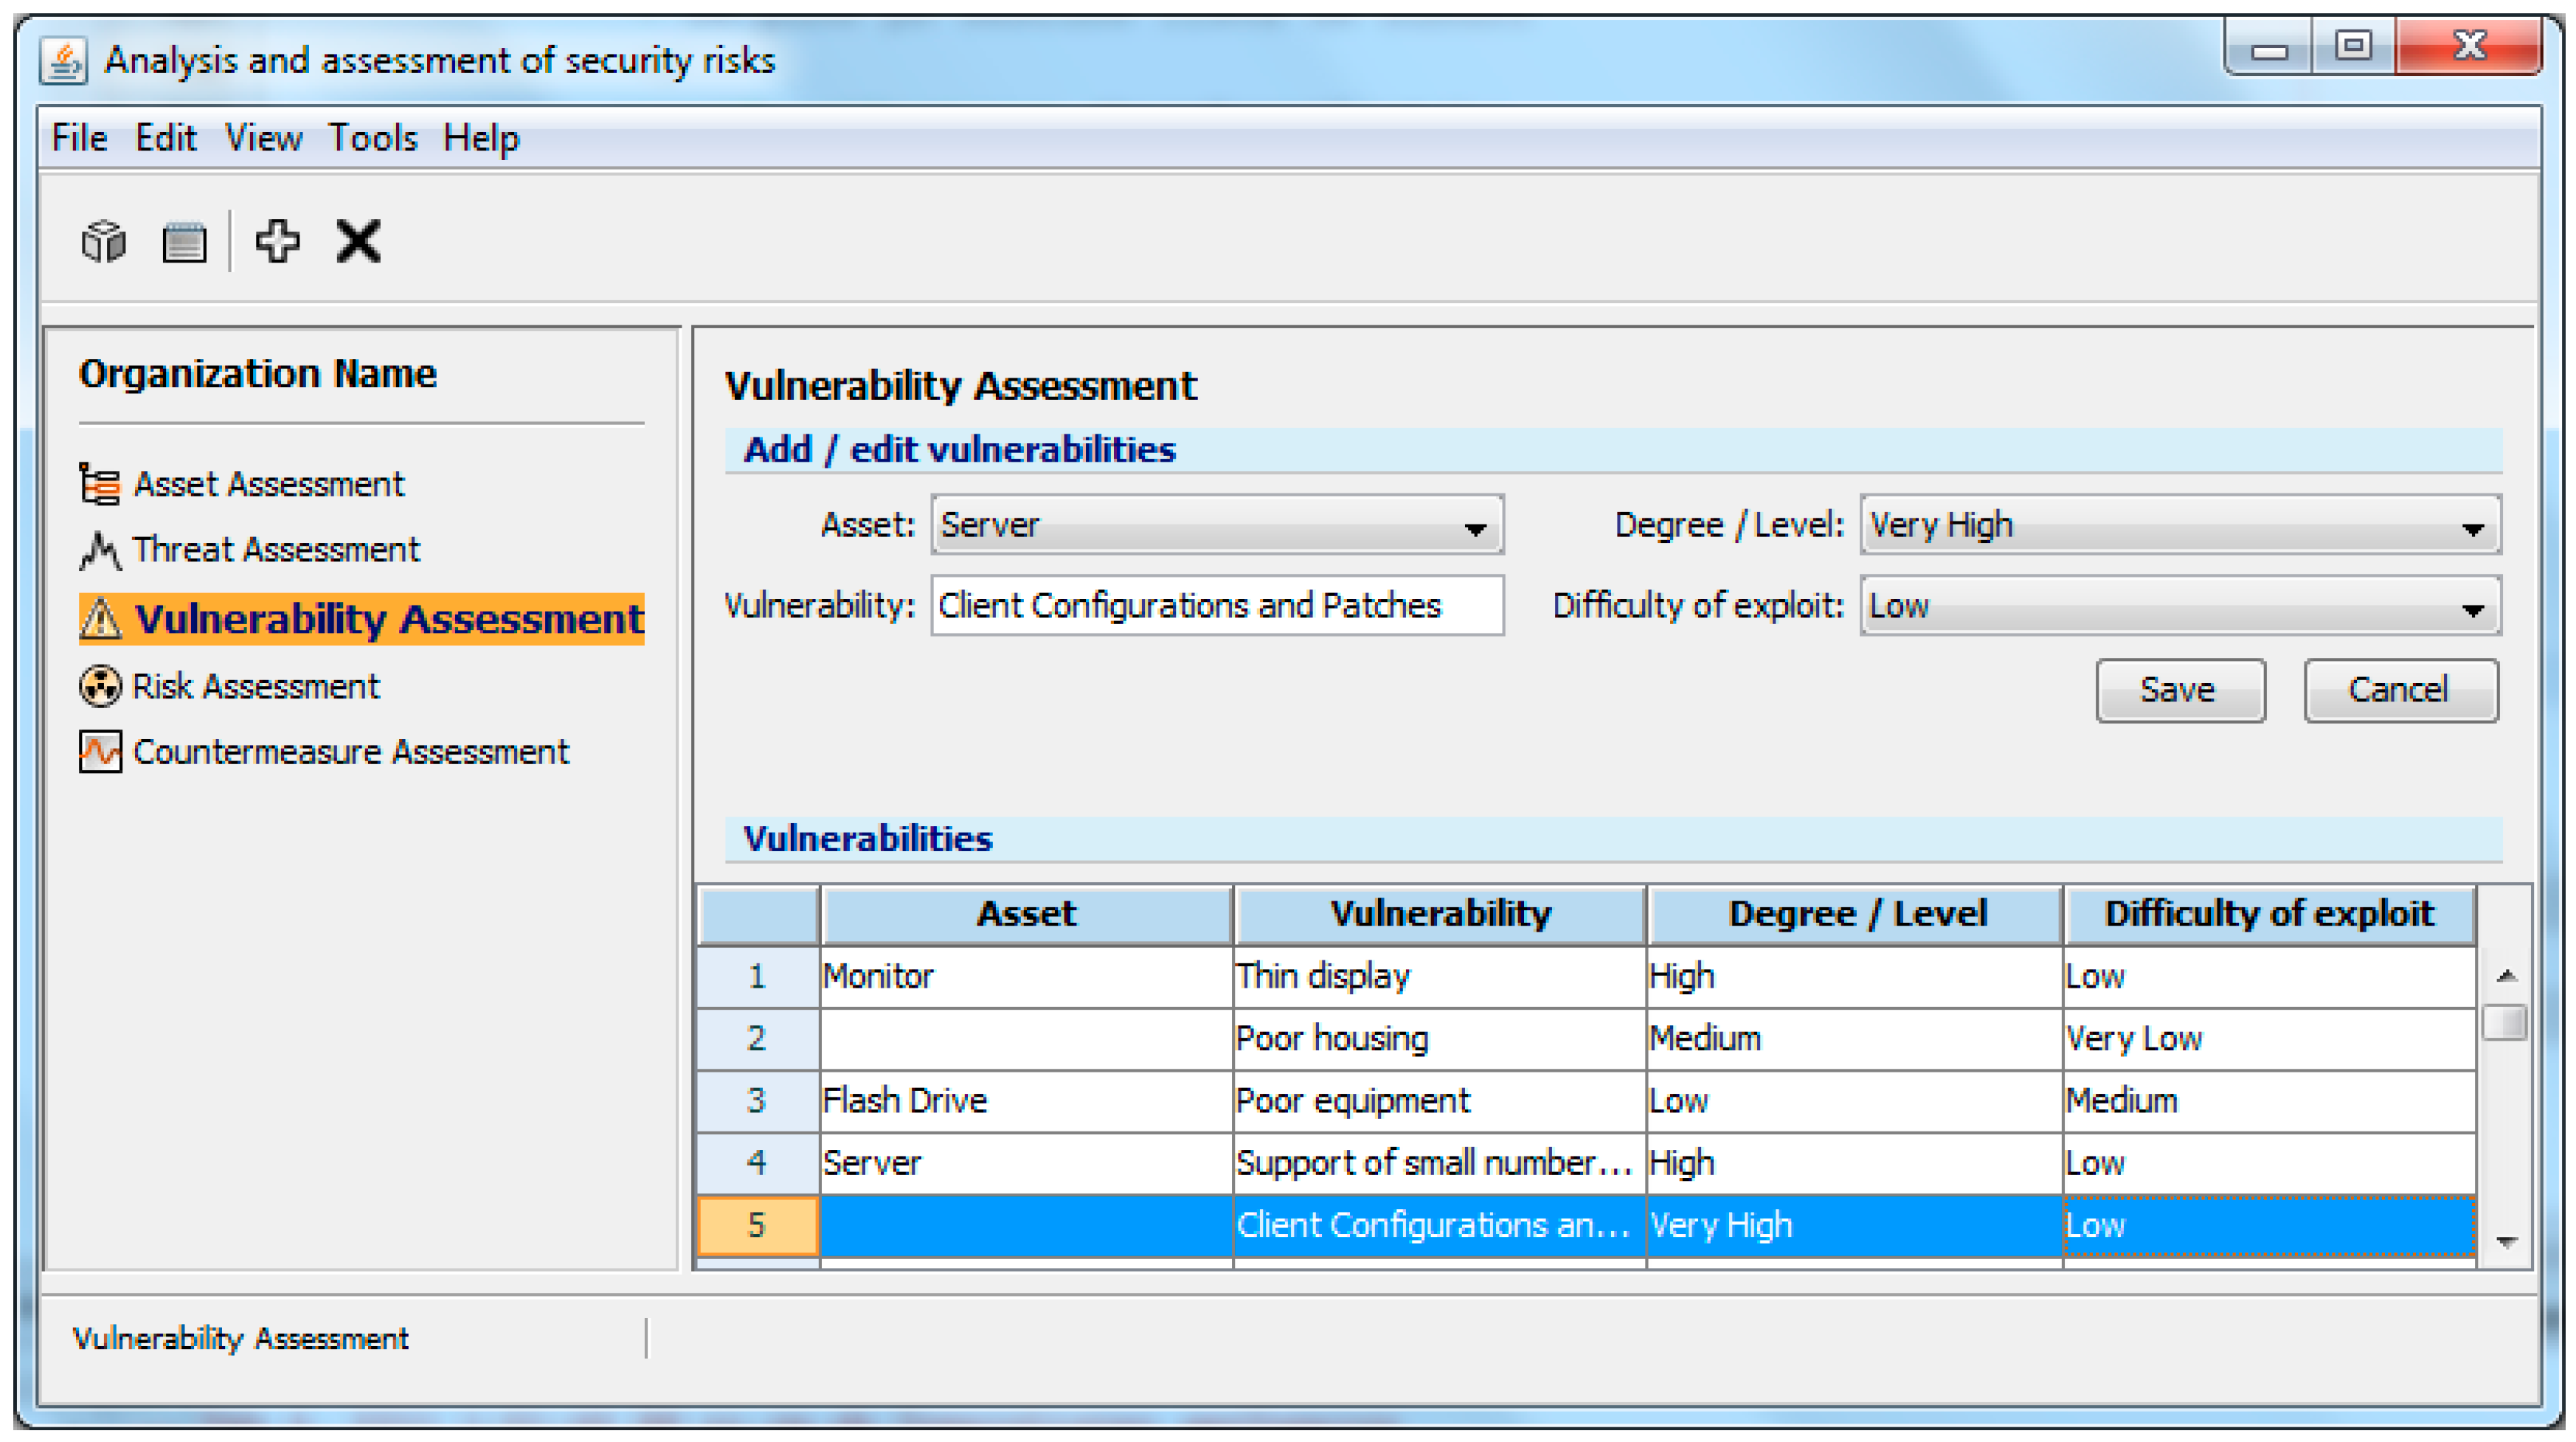
Figure 4.
Security risks assessment–vulnerabilities.


Table 1.
Threat assessment (proposal).
| Frequency | Level |
|---|---|
| Occurrence of an incident once every 6 years | Very low |
| Occurrence of an incident once every 3 years | Low |
| Occurrence of an incident once in a year | Medium |
| Occurrence of an incident once every 6 months | High |
| Occurrence of an incident once every month | Very high |
Table 2.
Vulnerability assessment (proposal).
| Probability | Level |
|---|---|
| In the worst case scenario, an incident is likely to occur 25% chance | Low |
| In the worst case scenario, an incident is likely to occur between 25% and 50% chance | Medium |
| In the worst case scenario, an incident is likely to occur more than 50% chance | High |
Table 3.
The type of the risks—the mapping of the risks (proposal).
| The Rule | The Type of the Risk |
|---|---|
| Impact <= 1 | Trivial |
| 1 < Impact <= 5 AND the probability of apparition <= 50% | Nominal |
| Impact > 5 | Hazard |
| 1 < Impact <= 5 AND the probability of apparition > 50% | Sure risk |
Table 4.
Methods for risk treatment (proposal).
| Rule | Treatment Method |
|---|---|
| the probability of apparition <= 15% | Retention (accept and budget) |
| 15% < the probability of apparition <= 65% | Reduction (optimize–mitigate) |
| the probability of apparition > 65% | Avoidance (eliminate, withdraw from or not become involved)/Sharing (transfer–outsource or insure) |
Table 5.
The risk R_W_BSI–details.
| Risk | Level | Impact | Probability | Type of Risk | Treatment |
|---|---|---|---|---|---|
| R_W_BSI | 2 | 5.89 | 33% | Nominal | Reduction |
Table 6.
The risk R_W_BSI–details.
| The Name of the Method | Level of Detail/Management—M, Operational—O, Technic—T | Free | Abilities to Introduce/Use/Mentain | Instruments | Origin Country |
|---|---|---|---|---|---|
| CRAMM | M, O, T | No | Specialist/Specialist/Specialist | YES, comerial | UK |
| OCTAVE v2.0 | M, O | YES | Standard/Standard/Standard | YES, comercial | USA |
| RiMM | M, O, T | YES | Standard/Standard/Standard | YES, software | Romania |
© 2019 by the authors. Licensee MDPI, Basel, Switzerland. This article is an open access article distributed under the terms and conditions of the Creative Commons Attribution (CC BY) license (http://creativecommons.org/licenses/by/4.0/).
Share and Cite
MDPI and ACS Style
Tiganoaia, B.; Niculescu, A.; Negoita, O.; Popescu, M. A New Sustainable Model for Risk Management—RiMM. Sustainability 2019, 11, 1178. https://0-doi-org.brum.beds.ac.uk/10.3390/su11041178
AMA Style
Tiganoaia B, Niculescu A, Negoita O, Popescu M. A New Sustainable Model for Risk Management—RiMM. Sustainability. 2019; 11(4):1178. https://0-doi-org.brum.beds.ac.uk/10.3390/su11041178
Chicago/Turabian StyleTiganoaia, Bogdan, Andrei Niculescu, Olivia Negoita, and Mirona Popescu. 2019. "A New Sustainable Model for Risk Management—RiMM" Sustainability 11, no. 4: 1178. https://0-doi-org.brum.beds.ac.uk/10.3390/su11041178
Note that from the first issue of 2016, this journal uses article numbers instead of page numbers. See further details here.