Sustainable Development in the Central and Eastern European Countries (CEECs): Challenges and Opportunities


Faculty of Economics, Management and Tourism, Wrocław University of Economics, 3 Nowowiejska Street, 58-500 Jelenia Góra, Poland
*
Author to whom correspondence should be addressed.
Sustainability 2019, 11(4), 1180; https://0-doi-org.brum.beds.ac.uk/10.3390/su11041180
Submission received: 20 January 2019
/
Revised: 18 February 2019
/
Accepted: 19 February 2019
/
Published: 23 February 2019
Abstract
:The purpose of the study was to analyze and present the position of the Central and Eastern European Countries (CEECs) in terms of levels of sustainable development concept implementation in the years 2010–2016. The second purpose and the added value of the conducted research was to identify the selected opportunities and challenges related to sustainable development in the CEE countries. The research was based on 66 indicators that monitored the Sustainable Development Goals (SDGs) from the global perspective. Eurostat (database: sustainable development indicators) was the source of data in terms of their availability and integrity. Implementation of the concept of sustainable development was assessed using the synthetic measure of development (SMD). The past and current socioeconomic situation in the group of CEE countries is presented in the introduction. The theoretical aspects of sustainable development are discussed, taking into account social, economic, environmental, spatial, as well as institutional and political areas. The concept of integrated order is also considered. The core part of the study presents the research results showing the position of the CEE countries regarding the implementation levels of the sustainable development concept. The value of SMD in individual years is specified for each of the analyzed countries. It was concluded that the situation of all countries improved over the analyzed period of time. Nevertheless, the current situation is not favorable in any of the analyzed countries: However, the Czech Republic and Slovenia are very close to achieving such status. Apart from the aforementioned two countries, in 2016 a moderate situation was observed in Estonia, Hungary, Slovakia, Poland, Lithuania, Latvia, and Croatia. Bulgaria and Romania still remain at a disadvantage, despite having made noticeable progress.
1. Introduction
In 2004, on the eve of the accession of the Czech Republic, Poland, Lithuania, Latvia, Estonia, Slovakia, Slovenia, and Hungary to the European Union (EU) structures (Bulgaria and Romania joined the EU in 2007 and Croatia in 2013), the concept of sustainable development was approached by the Central and Eastern European Countries (CEECs) as an ambitious development challenge. It was, however, overshadowed by existing socioeconomic problems (relatively high unemployment rates, major infrastructural backwardness, the need for better transport connections between the discussed area and other parts of Europe, progressive emigration of the population, relatively low purchasing power of households, the quality of legislation, environment protection standards, etc.). At this point, an assumption can be made that close cooperation between public and private sectors, as well as nongovernmental organizations (NGOs), often identified as representatives of the communities in these particular countries, is an important component of sustainable development concept implementation, primarily for the catching-up of CEE countries [1,2,3,4,5,6]. Beginning with the preliminary initiatives aimed at the consistent implementation of the principles of sustainable development, the focus of the CEE countries has been on three basic dimensions, i.e., environmental, economic, and social dimensions. The most developed European countries, e.g., Germany, the United Kingdom, France, or Scandinavian countries, can be adopted as a benchmark for countries working their way up [7].
After a dozen or so years since the majority of the CEE countries’ accession to the European Union, their current situation is quite different, as they have made a significant leap forward in civilization. For example, for a long time the unemployment rate in the Czech Republic was the lowest in the entire European Union, but recently it has even fallen below 2%. All the CEE countries are characterized by the highest level of the Human Development Index (HDI), “Very High Human Development”, showing values above 0.8 in 2017. The region is becoming increasingly attractive in terms of bringing foreign investment, and the CEE countries also coped relatively well with the global crisis of 2009–2010, achieving above-average levels of economic growth, measured by the gross domestic product (GDP) in the years following [8,9,10,11,12,13].
However, the above listed positive characteristics do not mean that the discussed countries have already reached optimal development levels, as many issues are still in need of improvement. Sustainable development remains particularly important for the CEE region, because this concept implementation can support a transition toward a better quality of life, a cleaner environment, a higher level of social activity, and a lower level of poverty, and can ensure the cultivation of equality and tolerance as well as more effective public governance [14,15,16].
The analysis presented in this article covers the following 11 CEE countries: Bulgaria, Croatia, the Czech Republic, Estonia, Hungary, Latvia, Lithuania, Poland, Romania, Slovakia, and Slovenia. Such delimitation resulted from the classification provided by the Organization for Economic Co-operation and Development (OECD) and was used in the article [17]. OECD also includes Albania in the group of CEE countries, but Eurostat data were not available for this country and therefore it was not covered by the conducted analysis. It should be added that Central and Eastern Europe, depending on the adopted criteria, can also include Belarus, the Ukraine, Bosnia and Herzegovina, Serbia, Montenegro, Macedonia, or Kosovo (unrecognized by some countries in the world).
Considering the theoretical aspects of sustainable development, it is understood as the management method that ensures meeting the needs of the present generation without diminishing the needs of future generations. Intergenerational justice is one of its aspects, i.e., in simplified terms, the need for preserving the capital ingrained in nature for future generations through the economic management of natural resources, rational use of its potential, maintaining environmental balance, and the recirculation of resources [18,19,20,21,22]. The natural environment, perceived in terms of sustainable development, remains its foundation, a tool for the economy, well-being, a high quality of life, and the objective of performed activities. Reducing the consumption of renewable resources to a level allowing their recovery and limiting the consumption of nonrenewable resources (ensuring their gradual replacement by appropriate substitutes) can be listed among many components of the concept of sustainable development. In addition, the gradual elimination of hazardous and toxic substances from economic processes and maintaining emissions within the limits defined by the assimilation capacity of the environment are essential. Biological diversity should be restored and permanently protected at the landscape, ecosystem, species, and gene level. The socialization of decision-making processes concerning the local natural environment and projects affecting socioeconomic development remains yet another component characterizing sustainable development. Moreover, the pursuit toward ensuring a sense of security and well-being for citizens, approached as creating conditions beneficial for their physical, mental, and social health, should be mentioned. Citizens have to feel co-responsible for the environment in which they function by shaping it in a responsible and well-thought-over manner. It should be emphasized that spatial, political, and institutional, as well as cultural, dimensions are also taken into account in the subject literature discussing sustainable development [23,24,25,26,27,28,29,30,31]. Integrated order, understood as the positive target state of developmental changes combining (in a coherent and consistent way) such component orders as economic, social (including institutional and political), and environmental (including spatial) orders, represents the benchmarking essence of sustainable development. Moderate anthropocentrism is considered the minimum axiological threshold for creating the aforementioned orders [32].
The following sustainable development goals (SDGs) are important for the research results presented in the study [33,34,35,36,37,38,39]: Reducing poverty in all its forms and everywhere; eliminating hunger, achieving food security, improving nutrition, and promoting sustainable agriculture; ensuring a healthy lifestyle and well-being for all at all ages; providing an inclusive and equitable quality of education and promoting lifelong learning opportunities for all; achieving gender equality and empowering all females; implementing the availability and sustainable management of water and sanitation for all; providing access to affordable, reliable, sustainable, and modern energy for all; promoting sustained, inclusive, and sustainable economic growth, full and productive employment, and decent work for all; developing resilient infrastructure, promoting inclusive and sustainable industrialization, and fostering innovation; reducing inequality within and among countries; making cities and human settlements inclusive, safe, resilient, and sustainable; ensuring sustainable consumption and production patterns; taking urgent action to combat climate change and its impacts; conserving and using sustainably the oceans, seas, and marine resources for sustainable development; protecting, restoring, and promoting sustainable usage of terrestrial ecosystems, managing forests sustainably, combating desertification as well as halting and reversing land degradation and biodiversity loss; promoting peaceful and inclusive societies for sustainable development, providing access to justice for all and building effective, accountable, and inclusive institutions at all levels; and strengthening the means of implementation and revitalizing the global partnership for sustainable development.
The above goals were quoted in their full form. In the next part of the study, their short titles are used (see Table 1). The listed goals and the indicators assigned to them, for which Eurostat public statistics [40] are available, were used in the study to analyze the implementation status of the sustainable development concept in CEE countries. The aforementioned 17 SDGs and their related indicators are perceived as the most important part of the United Nation’s 2030 Agenda for Sustainable Development, which introduced a new framework of operations, in global terms, aimed at, e.g., eliminating all forms of poverty, combating social inequalities, and counteracting adverse climate change. It has also been assumed that no country should remain isolated in its efforts [41,42].
The purpose of the study was to analyze and present the position of individual CEE countries in the context of sustainable development concept implementation in the years 2010–2016. Its additional goal was to anticipate and determine the selected developmental opportunities and challenges referring to sustainable development in CEE countries. The study was based on the indicators developed to monitor the SDGs on a global basis. A total of 66 indicators were used, thus providing a relatively large set, covering the general areas responsible for meeting the sustainable development goals. The selection of indicators assigned to individual SDGs resulted from the availability and integrity of public statistics. The Eurostat database (database: sustainable development indicators) was used as the data source. The synthetic measure of development (SMD) was applied as the research method to assess the implementation level of the sustainable development concept in CEE countries.
2. Research Method
Indicators represent quantitative tools that synthesize and simplify data essential for the assessment of specific phenomena. They are useful for communication, evaluation, and also for making strategic decisions. Indicators represent one of the basic instruments for sustainable development monitoring, as they show this concept in a rational and measurable way. For the purposes of this study, sustainable development indicators are defined as statistical measures indicating the sustainability of social, environmental, and economic development [43,44,45,46].
The conducted research was based on the indicators analyzing progress in the implementation of the studied development concept covering the selected territorial units, i.e., the group of CEE countries. The individual indicators, in global terms, were assigned to 17 SDGs. It should be emphasized that the availability and integrity of reliable public statistics, i.e., the Eurostat data, was checked for each of the indicators.
The indicators corresponding to goals 14 and 15 were not included in the research due to the absence of statistical data in Eurostat databases for the 11 analyzed CEE countries in the adopted time horizon [40]. Keeping in mind the high importance of these goals (life below water, life on land) for sustainable development, it was, nonetheless, assumed that their absence would not significantly affect the final construction of individual synthetic measures of development (SMD) regarding the analyzed countries. The conducted research will allow for formulating conclusions and diagnosing the direction of changes in the values of respective measures. The list of the ultimately chosen indicators is presented in Table 1.
The presented analytical approach to the level of sustainable development takes the form of a general analysis covering the individual aspects, where meeting all of them affects full implementation of the discussed concept. The selection of variables for the study purposes took into account each of the key spheres creating sustainable development, i.e., the social, economic, and environmental spheres, in accordance with the SDG areas.
It was important to determine the quantitative goals to be achieved to indicate the extent to which the concept of sustainable development is being implemented [47,48,49,50,51]. Defining such goals depended on specifying the nature of each of the variables. In general, the following variables could be identified: stimulants, destimulants, and nominants.
The next step was determining the value of the synthetic measure of development (SMD) for individual countries. Its construction covered the following stages: (1) Identifying the variable preferences (see Table 1). The idea of sustainable development suggests that all variables should be considered nominants, since either too high or too low levels and the pace of the analyzed phenomenon development can be observed as an unfavorable situation. However, due to problems in determining the nominal (optimal) value, the variables were classified as stimulants or destimulants. (2) Determining the coordinates of the object-pattern (see Table 1): The empirical, upper pattern of development was the reference point. Maximum values for stimulants and minimum values for destimulants, achieved in the period 2010–2016, were considered the most favorable (see Table 1). This did not mean, however, that these values were optimal. They determined the most favorable, realistically achieved level. It could happen that they were still much lower than the desired (target) values. In such cases, the defined values of the synthetic measure of development (SMD) would indicate a closer position to the set pattern than the one resulting from the optimal situation. (3) The normalization of variable values, using the formula of zero unitarization, performed for all analyzed years, jointly allowed for maintaining different variability, which is important in comparative research. As a result, the values of variables were normalized in the range 0–1. (4) Unification of the nature of variables: Destimulants were replaced with stimulants by subtracting their value from unity. We also (5) determined the distance from each object (country) to the object-pattern using the Euclidean distance and (6) calculated the value of the synthetic measure of development for each country in all analyzed years jointly. (7) The SMD value range was divided into classes, defining the criteria for the assessment of the CEE countries’ situation. Taking into account the method used to determine reference values (point 2), the following interpretation scheme was adopted: SMD values in the range of 0.8–1.0 meant a highly favorable situation, SMD values in the range 0.6–0.8 meant a favorable situation, SMD values in the range 0.4–0.6 meant a moderate situation, SMD values in the range 0.2–0.4 meant an unfavorable situation, and SMD values in the range 0.0–0.2 meant a highly unfavorable situation.
3. Results
The values of the synthetic measure of development (SMD) in the years 2010–2016 were determined based on the set of indicators presented in Table 1. The table also shows the nature (interpretation) of the indicators and the coordinates (values) of the joint object-pattern. The situation was analyzed in terms of implementing sustainable development patterns in 11 CEE countries. The distances from the object-pattern are listed in Table 2. The values of statistical measures, helpful in interpreting the situation of individual countries and their changes in the analyzed years, are specified for individual years.
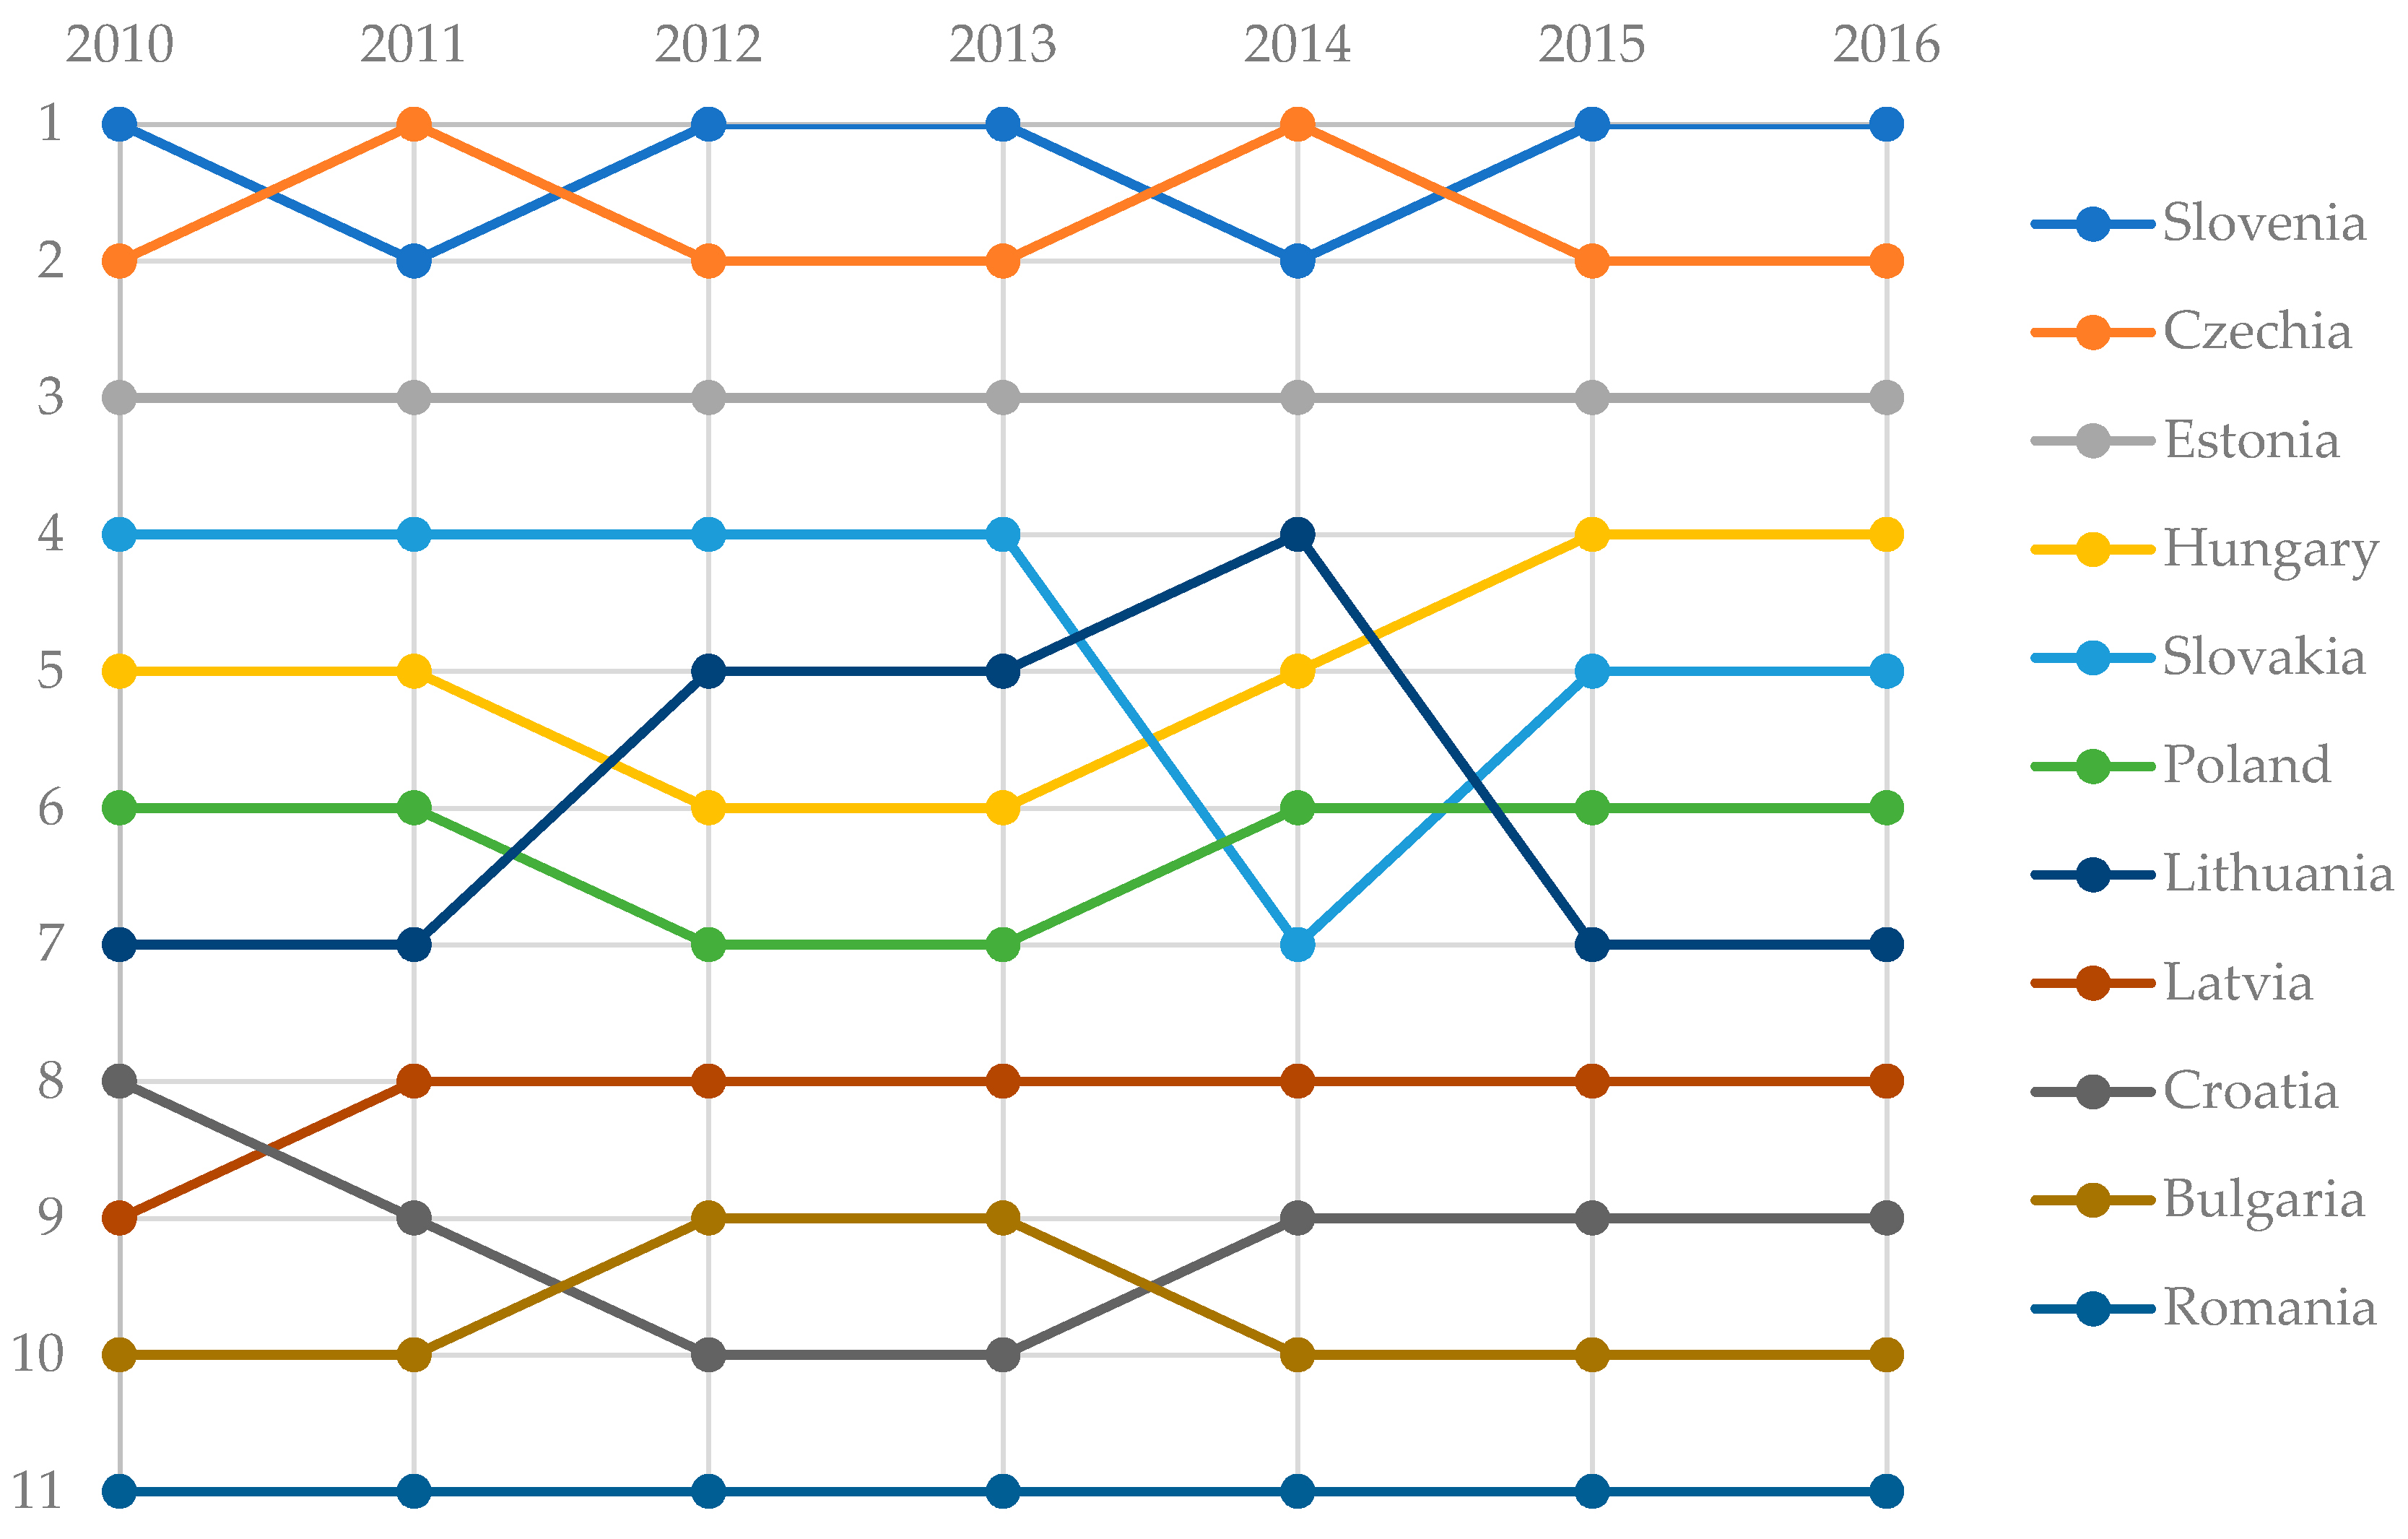
The situation of the analyzed countries regarding the implementation of sustainable development in individual years was not much spatially diversified, as confirmed by the low value of the coefficient of variation. The diversification showed a downward trend, as confirmed by the declining value of this indicator. Each subsequent year, the countries were closer to the benchmark, as shown by the continuously increasing median value and minimum value, along with the growth in maximum value. A very high value of Pearson’s linear correlation coefficient proves slight changes in the year-to-year ranking of the countries. If the ranking position changed, it was mostly by one or two places (up or down) only.
Slovenia was the leader in the analyzed period, except for 2011 and 2014 (Figure 1). In 2011 and 2014, the leading position was taken by the Czech Republic which, in other years, was ranked second. Romania was ranked last in all analyzed years.
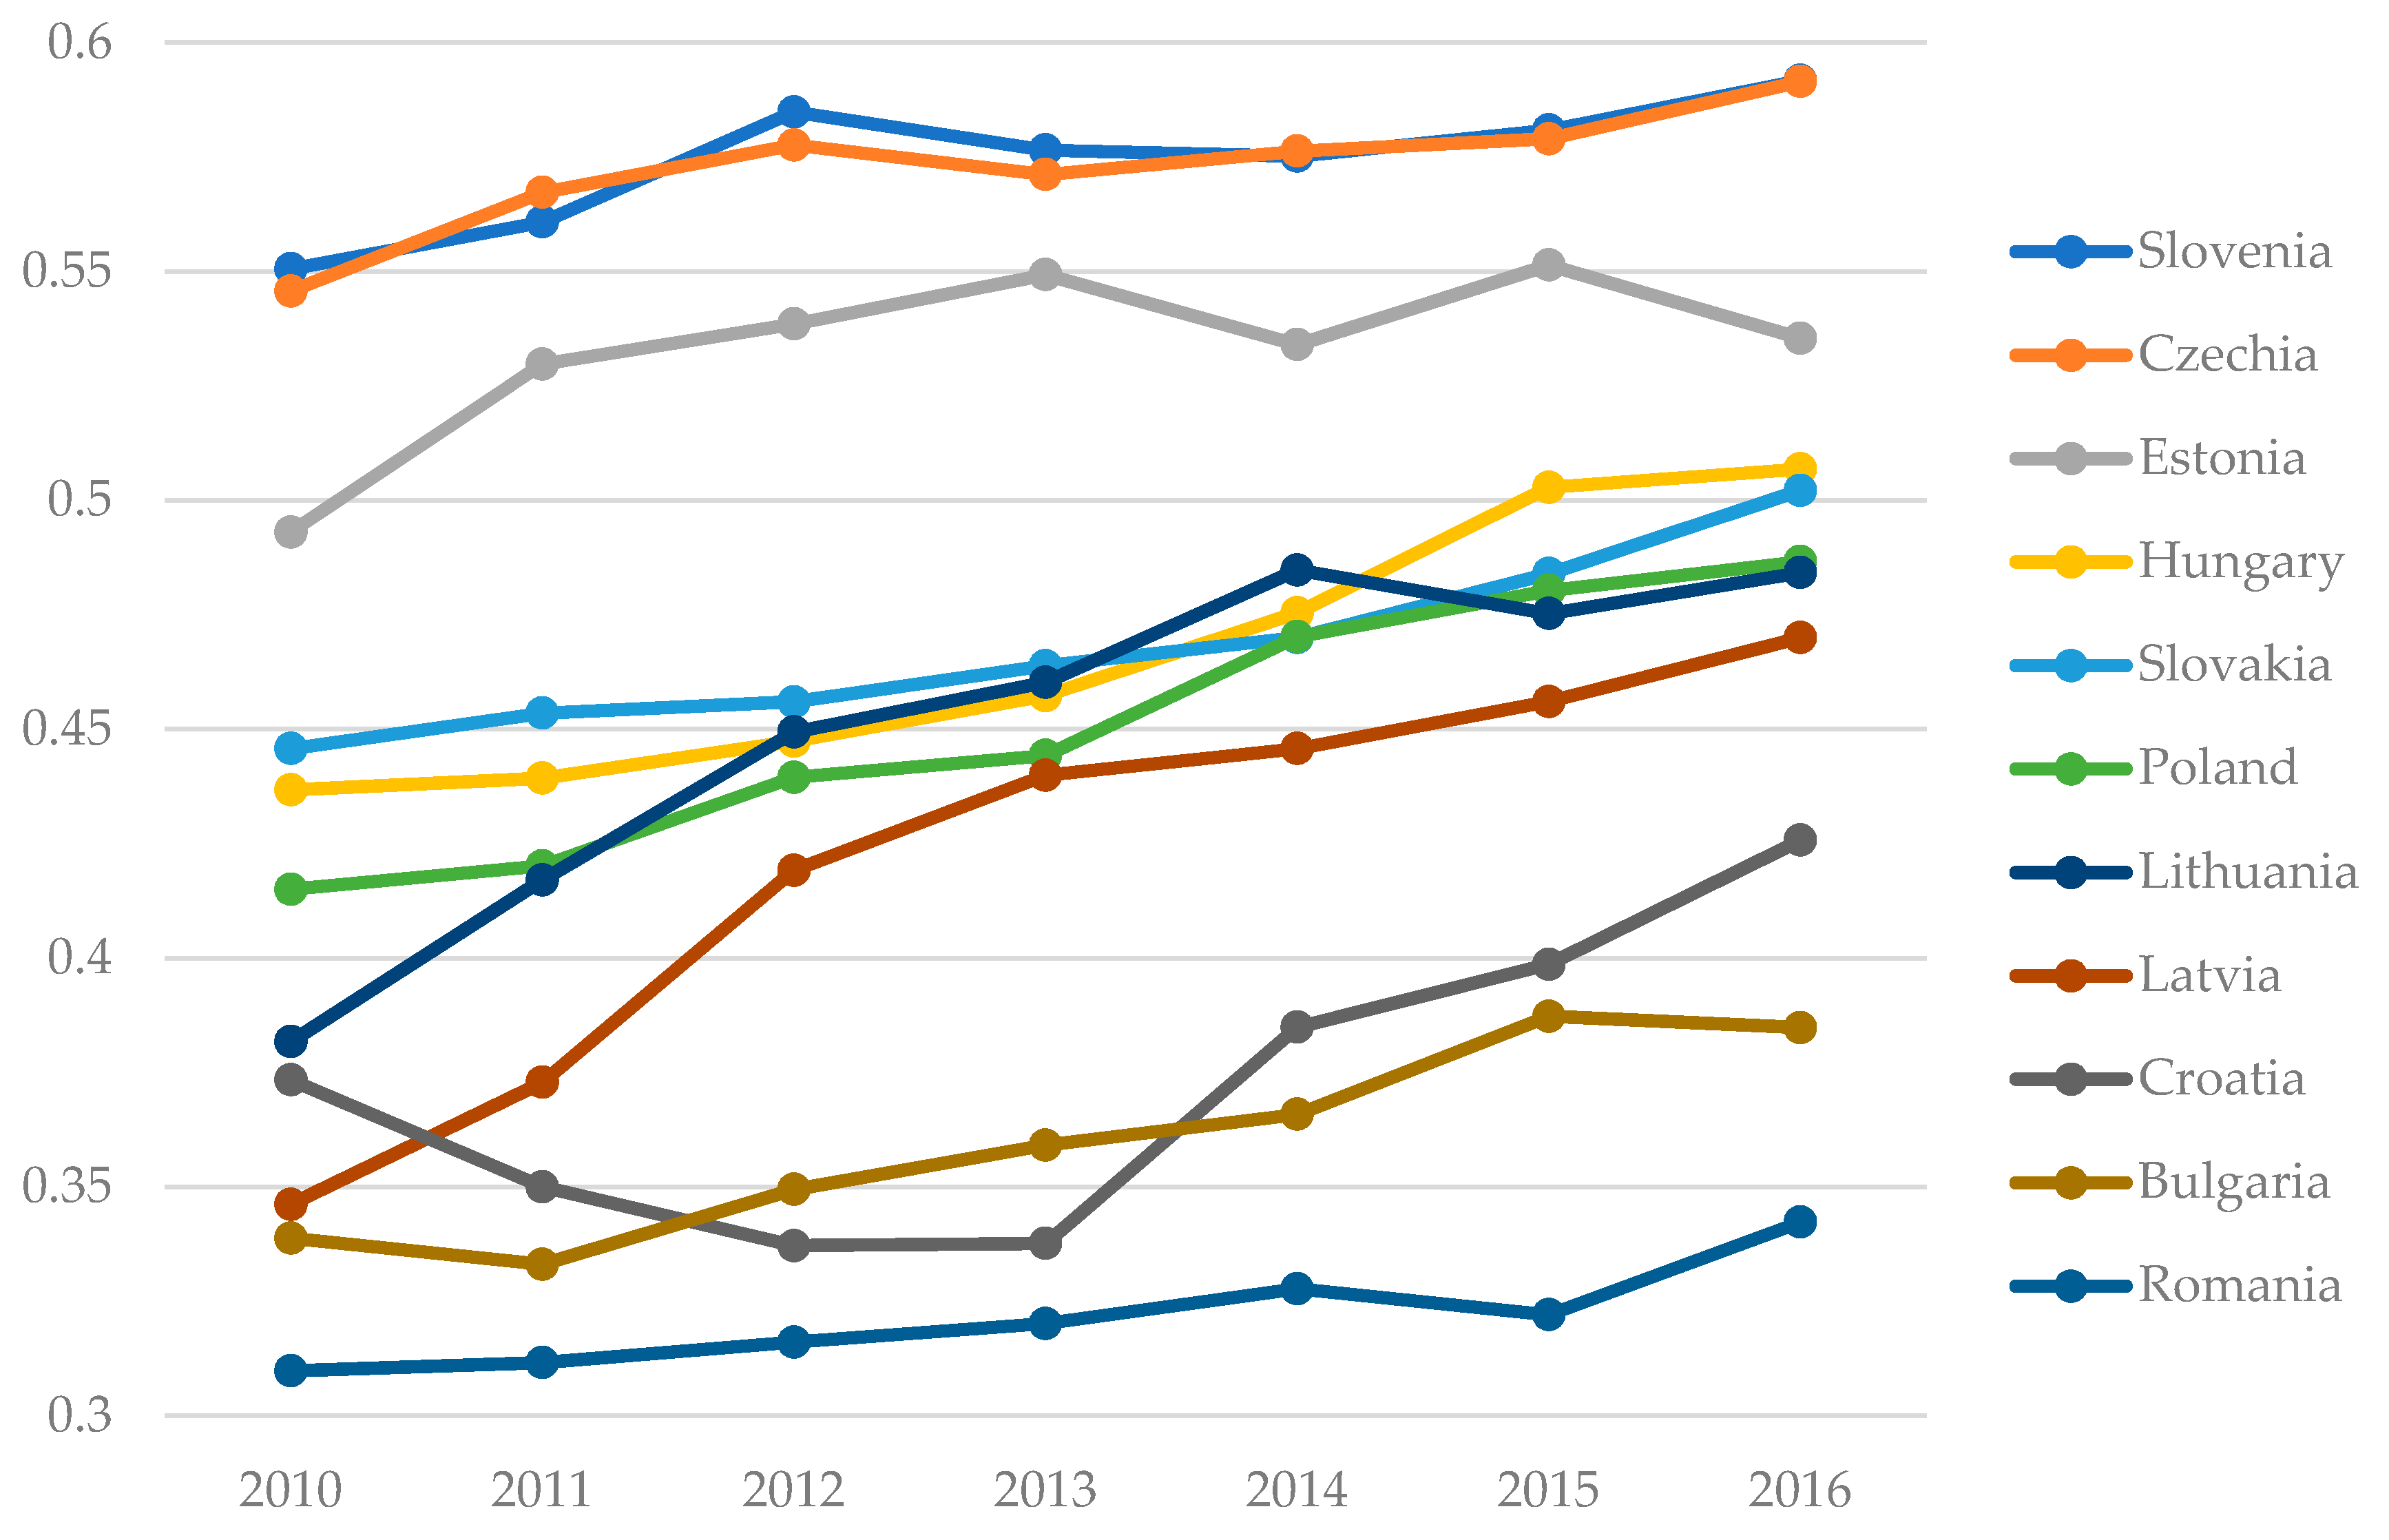
An unfavorable situation was recorded in 2010 in five countries, in 2011 in four countries, in the period 2012–2015 in three countries, and in 2016 in two countries only. In other countries, it was described as moderate (Figure 2). This confirmed that each consecutive year the number of countries where the implementation of sustainable development patterns resulted in a moderate situation was continuously increasing.
4. Discussion
The analysis of indicator values allowed for formulating the following conclusions, referring to individual SDGs. Positive transformations could be observed in the “no poverty” area regarding changes in most indicators. This was shown, from year to year, by a lower mean value and less diversification between the analyzed countries. Adverse changes were recorded in two indicators only, i.e., “people at risk of income poverty after social transfers” and “in-work at-risk-of-poverty rate”. It should, however, be highlighted that these unfavorable changes did not cover all countries, but referred only to Bulgaria, Estonia, Romania, Slovenia, and Slovakia. The Czech Republic took the position as the leader in the analyzed area, whereas the worst situation was recorded in Bulgaria and Romania.
The analyzed countries were highly diversified in terms of the indicators characterizing the “zero hunger” area. However, the occurring changes could be assessed positively since they followed the desired path. It should also be noted that in each of the analyzed years, Poland was responsible for over one-third of “ammonia emissions from agriculture”.
The changes observed in the area of “good health and well-being” could definitely be assessed as positive. In all researched countries, “life expectancy at birth” lengthened for both men and women. The mean value was systematically increasing, whereas diversification persisted at an unchanged low level throughout the entire period. The value of the “share of people with good or very good perceived health” went up for men in seven countries and for women in six countries. In both cases, the mean value increased while diversification stayed at the same low level. The indicator value of “people killed in accidents at work” showed a decline in nine countries. The decrease was also true for the mean value. Diversification, however, increased from small to medium. In 10 countries the indicator value of “population living in households considering that they suffer from noise, by poverty status” dropped. Both the mean value and diversification dropped. A declining value of “people killed in road accidents” was observed in all countries. The mean value was also lower, with diversification remaining at the same level throughout the entire period.
Positive changes were recorded in the area of “quality education”. The indicator value of “early leavers from education and training” dropped in 6 countries for both women and men. In the case of the latter, a drop in the mean value was observed, whereas in the case of women it remained at the same level. Diversification among individual countries also presented the same medium level. A positive direction of the occurring changes was visible in terms of the “tertiary educational attainment indicator”. Its value increased in 11 countries for both women and men. The higher mean value coincided with declining diversification. The indicator value of “participation in early childhood education” was higher in all countries in relation to the situation of men and in 10 countries for women. The mean value of both indicators was growing along with falling diversification, which presented low levels throughout the period under analysis. The indicator value of “employment rates of recent graduates” increased in 10 countries for men and in 9 for women. In both cases, however, the mean value was higher. Low diversification was characteristic for the whole period, but in the case of men it dropped, whereas for women it went up. The indicator value of “adult participation in learning” for men grew in 8 and for women in 6 countries. In both cases, the mean value was higher and the diversification lower, which remained at a high level throughout the entire analyzed period. The indicator value of “young people in neither education nor training” dropped for men in 9 countries and in 7 for women. In both cases the mean value was lower. In relation to men, however, the diversification went up, whereas for women it went down.
The changes recorded in the area of “gender equality” were inconclusive. In 7 out of 11 countries, the indicator value of positions held by women in senior management positions increased. The mean value was slightly higher. There were also more seats held by women in national parliaments and governments in 7 countries. The mean value went up, and diversification dropped. Unfavorable changes were recorded in all countries regarding the indicator of “inactive population due to caring responsibilities”. Its value was higher for both women and men. Large differences were also observed among individual countries. However, it was much higher in relation to the indicator monitoring the situation of men. Unfavorable changes were detected in terms of the “gender employment gap” indicator in the analyzed countries. Its value increased in 6 countries. However, the declining diversification among the individual countries proved a positive trend.
The share of “population having neither a bath, nor a shower, nor indoor flushing toilet in their household by poverty status” in Romania presented an annual average of almost 34%, whereas in Slovakia, Slovenia, and the Czech Republic it was less than 0.5%. It was, however, positive to observe the systematically decreasing share of this type of population.
The indicator of “affordable and clean energy” was the area where ongoing changes could be identified as favorable. In 7 countries, “final energy consumption” was smaller. The mean value dropped, but the level of diversification remained at the same level. “Final energy consumption in households per capita” declined in 10 countries. Both the mean value and the diversification dropped. Energy dependence by product fell in 6 countries. The mean value was lower with the diversification persisting at the same level. The indicator value of “population unable to keep home adequately warm by poverty status” was lower in 7 countries. The same referred to both the mean value and diversification. The only adverse changes were recorded in the indicator of “energy productivity”. Its value increased in all analyzed countries along with a higher mean value, and the variation remained unchanged.
“Decent work and economic growth” represented an area recording positive changes in terms of all indicators. The value of “real GDP per capita” was higher in all countries. The mean values also increased along with decreasing diversification. The value of “employment rate” went up for both women and men. The indicator value for women increased in all countries and for men in 10 countries. In the case of men, the value of diversification was lower and in the case of women higher. In the analyzed period, the mean value of “long-term unemployment rate” dropped for men in 8 countries and for women in 9 countries. The diversification recorded in particular countries regarding this indicator for men was also smaller, whereas in the case of women it showed a slight upward trend.
The changes occurring in the area of “industry, innovation, and infrastructure” were positive for all the indicators monitoring innovation. In turn, negative changes were observed in relation to the indicators monitoring the transport sector. “Gross domestic expenditure on R&D by sector” increased in 8 countries. The mean value was also increasing along with the decreasing diversification between countries. The indicator value of “employment in high- and medium-high technology manufacturing sectors and knowledge-intensive service sectors” went up in 11 countries. The same trend was also recorded in terms of the mean value and diversification. The share of R&D personnel was higher in 8 countries. The mean value also increased, and the level of diversification remained unchanged. In the case of “share of busses and trains in total passenger transport”, the indicator value growth was observed only in 4 countries. The mean value decreased and the level of diversification did not change. A higher value of “share of rail and inland waterways activity in total freight transport” was observed in one country only. Both the mean value and the diversification were lower.
In general, negative changes occurred in the area of “reduce inequalities”. The indicator value of “relative median at-risk-of-poverty gap” showed negative changes. The value was lower only in 4 countries along with increasing diversification between the individual countries. Negative changes were also observed in “income distribution”. The value of this indicator dropped in 5 countries along with higher diversification observed between countries. The indicator value “income share” of the bottom 40% of the population was higher in 4 countries only, as was the diversification between countries. Positive changes were observed in relation to the indicator “purchasing power adjusted GDP per capita”. Its value was higher in all countries, accompanied by lower diversification among them. Positive changes were also true for the EU imports from developing countries by country income groups. The value of this indicator was lower only in 1 country, but the diversification among countries was higher.
“Sustainable cities and communities” represented the area where the occurring changes were clearly positive. “Recycling rate of municipal waste” systematically increased. Slovenia was the leader here, with an indicator value exceeding 50% in the years 2015–2016. Positive changes took place in all analyzed countries, and the mean value more than doubled. The indicator value “Population reporting occurrence of crime, violence, or vandalism in their area by poverty status” dropped. The decline was recorded in all countries.
The area “responsible consumption and production” was monitored by the indicator “resource productivity and domestic material consumption (DMC)”. Its value went up in 8 out of all analyzed countries. The diversification among individual countries presented an average level and showed a slight upward trend.
Positive changes were observed in the area “climate action”. All countries had a higher “share of renewable energy in gross final energy consumption by sector” along with lower “greenhouse gas emissions”. The analyzed countries were not highly diversified and featured only slightly higher values.
The analysis in the area “peace, justice, and strong institutions” showed, on the one hand, higher expenditures on justice but, on the other, lower public confidence in European institutions. Large diversification among the analyzed countries regarding expenditures on justice is also worth noticing. Poland was the leader in this area, whereas Estonia ranked last. Both cases, however, resulted from the size of the respective countries. Declining public confidence in European institutions was a negative phenomenon. It showed a downward trend from year to year and was noticeable in all countries covered by the analysis. The assessment of changes in “partnerships for the goals” was inconclusive. “General government gross debt” was increasing. The mean value in the analyzed period grew by over 6 percentage points. It should, however, be emphasized that the analyzed countries were extensively diversified in terms of this indicator value. Positive changes were observed in the value of “shares of environmental and labor taxes in total tax revenues”, which recorded a slight increase.
5. Chosen Challenges and Opportunities in the Implementation of the Sustainable Development Concept in CEECs
Based on the research carried out in the earlier part of the study and the subject literature overview presented below (Table 3), selected significant challenges and development opportunities were identified in the context of sustainable development concept implementation in CEE countries. The discussed trends were also characterized. It should be noted that some of the described phenomena could occur in other European countries: However, the presented characteristics took into account the specificity of the CEECs group, which is still characterized by, e.g., lower levels of socioeconomic development compared to Western European countries, historical events primarily including the period of the so-called people’s democracy, neglected infrastructure, and geographical location. In general, with few exceptions, CEE countries are currently classified as so-called emerging markets.
The awareness of opportunities and challenges emerging on the path followed by the CEE region countries in their implementation of the sustainable development concept, measured by progress in carrying out the SDGs, allows for formulating respective recommendations and long-term strategies of sustainable development. It is also a signpost for the individuals and authorities responsible for developing public policies. It should be noted that approaching a relatively high level of sustainable development is both a long-term and difficult process that requires not only relevant financial investments and adequate legislation, but also changes in social mentality.
6. Conclusions
Summarizing, the situation regarding the problem of sustainable development in the CEE countries is showing a gradual improvement and a clearly positive trend for the future. However, as for now none of the analyzed countries are included in the group characterized by a favorable situation in this area. Slovenia and the Czech Republic came close to achieving it in 2016, but finally both of them remained in the moderate group along with Estonia, Hungary, Slovakia, Poland, Lithuania, Latvia, and Croatia. The worst (unfavorable) situation was recorded in the entire analyzed period in Bulgaria and Romania, with the latter ranked last. The presented research results can provide additional motivation and incentives for taking up due actions by the CEE countries. In the discussed countries, sustainable development should be perceived as a development goal equally important to eliminating differences in the quality of life in Western European countries.
Among future research directions, a cyclical analysis of the concept of sustainable development implementation levels, based on the indicators assigned to SDGs, can be mentioned. An analysis of the CEE countries can also be conducted, covering other indicators and using different research methods. In this sense, the presented study can be approached as an introduction to further research projects. In addition, a whole spectrum of possibilities for comparing the CEECs against other countries, or groups of European countries, or even other parts of the world, can remain the challenge to take up. Assuming data availability, the conducted analysis can, in the future, be extended to other countries classified in the CEE area, e.g., Albania, Belarus, Ukraine, Bosnia and Herzegovina, Serbia, Montenegro, or Macedonia.
Author Contributions
All authors designed the research and analysed the data. All authors wrote the paper, read, and approved the final manuscript.
Funding
This research received no external funding.
Conflicts of Interest
The authors declare no conflict of interest.
References
- Edwards, M.; Hulme, D. NGO Performance and Accountability. Introduction and Overview. In Non-Governmental Organisations. Performance and Accountability. Beyond the Magic Bullet; Edwards, M., Hulme, D., Eds.; Earthscan Publications: London, UK, 1995. [Google Scholar]
- Gibney, J. Leadership of place and the dynamics of knowledge. In Leadership and Change in Sustainable Regional Development; Sotarauta, M., Horlings, L., Liddle, J., Eds.; Routledge, Regional Studies Association, Regions and Cities: New York, NY, USA, 2012; pp. 20–36. [Google Scholar]
- Diamond, J. Leadership and the voluntary and community sector. In Leadership and Change in Sustainable Regional Development; Sotarauta, M., Horlings, L., Liddle, J., Eds.; Routledge, Regional Studies Association, Regions and Cities: New York, NY, USA, 2012; pp. 80–102. [Google Scholar]
- Agere, S. Promoting Good Governance: Principles, Practices and Perspectives; Commonwealth Secretariat, Management Service Training Division: London, UK, 2000. [Google Scholar]
- Smith, B. Good Governance and Development; Palgrave Macmillan: New York, NY, USA, 2007. [Google Scholar]
- Alińska, A.; Filipiak, B.; Kosztowniak, A. The Importance of the Public Sector in Sustainable Development in Poland. Sustainability 2018, 10, 3278. [Google Scholar] [CrossRef]
- Salonen, A.; Siirilä, J.; Valtonen, M. Sustainable Living in Finland: Combating Climate Change in Everyday Life. Sustainability 2018, 10, 104. [Google Scholar] [CrossRef]
- United Nations Development Programme. Human Development Index (HDI). Available online: http://hdr.undp.org/en/composite/HDI (accessed on 22 November 2018).
- International Monetary Fund. World Economic Outlook (WEO) Database. Available online: https://www.imf.org/en/Publications/SPROLLS/world-economic-outlook-databases#sort=%40imfdate%20descending (accessed on 17 January 2019).
- Mature leader of the CEE region. EY’s Attractiveness Survey Poland 2017. Available online: https://www.ey.com/Publication/vwLUAssets/EY_Attractiveness_Survey_Poland_2017/$FILE/EY-Attractiveness-Survey-Poland-2017.pdf (accessed on 15 January 2019).
- Comes, C.-A.; Bunduchi, E.; Vasile, V.; Stefan, D. The Impact of Foreign Direct Investments and Remittances on Economic Growth: A Case Study in Central and Eastern Europe. Sustainability 2018, 10, 238. [Google Scholar] [CrossRef]
- Popescu, G. FDI and Economic Growth in Central and Eastern Europe. Sustainability 2014, 6, 8149–8163. [Google Scholar] [CrossRef] [Green Version]
- Raszkowski, A. Selected aspects of investment attractiveness of regions. ACC J. 2013, 2, 116–126. [Google Scholar]
- Cichowicz, E.; Rollnik-Sadowska, E. Inclusive Growth in CEE Countries as a Determinant of Sustainable Development. Sustainability 2018, 10, 3973. [Google Scholar] [CrossRef]
- Láng, I. Sustainable Development—A New Challenge for the Countries in Central and Eastern Europe. Environ. Dev. Sustain. 2003, 5, 167–178. [Google Scholar] [CrossRef]
- Raszkowski, A.; Bartniczak, B. Towards Sustainable Regional Development: Economy, Society, Environment, Good Governance Based on the Example of Polish Regions. Transform. Bus. Econ. 2018, 17, 225–245. [Google Scholar]
- Organisation for Economic Co-operation and Development (OECD). Central and Eastern European Countries (CEECs). Available online: https://stats.oecd.org/glossary/detail.asp?ID=303 (accessed on 15 January 2019).
- Gosseries, A. Theories of intergenerational justice: A synopsis. SAPIENS Surv. Perspect. Integr. Environ. Soc. 2008, 1, 61–71. [Google Scholar] [CrossRef]
- Gosseries, A.; Meyer, L. (Eds.) Intergenerational Justice; Oxford University Press: Oxford, UK, 2009. [Google Scholar]
- Vasconcellos Oliveira, R. Back to the Future: The Potential of Intergenerational Justice for the Achievement of the Sustainable Development Goals. Sustainability 2018, 10, 427. [Google Scholar] [CrossRef]
- Michałowski, A. Ecosystem services in the light of a sustainable knowledge-based economy. Probl. Sustain. Dev. 2012, 7, 97–106. [Google Scholar]
- Faucheux, S.; O’Connor, M.; Straaten, J. (Eds.) Sustainable Development: Concepts, Rationalities and Strategies; Springer Science & Business Media: New York, NY, USA, 1998. [Google Scholar]
- Dokurno, Z.; Fiedor, B.; Scheuer, B. Contemporary Macroeconomics from the Perspective of Sustainable Development; PWN, Polish Scientific Publishers: Warsaw, Poland, 2017. [Google Scholar]
- Pawłowski, A. How many dimensions does sustainable development have? Sustain. Dev. 2008, 16, 81–90. [Google Scholar]
- Giorgetta, S. The Right to a Healthy Environment, Human Rights and Sustainable Development. Int. Environ. Agreem. Polit. Law Econ. 2002, 2, 173–194. [Google Scholar]
- Pawłowski, A. Sustainable Development as a Civilizational Revolution: A Multidisciplinary Approach to the Challenges of the 21st Century; CRC Press, Taylor & Francis Group: London, UK, 2011. [Google Scholar]
- Report of the World Commission on Environment and Development: Our Common Future (1987). UN Documents, Gathering a body of global agreements. Available online: http://www.un-documents.net/wced-ocf.htm (accessed on 15 January 2019).
- Stimson, R.; Stough, R.; Roberts, B. Regional Economic Development. Analysis and Planning Strategy; Springer: Heidelberg, Germany, 2006. [Google Scholar]
- Fiedor, B.; Kociszewski, K. (Eds.) Ekonomia rozwoju; Wydawnictwo Uniwersytetu Ekonomicznego we Wrocławiu: Wrocław, Poland, 2010. [Google Scholar]
- Czaja, S.; Fiedor, B.; Graczyk, A.; Jakubczyk, Z. Podstawy Ekonomii środowiska i Zasobów Naturalnych; C.H. Beck: Warszawa, Poland, 2002. [Google Scholar]
- Cohen, M. A Systematic Review of Urban Sustainability Assessment Literature. Sustainability 2017, 9, 2048. [Google Scholar] [CrossRef]
- Borys, T. Zrównoważony rozwój—jak rozpoznać ład zintegrowany. Problemy Ekorozwoju 2011, 6, 75–81. [Google Scholar]
- United Nations Statistics Division. Global SDG Indicators Database. Available online: https://unstats.un.org/sdgs/indicators/database/ (accessed on 15 January 2019).
- United Nations. Sustainable Development Goals. Available online: https://sustainabledevelopment.un.org/?menu=1300 (accessed on 15 January 2019).
- United Nations. The Sustainable Development Goals Report 2018. Available online: https://unstats.un.org/sdgs/files/report/2018/TheSustainableDevelopmentGoalsReport2018-EN.pdf (accessed on 15 January 2019).
- European Commission. The Sustainable Development Goals. Available online: https://ec.europa.eu/europeaid/policies/sustainable-development-goals_en (accessed on 15 January 2019).
- Publications Office of the European Union. Sustainable development in the European Union, Overview of progress towards the SDGs in an EU context, 2017 edition. Available online: https://ec.europa.eu/eurostat/documents/3217494/8461633/KS-04-17-780-EN-N.pdf (accessed on 15 January 2019).
- Publications Office of the European Union. Sustainable development in the European Union, monitoring report of the EU Sustainable Development Strategy. Available online: https://ec.europa.eu/eurostat/documents/3217494/6975281/KS-GT-15-001-EN-N.pdf (accessed on 15 January 2019).
- United Nations Economic Commission for Europe (UNECE). Road Map on Statistics for Sustainable Development Goals. Available online: http://www.unece.org/fileadmin/DAM/stats/publications/2017/ECECESSTAT20172.pdf (accessed on 15 January 2019).
- Eurostat. Database: Sustainable development indicators. Available online: https://ec.europa.eu/eurostat/data/database (accessed on 15 January 2019).
- United Nations. Transforming our world: the 2030 Agenda for Sustainable Development. Available online: https://sustainabledevelopment.un.org/post2015/transformingourworld (accessed on 15 January 2019).
- Raszkowski, A.; Bartniczak, B. On the Road to Sustainability: Implementation of the 2030 Agenda Sustainable Development Goals (SDG) in Poland. Sustainability 2019, 11, 366. [Google Scholar] [CrossRef]
- Geniaux, G.; Bellon, S.; Deverre, C.; Powell, B. Sustainable Development Indicator Frameworks and Initiatives, System for Environmental and Agricultural Modelling, Linking European Science and Society. Available online: https://ageconsearch.umn.edu/bitstream/57937/2/Report_49_PD2.2.1.pdf (accessed on 2 December 2018).
- Borys, T. Indicators for Sustainable Development—Polish Experiences; Wydawnictwo Ekonomia i Środowisko: Warszawa-Białystok, Poland, 2005. [Google Scholar]
- Borys, T. Strategie i wskaźniki zrównoważonego rozwoju. In Wyzwania Zrównoważonego Rozwoju w Polsce; Kronenberg, J., Bergier, T., Eds.; Fundacja Sendzimira: Kraków, Poland, 2010; pp. 217–234. [Google Scholar]
- United Nations; European Commission; International Monetary Fund; Organisation for Economic Co-operation and Development. World Bank Handbook of National Accounting: Integrated Environmental and Economic Accounting 2003. Available online: https://unstats.un.org/unsd/econstatkb/knowledgebasearticle10079.aspx (accessed on 15 January 2019).
- Marti, R.; Reinelt, G. The Linear Ordering Problem: Exact and Heuristic Methods in Combinatorial Optimization; Springer: Berlin, Germany, 2011. [Google Scholar]
- Meisel, J.; Pam, M. (Eds.) Linear Order and Generative Theory; John Benjamins Publishing Company: Amsterdam, Holland, 1979. [Google Scholar]
- Jajuga, K.; Walesiak, M.; Bąk, A. On the General Distance Measure. In Exploratory Data Analysis in Empirical Research; Schwaiger, M., Opitz, O., Eds.; Springer: Berlin, Germany, 2003. [Google Scholar]
- Dziechciarz, J.; Strahl, D.; Walesiak, M. Data Set Normalisation for Banks Performance Assessment. Ekonometria 2001, 8, 21–32. [Google Scholar]
- Lausen, B.; Van den Poel, D.; Ultsch, A. (Eds.) Algorithms from and for Nature and Life. Classification and Data Analysis; Springer International Publishing: New York, NY, USA, 2013; ISBN 978-3319000350. [Google Scholar]
- Barrientos, S.; Gereffi, G.; Rossi, A. Economic and social upgrading in global production networks: A new paradigm for a changing world. Int. Lab. Rev. 2011, 150, 319–340. [Google Scholar] [CrossRef] [Green Version]
- Starr, F. Corporate Responsibility for Cultural Heritage: Conservation, Sustainable Development, and Corporate Reputation; Routledge Studies of Heritage, Routledge: New York, NY, USA, 2013. [Google Scholar]
- Raszkowski, A. The strategy of local development as the component of creative human capital development process. In Local and Regional Economy in Theory and Practice; Sobczak, E., Bal-Domańska, B., Raszkowski, A., Eds.; Publishing House of Wrocław University of Economics: Wrocław, Poland, 2015; pp. 135–143. [Google Scholar]
- Judson, G. A New Approach to Environmental education: Engaging Students’ Imaginations in Their World; Peter Lang Publishing: New York, NY, USA, 2010. [Google Scholar]
- Judson, G. Engaging Imagination in Environmental Education: Practical Strategies for Teachers; University of British Columbia Press: Vancouver, Canada, 2017. [Google Scholar]
- Archer, M. Education for Sustainable Development. In Children and Sustainable Development: Ecological Education in a Globalized World; Battro, A., Léna, P., Sorondo, M., Braun, J., Eds.; Springer International Publishing: Cham, Germany, 2017; pp. 103–125. [Google Scholar]
- Ramanathan, V.; Han, H.; Matlock, T. Education Children to Bend the Curve: For a Stable Climate, Sustainable Nature and Sustainable Humanity. In Children and Sustainable Development: Ecological Education in a Globalized World; Battro, A., Léna, P., Sorondo, M., Braun, J., Eds.; Springer International Publishing: Cham, Germany, 2017; pp. 3–16. [Google Scholar]
- Palmer, J. Environmental Education in the 21st Century: Theory, Practice, Progress and Promise; Routledge: New York, NY, USA, 1998. [Google Scholar]
- Bartniczak, B.; Raszkowski, A. Sustainable development in the Russian Federation—indicator-based approach. Probl. Sustain. Dev. 2017, 12, 133–142. [Google Scholar]
- Pike, A.; Rodriguez-Pose, A.; Tomaney, J. Local and Regional Development; Routledge: New York, NY, USA, 2016. [Google Scholar]
- Raszkowski, A.; Głuszczuk, D. Regional creativity factors. Towards new dimensions of regional development. In Proceedings of the 9th International Days of Statistics and Economics, Prague, Czech Republic, 10–12 September 2015; pp. 1375–1385. [Google Scholar]
- Bartniczak, B.; Raszkowski, A. Sustainable forest management in Poland. Manag. Environ. Qual. Int. J. 2018, 29, 666–677. [Google Scholar] [CrossRef]
- Gorlach, K.; Adamski, T.; Klekotko, M. Poland: Designing Nature and Resource Management Strategies. In Rural Sustainable Development in the Knowledge Society. Perspectives on Rural Policy and Planning; Bruckmeier, K., Tovey, H., Eds.; Routledge: Abingdon, UK, 2016. [Google Scholar]
- Mierzejewska, L. Town Planning Models: A Look at Polish Cities and Sustainable Development. In Local Sustainable Urban Development in a Globalized World. Urban Planning and Environment; Heberle, L., Opp, S., Eds.; Ashgate Publishing: Farnham, UK, 2008; pp. 61–76. [Google Scholar]
- Heberle, L. Sustainable Urban Development: Local Strategies and Global Solutions. In Local Sustainable Urban Development in a Globalized World. Urban Planning and Environment; Heberle, L., Opp, S., Eds.; Ashgate Publishing: Farnham, UK, 2008; pp. 1–8. [Google Scholar]
- Sutton, S. Rethinking Commercial Revitalisation: A Neighbourhood Small Business Perspective. Econ. Develop. Q. 2010, 24, 352–371. [Google Scholar] [CrossRef]
- Raszkowski, A. Towards sustainable development of territorial units—the case of revitalization projects in Jelenia Góra Agglomeration municipalities. Econ. Environ. Stud. 2018, 18, 355–365. [Google Scholar] [CrossRef]
- Przybyła, K.; Kachniarz, M.; Hełdak, M. The Impact of Administrative Reform on Labour Market Transformations in Large Polish Cities. Sustainability 2018, 10, 2860. [Google Scholar] [CrossRef]
- Raszkowski, A.; Głuszczuk, D. Contemporary developmental directions of revitalization projects: Polish experiences. In Proceedings of the 11th International Days of Statistics and Economics, Prague, Czech Republic, 14–16 September 2018; pp. 1305–1314. [Google Scholar]
- Raszkowski, A. Place marketing in the process of territorial identity creation and strengthening. J. Eur. Econ. 2014, 13, 193–204. [Google Scholar]
- Sztando, A. Does the Strategic Planning of Local Development Result from the Motives Indicated in Literature? Contemporary Motivation of Polish Small Towns’ Authorities for Strategic Planning of Local Development. Transylv. Rev. Adm. Sci. 2017, 51, 106–122. [Google Scholar] [CrossRef]
- Sztando, A. The Category of Intra-Regional Policy: Polish Perspective. In Proceedings of the Hradec Economic Days 2013, Hradec Kralove, Czech Republic, 19–20 February 2013; pp. 413–418. [Google Scholar]
- Raszkowski, A.; Sobczak, E. Delimitation procedure of degraded areas and the area targeted for revitalization. Econ. 21st Century 2018, 2, 30–38. [Google Scholar]
- United Nations Development Programme (UNDP). Global Trends, Challenges and Opportunities in the Implementation of the Sustainable Development Goals. Available online: http://www.undp.org/content/dam/undp/library/SDGs/English/Global%20Trends_UNDP%20and%20UNRISD_FINAL.pdf (accessed on 18 January 2019).
- European Commission. EU budget: Commission proposes to increase funding to support the environment and climate action. Available online: http://europa.eu/rapid/press-release_IP-18-4002_en.htm (accessed on 18 January 2019).
Figure 1.
The positions of individual CEE countries regarding SDG implementation level in the years 2010–2016. Authors’ compilation based on Eurostat. Database: Sustainable development indicators [40].
Figure 1.
The positions of individual CEE countries regarding SDG implementation level in the years 2010–2016. Authors’ compilation based on Eurostat. Database: Sustainable development indicators [40].

Figure 2.
SMD values of the CEE countries regarding the level of SDG implementation in the years 2010–2016. Source: Authors’ compilation based on Eurostat. Database: Sustainable development indicators [40].
Figure 2.
SMD values of the CEE countries regarding the level of SDG implementation in the years 2010–2016. Source: Authors’ compilation based on Eurostat. Database: Sustainable development indicators [40].


Table 1.
The sustainable development goals (SDGs) and the corresponding indicators selected for the analysis monitoring sustainable development at the international level (global SDG indicators), in the case of Central and Eastern European Countries (CEECs).
Table 1.
The sustainable development goals (SDGs) and the corresponding indicators selected for the analysis monitoring sustainable development at the international level (global SDG indicators), in the case of Central and Eastern European Countries (CEECs).
| SDG | Global SDG indicators | Indicator Type | Reference Value |
|---|---|---|---|
| 1. No poverty | People at risk of poverty or social exclusion (%) | destimulant | 13.3 |
| People at risk of income poverty after social transfers (%) | destimulant | 8.6 | |
| Severely materially deprived people (%) | destimulant | 4.5 | |
| People living in households with very low work intensity (%) | destimulant | 5.8 | |
| In-work at-risk-of-poverty rate (%) | destimulant | 3.6 | |
| Population living in a dwelling with a leaking roof, damp walls, floors, or foundation or rot in window frames of floor by poverty status (%) | destimulant | 5.8 | |
| Self-reported unmet need for medical examination and care (%) | destimulant | 0 | |
| Overcrowding rate by poverty status (%) | destimulant | 12.6 | |
| 2. Zero hunger | Agricultural factor income per annual work unit (AWU) (euro per annual work unit) | stimulant | 20,135 |
| Ammonia emissions from agriculture (tons) | destimulant | 10,041 | |
| 3. Good health and well-being | Life expectancy at birth, males (years) | stimulant | 78.2 |
| Life expectancy at birth, females (years) | stimulant | 84.3 | |
| Share of people with good or very good perceived health, % of population aged 16 or over, males (%) | stimulant | 76 | |
| Share of people with good or very good perceived health, % of population aged 16 or over, females (%) | stimulant | 67.2 | |
| People killed in accidents at work (number per 100,000 employees) | destimulant | 1.4 | |
| Population living in households considering that they suffer from noise, by poverty status (%) | destimulant | 8.3 | |
| People killed in road accidents (persons and number per 100,000 persons) | destimulant | 4.6 | |
| 4. Quality education | Early leavers from education and training, % of population aged 18 to 24, males (%) | destimulant | 3.1 |
| Early leavers from education and training, % of population aged 18 to 24, females (%) | destimulant | 2 | |
| Tertiary educational attainment by sex, % of population aged 30 to 34, males (%) | stimulant | 48.1 | |
| Tertiary educational attainment by sex, % of population aged 30 to 34, females (%) | stimulant | 68.8 | |
| Participation in early childhood education by sex, % of the age group between 4 years old and the starting age of compulsory education, males (%) | stimulant | 96 | |
| Participation in early childhood education by sex, % of the age group between 4 years old and the starting age of compulsory education, females (%) | stimulant | 95.9 | |
| Employment rates of recent graduates, % of population aged 20 to 34 with at least upper secondary education, males (%) | stimulant | 94.2 | |
| Employment rates of recent graduates, % of population aged 20 to 34, with at least upper secondary education, females (%) | stimulant | 84.9 | |
| Adult participation in learning, % of population aged 25 to 64, males (%) | stimulant | 14.3 | |
| Adult participation in learning, % of population aged 25 to 64, females (%) | stimulant | 18.5 | |
| Young people neither in employment nor in education and training, % of population aged 15 to 29, males (%) | destimulant | 23.8 | |
| Young people neither in employment nor in education and training, % of population aged 15 to 29, females (%) | destimulant | 9.4 | |
| 5. Gender equality | Gender employment gap (%) | destimulant | −1.5 |
| Inactive population due to caring responsibilities, % of inactive population aged 20 to 64, males (%) | destimulant | 0.5 | |
| Inactive population due to caring responsibilities, % of inactive population aged 20 to 64, females (%) | destimulant | 12.6 | |
| Seats held by women in national parliaments and governments (% of seats) | stimulant | 28.7 | |
| Positions held by women in senior management positions (% of positions) | stimulant | 31.7 | |
| 6. Clear water and sanitation | Population having neither a bath, nor a shower, nor an indoor flushing toilet in their household by poverty status, % of population (%) | destimulant | 0.2 |
| 7. Affordable and clean energy | Final energy consumption (million tons of oil equivalent (TOE)) | destimulant | 2.8 |
| Final energy consumption in households per capita (kg of oil equivalent) | destimulant | 300 | |
| Energy productivity (euro per kilogram of oil equivalent (KGOE)) | destimulant | 2 | |
| Energy dependence by product (% of imports in total energy consumption) | destimulant | 6.8 | |
| Population unable to keep home adequately warm by poverty status (%) | destimulant | 1.7 | |
| 8. Decent work and economic growth | Real GDP per capita (euro per capita) | stimulant | 18,500 |
| Employment rate, % of population aged 20 to 64, males (%) | stimulant | 84.6 | |
| Employment rate, % of population aged 20 to 64, females (%) | stimulant | 74.3 | |
| Long-term unemployment rate, % of active population, males (%) | destimulant | 1.4 | |
| Long-term unemployment rate, % of active population, females (%) | destimulant | 1.8 | |
| 9. Industry, innovation, and infrastructure | Gross domestic expenditure on R&D (Research and Development) by sector (% of GDP) | stimulant | 2.58 |
| Employment in high- and medium-high technology manufacturing sectors and knowledge-intensive service sectors (%) | stimulant | 45.6 | |
| R&D personnel by sector (% of active population) | stimulant | 1.5383 | |
| Share of busses and trains in total passenger transport (% of total inland passenger/km) | stimulant | 32.5 | |
| Share of rail and inland waterway activity in total freight transport (% of total inland freight ton/km) | stimulant | 84.2 | |
| 10. Reduce inequalities | Purchasing power adjusted GDP per capita (real expenditure per capita (in PPS_EU28)) | stimulant | 25,600 |
| Relative median at-risk-of-poverty gap (% distance to poverty threshold) | destimulant | 16.5 | |
| Income distribution (% distance to poverty threshold) | destimulant | 3.4 | |
| Income share of the bottom 40% of the population (% of income) | stimulant | 25.1 | |
| EU imports from developing countries by country income groups (million EUR) | stimulant | 26,526 | |
| 11. Sustainable cities and communities | Recycling rate of municipal waste (% of total waste generated) | stimulant | 55.6 |
| Population reporting occurrence of crime, violence, or vandalism in their area by poverty status (%) | destimulant | 2.5 | |
| 12. Responsible consumption and production | Resource productivity and domestic material consumption (DMC) (euro per kilogram, chain-linked volumes (2010)) | stimulant | 1.4412 |
| Primary energy consumption (million tons of oil equivalent (TOE)) | destimulant | 4.3 | |
| 13. Climate action | Greenhouse gas emissions (in CO2 equivalent) | destimulant | 41.5 |
| Share of renewable energy in gross final energy consumption (%) | stimulant | 38.7 | |
| Greenhouse gas emissions intensity of energy consumption (index (2000 = 100)) | destimulant | 78.6 | |
| 16. Peace, justice, and strong institutions | General government total expenditure on law courts (million euros) | stimulant | 2224 |
| Population with confidence in EU institutions by institution (%) | stimulant | 76 | |
| 17. Partnerships for the goals | General government gross debt (% of GDP) | destimulant | 6.1 |
| Shares of environmental and labor taxes in total tax revenues (% of total taxes) | stimulant | 12.15 |
Source: Authors’ compilation based on Eurostat data (database: sustainable development indicators) [40].
Table 2.
Synthetic measure of development (SMD) values, synthetic measures for the distance from the pattern in the years 2010–2016.
Table 2.
Synthetic measure of development (SMD) values, synthetic measures for the distance from the pattern in the years 2010–2016.
| Specification | 2010 | 2011 | 2012 | 2013 | 2014 | 2015 | 2016 |
|---|---|---|---|---|---|---|---|
| Bulgaria | 0.3388 | 0.3331 | 0.34947 | 0.3591 | 0.36587 | 0.38725 | 0.38476 |
| Croatia | 0.37336 | 0.35003 | 0.33714 | 0.33764 | 0.38489 | 0.39862 | 0.42574 |
| Czech Republic | 0.5457 | 0.56725 | 0.57758 | 0.57113 | 0.57627 | 0.57892 | 0.59145 |
| Estonia | 0.49301 | 0.52972 | 0.53849 | 0.54925 | 0.53399 | 0.55135 | 0.53538 |
| Hungary | 0.43672 | 0.43926 | 0.44735 | 0.45729 | 0.47541 | 0.50279 | 0.50683 |
| Latvia | 0.34619 | 0.37283 | 0.41914 | 0.43992 | 0.44573 | 0.45599 | 0.46998 |
| Lithuania | 0.38174 | 0.41706 | 0.44937 | 0.46024 | 0.48473 | 0.47524 | 0.48419 |
| Poland | 0.41502 | 0.42013 | 0.43945 | 0.44423 | 0.47019 | 0.48029 | 0.48659 |
| Romania | 0.30979 | 0.31163 | 0.3161 | 0.32015 | 0.32776 | 0.32206 | 0.34231 |
| Slovakia | 0.44574 | 0.45347 | 0.45594 | 0.46385 | 0.47 | 0.48396 | 0.50213 |
| Slovenia | 0.55054 | 0.56075 | 0.58479 | 0.57649 | 0.57515 | 0.58086 | 0.59168 |
| Median | 0.415 | 0.4201 | 0.4474 | 0.4573 | 0.4702 | 0.4803 | 0.4866 |
| Min. value | 0.3098 | 0.3116 | 0.3161 | 0.3201 | 0.3278 | 0.3221 | 0.3423 |
| Max. value | 0.5505 | 0.5672 | 0.5848 | 0.5765 | 0.5763 | 0.5809 | 0.5917 |
| Difference quotient | 0.2407 | 0.2556 | 0.2687 | 0.2563 | 0.2485 | 0.2588 | 0.2494 |
| Coefficient of variation (%) | 18.5 | 19.7 | 19.6 | 18.7 | 16.6 | 16.3 | 15.3 |
| Arithmetic mean | 0.4215 | 0.4323 | 0.4468 | 0.4527 | 0.4645 | 0.4743 | 0.4837 |
| Standard deviation | 0.078 | 0.0852 | 0.0874 | 0.0846 | 0.077 | 0.0775 | 0.0739 |
| Pearson’s linear correlation coefficient (analyzed year against the previous year) | - | 0.9815 | 0.9849 | 0.9963 | 0.9854 | 0.9908 | 0.9902 |
Source: Authors’ compilation based on Eurostat. Database: Sustainable development indicators [40].
Table 3.
Challenges and opportunities in the implementation of the sustainable development concept in CEECs.
Table 3.
Challenges and opportunities in the implementation of the sustainable development concept in CEECs.
| Challenges | Characteristics |
| Population aging | Population aging is a problem that refers to the vast majority of European countries, including the CEE region. This phenomenon is a sign of our times, as we live longer and the fertility rate is low. In this respect it can be recommended to carry out activities aimed at the intensification of pro-family policies along with allocating childcare benefits, which is already being implemented in most of the CEE countries. In addition, it may be effective to promote a large family model, supported by the system of discounts and promotions offered by public and private sector entities. Senior citizens should also be covered by better-functioning care. Special programs to support and activate them should be developed. They should also be provided with medical care at an appropriate level. |
| Comprehensive revitalization of public space | Revitalization is directly related to sustainable development. It constitutes an important component, being its complementary part. In the CEE countries there are still many areas requiring urgent revitalization in social, economic, environmental, spatial, and technical areas. It predominantly refers to public space. It is also important that the discussed revitalization does not only apply to urban areas but also to rural ones. In this respect, it is recommended to carry out complex activities rather than focus on technical (housing) aspects only, not neglecting the other dimensions of revitalization. In recent years, revitalization activities in the countries of the CEE region have been supported and cofinanced from European funds. |
| Increasing competition from other European regions and the world | An increasing competition from other countries and regions of the world is also a challenge for sustainable development in the CEE countries. Nowadays, countries compete in the fields of, e.g., investments, new residents, tourists, students, transfers of modern technologies. The activity of competition, primarily in the area of acquiring new and maintaining current investors is increasing. A separate issue is competing to attract workers. In this case, the targeted integrated order, primarily in the social dimension, disturbs the outflow of workers from the CEE region to wealthier European countries. The actual remuneration level and working conditions are decisive here. This phenomenon can naturally halt the leveling of life quality against the richest. The CEE countries are also competing for EU funds. The relatively high investment attractiveness of the CEE region is a positive phenomenon. Therefore, a good solution is to continue strengthening cooperation between the countries in the region, since in many situations they can take a joint stand. |
| Fluctuations in the economic situation, crises | Fluctuations in economic prosperity or crisis events can disturb the process of sustainable development. They are also extremely difficult to predict. The best example of such a situation is the last global economic crisis, which originated in the United States and spread throughout the world. At present, as shown in the conducted research, CEE countries are experiencing a positive situation in terms of economic growth. They also coped relatively well with the aforementioned crisis. However, the challenge is to take into account crisis situations in the development plans of individual countries. Scenario-oriented planning can be used in this case, as well as developing alternative strategies, flexibility, and speed in responding to changes occurring in both close and distant environments. |
| Social stratification | The research results presented in the study confirmed that social stratification is still a major challenge for CEE countries. Sustainable development cannot be attained if an extensive part of society is at risk of poverty. Social wealth and stability is not built on a narrow group of rich people, but a large and strong middle class. It should be noted that despite the undeniable socioeconomic development of the CEE region, the scale of stratification did not radically improved. A better quality of life in large cities does not always mean the same situation outside them, where the majority of CEEC populations reside. In addition, the stratification itself results in a number of negative consequences, including social exclusion, poverty, addictions, crime, unemployment, and low social activity. |
| Depletion of natural resources | The process of natural resources depletion is generally related to an expansive human development policy. Natural resources are a specific economic category and, along with national assets, e.g., anthropogenic resources, create national wealth. They are, therefore, an important determinant, the driving force of socioeconomic development. In recent years, CEE countries have been particularly exposed to this resource depletion. It is caused by an increasing demand for all raw materials and is related to developmental and infrastructural differences leveling and catching up with the civilization distance. It is a challenge, the consequences of which for sustainable development will be experienced in the years to come. At present, it is reasonable to take up specific actions anticipating future threats. It is important to carry out a rational resource policy, care for renewable energy sources, and promote attitudes of intergenerational justice. |
| Opportunities | Characteristics |
| Higher ecological awareness | The research confirmed favorable changes in the field of education in general. On this basis, it can be adopted that social environmental awareness is also increasing. This is extremely important for sustainable development for several reasons. Ecological education means the concept of upbringing, the subject of teaching, as well as educational and pedagogical activity, which is the system of influencing attitudes and views about the surrounding world based on respect for the environment. Through an interdisciplinary approach, it raises public awareness about environmental risks and threats and their causes and effects, and teaches how to solve them and to be responsible for the natural environment. It also stimulates taking individual and group actions aimed at protecting the natural environment. |
| Higher amounts of public funds for environmentally friendly solutions, climate protection | As mentioned earlier, the CEE countries (with particular emphasis on the largest analyzed country, Poland) are among the main beneficiaries in the context of financial support received from European funds. Many aid programs are directly dedicated to the implementation of pro-ecological and environmentally friendly solutions. For the CEE countries, this offers a unique development opportunity and an actual chance to transform their economies toward sustainable development. For example, within the framework of the next long-term EU budget for 2021–2027, higher financial resources are planned to be allocated to activities focused specifically on environment and climate issues. A greater emphasis is placed on clean energy, nature and biodiversity, further support for the circular economy, and mitigating climate change. Innovative methods of response to the challenges related to environment and climate problems are also anticipated. |
| Adjusting legislation to EU environmental requirements | Adjusting national legislation to EU regulations is, to a certain extent, a positive phenomenon in the context of sustainable development concept implementation. In general, all member states are obliged to do so, including the CEE countries analyzed in the study. Approaching gradually the relatively high EU norms and standards in the field of, e.g., emission reduction of toxic compounds to the atmosphere, is of particular importance here. The solutions in this area can be expensive, but it is believed that in the long run they will contribute to environmental protection and higher levels of sustainable development. |
| Intensified activity of the sector of nongovernmental organizations (NGOs) | The social aspect is very important in implementing the principles of sustainable development. The intensified activity of nongovernmental organizations (NGOs) can turn out to be beneficial for this process. It should be noted that social participation in solving national and regional problems is lower in the CEE countries than in Western Europe. In addition, NGOs can act as partners in the implementation of joint projects along with the representatives of both private (enterprises) and public (central level institutions, local governments) sectors. The activities performed by NGOs offer certain opportunities, as they frequently promote the principles of sustainable development, environmental education, respect for natural resources, and intergenerational accountability. They are capable of stimulating endogenous potentials of local communities in individual countries. NGOs also have extensive possibilities of applying for financial support from the European Union funds. |
| Promoting a healthy lifestyle, active spending of free time | A healthy lifestyle is basically ingrained in the social dimension of sustainable development and remains one of the conditions for achieving integrated order. The increasingly popular trend for a healthy, active lifestyle is also a chance to improve the quality of life in individual countries. The promotion of a healthy lifestyle on a daily basis, improving physical health and fitness, has already been relatively strongly propagated by the information spread by the media, in educational projects, and through preventive healthcare. The concept of sustainable living has also been popularized, i.e., a lifestyle according to the philosophy of sustainable development. In general terms, it is a kind of alternative way of life that refrains from excessive consumption, rush, and stress and aims at spiritual development. It contains elements of a slow life, zero waste, and downshifting, as well as personal development and extensively understood ecology. Such an approach opens space for reflection on the conditions, quality, and improvement of all aspects of life in a way that regulates mutual relationships between an individual, society, and the environment. |
© 2019 by the authors. Licensee MDPI, Basel, Switzerland. This article is an open access article distributed under the terms and conditions of the Creative Commons Attribution (CC BY) license (http://creativecommons.org/licenses/by/4.0/).
Share and Cite
MDPI and ACS Style
Raszkowski, A.; Bartniczak, B. Sustainable Development in the Central and Eastern European Countries (CEECs): Challenges and Opportunities. Sustainability 2019, 11, 1180. https://0-doi-org.brum.beds.ac.uk/10.3390/su11041180
AMA Style
Raszkowski A, Bartniczak B. Sustainable Development in the Central and Eastern European Countries (CEECs): Challenges and Opportunities. Sustainability. 2019; 11(4):1180. https://0-doi-org.brum.beds.ac.uk/10.3390/su11041180
Chicago/Turabian StyleRaszkowski, Andrzej, and Bartosz Bartniczak. 2019. "Sustainable Development in the Central and Eastern European Countries (CEECs): Challenges and Opportunities" Sustainability 11, no. 4: 1180. https://0-doi-org.brum.beds.ac.uk/10.3390/su11041180
Note that from the first issue of 2016, this journal uses article numbers instead of page numbers. See further details here.