Sustainability Performance Evaluation of Hybrid Energy System Using an Improved Fuzzy Synthetic Evaluation Approach

1
School of Economics and Management, North China Electric Power University, Beijing 102206, China
2
Beijing Key Laboratory of New Energy and Low-Carbon Development, North China Electric Power University, Beijing 102206, China
3
Luneng New Energy (GROUP) CO., LTD, Beijing 102206, China
*
Author to whom correspondence should be addressed.
Sustainability 2019, 11(5), 1265; https://0-doi-org.brum.beds.ac.uk/10.3390/su11051265
Submission received: 3 January 2019
/
Revised: 19 February 2019
/
Accepted: 19 February 2019
/
Published: 27 February 2019
(This article belongs to the Section Energy Sustainability)
Abstract
:The hybrid energy system (HES) has attracted more and more attention since it can not only achieve multi-energy supply but realize cascade utilization of energy resources. However, the performances of the HES in relation to economic, environmental, social, and technological aspects are rarely studied. Therefore, this paper tries to fill this research gap to evaluate the sustainability performance of an HES. First, an evaluation criteria system is established based on a literature review. After that, the group analytic hierarchy process (GAHP) technique is used to obtain the importance weights of these criteria. Later, the sustainability performance of the HES is calculated through an improved fuzzy synthetic evaluation (FSE) approach based on a cloud model. The applicability of this approach is demonstrated by a real case study in Zhejiang province, China. Finally, the sensitivity analysis results reveal that the overall consequence is that the performance of an HES is robust when the criteria weight is floating within a certain range (−30–30%), and the comparative analysis with the traditional FSE also reveals that the proposed approach is superior.
1. Introduction
Many countries have recognized that relying on one or two kinds of energy sources is not conducive to sustainable development [1,2,3]. A hybrid energy system (HES), which is a system that can accommodate a variety of energy input and has multiple output functions and transport forms [4], is gaining more attention from all over the world. In 2001, the United States put forward an HES development plan to promote the application of distributed energy and combined heating and power (CHP) technologies and to increase the proportion of clean energy use [5]. Canada regards the HES as an important supporting technology for achieving its emission reduction targets by 2050 [6]. Japan has become the first Asian country to carry out HES research because of its heavy dependence on imports of energy; it hopes to ease the pressure of its energy supply through technological innovation in this field [7]. The Chinese government focuses on the implementation of the HES during the “13th Five-Year” period [8]. Several demonstration HES projects have begun to operate and have achieved significant social and economic benefits, as shown in Table 1.
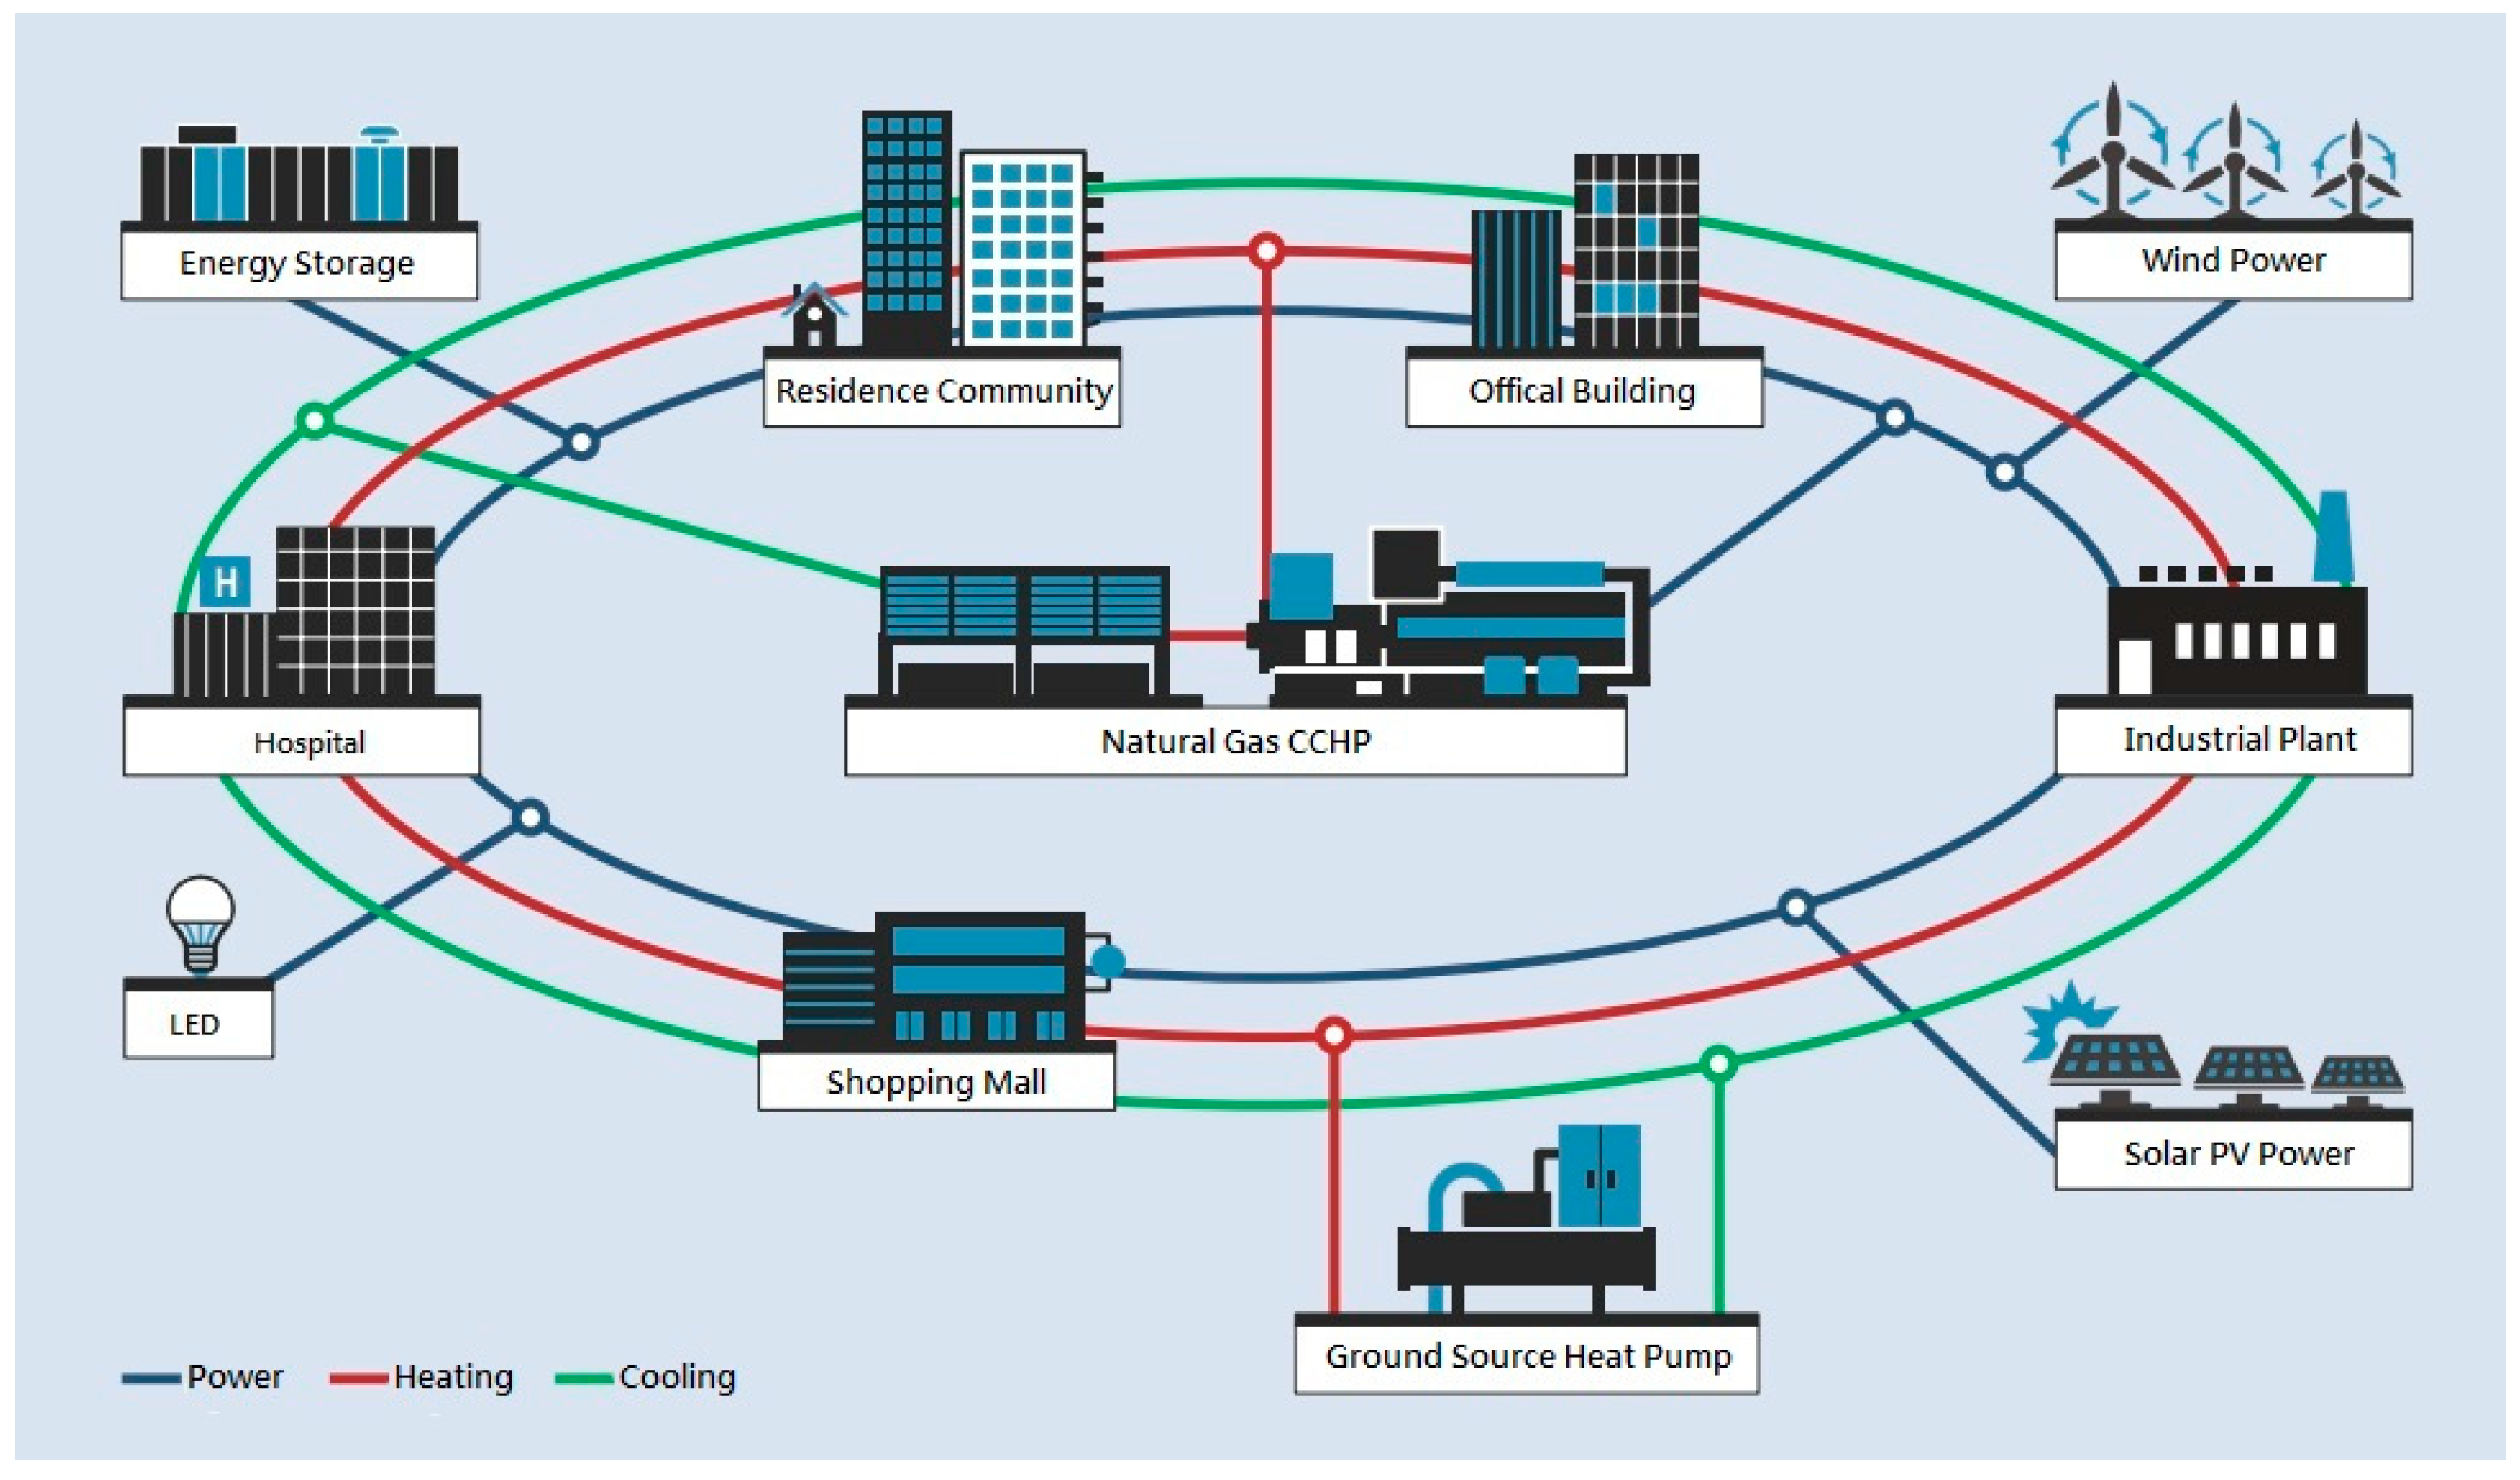
According to the scope of supply areas, the HES can be divided into national-level, regional-level or building-level [10]. This paper focuses on the regional-level HES. A diagram of a regional-level HES—which consists of wind power, solar photovoltaic (PV) power, natural gas, combined cooling and heating, power storage, and energy storage—is presented in Figure 1. Its main objective is to achieve complementary and cascade utilization of multiple energy sources. Moreover, implementing the HES is an effective way to handle the serious problems of power curtailment which has occurred in North China [11].
The performance of an HES is the most concerning problem for local governments as well as potential investors. Understanding the performance of an HES can help the investors select the most promising project and help the government to take measures to improve project performance and encourage more private capital to enter.
Nowadays, research on the performance evaluation of an HES has been quite fruitful. Khosravi et al. [12] assessed the energy, exergy, and economic performance of an off-grid hybrid renewable energy system integrated with solar PV, wind energy, hydrogen production unit, and fuel cells. Li et al. [13] carried out an exergy and energy performance evaluation of photovoltaic-thermoelectric (PV-TE) hybrid systems. Sahoo et al. [14] performed an energy, exergy, and economic performance evaluation for a hybrid solar and biomass system. Yildirim and Bilir [15] evaluated a hybrid energy system with photovoltaics and a ground source heat pump from the economic and environmental perspective. Kalinci et al. [16] evaluated the energy and exergy performance of a hybrid hydrogen energy system which consists of a PV array, wind turbines, an electrolyzer, a polymer electrolyte membrane fuel cell, a hydrogen tank, and a converter. Ma, Xue, and Liu [10] presented a techno-economic performance evaluation of the hybrid renewable energy system at specific spatial scales based on computer software and arithmetic models. Their research helps decision makers at different renewable energy planning levels to choose suitable approaches among a significant number of existing methods.
From above reviews, it can be concluded that the existing research on HES project performance evaluation, which enriches and develops the relative theories, mainly focuses on energy, exergy, technological, or economic aspect. However, there is a lack of literature on performance evaluation of HES projects from a sustainability perspective. The term “sustainability” refers to the long-term development which includes economic, environmental, and social dimensions [17]. This concept has been emphasized in the development of energy projects [18,19,20]. As a matter of fact, the HES has remarkable environmental benefits, such as carbon emission reduction, and social benefits, such as employment creation. Moreover, as awareness of sustainable developments has enhanced, more and more energy corporations have started to pay attention to the harmonious development of the environment, society, and economy. Therefore, this paper aims to evaluate the performance of the HES from a sustainability perspective.
The decision-making environment of HES sustainability performance evaluation is fraught with uncertainty. The reasons are as follows: On the one hand, HES performance evaluation is conducted in the early stages based on previous estimates about what its future values will be. Actually, the future values are difficult to predict precisely due to the rapid change of decision-making environments. On the other hand, some judgments involved in HES performance evaluations rely on experts’ experiences heavily; however, ambiguity always exists in the thinking of experts [21]. Thus, HES sustainability performance evaluation is a tough process in an uncertain environment.
The fuzzy set theory, as proposed by Zadeh [22], has emerged as a powerful way to represent such uncertain phenomena. By combining the fuzzy set theory and traditional evaluation methods, some fuzzy evaluation methods have been developed by scholars; these include fuzzy synthetic evaluation (FSE) [23] and fuzzy multi-criteria decision-making (MCDM) approaches, such as fuzzy Order Preference by Similarity to Ideal Solution (TOPSIS) [24], fuzzy VIsekriterijumska optimizacija i KOmpromisno Resenje (VIKOR) [25], fuzzy PROMETHEE [26] and fuzzy TODIM [27]. The FSE method is a comprehensive evaluation approach based on fuzzy mathematics. The advantage of the FSE method is that it can evaluate a single object; meanwhile, fuzzy MCDM approaches depend on the comparison between multiple projects, which leads to the phenomenon of selective reversal. Moreover, the FSE method has clear results, strong systematics, and is suitable for solving various uncertain problems. For these reasons, the FSE method has been widely applied in many fields [23,28,29,30].
The concept of uncertainty consists of concepts such as fuzziness, randomness, incompleteness, and instability. Among them, fuzziness and randomness are the most important and fundamental issues [31]. There is a strong relationship between randomness and fuzziness. Though the FES method has unique advantages in dealing with multi-factor and multi-level complex evaluation problems, it has a shortcoming in that it ignores the inherent randomness of information. Fortunately, the cloud model first put forward by Deyi et al. [32] can depict the relationship of randomness and fuzziness. Therefore, due to its numerous advantages, the cloud model has been successful applied in energy management fields. Wu et al. [33] proposed a cloud-based decision framework for waste-to-energy plant site selection. In their study, a cloud choquet integral (CCI) operator is constructed to evaluate the alternatives. Wu, Xu, Li, Wang, Chen, and Xu [31] assessed the risk level of public–private partnership waste-to-energy incineration projects in China by using a model for converting the two-dimensional linguistic variables into clouds. Zhang et al. [34] evaluated renewable energy project performance using a hybrid approach mixing two-dimensional uncertain linguistic variables, cloud models, and an extended TODIM.
In view of this, this study proposes a cloud-based fuzzy synthetic evaluation method to evaluate the sustainability performance of the HES by studying the complementary advantages of these two methods. A three-stage framework is put forward in this paper: (1) Establishment of a comprehensive criteria system based on literature review; (2) determination of the important weights of each criterion by using the group analytic hierarchy process (GAHP) technique; and (3) evaluation of HES alternatives by employing the cloud-based fuzzy synthetic evaluation approach.
The main novelties of this paper are two-folds: (1) From the literature review, we can learn that current researchers evaluate the performance of HES projects by using a limited number of energy, exergy, technological, or economic criteria. This is the first study to establish a comprehensive evaluation criteria system for HES project performance evaluation from the four aspects of economy, technology, society, and environment; (2) the shortcomings relative to traditional FSE can be identified in the previous research (e.g., ignoring randomness), which are addressed in this paper by developing an improved fuzzy synthetic evaluation approach based on the cloud model. The traditional membership function of the FSE approach has been replaced by the membership function of the cloud model.
The other parts of this paper are organized as follows: in Section 2, an evaluation criteria system for HES sustainability performance evaluation is established; in Section 3, the basic theories of the GAHP, fuzzy synthetic evaluation approach, cloud model, and cloud-based fuzzy synthetic evaluation approach are elaborated upon; in Section 4, an empirical study in Zhejiang Province, China is provided; in Section 5, the discussion includes sensitivity analysis and comparative analysis is conducted; and the last section concludes this paper.
2. Evaluation Criteria System
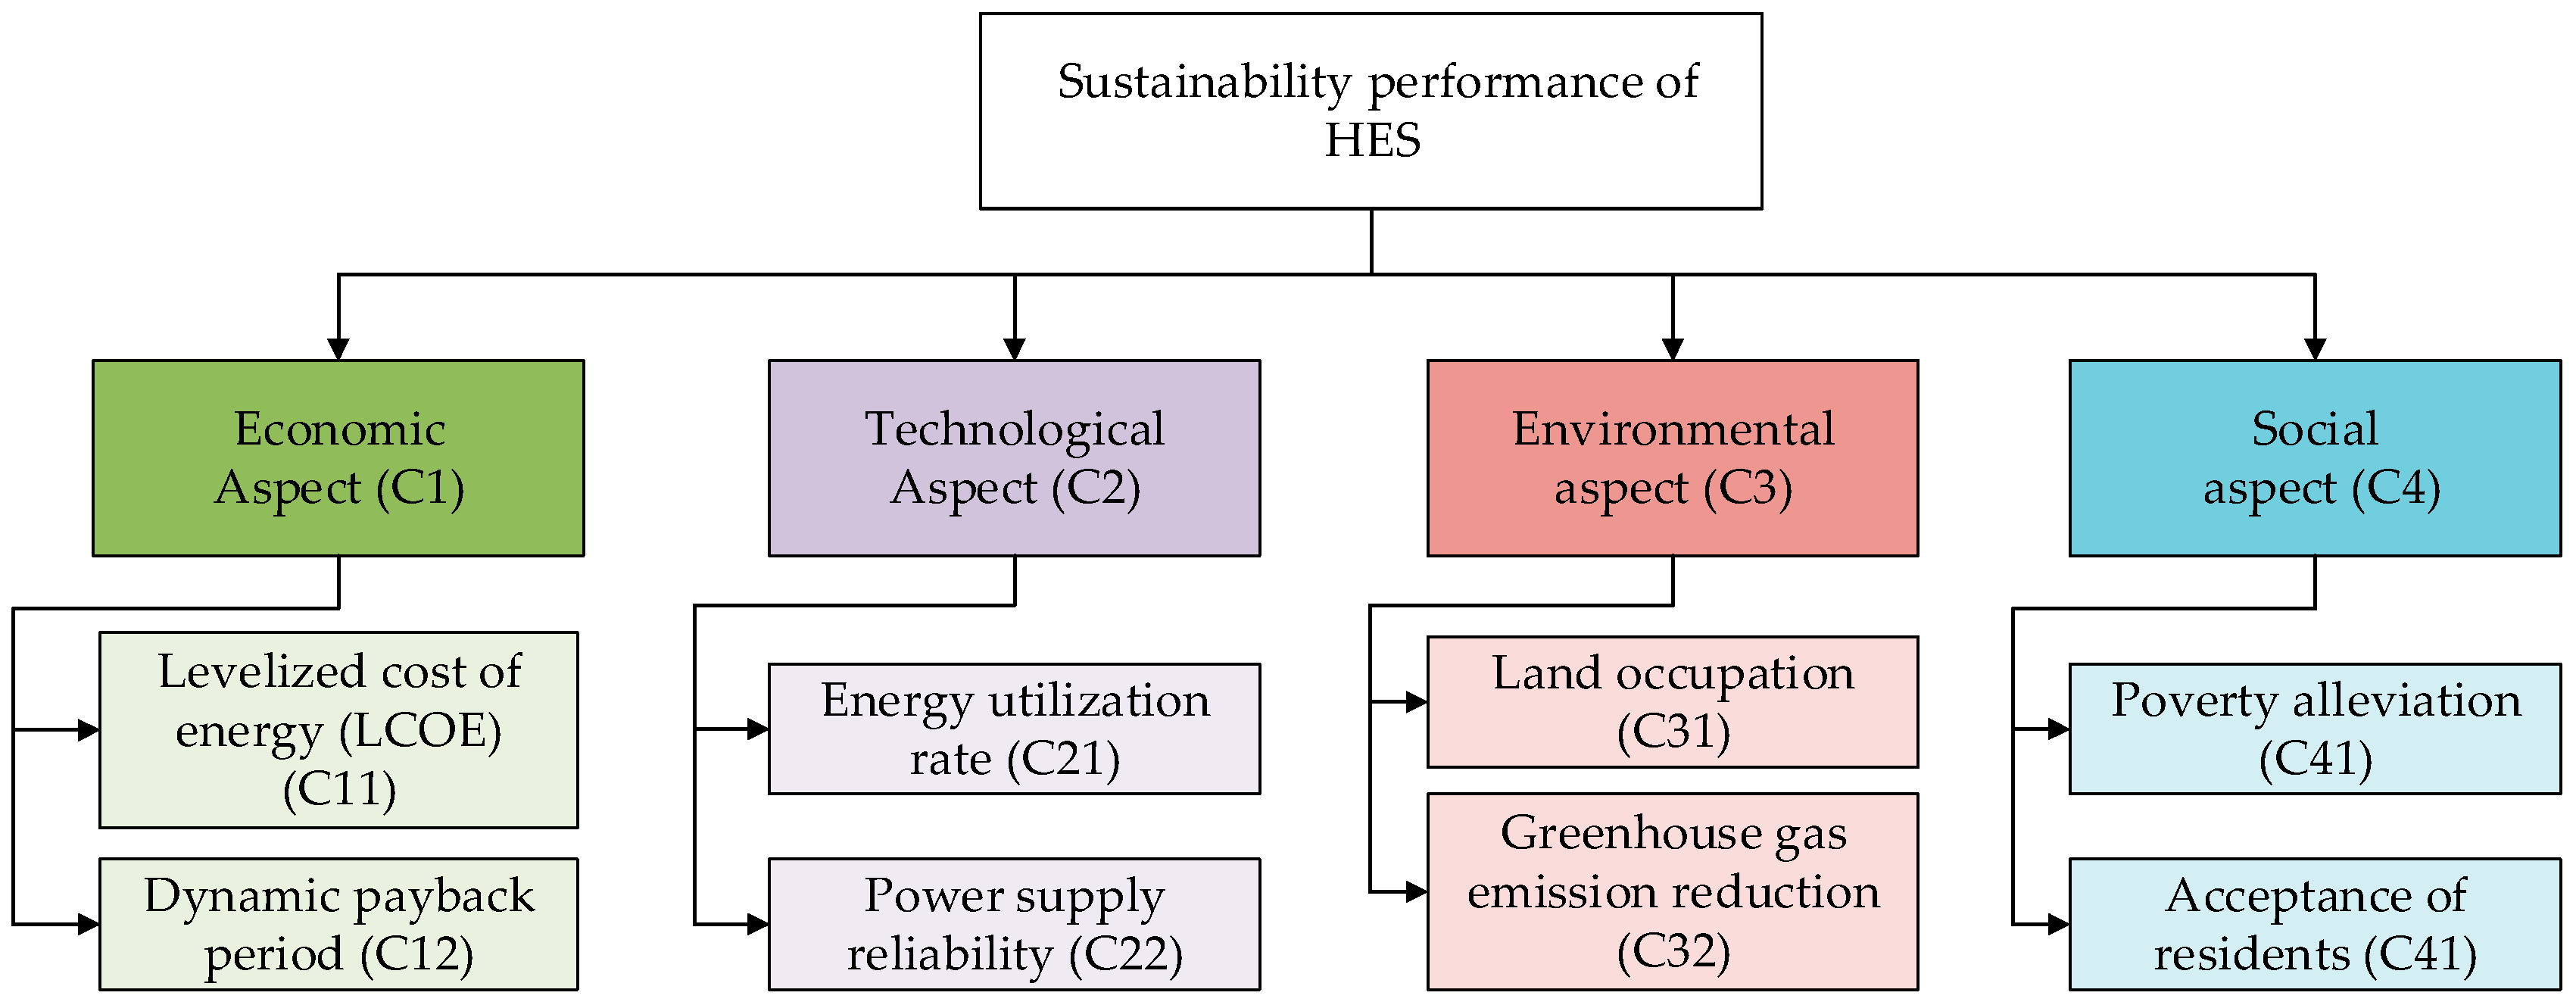
Establishing a reasonable evaluation criteria system is crucial to the sustainability performance evaluation of an HES. The significant criteria involved in this process are selected through literature review and shown in Figure 2.
2.1. Economic Aspect (C1)
• Levelized cost of energy (LCOE) (C11) [35]: This criterion is one of the commonly used indicators for comparing the economic performance of various power generating utilities, including an HES. It measures the net present value of the unit-cost of energy (including electricity, heat, and cooling) over the lifetime of an HES.
where is the annual value of the initial investment cost, including its own funds, loans, and depreciation; is the annual value of operation and maintenance costs, including insurance costs, repair costs, and labor costs; is the annual tax payable for power plants, including sales tax, value-added tax, and land tax; is the installed capacity; is the annual utilization hours; is the self-electricity consumption rate; is the power plant operation life; and is discount rate.
• Dynamic payback period (C12) [36]: This refers to the time required to make the cumulative economic benefit equal to the initial investment cost. Investors often care about what time they can recover costs and thus reduce risks. The dynamic payback period is calculated as follows:
where and are the cash inflow and cash outflow at the period, respectively; and is the benchmark yield, which is the lowest acceptable return level of investment projects determined by investors from a dynamic point of view. The benchmark yield mainly depends on the composition of the fund source, the opportunity cost of investment, project risk and inflation rate, etc.
2.2. Technological Aspect (C2)
• Energy utilization rate (C21) [37]:
where are the electricity consumption, heat consumption, and cold consumption of the users in the park for a certain period, respectively; refers to the network loss rate within a certain area; and and are the amount of electricity purchased from the external grid and the amount of natural gas consumption in the HES, respectively.
• Power supply reliability (C22) [37]:
where , , and represent the deviation of electric supply, heat supply, and cool supply at the period, respectively; , , and indicate the demand of users for electric load, heat load, and cooling load at the period, respectively; is the actual output power for renewable energy units at the period; is the electric refrigerating at the period; , , and are the actual power output of CCHP with electricity, heat, and cold at the period, respectively; and is the discharge power of energy storage device at the period. Any reader interested in the energy demand prediction aspect of an HES can refer to [38,39,40].
2.3. Environmental Aspect (C3)
• Land occupation (C31) [11,41]: The HES occupies some land, which may affect the landscape and increase the project cost, especially if it is near a city.
• Greenhouse gas (GHG) emission reduction (C32) [11]: This is a measure of environmental friendliness and impact of the system on the environment.
where is the amount of coal consumption for power supply, and is the amount of carbon dioxide produced by burning a ton of standard coal.
2.4. Social Aspect (C4)
• Poverty alleviation (C41) [42]: In response to the country’s precise poverty alleviation strategy, this criterion has attracted the attention of many energy enterprises. The implement of an HES can promote local employment and economic growth and, thus, reduce poverty.
3. Methodology
This section presents the methodological background of the research. The research methodology introduces GAHP, fuzzy synthetic evaluation approach, cloud model, and cloud-based fuzzy synthetic evaluation approach.
3.1. GAHP Technique
GAHP was first proposed by Saaty [44] in the mid-1970s. It is a systematic and hierarchical analysis method which combines qualitative and quantitative information. Because of its practicality and effectiveness in dealing with complex decision-making issues, it has gained worldwide attention.
Let be the set of criteria, be the th decision-makers.
Step 1: Construct individual pairwise comparison matrix .
where and ; is the relative importance of to ; and the values of are based on a regular comparison scale of nine levels, as shown in Table 2.
Step 2: Examine the consistency of each comparison matrix.
The consistency index can be calculated as follows:
where is the largest eigenvalue of its adjacency matrix, and is the dimension of this matrix. This formula reflects that the consistency of a comparison matrix can be measured by the value of .
Then the random consistency ratio can be obtained, as indicated in Equation (9):
where is the mean random consistency index whose values are shown in Table 3. If , the comparison matrix is considered to pass the consistency test. Otherwise, the corresponding decision-maker need to adjust their judgement matrix again until it passes the consistency test.
Step 3: Aggregate each weight.
The GAHP allows a group of individuals to join in the decision-making process [45]. In the GAHP, every member fills up their own comparisons and records them in an individual pairwise comparison matrix. In the individual pairwise comparison matrices, each entry of the group pairwise comparison matrix is then determined as the geometric mean of the respective entries. The formula of geometric mean is as follows:
The pseudocodes of the GAHP are given in Appendix A1.
3.2. Fuzzy Synthetic Evaluation Approach
Fuzzy comprehensive evaluation is a method of comprehensive evaluation of many objects affected by various factors. The fuzzy comprehensive evaluation method is divided into single-layer and multi-layer. The use of fuzzy comprehensive evaluation can effectively deal with people’s subjectivity in the evaluation process and the objective phenomenon of ambiguity. The principle of this method is to first determine the multiple evaluation indicators by Equation (11).
where is the evaluation factor, and it is the number of individual factors at the same level.
Next, it is divided into multiple levels according to the affiliation of each indicator, as shown in Equation (12).
where is the evaluation levels, and is the number of factors.
Next, an evaluation matrix is established as Equation (13) based on the membership function:
where is the number of the factors, is the number of the evaluation rating, and represents the degree of belongs to .
Finally, turning up until the final level, the evaluation results are shown as Equation (14).
where is the membership degree of a objective belongs to when all factors are taken into account, and is the criteria of factor . The symbol represents the weighted averaging operator in which .
3.3. Cloud Model
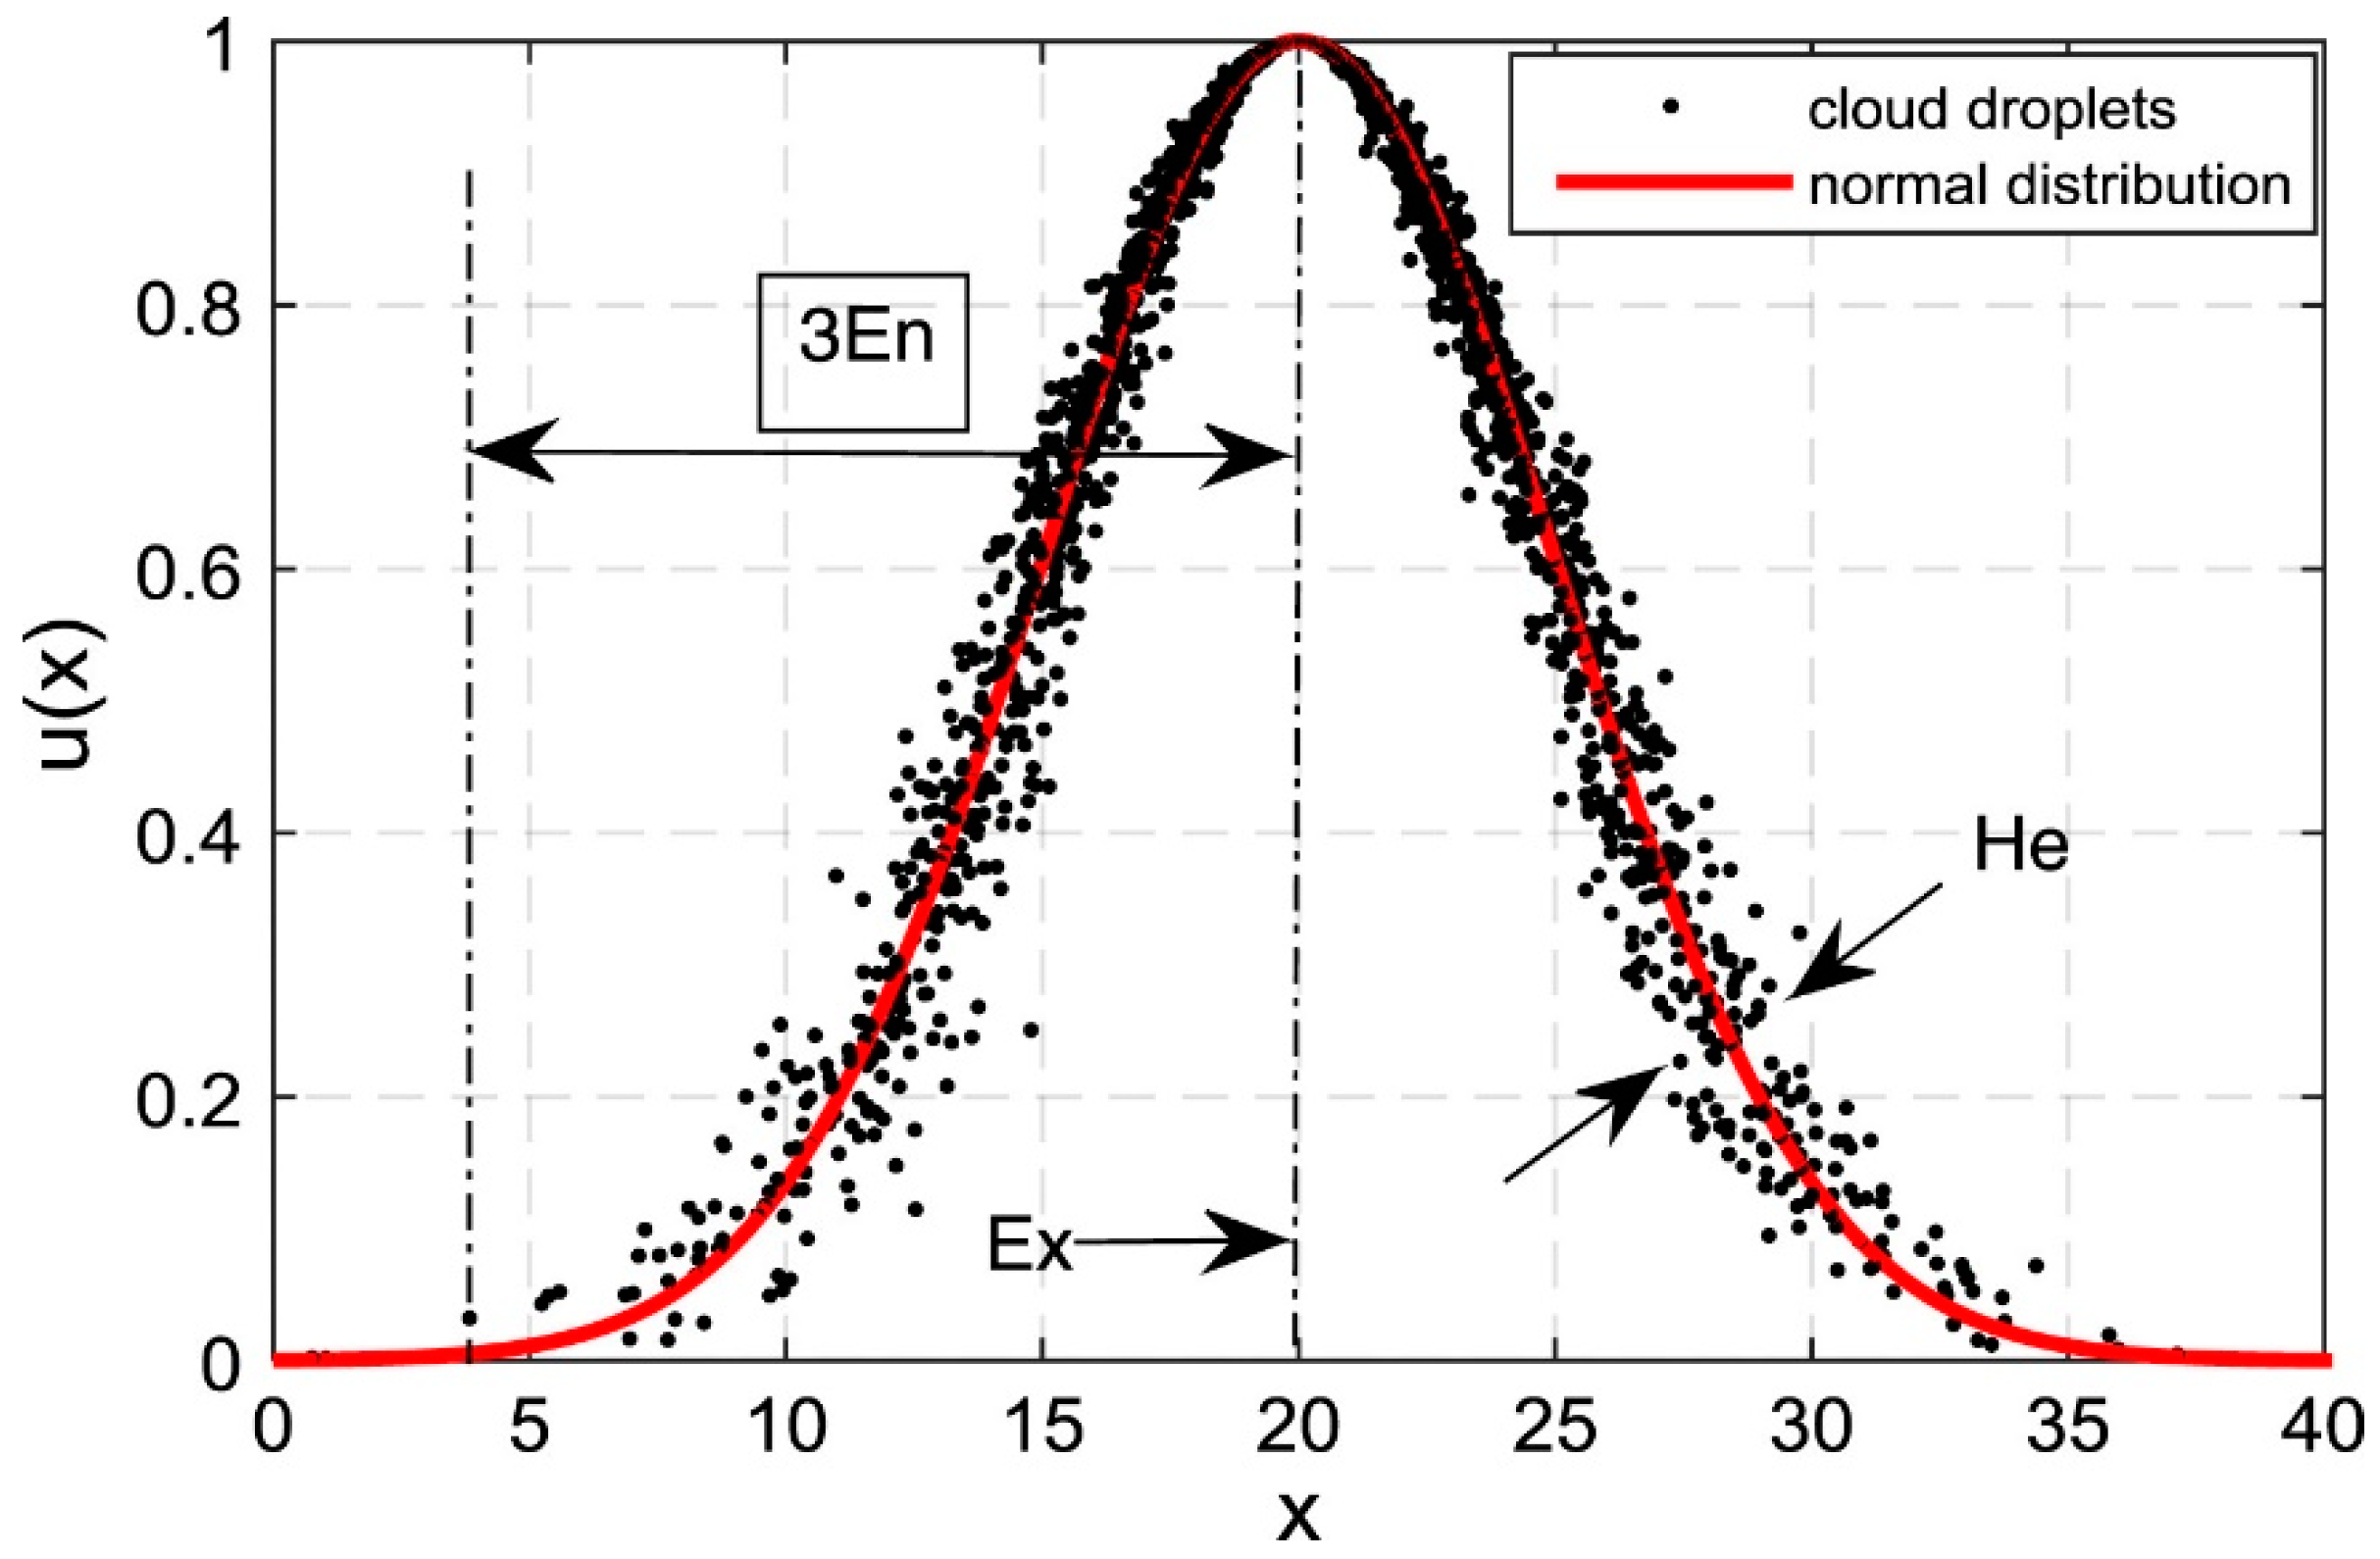
In general, the uncertainty is mainly represented by two different aspects: Randomness and fuzziness. Randomness is caused by the causality of events, which is the probability in the probability theory. Besides, ambiguity means the boundaries are not clear. In general, the cloud model can better solve the problem in an uncertain situation. The cloud model can effectively integrate the randomness and fuzziness of concepts and describe the overall quantitative property of a concept by three numerical characteristics—expectation (), entropy (), and hyper entropy (). Expectation represents the mean value of the domain; Entropy represents the fuzziness measurement of a qualitative concept; Hyper entropy is the entropy of entropy , which reflects the dispersion of the cloud drops. If A is a cloud with three numerical characteristics , , and , then cloud A can be described as A (). Figure 3 shows a cloud of (20,1,0.1).
Definition 1
[46]. Let be the universe of discourse and a qualitative concept in if is a random instantiation of concept , which satisfies , and the certainty degree of belonging to concept satisfies Equation (15).
where in the universe is called a normal cloud. is the membership function of belonging to concept . It measures the property that the certainty degree of belonging to a qualitative concept . The larger the value , the more subordinate it is to the qualitative concept .
Definition 2
[47]. Assume that there are two clouds: and . Some operations between cloud and can be defined as follows:
3.4. Cloud-Based Fuzzy Synthetic Evaluation Approach
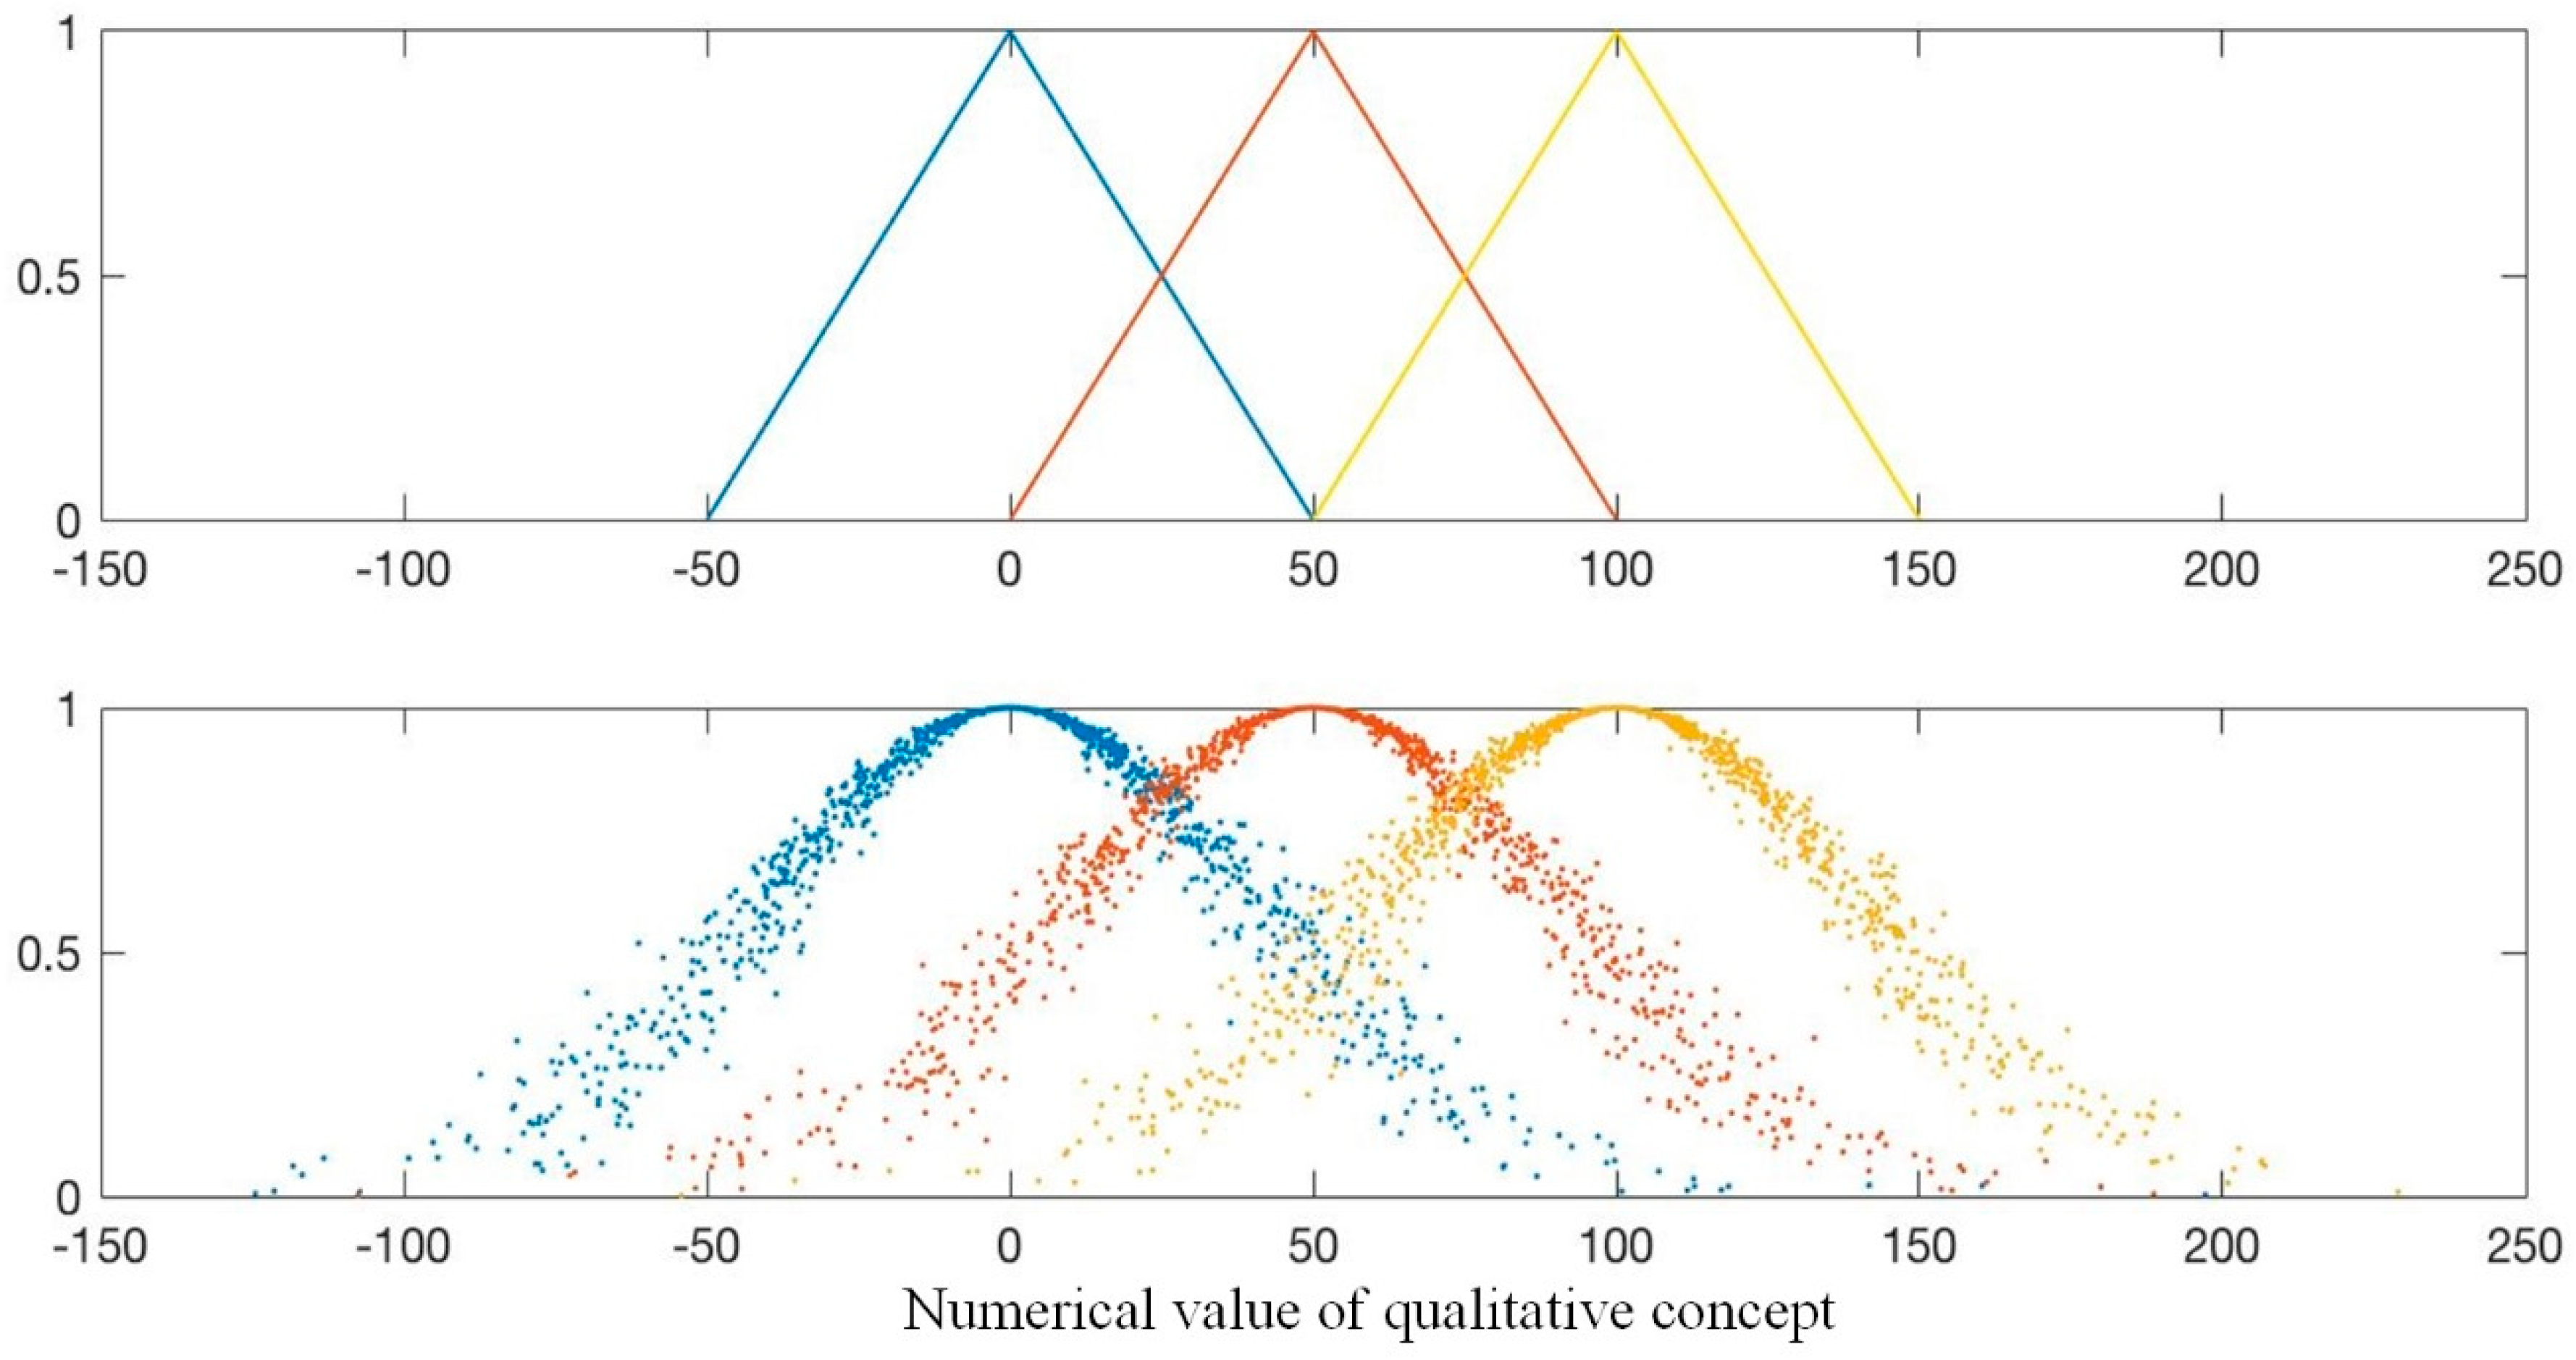
The FSE approach utilizes the membership function to transform uncertainty into certainty so that the traditional mathematical methods can be used for analysis and processing. However, the juncture function of membership function is questioned in literature [32]. In this section, we use the cloud model instead of the membership function to propose the cloud-based fuzzy synthetic evaluation approach, as shown in Figure 4. The process of this approach is presented as follows:
Step 1. Define the linguistic variable scale for evaluation .
For example, the linguistic assessment set can be established as .
Step 2. Determine the discourse universe of each linguistic variable for each criterion.
This process is undertaken by experts. For example, a expert may assign the interval [0%,20%] to the criterion “energy utilization rate” regarding the linguistic variable “Very Bad”.
Step 3. Calculate the membership degree of each criterion regarding every linguistic variable by using the Equation (15).
Step 4. Aggregate all the criteria and obtain the final result by using the Equation (14).
Compared with FSE, the cloud-based FSE has the following advantages: On the one hand, the randomness of uncertainty is taken into account; on the other hand, it is easy to determine the universe of discourse rather than the membership degree. The pseudocodes of the cloud-based fuzzy synthetic approach are given in Appendix A2.
4. An Empirical Study
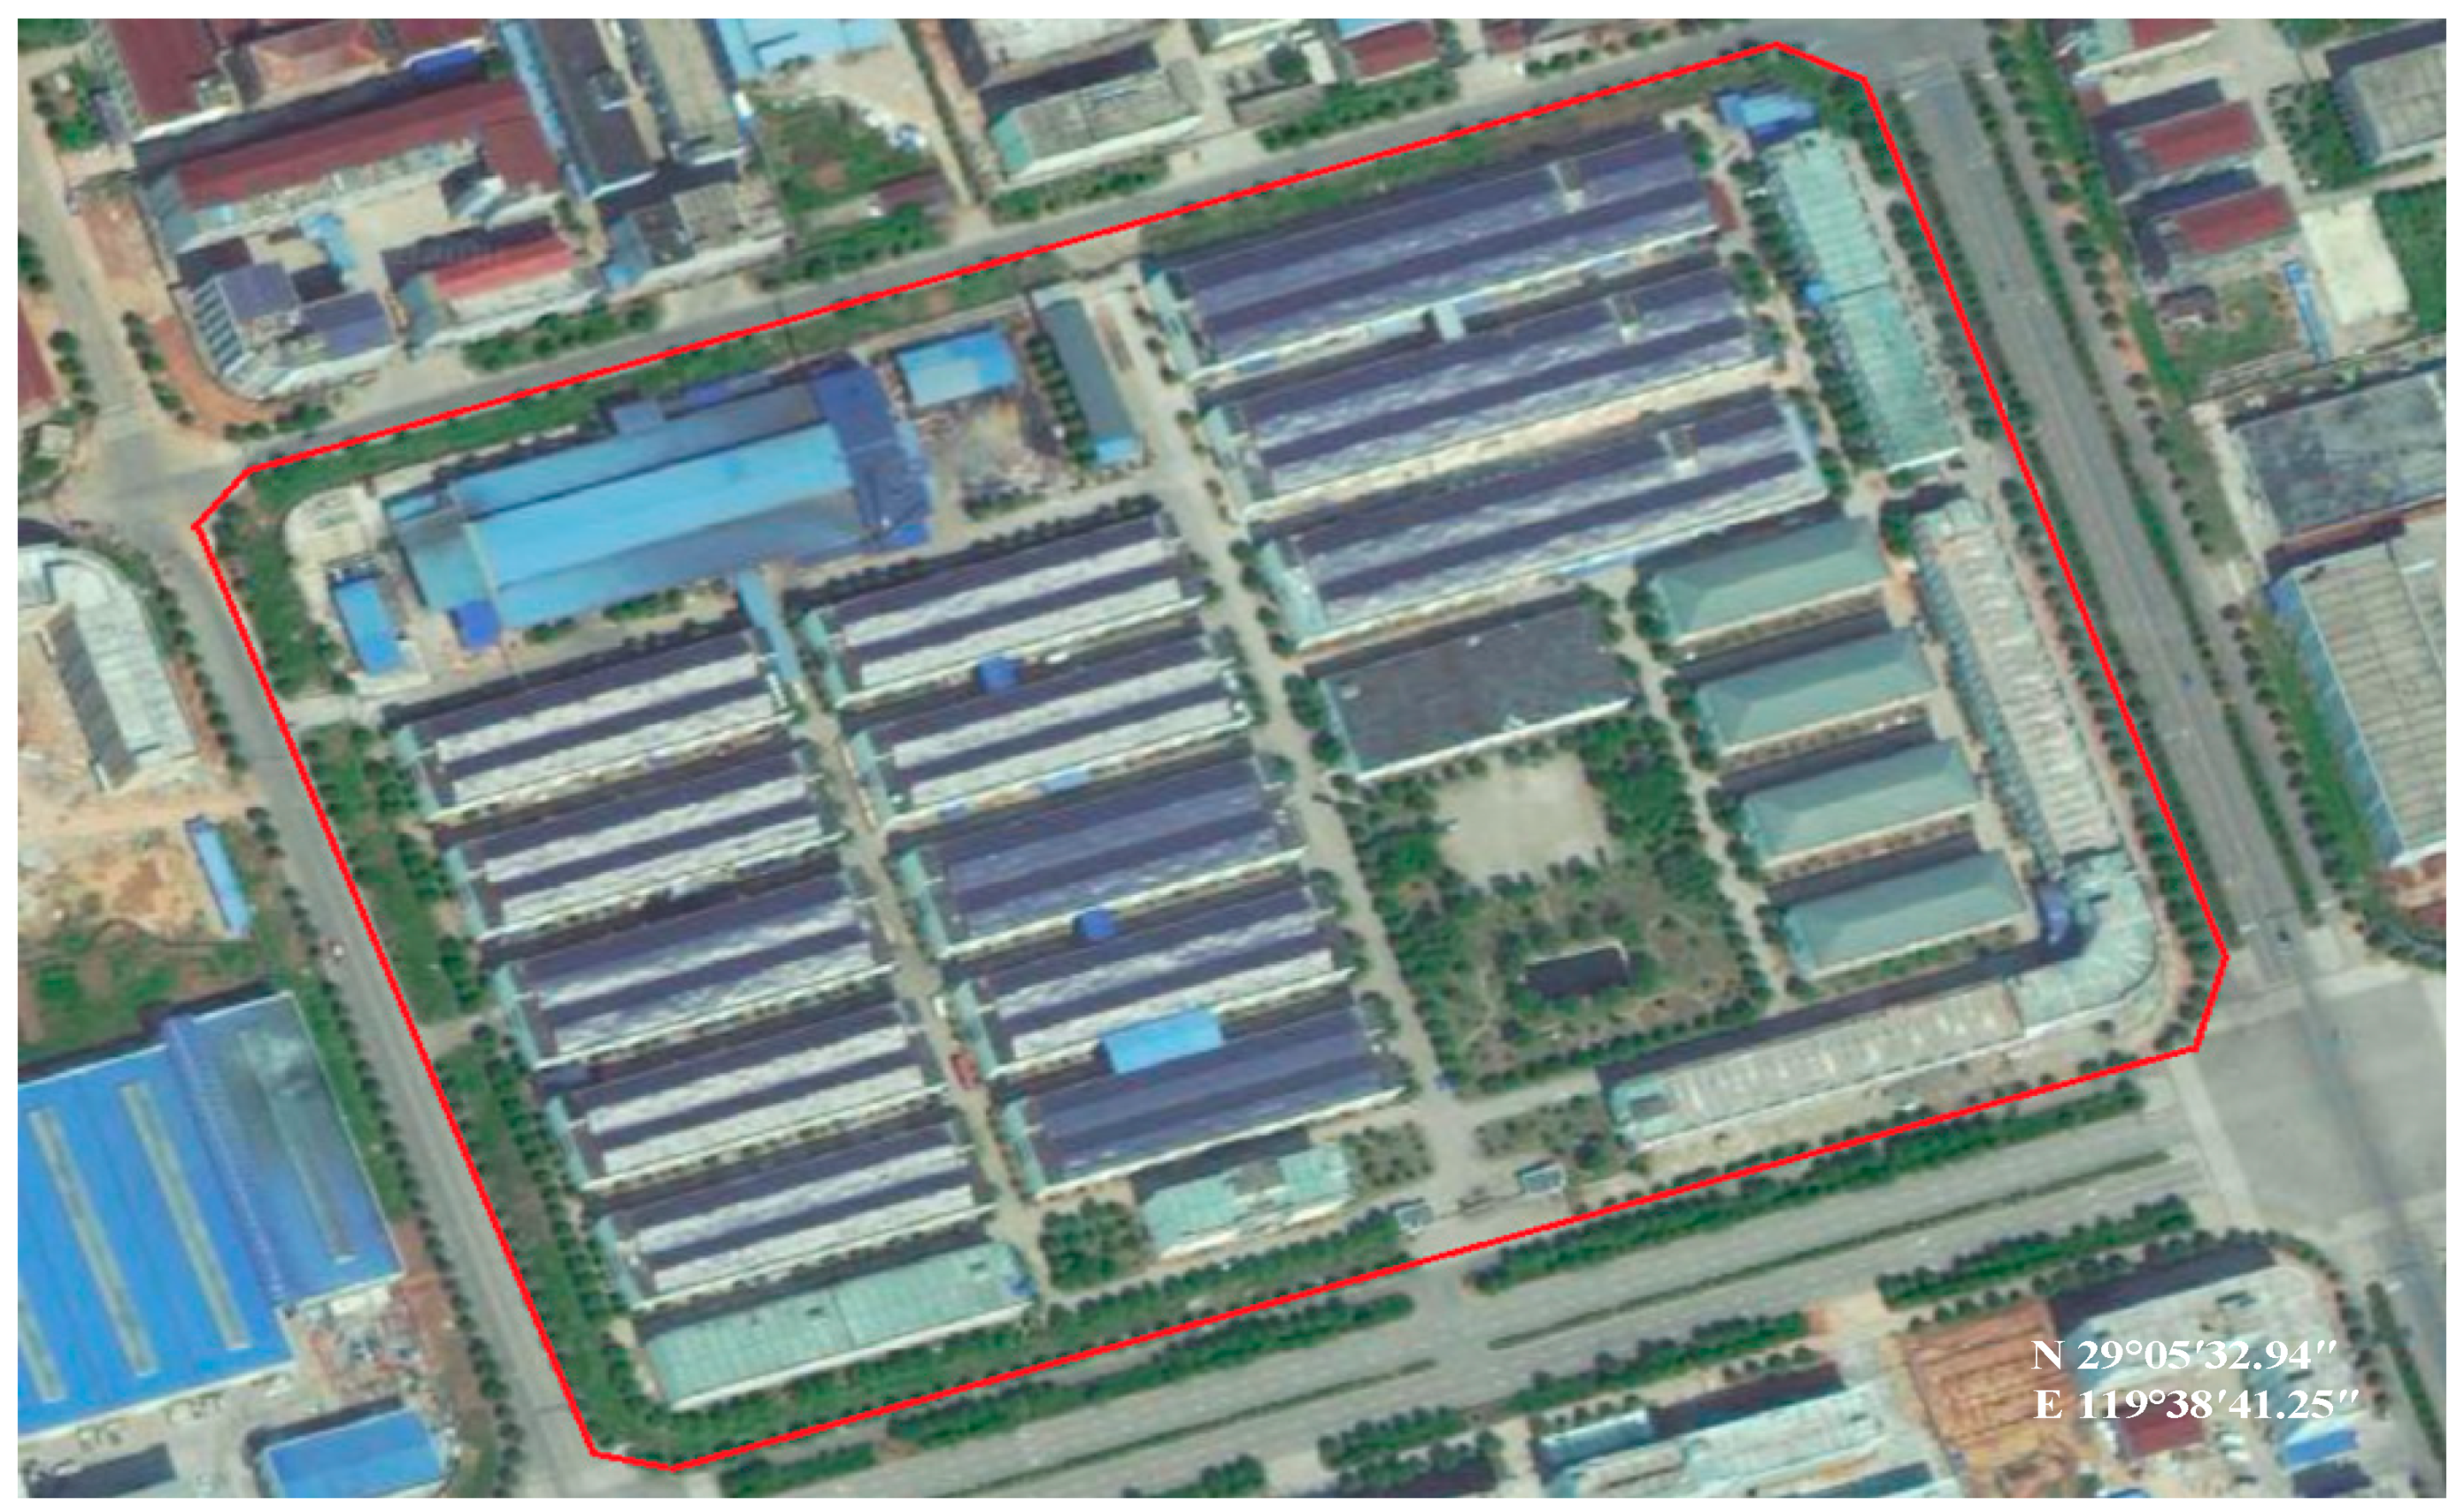
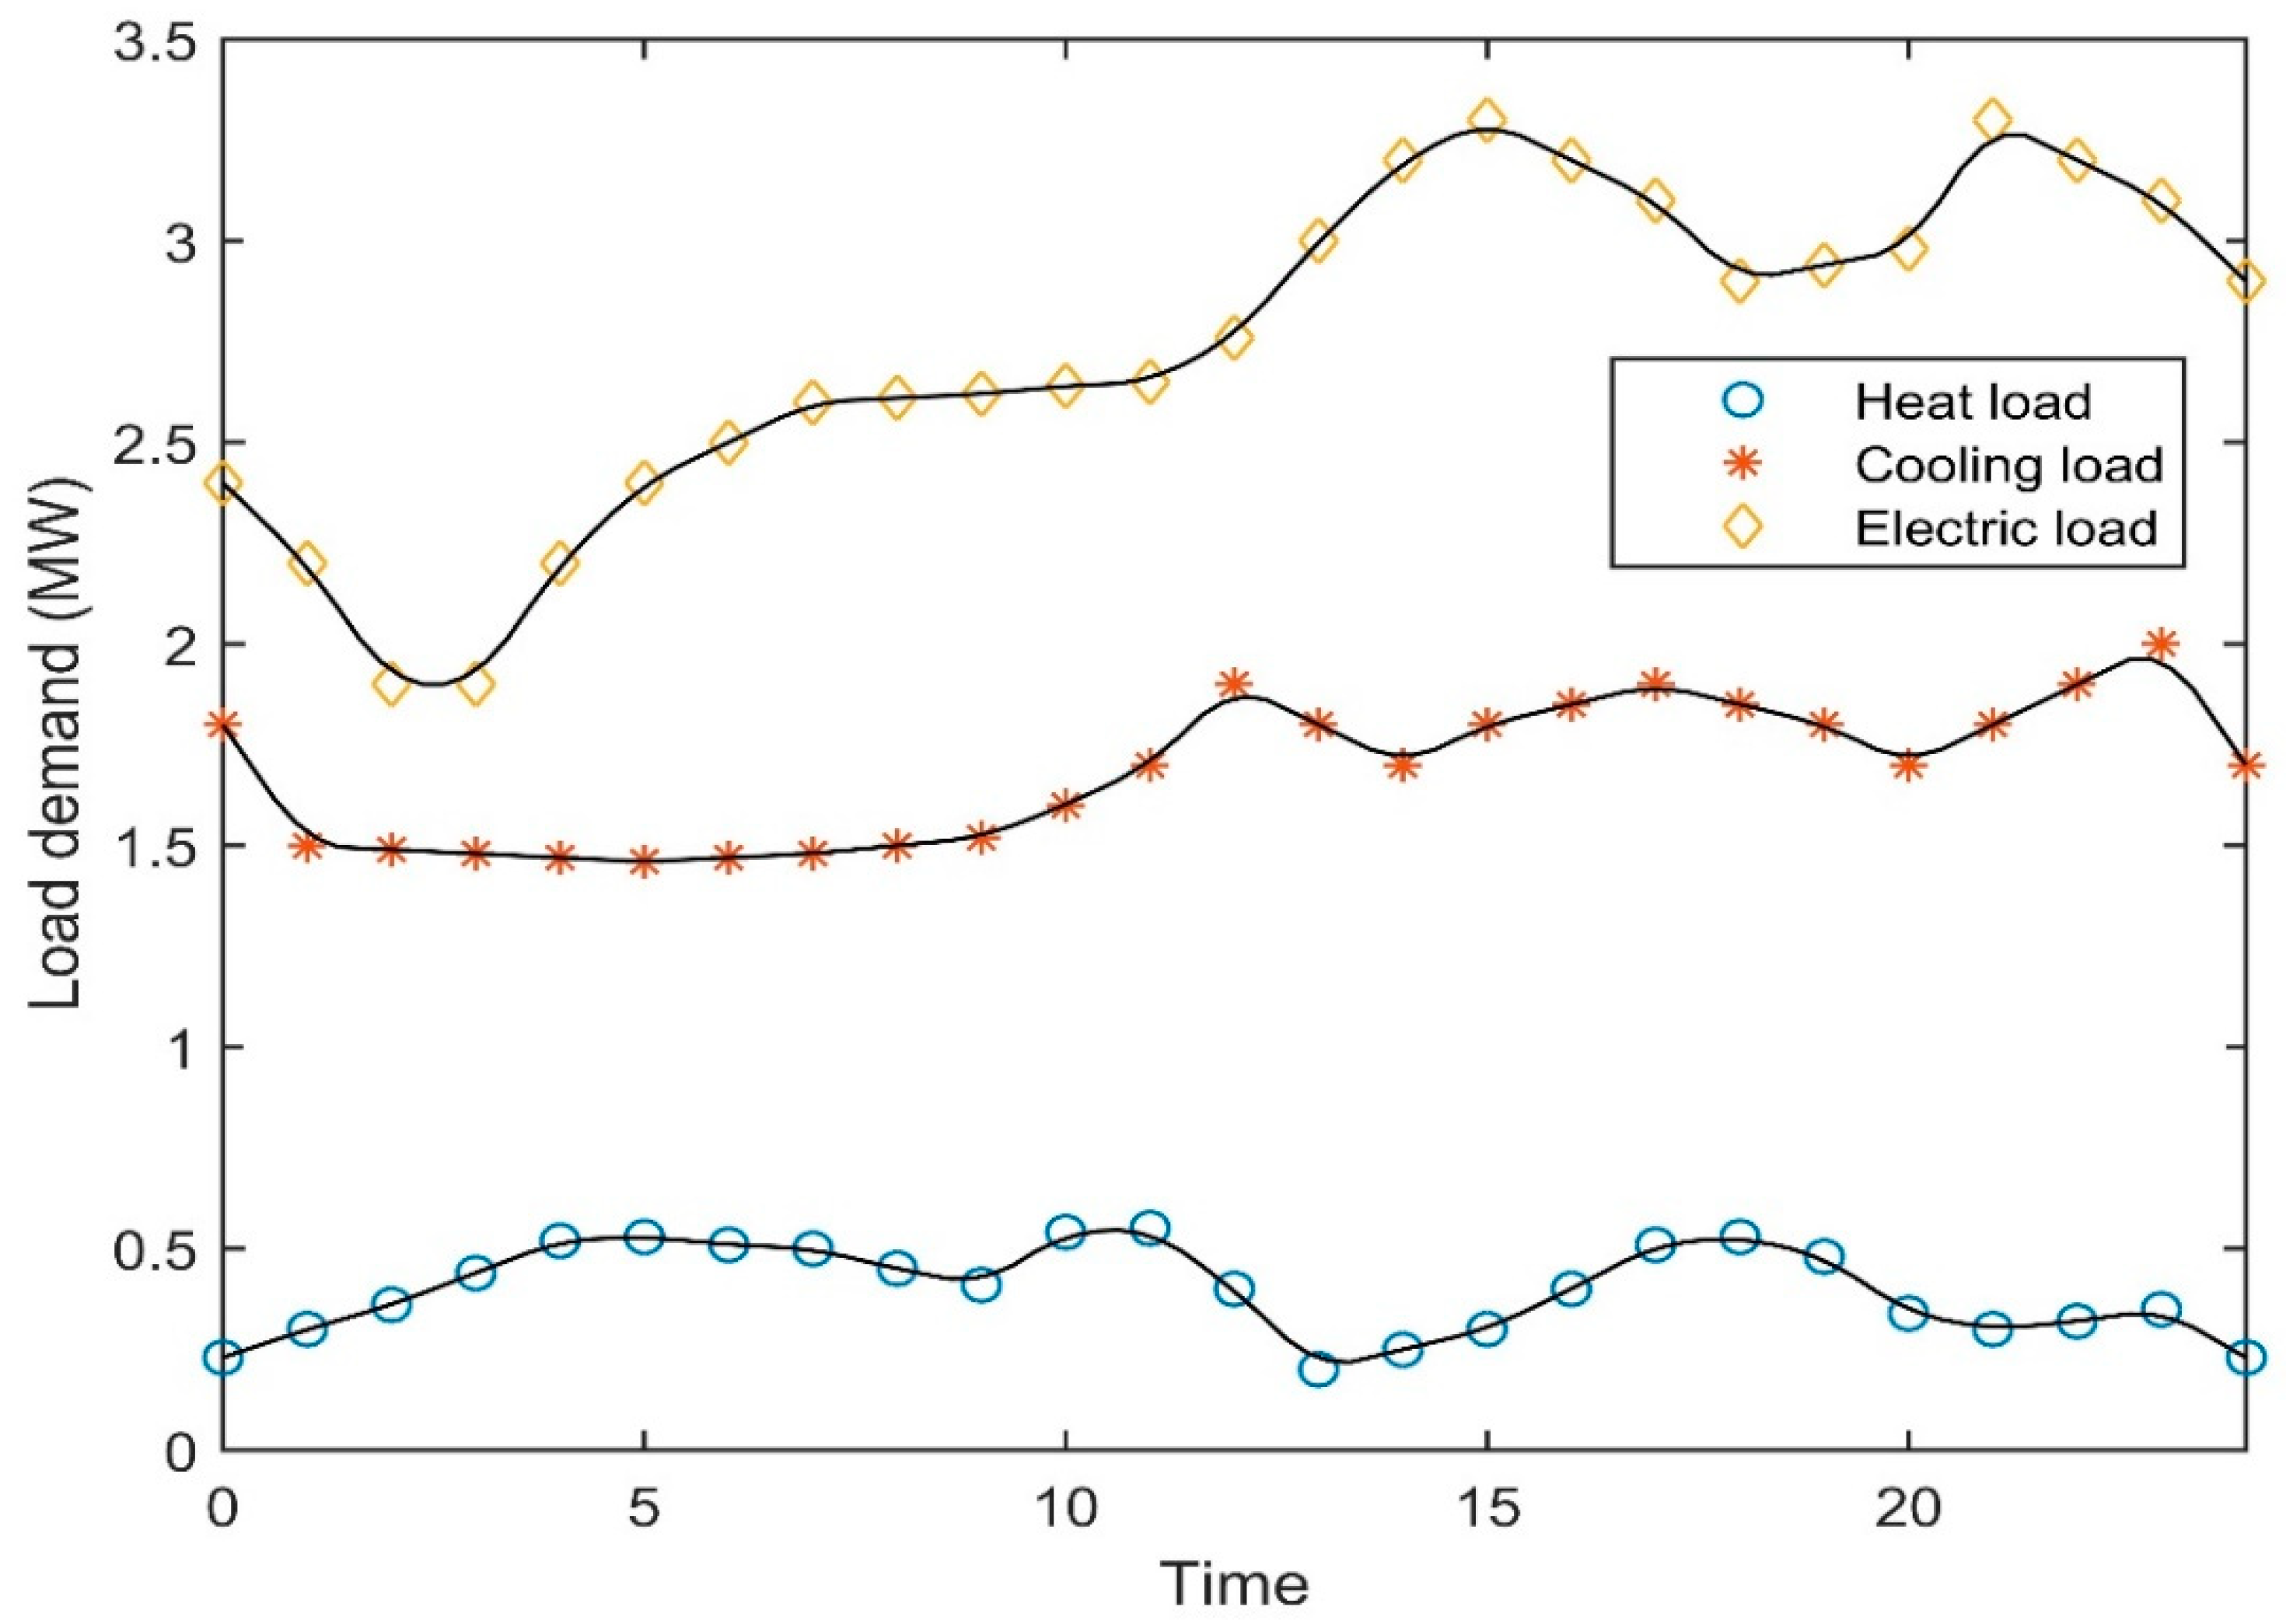
With the technology upgrading and cost decreasing of an HES, a large state-owned energy corporation is planning to invest an HES in Zhejiang Province, China. An industrial park is identified as a promising alternative, as shown in Figure 5. It is planned to be built in Jinhua city. The energy sources of this HES include solar PV, wind power, and natural gas. The daily load curve of the HES in a typical summer day is shown in Figure 6. In order to decide whether to invest or not, this corporation plans to conduct a sustainability performance evaluation on this system. A decision-making committee was established for this task, which consisted of an internal senior project manager and three external experts in the background of the HES. Their profile details are presented in Table 4. The roles of these experts are to: (1) assess the performances of the HES on these qualitative sub-criteria; (2) provide the weight judgement matrices of each criteria and sub-criterion; and (3) determine the universe of each linguistic variable rate on each criterion.
In this region, the annual average radiation intensity is 1200 W/m2, and the average wind speed is 4.7 m/s. This park covers an area of about 64,000 m2. The designed electric load is about 2.0 MW, the heat load is about 1.2 MW, and the cold load is about 1.0 MW; annual power consumption of this park is about 2120 MWh. The days of heating and cooling are 120 in every year. The relative parameters are set in Table 5.
Based on these parameters, the performances of the HES on the quantitative sub-criteria could be calculated, as shown in Table 6.
Then, the experts were asked to express their opinion on the performances of the HES on the qualitative sub-criteria, as presented in Table 7.
In order to determine the criteria weight, the judgement matrices were given by the three experts in the decision-making committee according to the form of Equatoin (7), which are as follows:
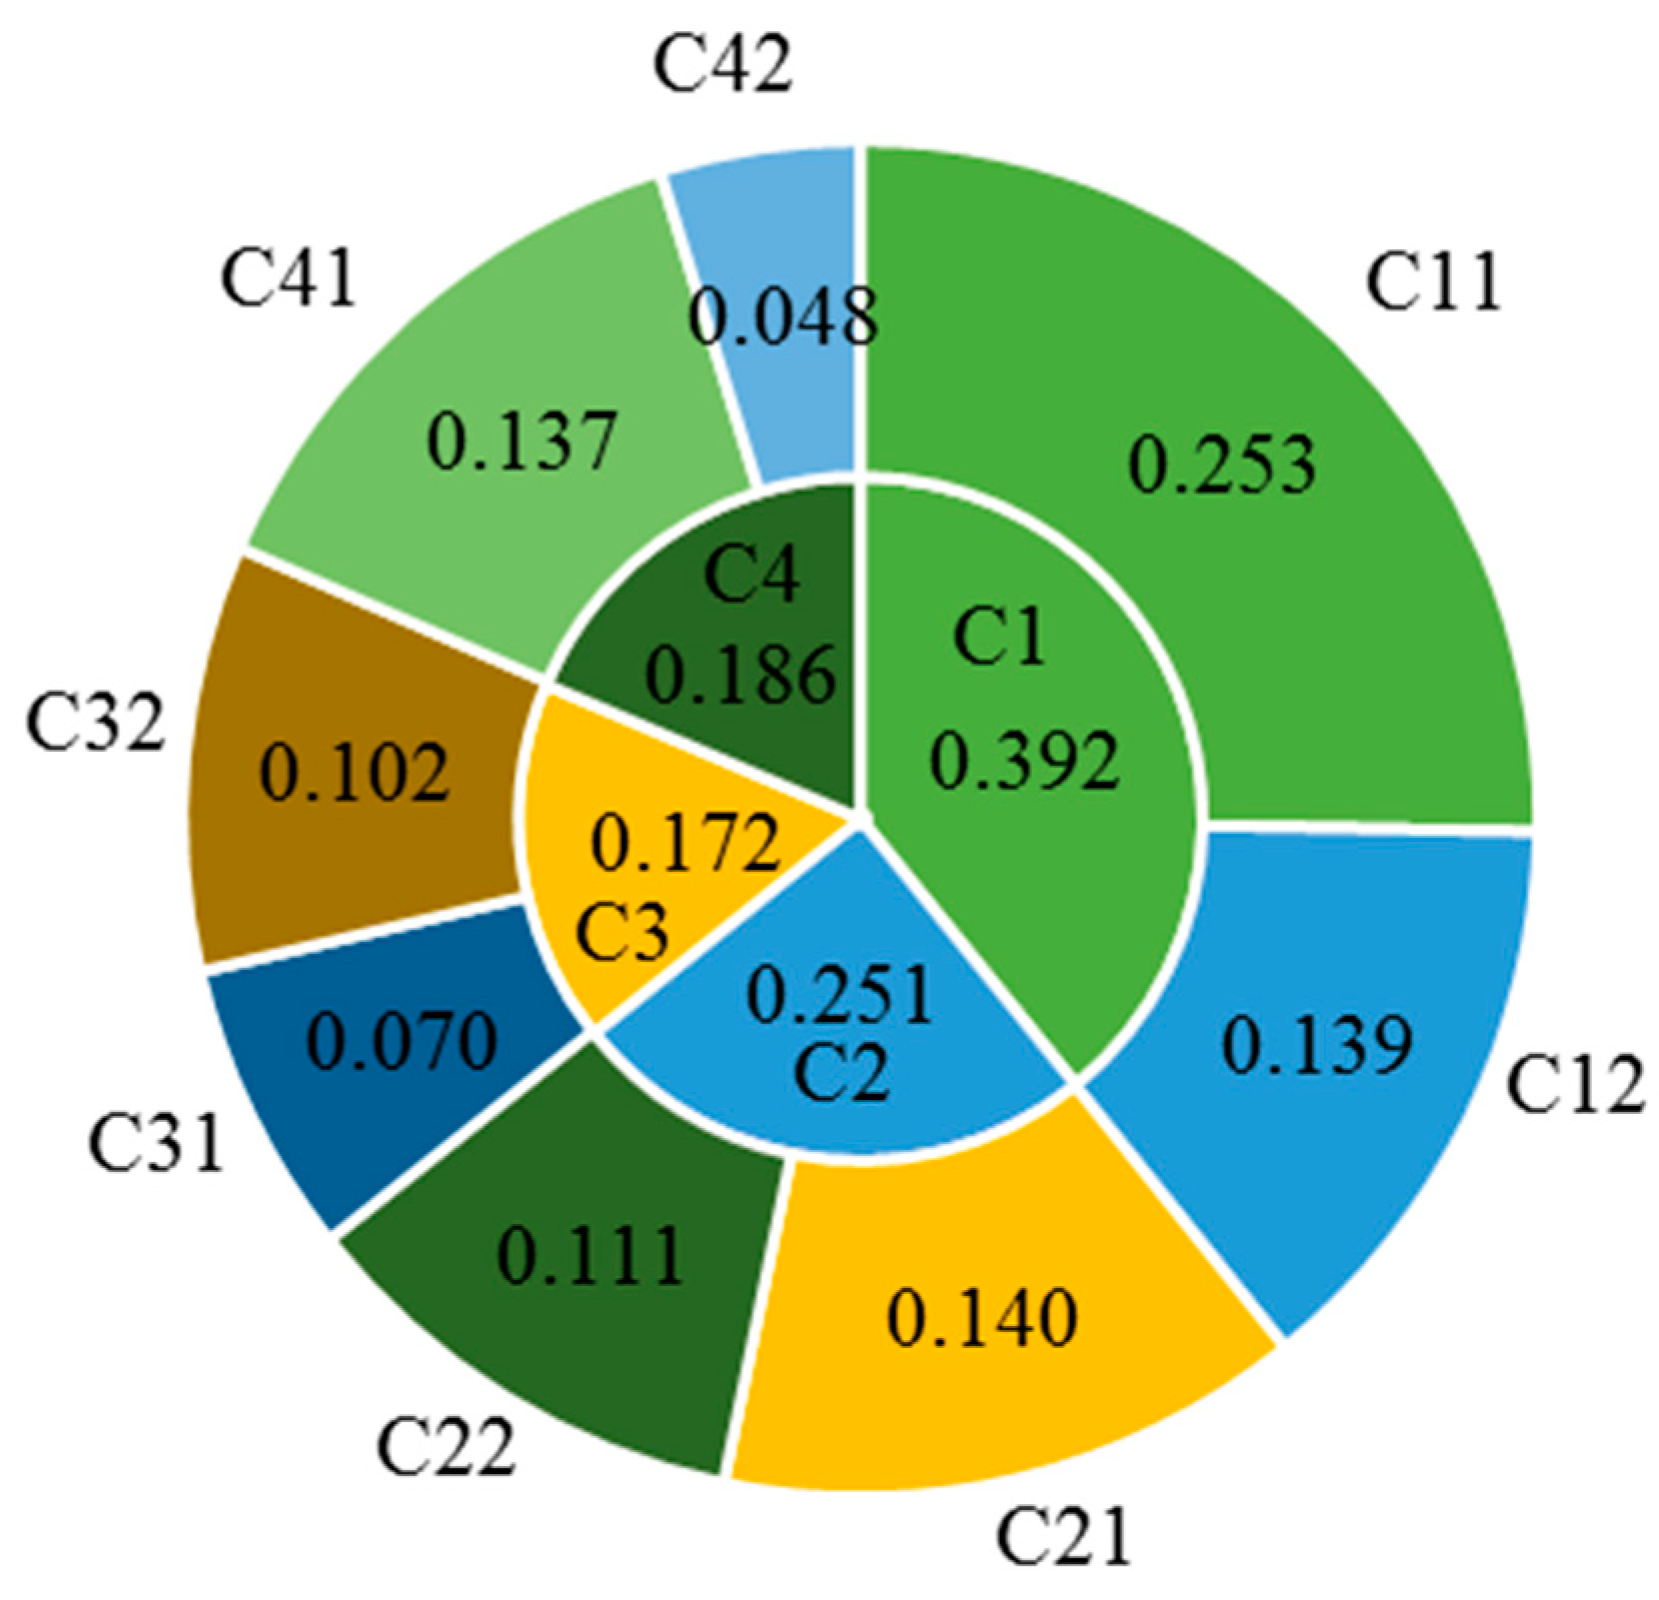
All of these judgement matrices passed the consistency test according to the Equations (8,9). Then, the criteria and sub-criteria weights were determined by using the Equations (10,11). The results are presented in Figure 7 vividly. The numbers in the outer ring of this graph are the absolute weights of the four aspects, while the numbers in the inner ring are the absolute weights of the associated eight criteria.
After that, the universe of each linguistic variable rate on these criteria was provided by these experts, as shown in Table 8.
According to the information in Table 8, the membership degree of each criterion on each linguistic variable can be calculated by using Equation (15). The results are given in Table 9.
For example, the calculation process of the membership degree of C11 for “VG” can be expressed as follows:
Ex = (0.5 + 0.7)/2 = 0.6; En = (0.7 − 0.5)/6 = 0.033; He = 0.1 (given by expert); En’– N (En, He2) = 0.624; .
The numbers in this table mean the membership degree of each criterion on each linguistic variable.
Finally, on the basis of previous criteria weights (Figure 6), the overall membership degree of this HES project on each linguistic variable can be obtained as (0.849, 0.948, 0.983, 0.957, 0.889) by Equation (14). For example, the first element “0.849: can be obtained by the average weight operation: 0.877 × 0.253 + 0.992 × 0.139 + 0.996 × 0.140 + 0.000 × 0.111 + 0.987 × 0.070 + 0.948 × 0.102 + 0.999 × 0.137 + 1.000 × 0.048. According to the principle of maximum membership degree, the overall performance of the HES is “Moderate” and shows bias towards to “Bad”.
As can be observed from the Table 9, the performance of the HES on criterion C11 “LCOE” and C22 “power supply reliability” are not good because the membership degrees of VG on C11 and C22 are relatively low. Therefore, to improve the overall performance of the HES, some measurements of these two aspects should be taken.
5. Discussion
5.1. Sensitivity Analysis
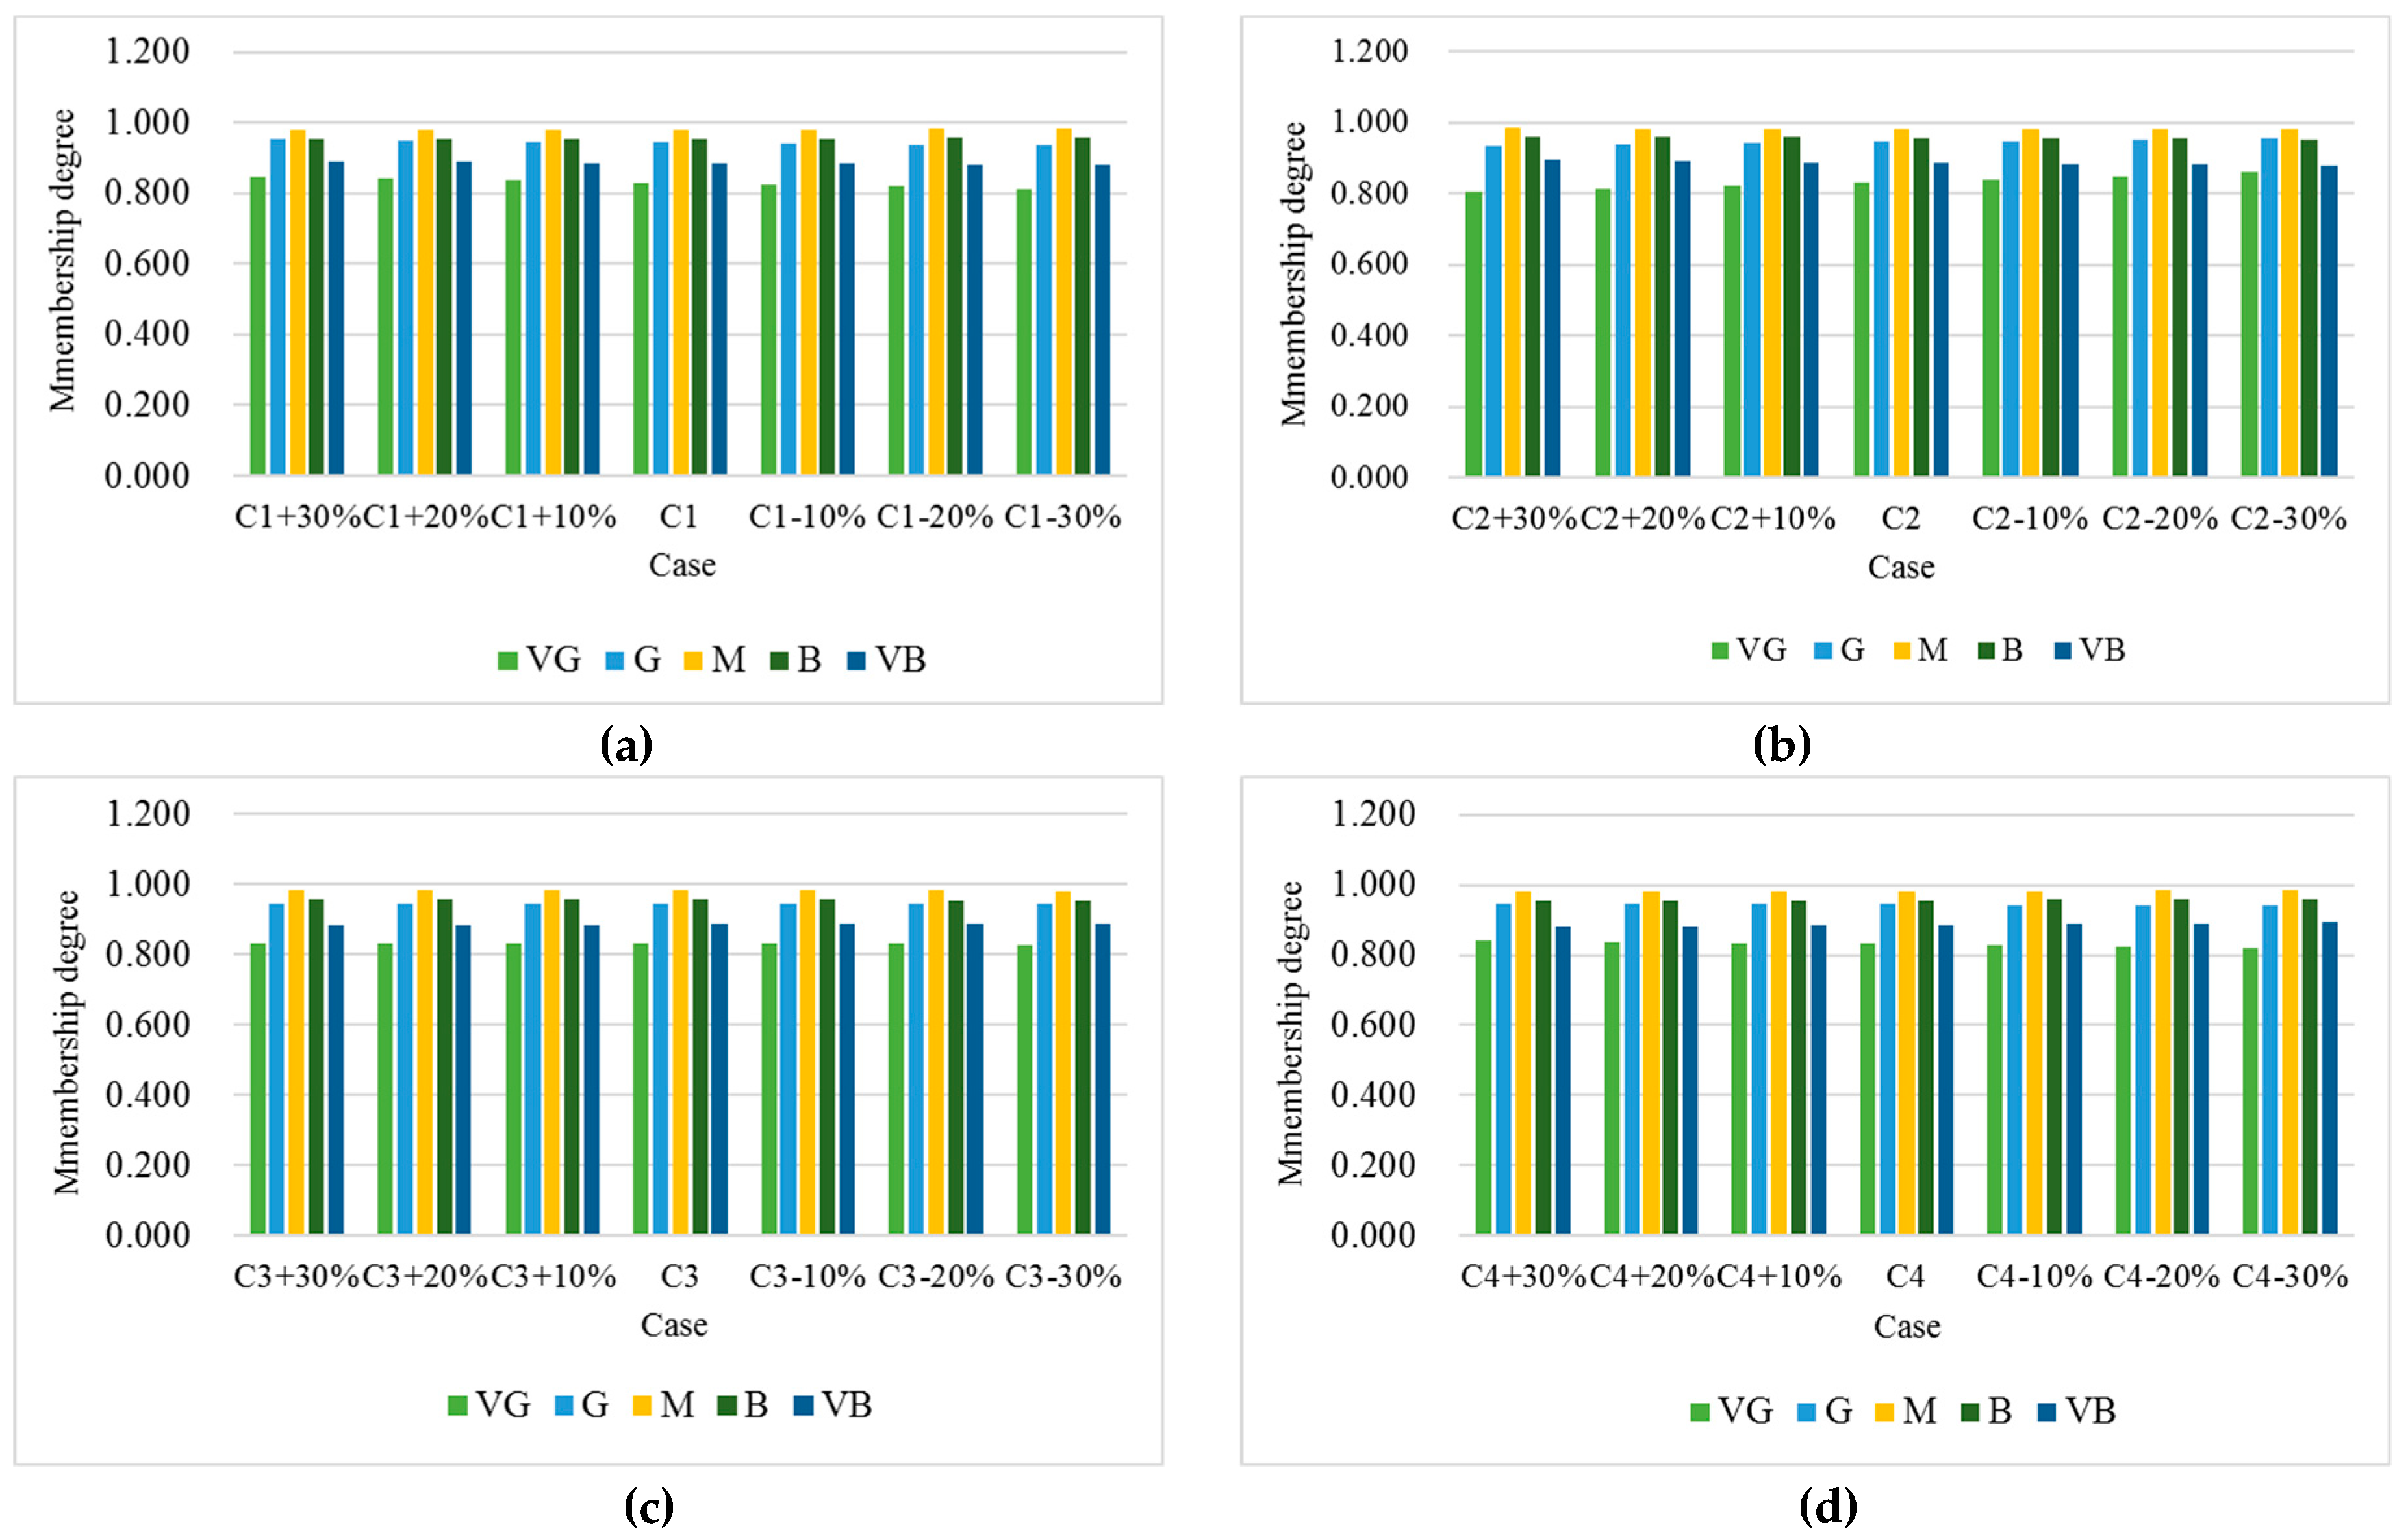
In order to test the robustness of this proposed method, a sensitivity analysis is carried out in this section. The way of sensitivity analysis is performed is by changing the criteria weight. If the result changes when a certain criterion weight fluctuates, the method is not robust. Figure 8 shows the cases where the four criteria have 10%, 20%, and 30% less weight and 10%, 20%, and 30% more weight than the base weight. The overall consequence is that the performance of the HES is always moderate, regardless of how the criteria weight change within ±30%. This means that the proposed method is more robust, and the results obtained by the proposed method are credible. However, there is no doubt that when the criteria weight change greatly (exceed ±30%), the results will change.
5.2. Comparative Analysis
In this section, a comparative analysis with traditional FSE is conducted to highlight the superiority of the proposed method. The membership degrees of each criterion on each linguistic variable are also determined by the previous experts, as shown in Table 10.
Without losing generality, the criteria weights in Figure 5 are used. Then, the output results are calculated using Equation (14) and shown as follows: (0.897, 0.936, 0.969, 0.947, 0.884).
To compare the stability of the results, the standard deviation is introduced as follows:
where is the average number.
Therefore, the standard deviation of the result obtained by traditional FSE is calculated as 0.035, while the standard deviation of the result obtained by the improved FSE is 0.058.
It can be seen that the results obtained by the traditional FSE are the same as the proposed approach. The sustainability performance of the HES is “Moderate”. Thus, the correctness of the proposed approach can be demonstrated. However, the standard deviation of the results obtained by the traditional FSE (0.035) is lower than the results obtained by the proposed approach (0.058), which mean our approach can distinguish the membership of the HES performance more clearly. Moreover, smaller standard deviation also indicates fewer stable results.
6. Conclusions
The hybrid energy system has become one a research hot spot because it can not only achieve multi-energy supply but can realize a cascade utilization of energy resources. However, a performance evaluation of an HES from the sustainability perspective are rarely studied. Therefore, this paper evaluates the performance of an HES from the sustainability perspective by using an integrated approach consisting of a GAHP and cloud-based FSE. The merit of the GAHP is that it cannot only take the preferences of experts into consideration but also avoid the prejudice of individual experts. The advantages of the cloud-based FSE over traditional FES lie in that it considers randomness of uncertainty and alleviates the decision-making stress of experts.
The integrated approach was applied to a real regional-level HES case study in Zhejiang province, China. The results showed that the criteria “levelized cost of energy” is the most important criterion with a weight of 0.253, followed by “energy utilization rate” with a weight of 0.140. Moreover, the synthesis result of the sustainability performance of this HES was calculated as (0.840, 0.948, 0.983, 0.957, 0.889). According to the principle of maximum membership degree, the overall qualitative performance of the HES was “Moderate”, and showed a trend towards to “Bad”. The followed sensitivity analysis showed that the proposed approach is robust, and the comparative analysis with the traditional FSE indicated that the proposed approach is superior. This paper can provide a reference for the investor to choose a high quality project and, at the same time, facilitate the government in taking effective measures to enhance the performance of an HES so as to attract more investors.
Although the contributions of this work are significant, some limitations still exist. First, it cannot take the criteria interaction into account. Second, the calculation process will become complex if the number of evaluation objects increases. Therefore, in the future work, it will be meaningful to introduce the group analytic network process to simulate the interaction relationship and some intelligent algorithms, such as deep learning, to undertake the calculations.
Author Contributions
L.Z. designed the framework. Z.K. collected the relative data, calculated the result, and drafted the paper. H.X. mainly studied the proposed method. Finally, H.X. formatted the manuscript for submission.
Funding
This research was funded by the National Nature Science Foundation of China (No.71271085) and the Fundamental Research Funds for the Central Universities (No. 2015XS40).
Acknowledgments
We want to thank these anonymous reviewers.
Conflicts of Interest
The authors declare no conflict of interest.
Nomenclature
| Annual value of initial investment cost | |
| Annual value of operation and maintenance costs | |
| Annual tax payable for power plants | |
| Installed capacity | |
| Annual utilization hours | |
| Self electricity consumption rate | |
| Operation life | |
| Discount rate | |
| Dynamic payback period | |
| Basic yield | |
| Energy utilization rate | |
| Electricity consumption | |
| Heat consumption | |
| Cold consumption | |
| Network loss rate | |
| Electric load demand | |
| Heat load demand | |
| Cooling load demand | |
| Actual output power for renewable energy units | |
| Electric refrigerating at the period | |
| Actual power output of CCHP with electricity at the period | |
| Actual power output of CCHP with heat at the period | |
| Actual power output of CCHP with cooling at the period | |
| Discharge power of energy storage device at the period | |
| Amount of coal consumption for power supply | |
| Amount of carbon dioxide produced by burning a ton of standard coal. | |
| Set of criteria | |
| Decision-makers | |
| Individual pairwise comparison matrix | |
| Relative importance of to | |
| Consistency index | |
| Largest eigenvalue of matrix | |
| Universe of discourse | |
| A qualitative concept in | |
| Expectation | |
| Entropy | |
| Hyper entropy |
Appendix A1

Table A1.
Pseudocodes of the group analytic hierarchy process (GAHP).
| Pseudocodes of GAHP |
|---|
| Read A |
| [m,n]←size(A); |
| RI← [0 0 0.58 0.90 1.12 1.24 1.32 1.41 1.45 1.49 1.51]; |
| R←rank(A); |
| [V,D]←eig(A); |
| tz←max(D); |
| B←max(tz); |
| [row, col] ←find(D = B); |
| C←V(:,col); |
| CI←(B-n)/(n-1); |
| CR←CI/RI(1,n); |
| If CR < 0.10 then |
| Print (‘pass consistency test’); |
| Q←zeros(n,1); |
| for i from 1 to n step 1 |
| Q(i,1)←C(i,1)/sum(C(:,1)); |
| End for |
| Print (‘Q=’, Q); |
| else |
| Print (‘fail to pass the consistency test, the A need to be reconstructed’); |
| End if |
Appendix A2
Table A2.
Pseudocodes of cloud-based fuzzy synthetic approach.
| Pseudocodes of Cloud-Based Fuzzy Synthetic Approach |
|---|
| Read B |
| [l,u]←range of (B); |
| Ex←(u+l)/2; |
| En←(u-l)/6; |
| He←0.1; |
| En’←N (En, He2); |
| U←exp((-(x-Ex)^2)/(2En’ ^2)); |
| Read W; |
| R = w* U |
References
- Javadi, M.; Marzband, M.; Akorede, M.F.; Godina, R.; Al-Sumaiti, A.S.; Pouresmaeil, E. A Centralized Smart Decision-Making Hierarchical Interactive Architecture for Multiple Home Microgrids in Retail Electricity Market. Energies 2018, 11, 3144. [Google Scholar] [CrossRef]
- Marzband, M.; Azarinejadian, F.; Savaghebi, M.; Pouresmaeil, E.; Guerrero, J.M.; Lightbody, G. Smart Transactive energy framework in grid-connected multiple home microgrids under independent and coalition operations. Renew. Energy 2018, 126, 95–106. [Google Scholar] [CrossRef]
- Valinejad, J.; Barforoshi, T.; Marzband, M.; Pouresmaeil, E.; Godina, R.; Catalão, J.P.S. Investment Incentives in Competitive Electricity Markets. Appl. Sci. 2018, 8, 1978. [Google Scholar] [CrossRef]
- Vivas, F.; De las Heras, A.; Segura, F.; Andújar, J. A review of energy management strategies for renewable hybrid energy systems with hydrogen backup. Renew. Sustain. Energy Rev. 2018, 82, 126–155. [Google Scholar] [CrossRef]
- U.S. Energy Information Administration. Draft Standards for Interconnection between Distributed Generators and Power Systems. Available online: https://www.eia.gov/ (accessed on 25 February 2019).
- Zhang, W.; Maleki, A.; Rosen, M.A.; Liu, J. Optimization with a simulated annealing algorithm of a hybrid system for renewable energy including battery and hydrogen storage. Energy 2018, 163, 191–207. [Google Scholar] [CrossRef]
- International Energy Agency. Technical Guidelines for Grid Connection Requirements. Available online: https://www.iea.org/ (accessed on 25 February 2019).
- National Energy Administration of China. 13th Five-Year Plan for Energy Development. Available online: http://www.nea.gov.cn/ (accessed on 25 February 2019).
- Network, P.P. Ten Project Cases Show You the Benefits of Hybrid Energy Systems. Available online: http://news.bjx.com.cn/html/20181129/945305.shtml (accessed on 25 February 2019).
- Ma, W.; Xue, X.; Liu, G. Techno-economic evaluation for hybrid renewable energy system: Application and merits. Energy 2018, 15, 385–409. [Google Scholar] [CrossRef]
- Wu, Y.; Xu, C.; Zhang, T. Evaluation of renewable power sources using a fuzzy MCDM based on cumulative prospect theory: A case in China. Energy 2018, 147, 1227–1239. [Google Scholar] [CrossRef]
- Khosravi, A.; Koury, R.; Machado, L.; Pabon, J. Energy, exergy and economic analysis of a hybrid renewable energy with hydrogen storage system. Energy 2018, 148, 1087–1102. [Google Scholar] [CrossRef]
- Li, D.; Xuan, Y.; Li, Q.; Hong, H. Exergy and energy analysis of photovoltaic-thermoelectric hybrid systems. Energy 2017, 126, 343–351. [Google Scholar] [CrossRef]
- Sahoo, U.; Kumar, R.; Singh, S.; Tripathi, A. Energy, exergy, economic analysis and optimization of polygeneration hybrid solar-biomass system. Appl. Therm. Eng. 2018, 145, 685–692. [Google Scholar] [CrossRef]
- Yildirim, N.; Bilir, L. Evaluation of a hybrid system for a nearly zero energy greenhouse. Energy Convers. Manag. 2017, 148, 1278–1290. [Google Scholar] [CrossRef]
- Kalinci, Y.; Dincer, I.; Hepbasli, A. Energy and exergy analyses of a hybrid hydrogen energy system: A case study for Bozcaada. Int. J. Hydrog. Energy 2017, 42, 2492–2503. [Google Scholar] [CrossRef]
- Guo, S.; Zhao, H. Optimal site selection of electric vehicle charging station by using fuzzy TOPSIS based on sustainability perspective. Appl. Energy 2015, 158, 390–402. [Google Scholar] [CrossRef]
- Zhao, H.; Guo, S.; Zhao, H. Comprehensive Performance Assessment on Various Battery Energy Storage Systems. Energies 2018, 11, 2841. [Google Scholar] [CrossRef]
- You, P.; Guo, S.; Zhao, H.; Zhao, H. Operation Performance Evaluation of Power Grid Enterprise Using a Hybrid BWM-TOPSIS Method. Sustainability 2017, 9, 2329. [Google Scholar] [CrossRef]
- Valinejad, J.; Marzband, M.; Akorede, M.F.; Elliott, I.D.; Godina, R.; Matias, J.C.d.O.; Pouresmaeil, E. Long-Term Decision on Wind Investment with Considering Different Load Ranges of Power Plant for Sustainable Electricity Energy Market. Sustainability 2018, 10, 3811. [Google Scholar] [CrossRef]
- Wu, Y.; Xu, C.; Xu, H. Optimal site selection of tidal power plants using a novel method: A case in China. Energies 2016, 9, 832. [Google Scholar] [CrossRef]
- Zadeh, L.A. Fuzzy sets. Inf. Control 1965, 8, 338–353. [Google Scholar] [CrossRef] [Green Version]
- Wu, Y.; Song, Z.; Li, L.; Xu, R. Risk management of public-private partnership charging infrastructure projects in China based on a three-dimension framework. Energy 2018, 165, 1089–1101. [Google Scholar] [CrossRef]
- Solangi, Y.; Tan, Q.; Khan, M.; Mirjat, N.; Ahmed, I. The Selection of Wind Power Project Location in the Southeastern Corridor of Pakistan: A Factor Analysis, AHP, and Fuzzy-TOPSIS Application. Energies 2018, 11, 1940. [Google Scholar] [CrossRef]
- Dong, J.; Li, R.; Huang, H. Performance evaluation of residential demand response based on a modified fuzzy VIKOR and scalable computing method. Energies 2018, 11, 1097. [Google Scholar] [CrossRef]
- Wu, Y.; Xu, C.; Ke, Y.; Chen, K.; Sun, X. An intuitionistic fuzzy multi-criteria framework for large-scale rooftop PV project portfolio selection: Case study in Zhejiang, China. Energy 2018, 143, 295–309. [Google Scholar] [CrossRef]
- Wu, Y.; Zhou, J.; Hu, Y.; Li, L.; Sun, X. A TODIM-Based Investment Decision Framework for Commercial Distributed PV Projects under the Energy Performance Contracting (EPC) Business Model: A Case in East-Central China. Energies 2018, 11, 1210. [Google Scholar] [CrossRef]
- Tseng, M.-L.; Wu, K.-J.; Ma, L.; Kuo, T.C.; Sai, F. A hierarchical framework for assessing corporate sustainability performance using a hybrid fuzzy synthetic method-DEMATEL. Technol. Forecast. Soc. Chang. 2017. [Google Scholar] [CrossRef]
- Wang, Q.; Han, R.; Huang, Q.; Hao, J.; Lv, N.; Li, T.; Tang, B. Research on energy conservation and emissions reduction based on AHP-fuzzy synthetic evaluation model: A case study of tobacco enterprises. J. Clean. Prod. 2018, 201, 88–97. [Google Scholar] [CrossRef]
- Wu, Y.; Li, L.; Xu, R.; Chen, K.; Hu, Y.; Lin, X. Risk assessment in straw-based power generation public-private partnership projects in China: A fuzzy synthetic evaluation analysis. J. Clean. Prod. 2017, 161, 977–990. [Google Scholar] [CrossRef]
- Wu, Y.; Xu, C.; Li, L.; Wang, Y.; Chen, K.; Xu, R. A risk assessment framework of PPP waste-to-energy incineration projects in China under 2-dimension linguistic environment. J. Clean. Prod. 2018, 183, 602–617. [Google Scholar] [CrossRef]
- Deyi, L.; Haijun, M.; Xuemei, S. Membership clouds and membership cloud generators. J. Comput. Res. Dev. 1995, 6, 15–20. [Google Scholar]
- Wu, Y.; Chen, K.; Zeng, B.; Yang, M.; Geng, S. Cloud-based decision framework for waste-to-energy plant site selection—A case study from China. Waste Manag. 2016, 48, 593–603. [Google Scholar] [CrossRef] [PubMed]
- Zhang, L.; Xin, H.; Yong, H.; Kan, Z. Renewable energy project performance evaluation using a hybrid multi-criteria decision-making approach: Case study in Fujian, China. J. Clean. Prod. 2019, 206, 1123–1137. [Google Scholar] [CrossRef]
- Wu, Y.; Xu, C.; Ke, Y.; Li, X.; Li, L. Portfolio selection of distributed energy generation projects considering uncertainty and project interaction under different enterprise strategic scenarios. Appl. Energy 2019, 236, 444–464. [Google Scholar] [CrossRef]
- Haddad, B.; Liazid, A.; Ferreira, P. A multi-criteria approach to rank renewables for the Algerian electricity system. Renew. Energy 2017, 107, 462–472. [Google Scholar] [CrossRef]
- Zhang, S.; Lu, S. Evaluation Method of Park-Level Integrated Energy System for Microgrid. Power Syst. Technol. 2018, 42, 1–7. [Google Scholar]
- Michailidis, I.T.; Baldi, S.; Pichler, M.F.; Kosmatopoulos, E.B.; Santiago, J.R. Proactive control for solar energy exploitation: A german high-inertia building case study. Appl. Energy 2015, 155, 409–420. [Google Scholar] [CrossRef] [Green Version]
- Zhao, J.; Liu, X. A hybrid method of dynamic cooling and heating load forecasting for office buildings based on artificial intelligence and regression analysis. Energy Build. 2018, 174, 293–308. [Google Scholar] [CrossRef]
- Saloux, E.; Candanedo, J.A. Forecasting District Heating Demand using Machine Learning Algorithms. Energy Procedia 2018, 149, 59–68. [Google Scholar] [CrossRef]
- Al Garni, H.; Kassem, A.; Awasthi, A.; Komljenovic, D.; Al-Haddad, K. A multicriteria decision making approach for evaluating renewable power generation sources in Saudi Arabia. Sustain. Energy Technol. Assess. 2016, 16, 137–150. [Google Scholar] [CrossRef]
- Wu, Y.; Ke, Y.; Zhang, T.; Liu, F.; Wang, J. Performance efficiency assessment of photovoltaic poverty alleviation projects in China: A three-phase data envelopment analysis model. Energy 2018, 159, 599–610. [Google Scholar] [CrossRef]
- Malkawi, S.; Azizi, D. A multi-criteria optimization analysis for Jordan’s energy mix. Energy 2017, 127, 680–696. [Google Scholar] [CrossRef]
- Saaty, T. The analytic hierarchy process. Eur. J. Oper. Res. 1990, 48, 9–26. [Google Scholar] [CrossRef]
- Nassereddine, M.; Eskandari, H. An integrated MCDM approach to evaluate public transportation systems in Tehran. Transp. Res. Part A Policy Pract. 2017, 106, 427–439. [Google Scholar] [CrossRef]
- Li, D.; Liu, C.; Gan, W. A new cognitive model: Cloud model. Int. J. Intell. Syst. 2010, 24, 357–375. [Google Scholar] [CrossRef]
- Yang, X.; Yan, L.; Zeng, L. How to handle uncertainties in AHP: The Cloud Delphi hierarchical analysis. Inf. Sci. 2013, 222, 384–404. [Google Scholar] [CrossRef]
- Mao, M.; Peng, J.; Hatziargyriou, N.D.; Chang, L. Multiagent-Based Hybrid Energy Management System for Microgrids. IEEE Trans. Sustain. Energy 2017, 5, 938–946. [Google Scholar] [CrossRef]
- Nema, P.; Nema, R.K.; Rangnekar, S. A current and future state of art development of hybrid energy system using wind and PV-solar: A review. Renew. Sustain. Energy Rev. 2009, 13, 2096–2103. [Google Scholar] [CrossRef]
Figure 1.
Diagram of regional-level HES [8].
Figure 1.
Diagram of regional-level HES [8].

Figure 2.
Evaluation criteria system for sustainability performance evaluation of an HES.

Figure 3.
Cloud (20,1,0.1).

Figure 4.
The membership function in fuzzy synthetic evaluation (FSE) (top figure) and cloud model (bottom figure).
Figure 4.
The membership function in fuzzy synthetic evaluation (FSE) (top figure) and cloud model (bottom figure).

Figure 5.
Map of the industrial park.

Figure 6.
Daily load curve of the HES in a typical summer day.

Figure 7.
Results of criteria weights.

Figure 8.
Results of sensitivity analysis. Note: (a): case of C1 weight changes; (b): case of C2 weight changes; (c): case of C3 weight changes; (d): case of C4 weight changes.
Figure 8.
Results of sensitivity analysis. Note: (a): case of C1 weight changes; (b): case of C2 weight changes; (c): case of C3 weight changes; (d): case of C4 weight changes.

Table 1.
Basic information of several demonstration hybrid energy system (HES) projects [9].
Table 1.
Basic information of several demonstration hybrid energy system (HES) projects [9].
| No. | Project name | Location | Energy Considered | Description |
|---|---|---|---|---|
| 1 | North Park HSE of State Grid Customer Service Center | Tianjin | Solar PV, geothermal and air thermal energy | The annual cumulative electricity saving is about 11.02 million kWh, and the annual electricity saving cost totals 9.877 million yuan. It is estimated that 70.786 million yuan will be saved by 2022. |
| 2 | Beichen Business Center HES | Tianjin | Solar PV, wind power, wind and solar storage microgrid, ground source heat pump, and electric vehicle charging pile | The energy efficiency ratio of the project is 2.38, and the energy utilization efficiency is increased by 19%. The total investment cost is expected to be recovered in less than 7 years. |
| 3 | Zhuzhou Railway Zhigu Park HES | Hunan | Natural gas, centrifugal chiller, air source heat pump, roof PV, landscape wind power, charging pile, and supporting energy storage | The total investment of the park is 1.2 billion yuan, about 0.17 billion yuan of which is the total investment in construction. |
| 4 | Guangzhou Development Zone HES | Guangdong | Solar PV, geothermal, hydrogen, and electric vehicle | The total output value of the project is expected to exceed 100 billion yuan by 2020. |
| 5 | Songshan Lake HES | Guangdong | Natural gas, solar PV, wind power | The average power outage time of users is less than 50 minutes, the proportion of clean energy power generation exceeds 13%, and the energy consumption per unit GDP is less than 0.149 tons of standard coal/10,000 yuan. |
| 6 | Red Bean Industrial Park HES | Jiangsu | Thermal power, distributed PV and energy storage system | The annual energy saving of the project can reach 21.14 million kWh, which is equivalent to 7364 tons of standard coal and 19,000 tons of carbon dioxide emission reduction. The total investment of the project is about 14 million yuan, which is expected to be recovered in 3.5 years. |
Table 2.
Nine-point intensity of importance scale and its description.
| Definition | Scale |
|---|---|
| Equally important | 1 |
| Slightly more important | 3 |
| More Important | 5 |
| Strongly more important | 7 |
| Extremely more important | 9 |
| Intermediate values | 2, 4, 6, 8 |
Table 3.
RI standard value of mean random consistency index.
| Order | 1 | 2 | 3 | 4 | 5 | 6 | 7 | 8 | 9 | 10 |
|---|---|---|---|---|---|---|---|---|---|---|
| RI | 0 | 0 | 0.58 | 0.9 | 1.12 | 1.24 | 1.32 | 1.41 | 1.45 | 1.49 |
Table 4.
The profile details of internal senior project manager and external experts.
| Identity | Major | Title | Work Time | Organization |
|---|---|---|---|---|
| Senior project manager | HES management | Master | 12 year | X state-owned energy corporation |
| Expert I | HES management | PhD. | 7 year | Tsinghua University |
| Expert II | HES management | PhD. | 6 year | North China Electric Power University |
| Expert III | HES management | PhD. | 6 year | Economic Research Institute of State Grid |
Table 5.
Relative parameters of the HES.
| Parameter | Value | Parameter | Value |
|---|---|---|---|
| Unit investment cost (Yuan/kW) | 3000 [48] | Gas price (Yuan/m3) | 2.5 |
| Self-financing rate (%) | 20 | Feed-in tariffs (Yuan/kWh) | 0.64 [49] |
| Loan term (year) | 10 | Value added tax rate (%) | 17 |
| Annual interest rate (%) | 6 | Income tax rate (%) | 25 |
| Operating life (year) | 20 [49] | Overhaul fee rate (%) | 2 |
| Residual value of assets (%) | 5 [48] | Insurance rate (%) | 0.25 |
| Discount rate (%) | 8 | Labor cost (yuan/year) | 80,000 |
| Depreciation rate (%) | 5 | Loss rate of net (%) | 5 |
| Internal rate of return on capital (%) | 8 | Energy efficiency ratio (%) | 3 |
| Gas consumption for power generation (m3/kWh) | 0.2 | Amount of coal consumption for power supply (g/kWh) | 335 |
| Self-electricity use rate (%) | 40 | Amount of carbon dioxide produced by burning a ton of standard coal (t) | 2.62 |
| Cost of pollution control (Yuan/kWh) | 0.006 |
Table 6.
Performances of the HES on the quantitative sub-criteria.
| Sub-Criteria | Value |
|---|---|
| LCOE (C11) | 0.92 yuan/kWh |
| Dynamic payback period (C12) | 5.7 year |
| Energy utilization rate (C21) | 66.37% |
| Power supply reliability (C22) | 0.601 |
| Land occupation (C31) | 64,000 m2 |
| GHG emission (C32) | 22,172 t/year |
Table 7.
Performances of the HES on the qualitative sub-criteria.
| Sub-Criteria | Expert I | Expert II | Expert III | Mean Score |
|---|---|---|---|---|
| Poverty alleviation (C41) | 95 | 90 | 90 | 91.667 |
| Acceptance of residents (C42) | 95 | 90 | 95 | 93.333 |
Table 8.
Universe of each linguistic variable rate on each criterion.
| Sub-criteria | VG | G | M | B | VB |
|---|---|---|---|---|---|
| C11 | (0.5,0.7] | (0.7,0.9] | (0.9,1.1] | (1.1,1.3] | (1.3,1.5] |
| C12 | (4,6] | (6,8] | (8,10] | (10,12] | (12,14] |
| C21 | (70,75] | (65,70] | (60,65] | (55,60] | (50,55] |
| C22 | (0,0.2] | (0.2,0.4] | (0.4,0.6] | (0.6,0.8] | (0.8,1] |
| C31 | (5 × 10⁴, 6 × 10⁴] | (6 × 10⁴, 7 × 10⁴] | (7 × 10⁴, 8 × 10⁴] | (8 × 10⁴, 9 × 10⁴] | (9 × 10⁴, 1 × 10⁵] |
| C32 | (3 × 10⁴, 3.5 × 10⁴] | (2.5 × 10⁴, 3 × 10⁴] | (2 × 10⁴, 2.5 × 10⁴] | (1.5 × 10⁴, 2 × 10⁴] | (1 × 10⁴, 1.5 × 10⁴] |
| C41 | (90,100] | (80,90] | (70,80] | (60,70] | (50,60] |
| C42 | (90,100] | (80,90] | (70,80] | (60,70] | (50,60] |
Table 9.
Membership degree of each criterion on each linguistic variable.
| Sub-Criteria | VG | G | M | B | VB |
|---|---|---|---|---|---|
| C11 | 0.877 | 0.989 | 0.997 | 0.973 | 0.943 |
| C12 | 0.992 | 0.985 | 0.941 | 0.895 | 0.845 |
| C21 | 0.996 | 1.000 | 0.998 | 0.988 | 0.965 |
| C22 | 0.000 | 0.625 | 0.977 | 0.990 | 0.946 |
| C31 | 0.987 | 1.000 | 0.989 | 0.972 | 0.949 |
| C32 | 0.948 | 0.980 | 1.000 | 0.970 | 0.717 |
| C41 | 0.999 | 0.997 | 0.978 | 0.917 | 0.809 |
| C42 | 1.000 | 0.995 | 0.970 | 0.903 | 0.767 |
Table 10.
Membership degrees of each criterion on each linguistic variable determined by experts.
| Sub-Criteria | VG | G | M | B | VB |
|---|---|---|---|---|---|
| C11 | 0.90 | 0.95 | 1.00 | 0.95 | 0.90 |
| C12 | 1.00 | 0.95 | 0.95 | 0.90 | 0.85 |
| C21 | 0.95 | 1.00 | 0.95 | 0.95 | 0.90 |
| C22 | 0.50 | 0.70 | 0.95 | 1.00 | 0.95 |
| C31 | 0.95 | 1.00 | 0.95 | 0.95 | 0.90 |
| C32 | 0.95 | 0.95 | 1.00 | 0.95 | 0.80 |
| C41 | 1.00 | 1.00 | 0.95 | 0.95 | 0.90 |
| C42 | 1.00 | 0.95 | 0.95 | 0.90 | 0.80 |
© 2019 by the authors. Licensee MDPI, Basel, Switzerland. This article is an open access article distributed under the terms and conditions of the Creative Commons Attribution (CC BY) license (http://creativecommons.org/licenses/by/4.0/).
Share and Cite
MDPI and ACS Style
Zhang, L.; Xin, H.; Kan, Z. Sustainability Performance Evaluation of Hybrid Energy System Using an Improved Fuzzy Synthetic Evaluation Approach. Sustainability 2019, 11, 1265. https://0-doi-org.brum.beds.ac.uk/10.3390/su11051265
AMA Style
Zhang L, Xin H, Kan Z. Sustainability Performance Evaluation of Hybrid Energy System Using an Improved Fuzzy Synthetic Evaluation Approach. Sustainability. 2019; 11(5):1265. https://0-doi-org.brum.beds.ac.uk/10.3390/su11051265
Chicago/Turabian StyleZhang, Lihui, He Xin, and Zhinan Kan. 2019. "Sustainability Performance Evaluation of Hybrid Energy System Using an Improved Fuzzy Synthetic Evaluation Approach" Sustainability 11, no. 5: 1265. https://0-doi-org.brum.beds.ac.uk/10.3390/su11051265
Note that from the first issue of 2016, this journal uses article numbers instead of page numbers. See further details here.