Article

Methane Production from Alginate-Extracted and Non-Extracted Waste of Laminaria japonica: Anaerobic Mono- and Synergetic Co-Digestion Effects on Yield

1
College of Agricultural Engineering, Hohai University, Nanjing 210098, China
2
Key Laboratory of Efficient Irrigation-Drainage and Agricultural Soil-water Environment in Southern China, Ministry of Education, Nanjing 210098, China
3
Department of Agricultural Engineering, Faculty of Agricultural Sciences, University of Dongola, Elsilaim, Dongola P.O. Box 47, Sudan
4
Nanjing Institute of Industry and Technology, Nanjing 210023, China
5
Agricultural Biomass Conversion Lab, Circular Agriculture Research Center, Jiangsu Academy of Agricultural Sciences, Nanjing 210014, China
*
Authors to whom correspondence should be addressed.
Sustainability 2019, 11(5), 1269; https://0-doi-org.brum.beds.ac.uk/10.3390/su11051269
Submission received: 3 January 2019 / Revised: 20 February 2019 / Accepted: 22 February 2019 / Published: 27 February 2019
(This article belongs to the Special Issue Sustainable Energy and Biorefineries from Biowastes)

Abstract

:
This study investigated the potentiality of methane production from alginate-extracted (AEWLJ) and non-extracted (NAEWLJ) waste of Laminaria japonica through batch anaerobic fermentation in mono- and co-digestion with rice straw (RS) at different mixing ratios. Optimal C/N ratio was demonstrated, and system stability was monitored in terms of the total ammonia nitrogen, total volatile fatty acids, and pH throughout the digestion period. The results show that the combination of AEWLJ/RS at 67% mixing ratio generated the highest biogas yield of 247 NmL/gVS, which was 36% higher than the AEWLJ alone. The synergetic effect was clearly observed leading to an increase in the total methane yield up to 78% and 88%, respectively, for arrays of AEWLJ/RS and NAEWLJ/RS. The kinetic model showed a high coefficient of determination (R2 ≥ 0.9803) when the modified Gompertz model was applied to predict methane production. These outcomes support the possibility of an integrated biorefinery approach to attain value-added products in order to achieve circular economies.

1. Introduction

Due to continuous huge demand for energy, which is largely hindered by depleted fossil fuel resources, there is growing concern about alternative environmentally-sound energy for the future [1,2]. Among all the renewable energy resources, biomass energy is considered the most prosperous, due to its worldwide availability. Furthermore, biomass is the only renewable carbon source that can be directly transformed into gas and liquid fuels, which can be utilized or transferred elsewhere [3,4]. Clean and efficient utilization of biomass resources has caught wide attention, particularly with the intensive use of conventional energy, and environmental deterioration and climate change [2,4,5,6,7,8].
It worth noting that about 50% of annual global biomass is supplied by the aquatic environment [9]. As aquatic biomass, macroalgae have characteristics of merit compared with terrestrial plants, as due to their low lignin content on average, the cell walls constituents of most macroalgae species comparably are more easily accessible by microbial cultures during the biofuel production process. Moreover, macroalgae have high productivity rates and they do not compete with cropland nor freshwater [10,11,12,13,14]. In addition to their promising advantages in the bioenergy field, there are numerous valuable uses for macroalgae in many other areas such as food, medicine, pharmaceuticals, and extraction technology [15]. Regarding biogas production feasibility, it was demonstrated that the cost for aquatic crop usage is high, which could be decreased through high-value co-product strategy, pushing towards an integrated biorefinery approach [16]. According to Lewis and McCourt [17], and Kim [18], macroalgae can be categorized into three main classes—Chlorophyta (green algae), Rhodophyta (red algae), and Phaeophyceae (brown algae). Kelp (Laminaria japonica) is a known biopolymer of the brown macroalgae species which is extensively utilized as a subsidiary food; fertilizer; and in medical, chemical, and biological industries [19]. It consists of many essential compositions such as alginate, mannitol, and iodine [20].
Alginate produced from kelp has been intensively required worldwide and technically applied as a shear-thinning viscosifyer in textile printing [21]. Although alginate has many common uses (e.g., in food and pharmaceutical applications), the alginate produced by kelp cultivates in China is considered more suitable for textile printing and paper coating industries [22,23,24]. The efficiency of alginate extraction process from kelp is only about 30%, which leads to the generation of a substantial amount of kelp residues annually [25]. Due to insufficient recycling capacity, the excessive accumulation of uncontrolled alginate waste production may cause critical environmental pollution [25,26,27,28]. Although algal waste can be utilized for different purposes such as animal feed and bio-fertilizer, the industrial chemical processes might make it unfavorable for direct use as a soil conditioner or as a healthy diet for animals [29]. Re-use and sustainable utilization of macroalgae waste materials to generate biogas via anaerobic digestion (AD) could offer an environmentally sound pathway for such readily available raw material [30,31].
Few studies on biogas production utilizing macroalgae residues have been conducted using experiments such as laboratory (batch or continuous) and pilot scales. Most of these studies have examined non-extracted alginate residues, while only a few have tested dealginated waste. Carpentier, Festino, and Aubart [31] investigated AD of waste sludge obtained from Laminaria hyperborea and Ascophyllum nodosum after extraction of alginate. Also, dealginated waste of Laminaria hyperborea and Ascophyllum nodosum have been tested under batch trials by Kerner, Hanssen, and Pedersen [30]. Biogas production from macroalgae is affected by various factors such as seaweed species and geographical location [32,33].
The L. japonica cultivates in Chinese coastal waters of the Yellow Sea in huge quantities. It is worth mentioning that, in 2010 and for ten years, China was reported to be the highest producer of L. japonica in the world [25]. To the best of our knowledge, this study represents the first that aims to use the dealginated waste of L. japonica as a substrate for biogas production via mono-digestion and in anaerobic co-digestion (ACD) with rice straw. One of the methods to improve the performance of AD is to avoid potential inhibitors caused as a result of low carbon/nitrogen (C/N) ratios by adding high carbon content. This method has been applied by Yen and Brune [34]. The ACD trials of macroalgae together with materials such as cattle manure, wheat straw, or carbon-rich organic waste have overcome several problems in AD and enhanced the quality of biomethanation. Mixing the algal waste, which has low C/N ratio, with rich-carbon crop residues through ACD has been reported to enhance the digestion performance [35,36]. In China, the annual production of rice straw (RS) is about 200 million tons based on dry content, and it is considered as an abundant carbon-providing bioresource [37,38].
The main aims of this paper are to: (1) Investigate the potential of biomethanation from extracted and non-extracted alginate residues of L. japonica (AEWLJ and NAEWLJ); (2) evaluate the impact of ACD and synergetic effects of AEWLJ with RS (AEWLJ/RS) and NAEWLJ with RS (NAEWLJ/RS) in different mixing ratios on methane production using batch reactors under mesophilic conditions of the AD process; (3) optimize the carbon to nitrogen ratio of the AEWLJ and NAEWLJ with rice straw; (4) monitor the system stability in terms of total ammonia nitrogen, total volatile fatty acids, and pH during the AD process.

2. Materials and Methods

2.1. Raw Material Collection and Preparation

In this work, the raw material, alginate industrial waste (L. japonica), was collected from Tiantian Seaweed Industrial Co., LTD., Lianyungang city, Jiangsu province, China, where the L. japonica is used to extract sodium alginate for the dyeing and printing industries. The L. japonica is usually cultivated during October to November, and harvested from March to July, in Chinese coastal waters of the Yellow Sea. The waste disposed of in preliminary refining, before the extraction process, is designated herein as the non-alginate-extracted waste of L. japonica (NAEWLJ), while the post-extraction waste is termed the alginate-extracted waste of L. japonica (AEWLJ)—see Figure 1. In contrast to AEWLJ, the NAEWLJ, which mainly consists of the holdfast and stipe parts of L. japonica, were tightly tangled by some impurities such as fractions of seed rope, stones, sand, snails, and other foreign objects that necessitated manual removal and washing before subsequent steps. Both AEWLJ and NAEWLJ were dried under sunlight before milling with a lab scale grinder, then sieved to pass 1 mm size. Samples were stored in bags at ambient temperature until use.

2.2. Analytical Methods

In this study, the APHA standard methods [39] were applied to determine the total solids (TS), volatile solids (VS), total organic carbon (TOC) ashes, and total nitrogen (TN). The organic matter (OM) was calculated with a conversion factor based on the TOC formula. Mean values were calculated after three replicate trials. To monitor the pH during AD experiments, a digital pH meter (FE20K, Mettler Toledo, Zürich, Switzerland) was used. In this study, the pH adjustment technique was not followed. The supernatant of centrifuged samples was used to determine the total ammonia nitrogen using a benchtop spectrophotometer (NH4-N: 5B-6(D), Lian-hua Tech Co., Ltd., Beijing, China). Biogas content measurement was carried out using a gas chromatograph (GC 9890B, Nanjing Renhua Technical Company, Nanjing, China) equipped with a thermal conductivity detector (TCD) (Nanjing Renhua Technical Company, Nanjing, China) and packed column. Biogas samples of 0.5 mL were drawn from experimental reactors and then injected into the TCD. Hydrogen gas was used as carrier gas, while the temperature of the TCD, injector, and oven were 120 °C, 100 °C, and 150 °C, respectively. During the AD process, the gas chromatograph (GC-2014, AOC-20s, Shimadzu, Japan) was used to determine total volatile fatty acid concentrations. This GC was equipped with a flame ionization detector (FID) and a TCD, and controlled by GC Solution software.

2.3 Characteristic of Substrate Materials (AEWLJ, NAEWLJ, and RS) and Inocula

The characteristics of inoculum and substrates (i.e., total solid (TS), total organic carbon (TOC), total nitrogen (TN), organic matter (OM), carbon/nitrogen ratio (C/N ratio), volatile solid (VS), ash content (ASH), and volatile solid /total solid (VS/TS ratio)) used for the trials are presented in Table 1. The C/N ratio is considered to be a crucial factor for the robust growth of microorganisms when co-substrate materials are undertaken via AD processes [40]. The C/N ratios of AEWLJ (13/1) and NAEWLJ (12/1) were within the range of previous research such as that reported by Trinh et al. [41] for roughly general C/N ratio of macroalgae (10/1), and by Pham et al. [42] for C/N ratio of air-dried L. japonica (16/1). Although the C/N ratio remains highly debated, the most acceptable range of C/N ratio for optimal AD is recommended to be between 20/1 and 30/1 [43]. In this study, highly carbonic material (i.e., rice straw) was added to NAEWLJ and AEWLJ to optimize their C/N ratio. The VS/TS ratios of AEWLJ and NAEWLJ were found to be relatively high (76% and 90%, respectively), which is advantageous to the AD process [44]. The average ash content of NAEWLJ was 24%, which is consistent with the findings of Pérez [45] and Reith et al. [46], who reported average ash contents of 24% and 25% for Laminaria spp. and L. japonica, respectively. The average ash content of AEWLJ was found to be slightly higher (34%). The organic matter was 51% and 50% for the AEWLJ and NAEWLJ, respectively.

2.4. Experimental Design

In this work, batch laboratory AD trials were conducted under mesophilic conditions (37.0 ± 1.0 °C) and in 1000 mL serum bottles. An 800 mL working volume, including inoculum, was used for each reactor. To investigate the impact of mono- and co-digestion on methane yield, four different mixing ratios of AEWLJ/RS and NAEWLJ/RS were arranged according to TS ratios of 100%, 67%, 50%, and 33%. For AEWLJ/RS, the ratios were termed as P1 (100%), P2 (67%), P3 (50%), and P4 (33%), while NAEWLJ/RS combinations were described as F1 (100%), F2 (67%), F3 (50%), and F4 (33%). The inoculum of the batch trials was collected from a biogas plant using pig manure, located in Jintan, Changzhou city, Jiangsu province, China. This sludge was not adapted to the algal substrate prior to the batch experiment. The TS and VS of inoculum were 9 ± 0.04 wt % on a wet basis, and 47 ± 0.36 wt % on a dry basis, respectively. The substrates of AEWLJ and NAEWLJ were prepared in triplicates.

2.5. Batch Bioreactors Setup

The laboratory batch of AD equipment consisted of two 1-L borosilicate glass bottles, as shown in Figure 2. The first glass was used as a reactor and the second as a water bottle for biogas storage. The system also included a set of measuring bottles for collecting water, a silicone connection tube, and a thermostatic water bath receptacle to maintain the mesophilic conditions. Each reactor included two ports—the first one for digestate sample collection to analyze digestion process parameters (volatile fatty acids (VFA), total ammonia nitrogen (TAN), and pH), while the second one was equipped with an injection port for biogas sample withdrawal. The connection tubes were fixed through butyl rubber stoppers, which were used along with aluminum crimps to seal all digesters tightly. In this work, the substrate and inoculum were fed into the reactor bottle; the proportion of mono- and co-substrate materials in all digesters were set at 6% total solid concentration under mesophilic conditions (37 ± 1 °C). The inoculum substrate ratio (ISR) was 75% based on the total solid. In addition, only inoculum accounting for 48.75% of the total working volume was added with pure water as blank digester and the amount of biogas produced, which lasted for only three days, was subtracted from the algal yields. During the experimental period, the bottles were handily shacked every day to ensure homogeneous conditions in the reactors. To measure the total biogas yield, water displacement technique was utilized. Biogas production and composition were estimated and analyzed every day, then the volumes were normalized to STP conditions (0 °C, 1 bar) and the results expressed as NmL/gVS, while pH, TAN, and VFA were examined periodically. The period of incubation lasted for 28 days, until negligible biogas yield was recorded.

2.6. Statistical Analyses and Synergetic Effect Calculations

To figure out whether there were notable differences among the experimental results for biogas and methane production, data were analyzed using one-way ANOVA (SPSS v.16.0).
The synergetic effect could be elucidated through the comparison of methane yield from co-digestion with the summation of mono-digestion for individual substrates involved in such co-digestion with the same mixing ratio. To address this, the total summation of mono methane production (TSM) of P2 can be calculated as follows:
Methane   TSM   for   P 2 = P 1 Methane   production P 1   Mixing   ratio + RS   Methane   production RS   Mixing   ratio Total   mixing   ratio ,

2.7. Kinetic Model

Experimental data of cumulative methane production recovered was used to simulate a kinetic model of methane production via a modified Gompertz equation (Equation (2)) following some previous research [47,48,49]. Basically, Gompertz is a sigmoidal function equation utilized to predict the growth rate of bacteria. Zwietering et al. rewrote the Gompertz equation to substitute the mathematical parameter (a, b, c) to have biological meaning [50]. The modified Gompertz model is a sigmoidal function used to predict methane production rate. In this equation, the behavior of bacterial growth rates under different conditions in the digester was assumed to be proportional to the methane production rate [47]. By using Matlab software (R2014a), a nonlinear least squares regression was functioned to validate the modified Gompertz model and determine its important parameters:
Y ( t ) = M . e x p { e x p [ R m a x . e M ( λ t ) + 1 ] } ,
where Y ( t ) is the cumulative methane yield (mL/gVS) at a digestion time t (day), M stands for the methane yield potential (mL/gVS), R m a x is the maximum methane production rate (mL/gVS/day), e is a mathematical constant with a value of 2.71828, λ is the lag-phase (day), and t is the measured time (day).

3. Results and Discussion

3.1. Biogas and Methane Production for Mono-Digestion

For all mono-digesters, biogas production began on the first day and reached its highest daily yield on the fourth and second day for the AEWLJ and NAEWLJ, respectively, as shown in Figure 3a,b. From the results, the AEWLJ (P1) produced a higher daily biogas rate of 28 NmL/gVS in comparison with the NAEWLJ (F1), which produced 17 NmL/gVS. The statistical analysis revealed that the cumulative biogas total volume from mono-digestion of the AEWLJ (182 NmL/gVS) was significantly higher (p < 0.05) than that of NAEWLJ (113 NmL/gVS) as presented in Figure S1a,b and Figure S2. This result could be attributed to the extraction process applied to AEWLJ, which may weaken the macroalgae cell wall structure’s resistance to AD [12,51]. In review research, Klassen et al. reported the recalcitrance of microalgae cell walls to bacterial attack as a potential obstacle toward the efficient degradation of the biomass during the AD process [52]. Therefore, the usage of seaweed residues after extraction procedures could be more effective for biogas conversion compared to the untreated seaweed substrates alone [33].
On the other hand, the cumulative methane yielded by AEWLJ and NAEWLJ were 82 and 45 NmL/gVS, respectively (Table 2 and Table 3). These results were within the range of values obtained in a study conducted by Montingelli et al. on varieties of Laminaria sp. harvested at different periods in Ireland [53] (wherein the methane production from Laminaria digitata, Laminaria hyperborea, and Saccharina latissima was investigated through AD). Since the chemical composition profiling of seaweeds is subjected to a seasonal variation, the study considered seasonal variation and the differences in substrate concentrations and obtained 20 to 236 mL/gVS and 15 to 342 mL/gVS respectively for the untreated samples and that underwent beating pretreatment. Our results are also in line with the findings of Tedescoa and Daniels who tested the biomass of fresh and alginate-extracted residues of several algal species from Ireland including Fucus serratus, Fucus vesiculosus, Ascophyllum nodosum, L. digitata, and Laminaria saccharina. [33]. Their results revealed methane yields between 47 and 535 mL/gVS and between 27 and 523 mL/gVS when co-digesting with sludge and acclimatized sludge, respectively Also, the results are in agreement with the outcomes of Kerner, Hanssen, and Pedersen [30] who utilized extracted alginate sludge of Laminaria hyperborean and Ascophyllum nodosum to produce methane. In a study conducted by Klassen et al., the methane generated by mono microalgae biomass (Chlamydomonas reinhardtii strain CC-1690) cultivated in replete nitrogen culture media conditions revealed low production (131 NmL/gVS/day) when conducted on continuous anaerobic fermentation due to the effect of high ammonia/ammonium concentrations [54]. The biogas and methane production in this study might be negatively affected by the low C/N ratio found in the pure feedstocks of AEWLJ and NAEWLJ as discussed below.

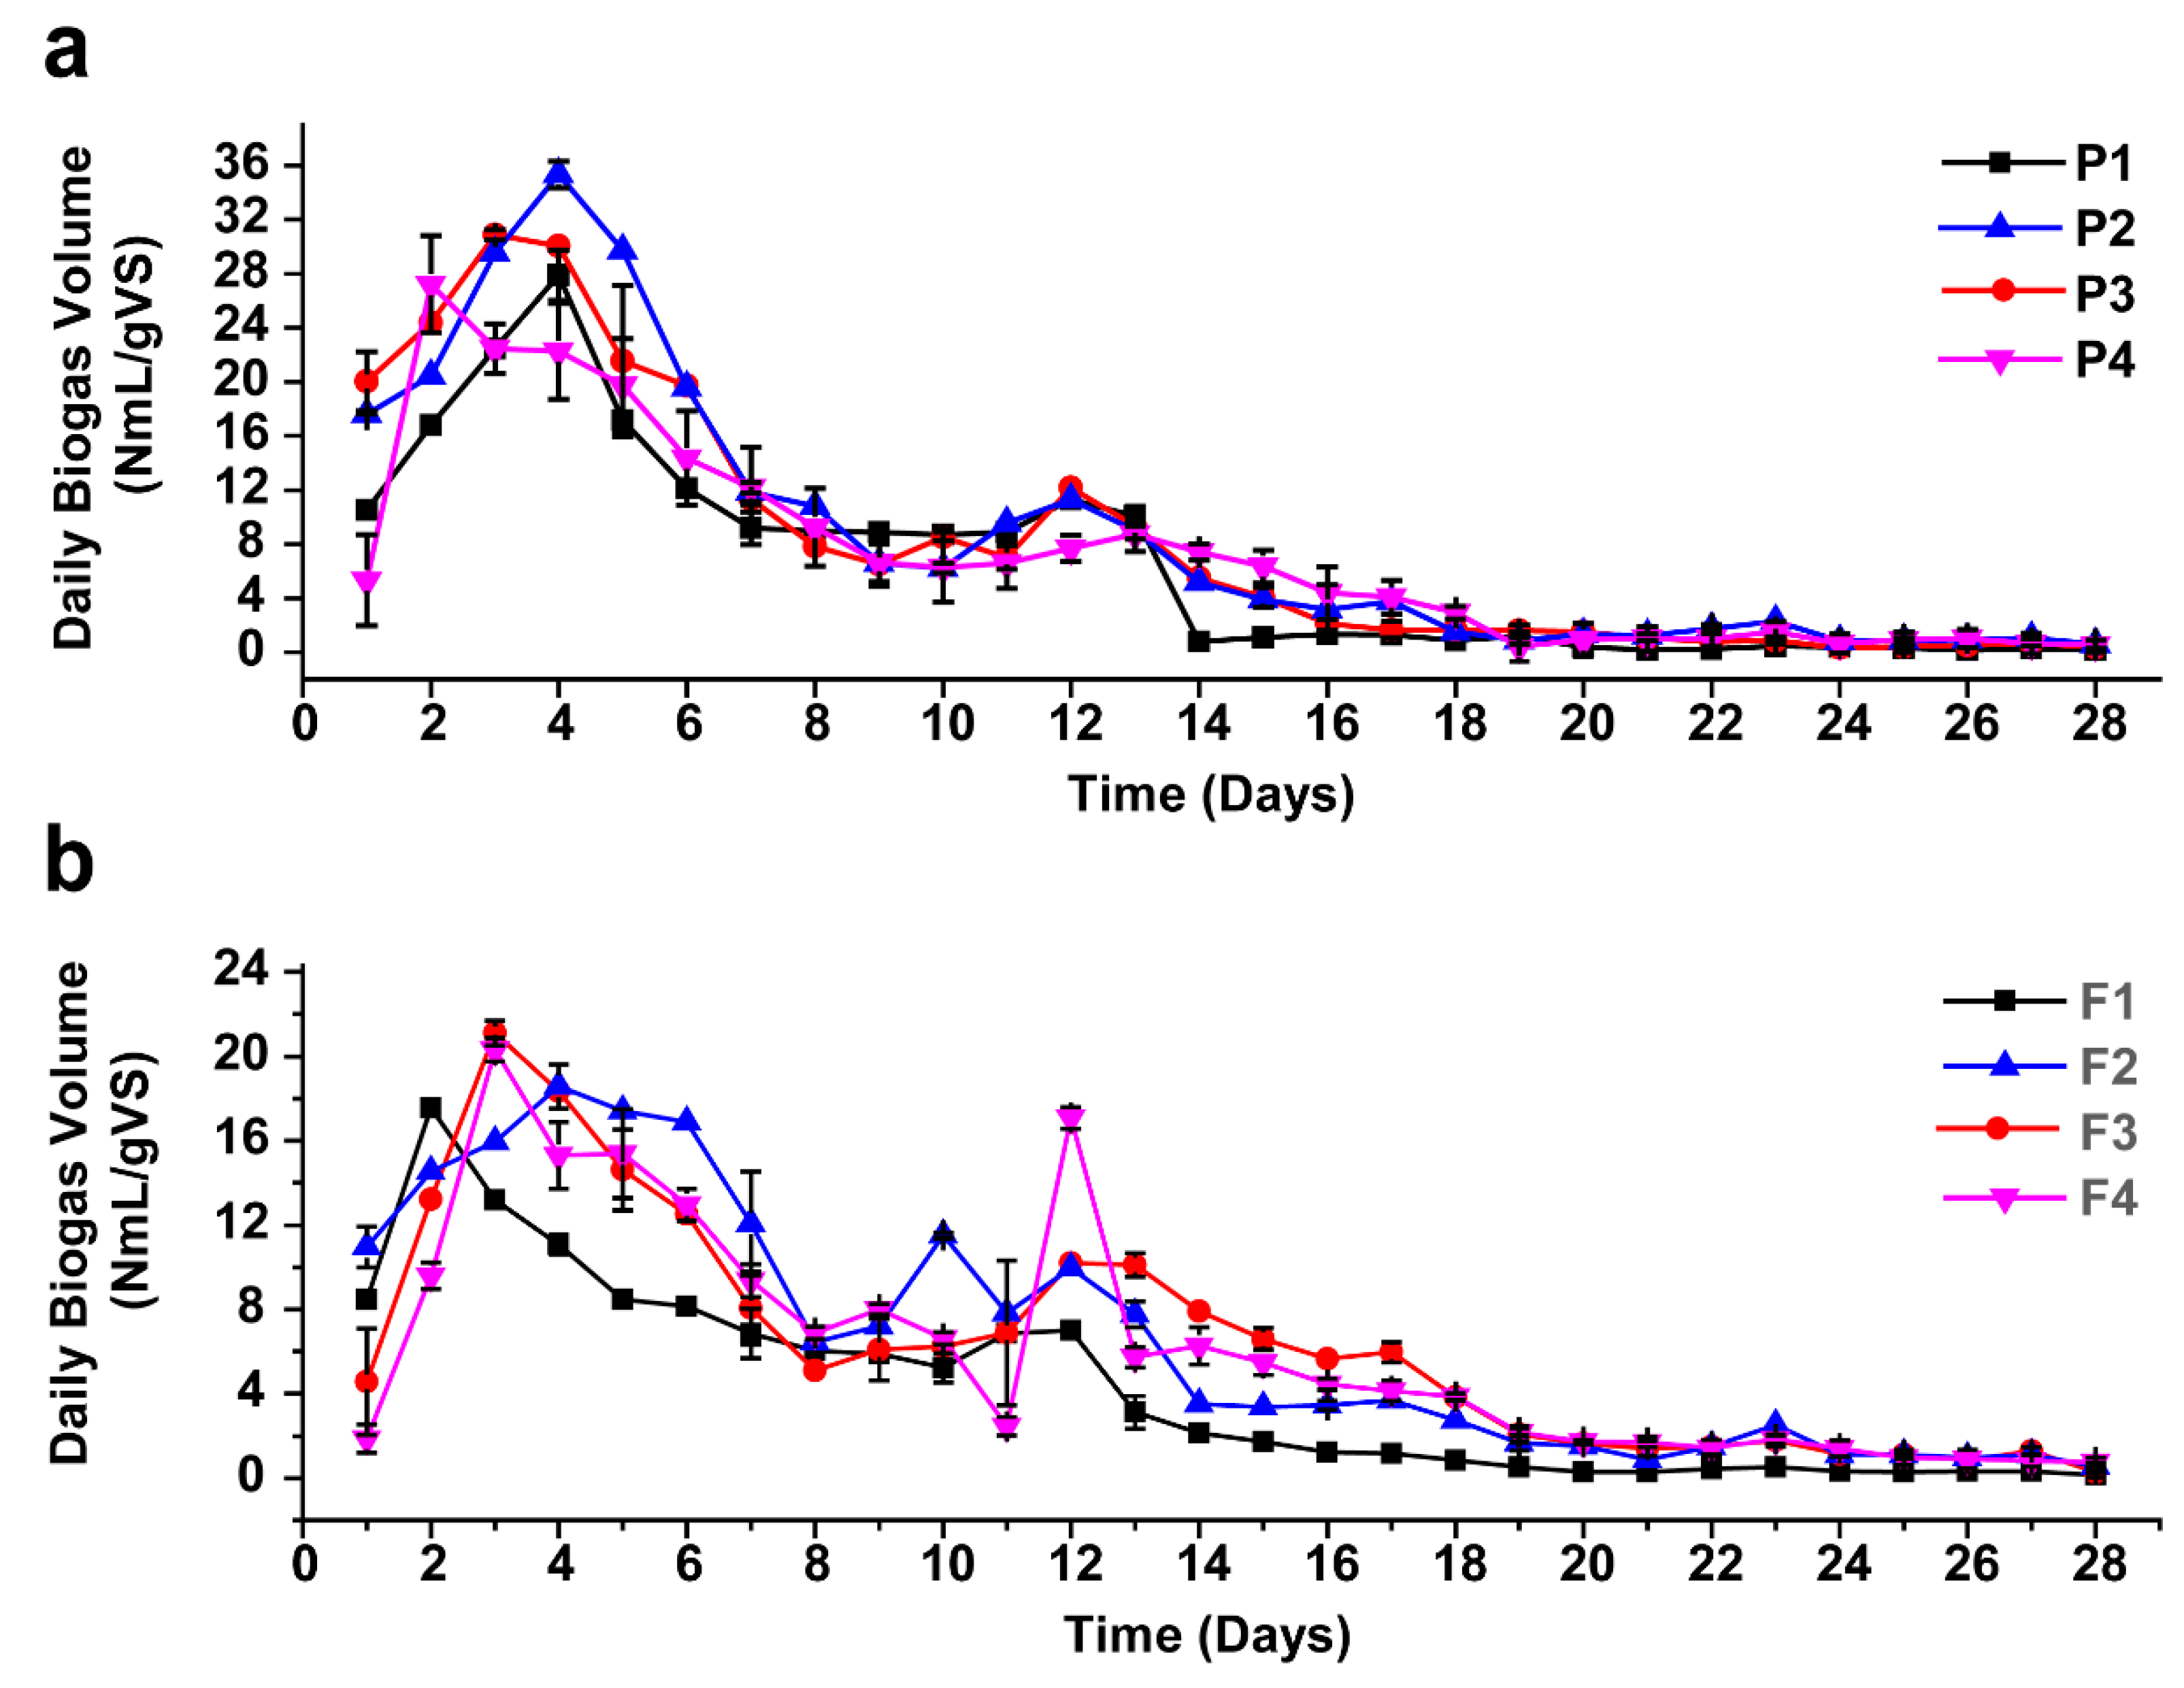
3.2. Biogas Production and Methane Content for Co-Digestion

The batch assays of AEWLJ and NAEWLJ were blended with RS at different ratios based on total solid (TS) following the method of Costa, Gonçalves, Nobre, and Alves [32]. The daily biogas production trend for combinations of the AEWLJ/RS and NAEWLJ/RS in different digesters during the digestion period of 28 days is illustrated in Figure 3a,b. Generally, the daily biogas production was found to fluctuate, and the highest production was obtained during the first two weeks. Thereafter, the yield began to decrease steadily until the end of the incubation period. For the AEWLJ/RS, the highest daily biogas rates for P2, P3, and P4 treatments with mixing ratio of 67%, 50%, and 33%, respectively, were 35, 31, and 27 NmL/gVS on the fourth, third, and second days, respectively. For the F2, F3, and F4 treatments of the NAEWLJ/RS, the highest daily biogas rates were 18, 20, and 19 NmL/gVS on fourth, third, and third days, respectively. The cumulative biogas yields under co-digestion were 247, 233 and 203 NmL/gVS added for P2, P3, and P4, respectively. Whilst the NAEWLJ/RS showed lower values as the cumulative biogas yields of the F2, F3, and F4 were 178, 172, and 161 NmL/gVS added, respectively—see Figure S1a,b. In general, the results of total biogas showed that all digesters of AEWLJ and NAEWLJ blended with the RS in ratios of 67% (P2/F2), 50% (P3/F3), and 33% (P4/F4) (based on TS) were higher than their corresponding solo digestion (100%). For P2, P3, and P4, the total biogas yield was increased by 36%, 28%, and 11%, respectively, and by 58%, 52%, and 43% for F2, F3, and F4, respectively. The statistical analysis showed that the biogas production of P2 and F2 were significantly higher (p < 0.05) than the P1 and F1 (Figure S2). This finding may confirm the beneficial effect of the co-digestion process on biogas production [55,56,57]. High increase of biogas production was also demonstrated via the co-digestion approach utilizing different substrates (municipal sludge, grease trap waste, and meat processing waste) [58]. Furthermore, findings by Maragkaki et al. revealed a significant increase in biogas from sewage sludge in co-digestion with small quantities of agro-industrial byproducts including food waste, grape residues, crude glycerol, cheese whey, and sheep manure [59].
The average methane content (%) for all co-digestion treatments were higher than that of mono-digestion as presented in Figure S3. The P2 and F2 treatments achieved the highest percentage of average methane among their mono-AD by 54% for each. These results confirm the importance of the nutrient mixing ratio in substrates, which affects the metabolic activity of the microflora in the digesters as stated by Rughoonundun et al. [60]. It was noted that utilizing single substrates for AD could be inefficient because of various reasons including insufficient nutrients accessible for the microbial community, the degree of biodegradability, and the optimization of C/N ratio (the latter is demonstrated below) [61].

3.3. The Synergetic Effect of Co-Substrate on Biomethanation

To address the synergetic effect for this study, the mixing ratio (TS%) of 67% (2:1) for co-digestion of AEWLJ/RS, which was designated as P2, is exemplified below as calculated using Equation (1). Methane production for mono-digestion of AEWLJ (P1) and RS were 82 NmL/gVS and 62 NmL/gVS, respectively.
Methane   TSM   for   P 2 = 82 × 2 + 62 × 1 3 = 75   NmL / gVS
As evident from Table 2, the experimental total methane of P2 was 134 NmL/gVS, while by assuming that every substrate was conducted separately in solo digestion, the total summation of mono methane production (methane TSM) of P2 was 75 NmL/gVS, which was obtained by Equation (1). This implies that the total methane yield of P2 increased by 78% due to co-fermentation, thus could suggest the positive role of synergetic impact. For F2, the total methane yield recorded an 88% increase, which was the highest value among all treatments (Table 3). These findings are comparable with the outcomes of Vivekanand et al., as they achieved an increase of methane yields up to 84% by combining manure with fish ensilage compared to the individual substrates [61].

3.4. Optimizing Carbon to Nitrogen Ratio

As mentioned before, the C/N ratio of AEWLJ and NAEWLJ were 13/1 and 12/1, respectively, which were too low for optimal biogas production. Table 2 and Table 3 demonstrate the effect of different C/N ratios, which are elevated by mixing different fractions of AEWLJ and NAEWLJ with RS substrates to enhance methane production. The experimental data show that the total methane yield of feedstocks with C/N ratios of 19/1 (P2), 24/1 (P3), and 29/ 1 (P4) increased by 63%, 53%, and 22% respectively in comparison with C/N ratio of 13/1 (P1). For the NAEWLJ/RS with C/N ratio of 19/1 (F2), 23/1 (F3), and 29/1 (F4), the total methane yields were higher than the ratio of 12/1 (F1) by 111%, 102%, and 65%, respectively. Klassen et al. found that the C/N ratio in algal strains (Chlamydomonas reinhardtii, Parachlorella kessleri, and Scenedesmus obliquus) was very low, which is a key bottleneck for biogas production through AD [62]. Their study concluded that optimizing the C/N ratio via a novel one-stage cultivation strategy with inherent nitrogen limitation for the subsequent AD process could increase methane production and avoid inhibition of methanogens by ammonia. In this study, the more RS fraction added, the higher the C/N ratio of the mixture substrates. It was clearly observed that the balanced C/N ratio of 19/1 for P2 and F2 exhibited the maximum methane yield of 134 and 95 NmL/gVS for co-substrating of AEWLJ/RS and NAEWLJ/RS, respectively (Table 2 and Table 3). The data demonstrated the influence of balancing the C/N ratio to obtain optimum methane yields by mixing different substrates. These results are consistent with the conclusion of Yen and Brune [34] who found that the adjustment of the C/N ratio for anaerobic digestion through a 50% addition of a high carbonic source of waste paper (based on VS) to algal sludge substrate augmented the daily production of methane to 104% in comparison to solo algal sludge digestion. Also, Zhao and Ruan [63] reported that optimizing the C/N ratio of substrates could enhance methane productivity.

3.5. System Stability for pH and Total Volatile Fatty Acids During the AD

The pH is considered one of the most critical operational condition parameters that should be observed and controlled within an optimal range during the incubation period, due to the high sensitivity of methanogenic bacteria to acidity [64,65]. The pH readings were relatively low in the first days of the incubation period in all treatments since the hydrogen that resulted as a metabolic waste of acetate-forming bacteria decreased the pH values. Afterwards, methane-forming bacteria consumed the hydrogen and other acids to produce methane, which led to a gradual increase in the pH in the digester until it reached its stability, as demonstrated in Figure 4a,b. The pH ranged between 7 and 8 for both AEWLJ/RS and NAEWLJ/RS groups. These results are in agreement with the outcomes of Cheng [66] who reported that the optimal pH for the normal growth of anaerobic microflora ranges between 6.5 and 8.0.
One other parameter considered an important aspect during methane production is the total volatile fatty acids (TVFAs), which are intermediate compounds in the degradation of organic materials in the hydrolysis and acidogenesis stages of the AD process [67,68,69]. In this study, the TVFA peak concentration value was recorded in the first days of incubation time for all the experimental reactors, and that was earlier than the peak days of biogas production. These results are consistent with the findings of Gerardi [70,71]. The TVFAs maximum value for AEWLJ/RS arrays was 4866 mg/L produced from the P2 samples, shown in Figure 5a, while for NAEWLJ/RS, F1 yielded the highest value of 5629 mg/L, shown in Figure 5c. These results were below the toxic level of TVFAs, reported by Siegert and Banks [72] and Migliore et al. [73] to be above 6000 mg/L during the incubation period. At these levels, the buffering capacity was enough to stabilize the pH values in the system. After the initial peak period, the TVFA concentration for AEWLJ/RS and NAEWLJ/RS tended to decrease through the reaction progress. This decreasing trend could be due to the TVFA consumption rate by the biomethanation process, which might become higher than its production rate [74].

3.6. TAN Pattern During the AD Process

The total ammonia nitrogen (TAN) is a key factor in bioprocesses; during the AD process, the TAN is produced as a result of the biological degradation of proteins, amino acids, and urea. Despite the importance of ammonia as a nutrient source for growth of microflora during AD process, it is widely accepted that the availability of ammonia at a high concentration may inhibit the development of methane-forming bacteria [75,76,77]. As presented in the profiles of TAN concentrations for both of AEWLJ/RS and NAEWLJ/RS, shown in Figure 5b,d, the highest TAN concentration of the mono-digestion and the co-digestion were 2027.5 mg/L for the P1 samples and 1450.25 mg/L for the F2 samples, respectively. These high values could be attributed to the relatively high nitrogenous matter content of macroalgae in the mentioned treatments, as the nitrogenous matter is the source of TAN [78,79]. The relatively lower TAN concentration values recorded during the startup days of incubation time could be due to the higher consumption rate of proliferating microflora, compared to TAN formation rate. The situation reversed when microflora reached its steady state conditions. According to Chen et al. [80], the critical TAN values, depending on variations in temperature (mesophilic) and pH, could inhibit 50% (pH 7.7) and 100% (pH 7.6) of methane production when the TAN values were 1445 mg/L and 5200 mg/L, respectively. Although some values of TAN concentration in this study were within the inhibition range mentioned above, the stability of the process implies that there was no inhibition.

3.7. Kinetic Model of Methane Production

Figure 6a–b display the experimental cumulative methane yield from AEWLJ/RS and NAEWLJ/RS groups as well as that calculated by utilizing the modified Gompertz model. Table S1 lists some important parameters of the validated modified Gompertz model using Matlab software. The percentage difference between the experimental and calculated cumulative methane yield ranged between 0.12 and 1.43 and between 0.41 and 1.33 for AEWLJ/RS and NAEWLJ/RS, respectively. Generally, there was a high correlation between the experimental and calculated cumulative methane yield (R2 ≥ 0.9803). These results were consistent with the findings of Zhao et al. [81] and Altaş [82], who reported that the modified Gompertz model could describe the methane generation as a function of time.

4. Conclusions

This study outlines the potential of harnessing alginate-extracted and non-extracted waste of L. japonica as substrates for the production of methane via anaerobic digestion. The total cumulative biogas volume of mono-AEWLJ (182 NmL/gVS) was significantly (p < 0.05) higher than that of NAEWLJ (113 NmL/gVS). Interestingly, anaerobic co-digestion with rice straw was found to enhance the methane production. The optimal C/N ratio of 19/1 for both AEWLJ/RS and NAEWLJ/RS showed maximum total methane yield of 134 and 95 NmL/gVS, respectively. The mixing ratio of 67% for AEWLJ/RS and NAEWLJ/RS achieved the maximum cumulative methane percentage value of 54% for each. The subsequent sludge adaptation to algal waste could be suggested due to its potential to enhance substrate degradation. The promising technology of anaerobic digestion utilizing the waste of L. japonica from alginate extraction industries for biomethanation, and the possibility to obtain synergetic effects from L. japonica waste and rice straw, could be useful for countries such as China which are rich in both biomass inputs, leading to the implementation of an integrated biorefinery approach.

Supplementary Materials

The following are available online at https://0-www-mdpi-com.brum.beds.ac.uk/2071-1050/11/5/1269/s1. Figure S1: Cumulative biogas production during AD for mono- and co-digestion; (a) for AEWLJ/RS arrays and (b) for NAEWLJ/RS arrays. Figure S2: The statistical analysis of biogas and methane production. Columns with different letters differ significantly (p < 0.05). Figure S3: The percentage of cumulative methane in total biogas for mono- and co-digestion of AEWLJ/RS arrays and NAEWLJ/RS arrays. Table S1: Parameters of results using modified Gompertz equation for biomethanation of AEWLJ/RS NAEWLJ/RS arrays.

Author Contributions

Conceptualization, design of experiments, and writing—original draft preparation, M.M.M.O; supervision and technical support, X.S., and D.Z.; writing—review and editing, M.M.M.O., A.K.B. and H.J.; help in performing the experiments, H.J. and Y.Z.; funding acquisition, X.S.

Funding

This work was supported financially by the Fundamental Research funds for the Central Universities (2017B20414, 2018B42614) and Jiangsu Scientific Research Program (BE2015705, BE2017765).

Acknowledgments

The authors would like to thank the Agricultural Biomass Conversion Lab, Circular Agriculture Research Center, Jiangsu Academy of Agricultural Sciences, Nanjing, Jiangsu Province, and P.R. China for laboratory technical support.

Conflicts of Interest

The authors declare no conflict of interest.

References

  1. Demirbas, A. Biofuels sources, biofuel policy, biofuel economy and global biofuel projections. Energy Convers. Manag. 2008, 49, 2106–2116. [Google Scholar] [CrossRef]
  2. Wei, N.; Quarterman, J.; Jin, Y.S. Marine macroalgae: An untapped resource for producing fuels and chemicals. Trends Biotechnol. 2013, 31, 70–77. [Google Scholar] [CrossRef] [PubMed]
  3. Yanli, Y.; Peidong, Z.; Wenlong, Z.; Yongsheng, T.; Yonghong, Z.; Lisheng, W. Quantitative appraisal and potential analysis for primary biomass resources for energy utilization in China. Renew. Sustain. Energy Rev. 2010, 14, 3050–3058. [Google Scholar] [CrossRef]
  4. Balat, H.; Kırtay, E. Hydrogen from biomass—Present scenario and future prospects. Int. J. Hydrog. Energy 2010, 35, 7416–7426. [Google Scholar] [CrossRef]
  5. Demirbaş, A. Biomass resource facilities and biomass conversion processing for fuels and chemicals. Energy Convers. Manag. 2001, 42, 1357–1378. [Google Scholar] [CrossRef]
  6. King, D.A. Climate Change Science: Adapt, Mitigate, or Ignore? Science 2004, 303, 176–177. [Google Scholar] [CrossRef] [PubMed]
  7. Cai, J.; Liu, R.; Deng, C. An assessment of biomass resources availability in Shanghai: 2005 analysis. Renew. Sustain. Energy Rev. 2008, 12, 1997–2004. [Google Scholar] [CrossRef]
  8. Rosenzweig, C.; Karoly, D.; Vicarelli, M.; Neofotis, P.; Wu, Q.; Casassa, G.; Menzel, A.; Root, T.L.; Estrella, N.; Seguin, B.; et al. Attributing physical and biological impacts to anthropogenic climate change. Nature 2008, 453, 353. [Google Scholar] [CrossRef] [PubMed]
  9. Carlsson, A.S.; Beilen, J.V.; Möller, R.; Clayton, D. Micro-and Macro-Algae: Utility for Industrial Applications: Outputs from the EPOBIO Project. CPL Press. Available online: http://www.etipbioenergy.eu/images/epobio_aquatic_report.pdf (accessed on 23 September 2017).
  10. Vivekanand, V.; Eijsink, V.G.H.; Horn, S.J. Biogas production from the brown seaweed Saccharina latissima: Thermal pretreatment and codigestion with wheat straw. J. Appl. Phycol. 2011, 24, 1295–1301. [Google Scholar] [CrossRef]
  11. Hughes, A.D.; Kelly, M.S.; Black, K.D.; Stanley, M.S. Biogas from Macroalgae: Is it time to revisit the idea? Biotechnol. Biofuels 2012, 5, 86. [Google Scholar] [CrossRef] [PubMed]
  12. Vanegas, C.H.; Bartlett, J. Green energy from marine algae: Biogas production and composition from the anaerobic digestion of Irish seaweed species. Environ. Technol. 2013, 34, 2277–2283. [Google Scholar] [CrossRef] [PubMed]
  13. Yoza, B.A.; Masutani, E.M. The analysis of macroalgae biomass found around Hawaii for bioethanol production. Environ. Technol. 2013, 34, 1859–1867. [Google Scholar] [CrossRef] [PubMed]
  14. John, R.P.; Anisha, G.S.; Nampoothiri, K.M.; Pandey, A. Micro and macroalgal biomass: A renewable source for bioethanol. Bioresour. Technol. 2011, 102. [Google Scholar] [CrossRef] [PubMed]
  15. Kim, S.K.; Chojnacka, K. Marine Algae Extracts, 2 Volume Set: Processes, Products, and Applications; Wiley: Hoboken, NJ, USA, 2015. [Google Scholar]
  16. Suganya, T.; Varman, M.; Masjuki, H.H.; Renganathan, S. Macroalgae and microalgae as a potential source for commercial applications along with biofuels production: A biorefinery approach. Renew. Sustain. Energy Rev. 2016, 55, 909–941. [Google Scholar] [CrossRef]
  17. Lewis, L.A.; McCourt, R.M. Green algae and the origin of land plants. Am. J. Bot. 2004, 91, 1535–1556. [Google Scholar] [CrossRef] [PubMed]
  18. Kim, S.K. Handbook of Marine Macroalgae: Biotechnology and Applied Phycology; Wiley: Hoboken, NJ, USA, 2011. [Google Scholar]
  19. Lüning, K.; Pang, S. Mass cultivation of seaweeds: Current aspects and approaches. J. Appl. Phycol. 2003, 15, 115–119. [Google Scholar] [CrossRef]
  20. Tseng, C. Algal biotechnology industries and research activities in China. J. Appl. Phycol. 2001, 13, 375–380. [Google Scholar] [CrossRef]
  21. Draget, K.I.; Smidsrød, O.; Skjåk-Bræk, G. Alginates from Algae. In Biopolymers Online; Wiley-VCH Verlag GmbH & Co. KGaA: Hoboken, NJ, USA, 2005. [Google Scholar]
  22. Draget, K.I. 29—Alginates. In Handbook of Hydrocolloids, 2nd ed.; Phillips, G.O., Williams, P.A., Eds.; Woodhead Publishing: Cambridge, UK, 2009; pp. 807–828. [Google Scholar] [CrossRef]
  23. Bixler, H.J.; Porse, H. A decade of change in the seaweed hydrocolloids industry. J. Appl. Phycol. 2011, 23, 321–335. [Google Scholar] [CrossRef]
  24. Peteiro, C. Alginate Production from Marine Macroalgae, with Emphasis on Kelp Farming. In Alginates and Their Biomedical Applications; Rehm, B.H.A., Moradali, M.F., Eds.; Springer: Singapore, 2018; pp. 27–66. [Google Scholar] [CrossRef]
  25. Yue, H.; Sun, Y.; Jing, H.; Zeng, S.; Ouyang, H. The Analysis of Laminaria japonica Industry and International Trade Situation in China. In Proceedings of Selected Articles of 2013 World Agricultural Outlook Conference; Xu, S., Ed.; Springer: Berlin/Heidelberg, Germany, 2014; pp. 39–51. [Google Scholar]
  26. Wu, Z.-J.; Xiong, H.-P. Analysis of the Fatty Acid Composition of the Floating Residus from an Algin Factory. Mar. Sci. 2001, 25, 49–50. [Google Scholar]
  27. Zhou, D.; Zhang, L.A.; Zhang, S.C.; Fu, H.B.; Chen, J.M. Hydrothermal liquefaction of macroalgae Enteromorpha prolifera to Bio-oil. Energy Fuel 2010, 24. [Google Scholar] [CrossRef]
  28. Riaño, B.; Molinuevo, B.; García-González, M.C. Potential for methane production from anaerobic co-digestion of swine manure with winery wastewater. Bioresour. Technol. 2011, 102, 4131–4136. [Google Scholar] [CrossRef] [PubMed]
  29. Alzate, M.E.; Muñoz, R.; Rogalla, F.; Fdz-Polanco, F.; Pérez-Elvira, S.I. Biochemical methane potential of microalgae biomass after lipid extraction. Chem. Eng. J. 2014, 243, 405–410. [Google Scholar] [CrossRef]
  30. Kerner, K.N.; Hanssen, J.F.; Pedersen, T.A. Anaerobic digestion of waste sludges from the alginate extraction process. Bioresour. Technol. 1991, 37, 17–24. [Google Scholar] [CrossRef]
  31. Carpentier, B.; Festino, C.; Aubart, C. Anaerobic digestion of flotation sludges from the alginic acid extraction process. Biol. Wastes 1988, 23, 269–278. [Google Scholar] [CrossRef]
  32. Costa, J.C.; Gonçalves, P.R.; Nobre, A.; Alves, M.M. Biomethanation potential of macroalgae Ulva spp. and Gracilaria spp. and in co-digestion with waste activated sludge. Bioresour. Technol. 2012, 114, 320–326. [Google Scholar] [CrossRef] [PubMed]
  33. Tedesco, S.; Daniels, S. Optimisation of biogas generation from brown seaweed residues: Compositional and geographical parameters affecting the viability of a biorefinery concept. Appl. Energy 2018, 228, 712–723. [Google Scholar] [CrossRef]
  34. Yen, H.W.; Brune, D.E. Anaerobic co-digestion of algal sludge and waste paper to produce methane. Bioresour. Technol. 2007, 98, 130–134. [Google Scholar] [CrossRef] [PubMed]
  35. Carver, S.M.; Hulatt, C.J.; Thomas, D.N.; Tuovinen, O.H. Thermophilic, anaerobic co-digestion of microalgal biomass and cellulose for H2 production. Biodegradation 2011, 22, 805–814. [Google Scholar] [CrossRef] [PubMed]
  36. Jard, G.; Marfaing, H.; Carrère, H.; Delgenes, J.P.; Steyer, J.P.; Dumas, C. French Brittany macroalgae screening: Composition and methane potential for potential alternative sources of energy and products. Bioresour. Technol. 2013, 144, 492–498. [Google Scholar] [CrossRef] [PubMed]
  37. Wang, J.; Wei, J.; Li, J. Rice straw modified by click reaction for selective extraction of noble metal ions. Bioresour. Technol. 2015, 177, 182–187. [Google Scholar] [CrossRef] [PubMed]
  38. Wu, J.; Elliston, A.; Le Gall, G.; Colquhoun, I.J.; Collins, S.R.A.; Wood, I.P.; Dicks, J.; Roberts, I.N.; Waldron, K.W. Optimising conditions for bioethanol production from rice husk and rice straw: Effects of pre-treatment on liquor composition and fermentation inhibitors. Biotechnol. Biofuels 2018, 11, 62. [Google Scholar] [CrossRef] [PubMed]
  39. Clesceri, L.S.; Greenberg, A.E.; Eaton, A.D. Standard Methods for the Examination of Water and Wastewater, 20th ed.; APHA American Public Health Association: Washington, DC, USA, 1998. [Google Scholar]
  40. Kayhanian, M. Ammonia Inhibition in High-Solids Biogasification: An Overview and Practical Solutions. Environ. Technol. 1999, 20, 355–365. [Google Scholar] [CrossRef]
  41. Trinh, T.N.; Jensen, P.A.; Dam-Johansen, K.; Knudsen, N.O.; Sørensen, H.R.; Hvilsted, S. Comparison of Lignin, Macroalgae, Wood, and Straw Fast Pyrolysis. Energy Fuels 2013, 27, 1399–1409. [Google Scholar] [CrossRef]
  42. Pham, T.N.; Nam, W.J.; Jeon, Y.J.; Yoon, H.H. Volatile fatty acids production from marine macroalgae by anaerobic fermentation. Bioresour. Technol. 2012, 124, 500–503. [Google Scholar] [CrossRef] [PubMed]
  43. Allen, E.; Wall, D.M.; Herrmann, C.; Murphy, J.D. A detailed assessment of resource of biomethane from first, second and third generation substrates. Renew. Energy 2016, 87, 656–665. [Google Scholar] [CrossRef]
  44. Zhang, R.; El-Mashad, H.M.; Hartman, K.; Wang, F.; Liu, G.; Choate, C.; Gamble, P. Characterization of food waste as feedstock for anaerobic digestion. Bioresour. Technol. 2007, 98, 929–935. [Google Scholar] [CrossRef] [PubMed]
  45. Pérez, R. Ces algues qui nous entourent: Conception actuelle, rôle dans la biosphère, utilisations, culture; IFREMER: Issy-les-Moulineaux, France, 1997. [Google Scholar]
  46. Reith, E.; Deurwaarder, E.; Hemmes, K.; Curvers, A.; Kamermans, P.; Brandenburg, W.; Lettings, G. Bio-Offshore: Grootschalige Teelt van Zeewieren in Combinatie Met Offshore Windparken in de Noordzee. ECN. Available online: http://library.wur.nl/WebQuery/wurpubs/347698 (accessed on 20 February 2019).
  47. Nopharatana, A.; Pullammanappallil, P.C.; Clarke, W.P. Kinetics and dynamic modelling of batch anaerobic digestion of municipal solid waste in a stirred reactor. Waste Manag. 2007, 27, 595–603. [Google Scholar] [CrossRef] [PubMed]
  48. Xie, S.; Lawlor, P.G.; Frost, J.P.; Hu, Z.; Zhan, X. Effect of pig manure to grass silage ratio on methane production in batch anaerobic co-digestion of concentrated pig manure and grass silage. Bioresour. Technol. 2011, 102, 5728–5733. [Google Scholar] [CrossRef] [PubMed]
  49. Zhao, C.; Yan, H.; Liu, Y.; Huang, Y.; Zhang, R.; Chen, C.; Liu, G. Bio-energy conversion performance, biodegradability, and kinetic analysis of different fruit residues during discontinuous anaerobic digestion. Waste Manag. 2016, 52, 295–301. [Google Scholar] [CrossRef] [PubMed]
  50. Zwietering, M.H.; Jongenburger, I.; Rombouts, F.M.; Van’t Riet, K. Modeling of the bacterial growth curve. Appl. Environ. Microbiol. 1990, 56, 1875–1881. [Google Scholar] [PubMed]
  51. Dębowski, M.; Grala, A.; Zieliński, M.; Dudek, M. Efficiency of the Methane Fermentation Process of Macroalgae Biomass Originating from Puck Bay/Wydajność Procesu Fermentacji Metanowej Biomasy Makroglonów Pochodzących Z Zatoki Puckiej. Arch. Environ. Prot. 2012, 38, 99. [Google Scholar] [CrossRef]
  52. Klassen, V.; Blifernez-Klassen, O.; Wobbe, L.; Schlüter, A.; Kruse, O.; Mussgnug, J.H. Efficiency and biotechnological aspects of biogas production from microalgal substrates. J. Biotechnol. 2016, 234, 7–26. [Google Scholar] [CrossRef] [PubMed]
  53. Montingelli, M.E.; Benyounis, K.Y.; Quilty, B.; Stokes, J.; Olabi, A.G. Optimisation of biogas production from the macroalgae Laminaria sp. at different periods of harvesting in Ireland. Appl. Energy 2016, 177, 671–682. [Google Scholar] [CrossRef]
  54. Klassen, V.; Blifernez-Klassen, O.; Wibberg, D.; Winkler, A.; Kalinowski, J.; Posten, C.; Kruse, O. Highly efficient methane generation from untreated microalgae biomass. Biotechnol. Biofuels 2017, 10, 186. [Google Scholar] [CrossRef] [PubMed]
  55. Syaichurrozi, I. Biogas production from co-digestion Salvinia molesta and rice straw and kinetics. Renew. Energy 2018, 115, 76–86. [Google Scholar] [CrossRef]
  56. Budych-Gorzna, M.; Smoczynski, M.; Oleskowicz-Popiel, P. Enhancement of biogas production at the municipal wastewater treatment plant by co-digestion with poultry industry waste. Appl. Energy 2016, 161, 387–394. [Google Scholar] [CrossRef]
  57. Tsapekos, P.; Kougias, P.G.; Treu, L.; Campanaro, S.; Angelidaki, I. Process performance and comparative metagenomic analysis during co-digestion of manure and lignocellulosic biomass for biogas production. Appl. Energy 2017, 185, 126–135. [Google Scholar] [CrossRef]
  58. Kashi, S.; Satari, B.; Lundin, M.; Horváth, I.S.; Othman, M. Application of a mixture design to identify the effects of substrates ratios and interactions on anaerobic co-digestion of municipal sludge, grease trap waste, and meat processing waste. J. Environ. Chem. Eng. 2017, 5, 6156–6164. [Google Scholar] [CrossRef]
  59. Maragkaki, A.E.; Fountoulakis, M.; Kyriakou, A.; Lasaridi, K.; Manios, T. Boosting biogas production from sewage sludge by adding small amount of agro-industrial by-products and food waste residues. Waste Manag. 2018, 71, 605–611. [Google Scholar] [CrossRef] [PubMed]
  60. Rughoonundun, H.; Mohee, R.; Holtzapple, M.T. Influence of carbon-to-nitrogen ratio on the mixed-acid fermentation of wastewater sludge and pretreated bagasse. Bioresour. Technol. 2012, 112, 91–97. [Google Scholar] [CrossRef] [PubMed]
  61. Vivekanand, V.; Mulat, D.G.; Eijsink, V.G.H.; Horn, S.J. Synergistic effects of anaerobic co-digestion of whey, manure and fish ensilage. Bioresour. Technol. 2018, 249, 35–41. [Google Scholar] [CrossRef] [PubMed]
  62. Klassen, V.; Blifernez-Klassen, O.; Hoekzema, Y.; Mussgnug, J.H.; Kruse, O. A novel one-stage cultivation/fermentation strategy for improved biogas production with microalgal biomass. J. Biotechnol. 2015, 215, 44–51. [Google Scholar] [CrossRef] [PubMed] [Green Version]
  63. Zhao, M.-X.; Ruan, W.-Q. Biogas performance from co-digestion of Taihu algae and kitchen wastes. Energy Convers. Manag. 2013, 75, 21–24. [Google Scholar] [CrossRef]
  64. Gerardi, M.H. Introduction to Operational Conditions. In The Microbiology of Anaerobic Digesters; John Wiley & Sons, Inc.: Hoboken, NJ, USA, 2003; pp. 77–80. [Google Scholar] [CrossRef]
  65. Yuan, X.; Shi, X.; Zhang, D.; Qiu, Y.; Guo, R.; Wang, L. Biogas production and microcystin biodegradation in anaerobic digestion of blue algae. Energy Environ. Sci. 2011, 4, 1511–1515. [Google Scholar] [CrossRef]
  66. Cheng, J. Biomass to Renewable Energy Processes; CRC Press: Boca Raton, FL, USA, 2009. [Google Scholar]
  67. Veeken, A.; Kalyuzhnyi, S.; Scharff, H.; Hamelers, B. Effect of pH and VFA on Hydrolysis of Organic Solid Waste. J. Environ. Eng. 2000, 126, 1076–1081. [Google Scholar] [CrossRef]
  68. Lu, S.-G.; Imai, T.; Ukita, M.; Sekine, M. Start-up performances of dry anaerobic mesophilic and thermophilic digestions of organic solid wastes. J. Environ. Sci. 2007, 19, 416–420. [Google Scholar] [CrossRef]
  69. Uma Rani, R.; Adish Kumar, S.; Kaliappan, S.; Yeom, I.-T.; Rajesh Banu, J. Enhancing the anaerobic digestion potential of dairy waste activated sludge by two step sono-alkalization pretreatment. Ultrason. Sonochem. 2014, 21, 1065–1074. [Google Scholar] [CrossRef] [PubMed]
  70. Gerardi, M.H. Foam and Scum Production and Accumulation. In The Microbiology of Anaerobic Digesters; John Wiley & Sons, Inc.: Hoboken, NJ, USA, 2003; pp. 127–131. [Google Scholar] [CrossRef]
  71. Gerardi, M.H. Alkalinity and pH. In The Microbiology of Anaerobic Digesters; John Wiley & Son, Inc.: Hoboken, NJ, USA, 2003; pp. 99–103. [Google Scholar] [CrossRef]
  72. Siegert, I.; Banks, C. The effect of volatile fatty acid additions on the anaerobic digestion of cellulose and glucose in batch reactors. Process Biochem. 2005, 40, 3412–3418. [Google Scholar] [CrossRef]
  73. Migliore, G.; Alisi, C.; Sprocati, A.R.; Massi, E.; Ciccoli, R.; Lenzi, M.; Wang, A.; Cremisini, C. Anaerobic digestion of macroalgal biomass and sediments sourced from the Orbetello lagoon, Italy. Biomass Bioenergy 2012, 42, 69–77. [Google Scholar] [CrossRef]
  74. Li, D.; Liu, S.; Mi, L.; Li, Z.; Yuan, Y.; Yan, Z.; Liu, X. Effects of feedstock ratio and organic loading rate on the anaerobic mesophilic co-digestion of rice straw and cow manure. Bioresour. Technol. 2015, 189, 319–326. [Google Scholar] [CrossRef] [PubMed] [Green Version]
  75. Yenigün, O.; Demirel, B. Ammonia inhibition in anaerobic digestion: A review. Process Biochem. 2013, 48, 901–911. [Google Scholar] [CrossRef]
  76. Kotsopoulos, T.A.; Karamanlis, X.; Dotas, D.; Martzopoulos, G.G. The impact of different natural zeolite concentrations on the methane production in thermophilic anaerobic digestion of pig waste. Biosyst. Eng. 2008, 99, 105–111. [Google Scholar] [CrossRef]
  77. Montalvo, S.; Díaz, F.; Guerrero, L.; Sánchez, E.; Borja, R. Effect of particle size and doses of zeolite addition on anaerobic digestion processes of synthetic and piggery wastes. Process Biochem. 2005, 40, 1475–1481. [Google Scholar] [CrossRef]
  78. Vergara-Fernández, A.; Vargas, G.; Alarcón, N.; Velasco, A. Evaluation of marine algae as a source of biogas in a two-stage anaerobic reactor system. Biomass Bioenergy 2008, 32, 338–344. [Google Scholar] [CrossRef] [Green Version]
  79. Bruhn, A.; Dahl, J.; Nielsen, H.B.; Nikolaisen, L.; Rasmussen, M.B.; Markager, S.; Olesen, B.; Arias, C.; Jensen, P.D. Bioenergy potential of Ulva lactuca: Biomass yield, methane production and combustion. Bioresour. Technol. 2011, 102, 2595–2604. [Google Scholar] [CrossRef] [PubMed]
  80. Chen, J.L.; Ortiz, R.; Steele, T.W.J.; Stuckey, D.C. Toxicants inhibiting anaerobic digestion: A review. Biotechnol. Adv. 2014, 32, 1523–1534. [Google Scholar] [CrossRef] [PubMed]
  81. Zhao, C.; Mu, H.; Zhao, Y.; Wang, L.; Zuo, B. Microbial characteristics analysis and kinetic studies on substrate composition to methane after microbial and nutritional regulation of fruit and vegetable wastes anaerobic digestion. Bioresour. Technol. 2018, 249, 315–321. [Google Scholar] [CrossRef] [PubMed]
  82. Altaş, L. Inhibitory effect of heavy metals on methane-producing anaerobic granular sludge. J. Hazard. Mater. 2009, 162, 1551–1556. [Google Scholar] [CrossRef] [PubMed]
Figure 1. Photos illustrating the whole Laminaria japonica plant, and the two types of alginate industrial waste used in the study.
Sustainability 11 01269 g001
Figure 2. Schematic illustration of the experimental setup.
Sustainability 11 01269 g002
Figure 3. Daily biogas production during anaerobic digestion (AD) for mono- and co-digestion, (a) for AEWLJ/RS arrays and (b) for NAEWLJ/RS arrays.
Sustainability 11 01269 g003
Figure 4. Profiles of pH values during AD for mono- and co-digestion (a) for AEWLJ/RS arrays and (b) for NAEWLJ/RS arrays.
Sustainability 11 01269 g004
Figure 5. Profiles of volatile fatty acids (VFAs) and total ammonia nitrogen (TAN) during AD for mono- and co-digestion: (a) and (b) for AEWLJ/RS arrays, (c) and (d) for NAEWLJ/RS arrays.
Sustainability 11 01269 g005
Figure 6. The plot of measured and predicted methane yield using a modified Gompertz model for (a) AEWLJ/RS arrays and (b) NAEWLJ/RS arrays.
Sustainability 11 01269 g006
Table 1. Characteristics of substrates (AEWLJ, NAEWLJ, and RS) and seed sludge applied for the test.
CharacteristicUnitsSubstratesSeed Sludge
AEWLJNAEWLJRS
TS%(DW)87 ± 0.3684 ± 0.2593 ± 0.389 ± 0.05
TOC%30 ± 3.5729 ± 3.6350 ± 0.32NT
TN%2 ± 0.592 ± 0.161 ± 0.11NT
OM%51 ± 6.1550 ± 6.2786 ± 0.55NT
C/N ratio%13 ± 3.4812 ± 0.7548 ± 4.81NT
VS%66 ± 0.3476 ± 0.7589 ± 0.3147 ± 0.36
Ash%34 ± 0.3424 ± 0.7511 ± 0.3053 ± 0.36
VS/TS ratio%76 ± 0.5590 ± 0.7296 ± 0.27NT
Table 2. Mixing ratio of alginate-extracted waste of Laminaria japonica/rice straw AEWLJ /RS, gross carbon/nitrogen (C/N) ratio, and synergetic effects on methane yield.
TreatmentCo-Digestion Ratio (%,TS Basis)Substrate Concentration (gTS/L)Gross C/N Ratio (%)Total mono Calculated CH4 of IS (NmL/gVS)Cumulative Experimental CH4 (NmL/gVS)Methane Improvement (%)
AEWLJ/RSAEWLJRS
P1100% (1:0)48013 ± 3.488282 ± 6.150
P267% (2:1)321619 ± 4.1475134 ± 6.87+78
P350% (1:1)242424 ± 4.2672125 ± 14.23+74
P433% (1:2)163229 ± 4.0569100 ± 22.16+46
RS0% (0:1)04848 ± 4.8162620
IS; individual substrate, ± STDEV after three replicates.
Table 3. Mixing ratio of non-extracted waste of Laminaria japonica/rice straw (NAEWLJ /RS); gross C/N ratio, and synergetic effects on methane yield.
TreatmentCo-Digestion Ratio (%,TS Basis)Substrate Concentration (gTS/L)Gross C/N Ratio (%)Total mono Calculated CH4 of IS (NmL/gVS)Cumulative Experimental CH4 (NmL/gVS)Methane Improvement (%)
NAEWLJ/RSNAEWLJRS
F1100% (1:0)48012 ± 0.754545 ± 5.170
F267% (2:1)321619 ± 0.565195 ± 5.90+88
F350% (1:1)242423 ± 0.895491 ± 13.85+70
F433% (1:2)163229 ± 1.566574 ± 6.82+32
IS; individual substrate, ± STDEV after three replicates.

