Article

The Impact of Warranty Efficiency of Remanufactured Products on Production Decisions and Green Growth Performance in Closed-Loop Supply Chain: Perspective of Consumer Behavior

1
School of Management Science and Engineering, Nanjing University of Information Science and Technology, Nanjing 210044, China
2
China Institute of Manufacturing Development, Nanjing University of Information Science and Technology, Nanjing 210044, China
*
Author to whom correspondence should be addressed.
Sustainability 2019, 11(5), 1420; https://0-doi-org.brum.beds.ac.uk/10.3390/su11051420
Submission received: 28 January 2019 / Revised: 22 February 2019 / Accepted: 28 February 2019 / Published: 7 March 2019
(This article belongs to the Special Issue Sustainability in Supply Chains with Behavioral Concerns)

Abstract

:
Consumers cannot fully assess the quality of remanufactured products prior to purchase. To reduce consumer risk, closed-loop supply chains adopt a warranty strategy to enhance perceived value among customers and stimulate green growth. Based on Stackelberg game theory and considering consumers’ low-carbon and remanufactured product preferences, this paper aims to explore the decision-making efficiency of closed-loop supply chains with warranty services. The results of the study show that consumers’ confidence in purchasing remanufactured products has increased the demand for new products and remanufactured products, in turn also increasing the interest of the member companies of the supply chain, and stimulating the realization of the potential value of remanufacturing, which is conducive to green growth. When a remanufactured product warranty period meets certain conditions, the member companies of the supply chain can obtain optimal profit. The optimal warranty entity selection of a closed-loop supply chain with a warranty service depends on the warranty efficiency of each entity, thus making it necessary to examine the products of each warranty party.

1. Introduction

Technological advancements and significant growth in market demand have led to the accelerated entry of new products into the market, while generating a large number of waste products. On account of their End of Life (EOL), certain products contain environmentally destructive substances (such as arsenic, cadmium, lead, etc.), meaning that the environmental problems caused by the improper disposal of EOL products have grown serious. On the other hand, their valuable and recyclable raw materials enable EOL products to effectively promote environmental sustainability and achieve green growth through the recycling of resources (Song et al., 2018; Tseng et al., 2018 [1,2]). Globally, many relevant regulations and directives (such as the Waste Electrical and Electronic Equipment (WEEE) Directive) explicitly require manufacturers to assume responsibility for the proper recovery and disposal of EOL products. These policies are designed to regulate market entities as much as possible, motivating them to recycle the residual value of certain products and increase the efficiency of resource utilization. Even without policy factors, companies today are recycling their waste products, driven by environmental activism and performance factors and also in order to take full advantage of economic potential and enhance the company’s green brand image. As such, constructing and improving the recycling system of waste products can be seen as an inevitable choice in the context of sustainable resource management.
The re-manufacturing of the closed-loop supply chain management model of “resources-products- waste products-remanufactured products” enables waste products to be professionally restored to the same quality and performance as new products, and is considered to be the most valuable product recycling method. Compared with new products, remanufactured products can save up to 50% of costs, up to 60% of energy, and up to 70% of materials, reducing pollutant emissions by up to 80% (Ostojic, 2016 [3]). Many companies, including Hewlett-Packard, Epson, IBM and Xerox have created a significant competitive advantage for themselves through remanufacturing. The value of remanufactured products is primarily achieved through resale. US International Trade Commission (USITC) data show that in 2011, US remanufactured products sold for as much as $43 billion, accounting for 2% of annual manufacturing sales (United, 2012). However, despite demonstrating substantial economic and environmental value, remanufacturing has also created a series of dilemmas (Dung T. Mai et al., 2017 [4]). The main dilemma is that the uncertainty of the remanufacturing system leads to differences in consumers’ willingness to pay (WTP) for remanufactured products and new products. Consumers see remanufactured products as inferior, while retaining their willingness to pay, which limits market demand to a large extent and hinders the realization of the potential value of remanufacturing (Wang Z. et al., 2018 [5]). To stimulate market demand for remanufactured products and expand green growth, supply chain management technology innovations are needed in order to develop effective and differentiated remanufacturing decisions.
Warranty mechanisms, acting as a kind of signal game, encompass the obligation or warranty provided by the guarantor, such as the manufacturer retailer, or supply chain system, to the consumer in terms of the technical performance, use effect, and maintenance of the product during the product sales process. Warranty can be a valuable tool in marketing, which enables faster green growth (Alqahtani et al., 2017 [6]). This is due to the fact that, first, consumers can rely on a warranty to predict the quality of remanufactured products and so protect consumer rights. Secondly, having a warranty is one of the indicators of remanufactured product reliability, which can reduce consumer risk; in addition, effective warranty policies can enhance customers’ perceived value of the product and stimulate market demand (Shafiee et al., 2017 [7]). Clarence, Ford and Japanese companies have participated in the warranty war and enabled a high additional sales performance in their respective companies (Li B et al., 2017 [8]). The efficiency of a particular product warranty (related to the cost and period of the warranty entity) becomes very important to a supply chain. Logically, the length of the commitment period and the reliability of the product (related to its life cycle distribution) play a key role in determining the total cost of the product, and these additional costs have a significant impact on the total profit of the supply chain. A satisfactory warranty policy will increase consumer willingness to purchase remanufactured products while also contributing to sustainability and resource efficiency. However, the supply chain must balance the warranty inputs and benefits in order to maximize efficiency. In light of this, we introduce consumer factors into the warranty decision for remanufactured products, and that consumers’ perceived value of a product is related to the duration of the warranty. The purpose of the current study is to explore the impact of different conditions of warranty costs on supply chain operations decisions, production decisions, and performance.
In particular, we provide insights into the following questions: (1) How should a remanufacturing closed-loop supply chain select an optimal combination strategy for the warranty entity under differentiated warranty costs? (2) Under the selected supply chain warranty operation mode, how will the member companies seek to warranty the equilibrium point of key decision factors in order to achieve the optimal warranty efficiency? (3) What is the impact of consumer behavior on the green growth of closed-loop supply chain performance with warranty services, under the selected supply chain warranty operating model?
In order to solve the above problems, we constructed a single-stage, closed-loop supply chain model based on game theory, and studied three different cases: (1) model M with the manufacturer as the warranty subject; (2) model R with the retailer as the warranty subject; (3) model C using the supply chain system as the main body of the warranty. The first two decision models were manufacturer-led Stackelberg games, with the warranty providers in each model holding different warranty costs. In order to evaluate the combination strategy of the warranty entity, we obtained the floating range of the warranty cost under different models by solving the equilibrium solution, which provided a decision reference for the operation mode of the supply chain. In order to explore the decision conditions of the key factors of the closed-loop supply chain warranty, we separately compared the optimal pricing decisions and the warranty period of new products and remanufactured products under each model. In order to better study the changes in corporate profits after introducing consumer behavior factors into the closed-loop supply chain with warranty services, we constructed a demand function model based on consumer preferences and compared the changes in green growth performance under each model. The purpose of this paper is to maximize the efficiency of supply chain warranties and maximize consumer confidence in the purchase of remanufactured products, thereby stimulating the realization of the potential value of remanufacturing, which can, in turn, contribute to green growth. In the context of economic growth and environmental sustainability, the impact of warranty efficiency on optimal decision-making and profitability in a closed-loop supply chain may be seen as significant.
In line with the principles of sustainable manufacturing, this paper deals with the relationship between consumer preferences and supply chain performance under game theory. The remainder of this paper is organized as follows. Section 2 provides a literature review of theoretical and empirical research related to supply chain pricing decisions, the operation of warranty strategies, and consumer behavior. We present the problem description and model assumptions in Section 3. The fourth section details the numerical simulation and the nature analysis carried out to show the application of the model. The fifth section concludes the paper and outlines directions for future research.

2. Literature Review

In this section, we review the literature focusing on three issues related to decision making and warranty in a closed-loop supply chain. This section begins with a review of the relevant literature on consumer preferences. Following this, the literature on recycling and pricing decisions in a closed-loop supply chain is analyzed. Finally, we provide a review of the literature on warranty operational decisions, which primarily focuses on the warranty period and product life cycle.

2.1. Consumer Preferences

Consumers have different preferences for new and remanufactured products. As demonstrated in Hopp’s (2004 [9]) published article on behavior in the top management journal Management Science, the behavioral preferences of various subjects in the supply chain have begun to enter the research horizon. As a result, consumer behavior decisions have also attracted the attention of many scholars. For example, Jimenez-Parra et al. (2014 [10]) conducted an empirical analysis of the key variables of potential consumers’ purchasing intentions, and determined the basic characteristics of the potential consumer profile of remanufactured products. Lei et al. (2017 [11]) research found that a company will dynamically price its products over time, whereby its warranty service allows consumers to understand the reliability of the product based on the price of the warranty. In a sense, the consumer’s buying beliefs are consistent with the company’s warranty policy. Zhang and He (2018 [12]) designed a consumer utility function based on consumers’ different purchasing intentions for new and remanufactured products, considering a centralized system consisting of one manufacturer and one retailer to study the optimal pricing strategy for new products and remanufactured products. Wang et al. (2018 [13]) provide a theoretical basis for understanding the values associated with consumers and remanufactured products. Genc, Talat and Giovanni (2018 [14]) within the framework of closed-loop supply chain, several consumer returns for second-hand products based on product prices and discounts were studied. In addition, they also showed how consumer regression behavior affects the dynamic nature of the game. A study by Zhu and Yu (2018 [15]) found that consumers pay attention to the level of service when purchasing electronic products; these authors paid attention to consumer purchase behavior and used the Stackelberg game to prove consumer preferences. Research shows that consumer preferences affect the pricing of remanufactured and refurbished products to a large extent Bai et al., (2018 [16]), in the context of closed-loop supply chains, discuss the impact of recycling services on new mobile phone sales from the perspective of consumers, and introduce the impact on China. Researching the key factors behind consumer attitudes and behaviors, Wu et al., (2018 [17]) found that consumers’ perceptions of product innovations have evolved over time. Liao and Li (2018 [18]) constructed two categories of consumer neutral and aversive consumption in the market. Uncertainty in consumer valuation and demand solve the problem of closed-loop supply chain and remanufacturing through game theory, and analyze the market demand by introducing utility function, and finally determine the optimal pricing and channel strategy to maximize the profit of manufacturers. Different from the above research, we seek to understand the optimal conditions of warranty decision-making for green growth performance in a closed-loop supply chain, and to determine the difference between new products and remanufactured products from the perspective of consumer preferences.

2.2. Closed-Loop Supply Chain

The closed-loop supply chain issues covered in this paper focus on product recycling and pricing decisions. Savaska et al. (2004 [19]) studied the pricing strategies and system efficiencies of three different receivable structures under the condition of demand determination. The study concluded that the seller being responsible for the recycling of waste products is the most effective way. Shaharudin et al. (2018 [20]) hold that the relationship between recovery and integration functions and closed-loop supply chain adoption is partially regulated by the quantity, type, time, and quality of product returns. Taleizadeh et al. (2018 [21]) considered a multi-cycle, multi-level, sustainable closed-loop supply chain that uses discounted returns as incentives to improve supply chain refurbished product recovery, helps improving sustainability effectively. Chen et al. (2012 [22]) undertook the review of issues related to the manufacturer’s pricing strategy in the chain, consisting of one manufacturer and two competing retailers with warranty-related requirements. Xu et al. (2018 [23]) explore the decision strategy and profit distribution of CLSC with retail price and emission reduction dependent demand, and research on the basis of Nash bargaining theory, they use the degree of satisfaction as an objective function and examine the feasibility of coordination mechanism. Zou et al. (2018 [24]) applied game theory to explore wholesale price under decentralized and centralized decision-making. By examining optimal decision making on prices, retail prices and recycling prices, and through analysis and coordination of price competition and risk aversion, Zou et al. proposed a revenue sharing contract to achieve the coordination of a closed-loop supply chain. Alamdar et al. (2018 [25]) studied one manufacturer, a fuzzy closed-loop supply chain (CLSC) for retailers, and a collector. Their paper analyzed the optimal decision-making problem based on fuzzy price and sales effort relying on demand, established six game theory models, and used game and fuzzy theory to extract and compare optimal solutions. Zhang et al. (2016 [26]) considered one original manufacturer, a third party and a closed-loop supply chain system for manufacturers and retailers. They established a leader-follower game model and a joint decision model, and compared the performance of closed-loop supply chain components. In addition, a pricing mechanism that perfectly coordinates the closed-loop supply chain has been developed. Saha et al. (2016 [27]) developed mathematical models for non-cooperative and centralized scenarios to characterize pricing decisions and remanufacturing strategies, and coordinated overall supply chain performance, they also provide manufacturers with a three-way discount mechanism to coordinate and achieve win-win results for channel members. Cerchione et al. (2017 [28]) studied the relationship between supply chain sustainability performance drivers based on 358 SME data, provided practical management insights for SMEs’ sustainable procurement and design operational decisions. The current study differs from the above in two respects. We consider consumer behavior theory in the decision-making model of a closed-loop supply chain, which has been given little attention in the aforementioned studies. In addition, we determine the decision of the closed-loop supply chain from the perspective of warrantying operational decisions.

2.3. Warranty Operational Decisions

The warranty strategies covered in this paper mainly focus on the warranty period and the product life cycle. In order to study how two important and closely related decisions pertaining to product quality and warranty scope interact and influence supply chain performance, Dai et al. (2012 [29]) developed a single-period model to analyze decentralized systems and identify the structural characteristics of the equilibrium strategy. Bian (2015 [30]) studied the warranty strategy in a two-stage supply chain consisting of manufacturers and two competing retailers, using the game model to explore the interaction between the two warranties and the competition between retailers. Qin et al. (2017 [31]) explored the issue of extended warranty and management strategies in a three-level, competitive online shopping supply chain, with price and basic warranty related requirements. They also applied game theory to develop decision models in order to explore interactions and competition between component suppliers and manufacturers. Wang et al. (2017 [32]) surveyed cooperative and non-cooperative interactions between manufacturers and consumers based on Base Warranty and Extended Warranty. During the Base Warranty period, Wang et al. proposed a new upgrade model in which the cost of Preventive Maintenance is shared by both parties. During the Extended Warranty period, two upgrade models were constructed and the revenue function was analyzed. The game theory method was then used to analyze the profit maximization and cost minimization of both parties. In recent years, only a small number of studies have included product warranty factors within research on remanufacturing systems. Zhu X et al. (2018 [33]) considered the decision of extended warranty pricing, based on game theory to study the impact of key decision factors on the closed-loop supply chain with warranty services, and used the revenue sharing contract and two charge contracts to coordinate the double marginalization effects of the supply chain respectively. However, the scope of their results analysis is arguably too narrow, and the decision-making combination of warranty entities and warranty channels has not been sufficiently investigated.
In summary, scholars have studied the decision-making of warranty operation in the traditional supply chain market. However, the integration of the warranty system into the closed-loop supply chain system still faces decision-making optimization issue. The reality of re-manufacturing warranty decision remains to be further studied; in addition, consumer behavior directly affects market capacity, and some existing research on closed-loop supply chains ignores the impact of consumer behavior factors on market demand. The main contribution of this research is to provide theoretical insights into how re-manufacturing and closed-loop supply chain systems can stimulate the effective transformation of supply chain value and promote sustainable economy through warranties. It is hoped that this theoretical insight will extend the literature on supply chains and warranties in multiple directions: firstly, in terms of market demand model construction, we describe consumers’ diverse preferences for new and remanufactured products, and examine how these preferences affect the decision-making and profitability of supply chain member companies in different modes. Secondly, we propose a new warranty for the warranty operation of the closed-loop supply chain with a warranty service, by studying the warranty efficiency (related to the cost and period of the warranty entity), this expands the current related research.

3. Problem Description and Assumptions

3.1. Problem Description

This paper studies a single-stage remanufacturing closed-loop supply chain system consisting of a single producer and a single retailer, where manufacturers and retailers are risk-neutral and completely rational, according to (Savaskan et al., 2004). When an EOL product is recycled by the seller, the efficiency of the closed-loop supply chain is optimal. In light of this, the current paper also adopts the supply chain model of the retailer recycling EOL products. The retailer recycles the EOL product from the consumer at a unit price of p t and transfers it to the manufacturer at a unit price of p m . The manufacturer remanufactures the repurchased EOL product to form a remanufactured product. The unit price is ω i ( i { n , r } , n for new products, and r for remanufactured products), all wholesale to retailers; retailers at unit retail price p i , ( i { n , r } ) sell the product to the market, and the consumer then receives a warranty of t i , ( i { n , r } ) at the same time as the product is purchased. The warranty service provider may be a manufacturer, a retailer, or a centralized remanufacturing closed-loop supply chain system composed of the two. For the purposes of the current study, this resulted in three remanufacturing closed-loop supply chain product warranty models: (1) where the manufacturer provides a product warranty model (M model); (2) where the retailer provides a product warranty model (R model); and (3) where the remanufacturing system provides a product warranty model (C) model, as shown in Figure 1. Definitions of variables are shown in Table 1.

3.2. Assumptions

Assumption 1: Manufacturers and retailers have a Stackelberg game relationship, and manufacturers are supply chain leaders; manufacturers and retailers are risk-neutral and in the game of complete information.
Assumption 2: As new products and remanufactured products have the same qualities, in order to distinguish between them remanufactured products will be labeled as “remanufactured” products, and consumers will have a different level of willingness to pay for them.
Assumption 3: The number of EOL products recycled by retailers can meet the manufacturer’s production needs for remanufactured products.
Assumption 4: The new product unit cost is c n , the unit cost of the remanufactured product is c r , and the warranty period is t i , ( i { n , r } ) , according to Li et al. (2012 [34]), the failure rate of each product during the re-warranty period is δ t i 2 , δ is a constant, and δ > 2 , γ j > 0 represent the average cost of repair or replacement of each unit’s remanufactured product for failure, the cost of providing a warranty for each unit of remanufactured product is k j t i 2 , ( k j = δ γ j > 0 , j { m , r } , representing the manufacturer’s warranty and the retailer’s warranty respectively.
Assumption 5: The potential market size of the product is Q, and the consumer’s value for the new product is evaluated as α , subject to a uniform distribution of U ( 0 , Q ) . The consumer’s recognition of the remanufactured product is θ ( 0 < θ < 1 ) , and the consumer’s value for the remanufactured product can be evaluated as α θ . Consumer demand decreases as product prices increase and increase with the extension of the warranty period. Therefore, the net utility of the consumer’s purchase of the new product can be expressed as μ n = α p n + λ t n , while the net utility of the remanufactured product can be expressed as μ r = α θ p r + λ t r ( λ > 0 indicates the influence coefficient of the warranty period on demand).
According to Zhu and Yu (2018 [17]) method of analysis, product demand is judged by consumer utility; that is, when p n λ t n + λ t r + α 1 < p r < α ( p n λ t n ) + λ t r is satisfied, and there is a demand for new products and remanufactured products, the demand functions of the new product and the remanufactured product can, respectively, be expressed as:
q n = p n λ t n p r + λ t r 1 θ Q 1 d α
q r = p r λ t r θ p n λ t n p r + λ t r 1 θ 1 d α
Note: In the following, the superscripts “c”, “d” and “r” in the variables represent model C, model M and model R, respectively. The superscript “*” indicates the optimal decision result, while subscript “M”, “R”, “S” represent manufacturers, retailers and remanufacturing systems. Notations are shown in Table 2.

4. Model Solving and Analysis

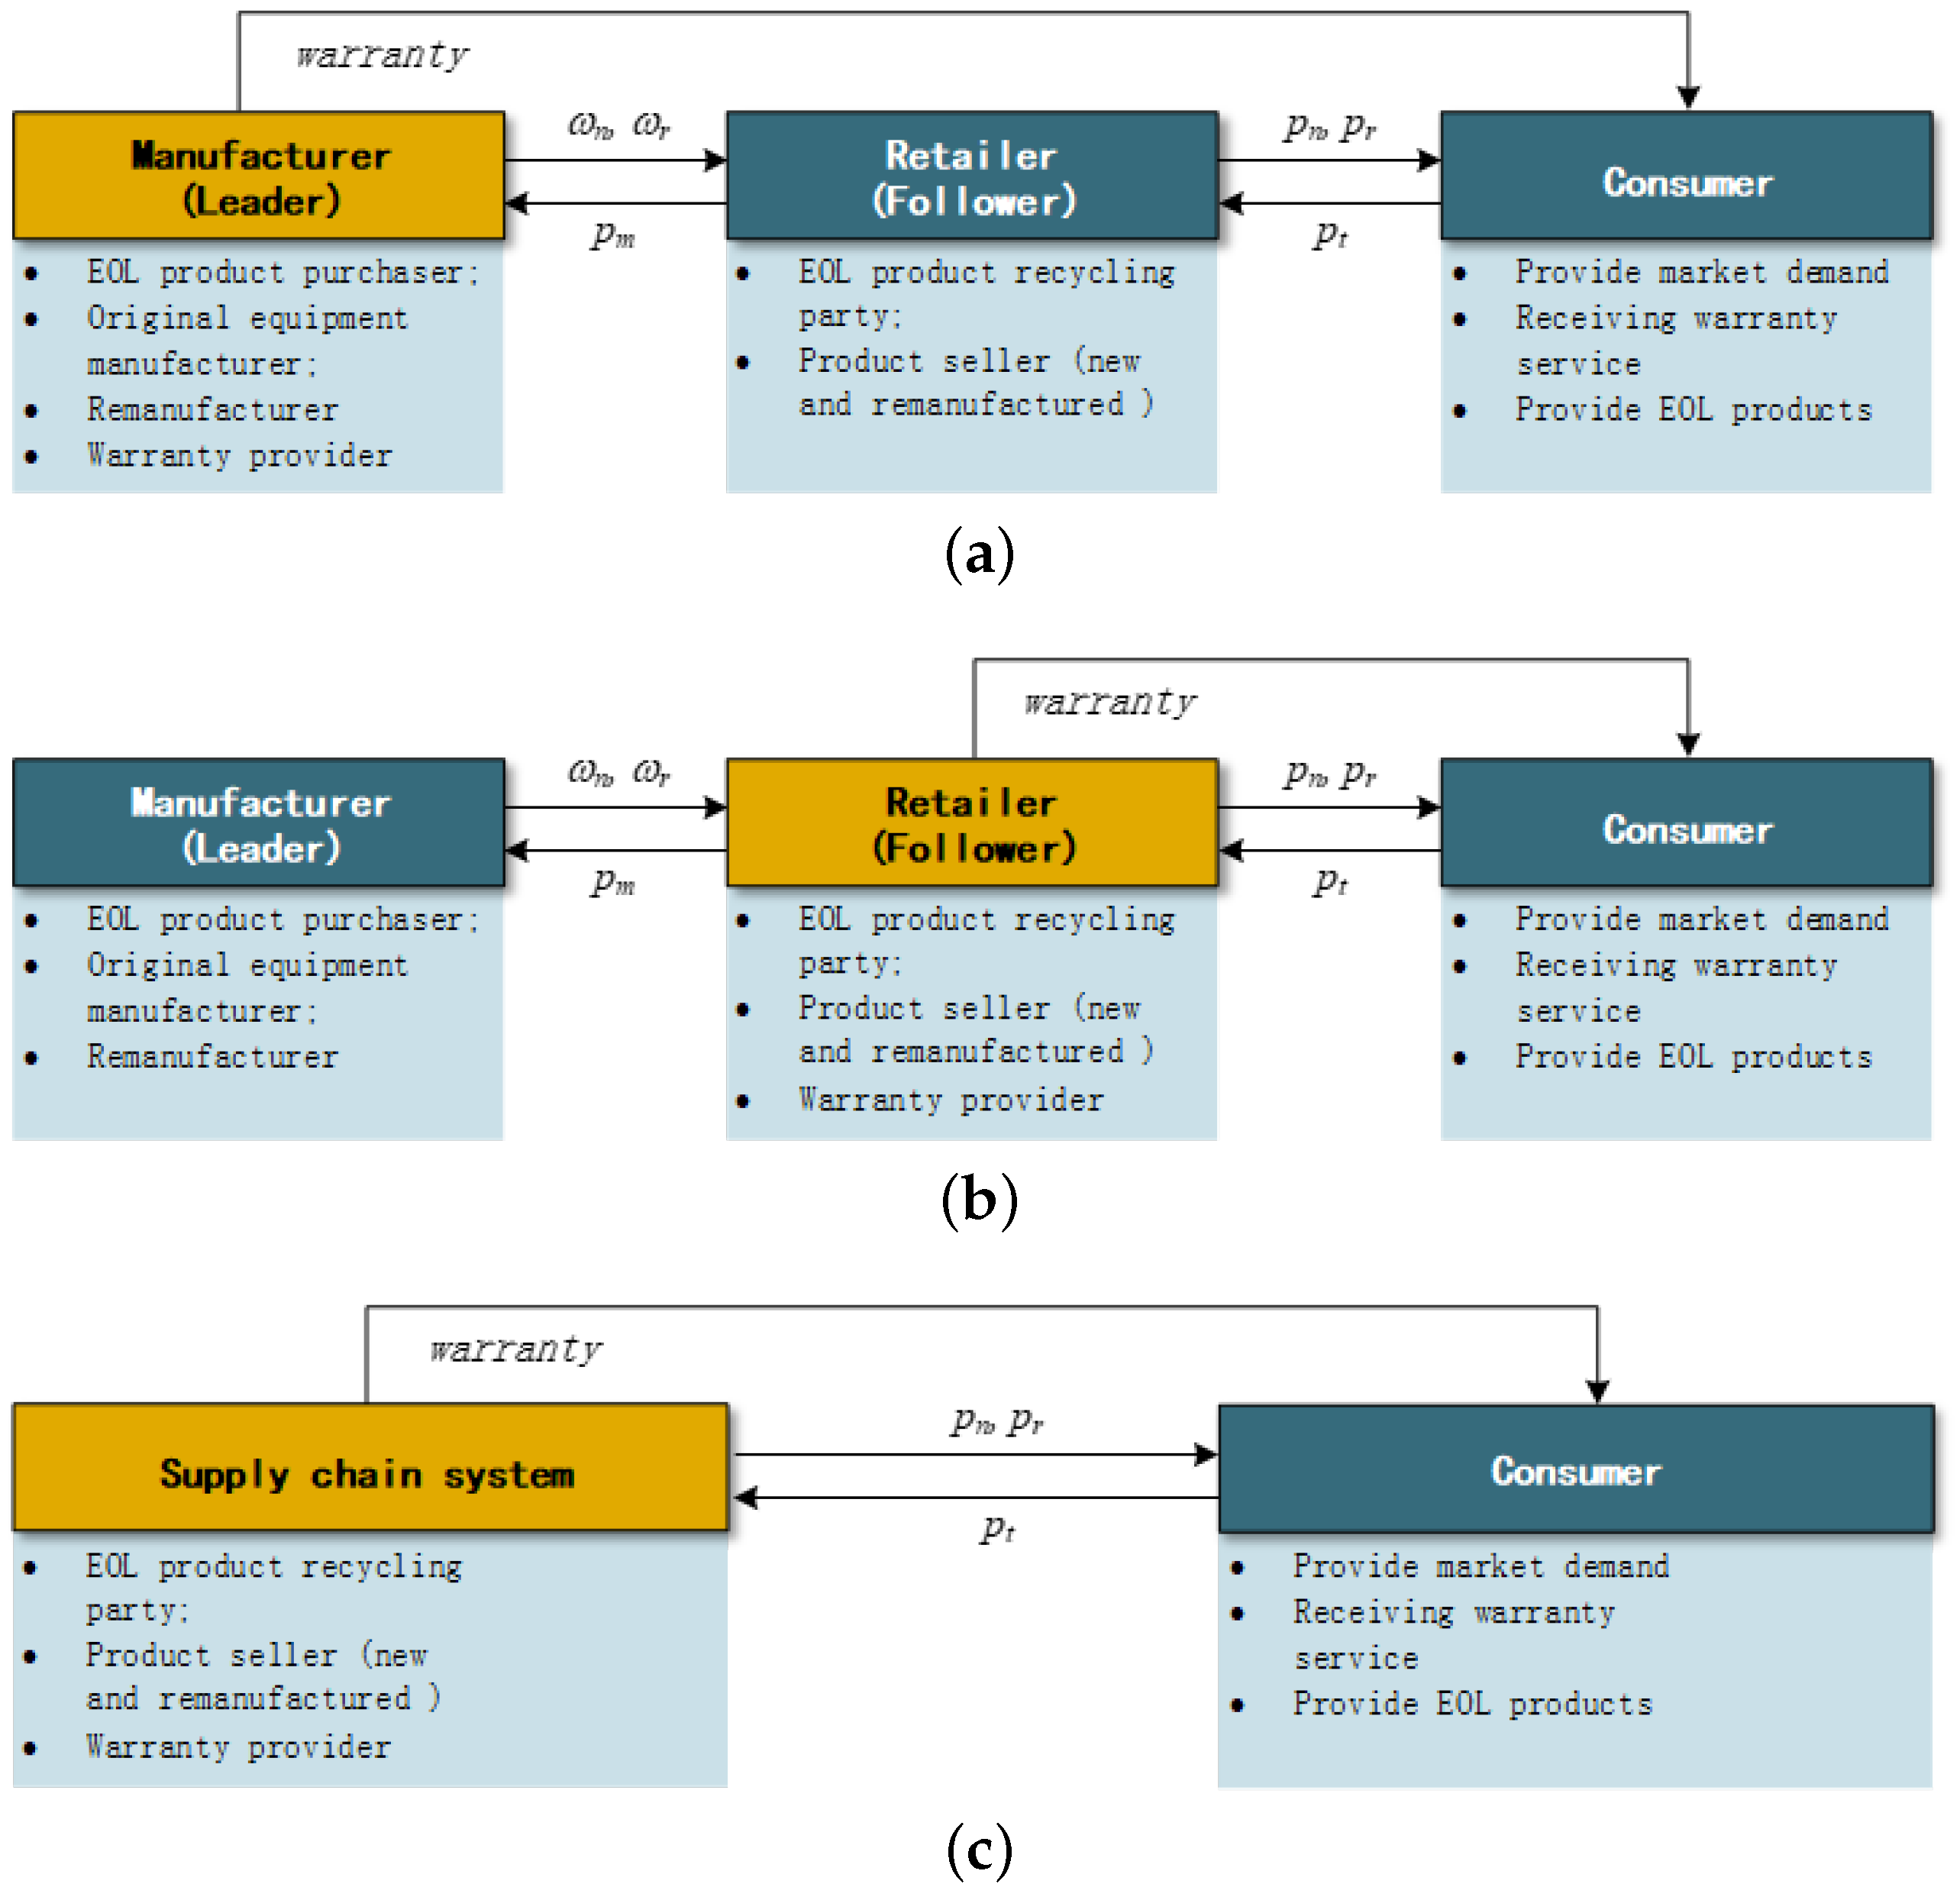
4.1. Manufacturer Provides a Warranty Service (Model M)

When manufacturers provide product warranty services, manufacturers and retailers alike maximize their respective interests in the market. In the manufacturer-led Stackelberg game model, the manufacturer first considers the retailer’s optimal response function in order to determine the wholesale price ω i and the warranty period t i , and the retailer determines their sales price p i based on the manufacturer’s decision. The subsequent decision model can thus be expressed as:
max ω n , ω r , t n , t r Π M d = p n λ t n p r + λ t r 1 θ Q ω n c n k m t n 2 d α + p r λ t r θ p n λ t n p r + λ t r 1 θ ω r c r p m k m t r 2 d α max p n , p r Π R d = p n λ t n p r + λ t r 1 θ Q p n ω n d α + p r λ t r θ p n λ t n p r + λ t r 1 θ p m + p r p t ω r d α
Part 1 of Model 3 is the revenue earned by the manufacturer from selling the new product, and the second part is the revenue from the sale of the remanufactured product. The constraint is the sales price selected by the retailer under the maximization of the objective function. Proposal 1 can be obtained by solving model (3), by combining Equations (1) and (2).
Proposition 1.
In Model M, the optimal wholesale and retail prices for new and remanufactured products can be calculated as follows:
p n d = 1 4 c n + k m t n 2 + 3 λ t n + 3 Q
p r d = 1 4 c r + k m t r 2 + p t + 3 θ Q + 3 λ t r
ω n d = 1 2 c n + t n k m t n + λ + Q
ω r d = 1 2 c r + t r k m t r + λ + 2 p m p t + θ Q
By substituting the above optimal decision results into Equations (1)–(3), the optimal production quantities under model M can be obtained by q n d and q r d , and the optimum profit for manufacturers and retailers by Π M d and Π R d .
Proof. 
Regarding Π R d , it is clear that Π R d ( p n , p r ) is a strict concave function for p n and p r , and that there exists a unique optimal solution. Substituting the sales price of new and remanufactured products by p n and p r into Π M d , by deriving, Π M d ( ω n , ω r , t n , t r ) is a strict concave function for ω n , ω r , t n and t r , yielding a unique optimal solution. In line with the inverse induction method, the optimal decision result in Proposition 1 can be achieved and the certificate completed. □
The optimal decision result of Proposition 2 was analyzed according to the value range of the relevant parameters, and Inference 1 was obtained, as follows.
Inference 1.
In model M:
1. ω n d , p n d and q n d have no relevance to consumer preference θ ;
2. ω r d , p r d and q r d increase with an increase of consumer preference θ ;
3. ω n d , p n d decreases as k m increases; ω r d , p r d decreases as k m increase.
Proposition 2.
The warranty period for the manufacturer in Model M to guarantee the product can be expressed as:
t n 0 , 4 k m Q c n + λ 2 + λ 2 k m
t r 0 , λ 2 4 k m c r + p t + θ ( Q ) + λ 2 k m
When t n = t n = λ 2 k m , q n d reaches the maximum point:
q n d = c n + c r + p t θ Q + Q 4 4 θ
When t r = t r = λ 2 k m , q r d reaches the minimum point:
q r d = 4 k m θ c n + c r + p t + ( θ 1 ) λ 2 16 ( θ 1 ) θ k m
Inference 2.
In model M:
1. When 0 t n t n , q n d increases with an increase of t m ; when t n t n 4 k m Q c n + λ 2 + λ 2 k m , q n d decreases with an increase of t n .
2. When 0 t r t r , q r d decreases with the increase of t r ; when t r t r λ 2 4 k m c r + p t + θ ( Q ) + λ 2 k m , q r d increases with the increase of t r .
Proof. 
From q n t n = λ 2 k m t n 4 4 θ , 2 q n t n 2 = k m 2 ( θ 1 ) < 0 ; q r t r = λ 2 k m t r 4 θ 4 θ 2 , 2 q n t n 2 = k m 2 ( θ 1 ) θ < 0 , it can be concluded that when q n t n = 0 , q r t r = 0 , that is, when t n = t n = λ 2 k m , t r = t r = λ 2 k m , q n d , q r d adopts the maximum value, and the value ranges of t n and t r can be obtained from Formulas (10) and (11). The certificate is completed. □
Proposition 3.
When t n = t n = λ 2 k m , t r = t r = λ 2 k m , Π M d , Π R d yields extreme values, respectively:
Π M d = 16 k m 2 θ c n 2 + 2 θ c n ϕ + Q c r + p t 2 + η θ Q 2 8 η λ 2 k m ϕ + η λ 4 128 η θ k m 2
Π R d = 16 k m 2 θ c n 2 + 2 θ c n ϕ + Q c r + p t 2 + η θ Q 2 8 η λ 2 k m ϕ + η λ 4 256 η θ k m 2
Note: To simplify the display, let η = ( θ 1 ) , ϕ = ( c r + p t θ Q ) .
1. When 0 t n t n d , Π M d increases with the increase of t n ; when t n d t n 4 k m Q c n + λ 2 + λ 2 k m , Π M d , Π R d decreases with the increase of t n .
2. When 0 t r t r , Π R d decreases with the increase of t r ; when t r t r λ 2 4 k m c r + p t + θ ( Q ) + λ 2 k m , Π M d , Π R d increases with the increase of t r .

4.2. Retailer Provides a Warranty Service (Model R)

When retailers provide product warranty services, manufacturers and retailers maximize their respective interests in the market. In the manufacturer-led Stackelberg game model, the manufacturer first considers the retailer’s optimal response function in order to determine the wholesale price ω i , and the retailer determines their sales price p i and the warranty period t i based on the manufacturer’s decision. The consequent decision model can be expressed as follows:
max ω n , ω r Π M = p n λ t n p r + λ t r 1 θ Q ω n c n d α + p r λ t r θ p n λ t n p r + λ t r 1 θ ω r c r p m d α max p n , p r , t n , t r Π R = p n λ t n p r + λ t r 1 θ Q p n ω n k r t n 2 d α + p r λ t r θ p n λ t n p r + λ t r 1 θ p r p t ω r + p m k r t r 2 d α
Part 1 of Model 14 is the revenue earned by the manufacturer from selling the new product, while the second part is the revenue from the sale of the remanufactured product. The constraint is the sales price selected by the retailer under the maximization of the objective function. Model 14 can be solved by combining Equations (1) and (2), in order to obtain Proposition 4.
Proposition 4.
In Model R, the optimal wholesale price and retail price for new and remanufactured products can be expressed as follows:
p n r = 1 4 c n + k r t n 2 + 3 λ t n + 3 Q
p r r = 1 4 c r + k r t r 2 + p t + 3 θ Q + 3 λ t r
ω n r = 1 2 c n + t n λ k r t n + Q
ω r r = 1 2 c r + t r λ k r t r + 2 p m p t + θ Q
By substituting the above optimal decision results into Equations (1), (2) and (14), the optimal production quantities under model R can be obtained by q n r and q r r , and the best profit for manufacturers and retailers by Π M r and Π R r .
Proof. 
By solving the derivative for Π R r , it becomes evident that Π R r ( p n , p r , t n , t r ) is a strict concave function for p n , p r , t n and t r , the objective function has a unique optimal solution. The sales price of new and remanufactured products is given by p n and p r into Π M r . By deriving, Π M r ( ω n , ω r ) appears as a strict concave function for ω n , ω r , and there arises a unique optimal solution. The optimal decision result in Proposition 4 can thus be obtained according to the inverse induction method, whereby the certificate is completed. □
The optimal decision result of Proposition 2 was analyzed in line with the value range of the relevant parameters, and Inference 3 obtained.
Inference 3.
In model R:
1. ω n r , p n r and q n r have no relevance to consumer preference θ .
2. ω r r , p r r and q r r increase with the increase of consumer preference θ .
3. ω n r , p n r decreases as k r increases; ω r r , p r r decreases as k r increase.
Proposition 5.
The warranty period for the manufacturer to warranty the product in Model R is:
t n 0 , 4 k r c n + Q + λ 2 + λ 2 k r
t r 0 , 1 2 4 k r c r + 2 p m p t + θ Q + λ 2 k r 2 + λ 2 k r
When t n = t n = λ 2 k r , q n r reaches the maximum point:
q n r = c n + c r + p t θ Q + Q 4 4 θ
When t r = t r = λ 2 k r , q r r reaches the minimum point:
q r r = 4 k r θ c n + c r + p t + ( θ 1 ) λ 2 16 ( θ 1 ) θ k r
Inference 4.
In model R:
1. When 0 t n t n , q n d increases with the increase of t m ; when t n t n 4 k r c n + Q + λ 2 + λ 2 k r , q n d decreases with the increase of t n .
2. When 0 t r t r , q r d decreases with the increase of t r ; when t r t r 1 2 4 k r c r + 2 p m p t + θ Q + λ 2 k r 2 + λ 2 k r , q r d increases with the increase of t r .
Proof. 
From q n t n = λ 2 k r t n 4 4 θ , 2 q n t n 2 = k r 2 ( θ 1 ) < 0 ; q r t r = λ 2 k r t r 4 θ 4 θ 2 , 2 q n t n 2 = k r 2 ( θ 1 ) θ < 0 , it can be concluded that when q n t n = 0 , q r t r = 0 , that is, when t n = t n = λ 2 k r , t r = t r = λ 2 k r , q n r , q r r takes the maximum value, and the value range of t n and t r can be obtained via Equations (21) and (22). The certificate is thus completed. □
Proposition 6.
When t n = t n = λ 2 k r , t r = t r = λ 2 k r , Π M r , Π R r obtains extreme values, respectively:
Π M r = 16 k r 2 θ c n 2 + 2 θ c n ϕ + Q c r + p t 2 + η θ Q 2 8 η λ 2 k r ϕ + η λ 4 128 η θ k r 2
Π R r = 16 k r 2 θ c n 2 + 2 θ c n ϕ + Q c r + p t 2 + η θ Q 2 8 η λ 2 k r ϕ + η λ 4 256 η θ k r 2
1. When 0 t n t n r , Π M r increases with the increase of t n ; when t n r t n 4 k r c n + Q + λ 2 + λ 2 k r , Π M r , Π R r decreases with the increase of t n .
2. When 0 t r t r , Π R r decreases with the increase of t r ; when t r t r 1 2 4 k r c r + 2 p m p t + θ Q + λ 2 k r 2 + λ 2 k r , Π M r , Π R r increases with the increase of t r .
Proposition 7.
Under the condition that the warranty cost of each warranty entity is different, the comparison of the equilibrium solutions of each warranty decision factor is as follows:
1. When k m k r , that is, when k m k r 1 , t m d t r r , p n d p n r , p r d p r r , q n d q n r , q r r q r r ;
2. When k m > k r , that is, when k m k r > 1 , t m d > t r r , p n d < p n r , p r d < p r r , q n d > q n r , q r r > q r r .
Proof. 
When k m k r , Δ ( t ) = t m d t r r = 2 k m k r λ ( k r k m ) 0 , that is, t m d t r r ; Δ ( p n ) = p n d p n r = 1 4 t n 2 k m k r 0 ; Δ ( p r ) = p r d p r r = 1 4 t r 2 k m k r 0 ; Δ ( q n ) = q n d q n r = k m k r t n 2 t r 2 4 ( θ 1 ) 0 ; Δ ( q r ) = q r d q r r = k m k r t n 2 t r 2 4 ( θ 1 ) θ 0 , the certificate is completed. □
Proposition 8.
Under the condition that the warranty cost of each warranty entity is different, the comparison of the income of each member company of the closed-loop supply chain with warranty service can be proposed as follows:
1. When k m k r , that is, when k m k r 1 , Π M d Π M r ; Π R d Π R r ;
2. When k m > k r , that is, when k m k r > 1 , Π M d < Π M r ; Π R d < Π R r .
Proof. 
When k m k r , Δ ( Π M ) = Π M d Π M r = λ 2 k m k r k m 8 k r c r p t + θ Q + λ 2 + λ 2 k r 128 θ k m 2 k r 2 0 ; Δ ( Π R ) = Π R d Π R r = λ 2 k m k r k m 8 k r c r p t + θ Q + λ 2 + λ 2 k r 256 θ k m 2 k r 2 0 , the certificate is completed. □
According to Propositions 7 and 8, when the manufacturer and the seller provide warranty services for the products separately, that is, when k m k r , the manufacturer should be selected as the product warranty subject. At this time, the remanufacturing closed-loop supply chain cannot be obtained. The lowest product price, the best warranty period and the optimal output can be obtained, and the profit of the manufacturer and the remanufacturing system can be seen as optimal. At the latter moment, the remanufacturing closed-loop supply chain system also has the highest warranty efficiency. When k m > k r , the seller should be selected as the main body of the remanufactured product. At this time, the re-manufacturing closed-loop supply chain system will obtain the highest warranty efficiency.

4.3. Remanufacturing System Provides a Warranty (Model C)

When the remanufacturing system provides a warranty, the manufacturer and the retailer form a centralized whole and the overall profit of the system is maximized as the decision-making goal. According to the research results of Tan et al. (2001 [35]), the unit product warranty cost of the remanufacturing system can be simplified to km, and the decision-making problem of the remanufacturing system expressed as follows:
max ω n , ω r Π S = p n λ t n p r + λ t r 1 θ Q c n k m t n 2 + p n d α + p r λ t r θ p n λ t n p r + λ t r 1 θ c r k m t r 2 + p r p t d α
Part 1 of Model 25 is the revenue earned by the manufacturer for selling the new product, and the second part is the revenue from the sale of the remanufactured product. Combining Formulas (1) and (2) can be used to solve the model (25), and to obtain Proposition 7.
Proposition 9.
Under Model C, the optimal retail price for new and remanufactured products is:
p n c = 1 2 c n + t n k m t n + λ + Q
p r c = 1 2 c r + t r k m t r + λ + p t + θ Q
Proof. 
According to the range of the values of related parameters, Π S c is a strict concave function for p n and p r , find the first-order partial derivative of p n , p r from the optimality model (25) and make it zero, the simultaneous equations can be used to obtain the optimal decision result. The certificate is thus completed. □
Inference 5.
Model C:
1. p n c and q n C have no relevance to consumer preference θ .
2. p r c and q r c increase with the increase of consumer preference θ .
3. p n c decreases as k m increases; p r c decreases as k m increases.
Based on conclusions 1, 3 and 5 in the context of decentralized decision making, it can be said that the increase of consumer preference of θ will help to increase consumer demand for remanufactured products while retaining the demand for new products. The market encroachment effect in the supply chain system would be weakened, expanding the market capacity of the system. Moreover, consumer acceptance would help to increase the system profit of the remanufactured closed-loop supply chain.
Comprehensive decentralized model M and model R were used to study the comparison of key influencing factors of warranty decisions, from which inference 6 was obtained.
Inference 6.
Model C is available for comparison with decentralized decision models:
1. p n c < p n d , p n c < p n r ;
2. p r c < p r d , p r c < p r r ;
3. q n c > q n d , q r c > q r r .
Indicating that under the centralized decision, the optimal sales price of new products and remanufactured products would be lower than the optimal sales price under the decentralized decision, and the optimal output greater than the revenue under the decentralized decision. This, in turn, indicates that manufacturers and retailers under centralized decision-making make decisions with the goal of the supply chain system as a whole, effectively avoiding the double marginalization effect and optimizing the supply chain system.
Proposition 10.
The warranty period for the manufacturer to warranty the product in Model C is:
t n 0 , 4 k m Q c n + λ 2 + λ 2 k m
t r 0 , λ 2 4 k m c r + p t + θ ( Q ) + λ 2 k m
When t n = t n = λ 2 k r , q n r reaches the maximum point:
q n c = c n + c r + p t θ Q + Q 2 2 θ
When t r = t r = λ 2 k m , q r d reaches the minimum point:
q r c = 4 k m θ c n + c r + p t + ( θ 1 ) λ 2 8 ( θ 1 ) θ k m
Inference 7.
In Model C:
1. When 0 t n t n , q n d increases with the increase of t m ; when t n t n 4 k m Q c n + λ 2 + λ 2 k m , q n d decreases with the increase of t n .
2. When 0 t r t r , q r d decreases with the increase of t r ; when t r t r λ 2 4 k m c r + p t + θ ( Q ) + λ 2 k m , q r d increases with the increase of t r .
Proof. 
From q n t n = λ 2 k m t n 2 2 θ , 2 q n t n 2 = k m θ 1 < 0 ; q r t r = λ 2 k m t r 2 θ 2 θ 2 , 2 q n t n 2 = k m ( θ 1 ) θ < 0 , it can be concluded that when q n t n = 0 , q r t r = 0 , that is, when t n = t n = λ 2 k r , t r = t r = λ 2 k r , q n r and q r r adopts the maximum value, and the value range of t n and t r can be derived from Equations (30) and (31). □
Proposition 11.
When t n = t n = λ 2 k r , Π S c obtain the extreme value:
Π S c = 16 k m 2 θ c n 2 + 2 θ c n ϕ + Q c r + p t 2 + η θ Q 2 8 η λ 2 k m ϕ + η λ 4 64 η θ k m 2
When 0 t n t n r , Π S c increases with the increase of t n ; when t n r t n 4 k m Q c n + λ 2 + λ 2 k m , Π S c decreases with the increase of t n .
Proposition 12.
Note:
ξ 1 = 2 χ 2 λ 3 ( τ λ ) + 2 k m λ χ ( τ 2 λ ) + χ 2 k m + 2 χ 2 k m + λ χ ( λ + τ ) 8 χ 2
ξ 2 = 2 ρ 2 λ 3 ( σ λ ) + 2 ρ k m ρ k m + λ ( σ 2 λ ) + 2 ρ 2 k m + λ ρ ( λ + σ ) 8 ρ 2
ξ 3 = λ 2 k r 4 k m Q c n + λ 2 + λ k m 8 k r Q c n + 2 λ 2 + 2 λ 4 k m k r
ξ 4 = λ 2 k r 4 k m c r p t + θ Q + λ 2 + λ k m 2 4 k r c r p t + θ Q + λ 2 + 2 λ 4 k m k r
To simplify the display: χ = Q c n , τ = 4 k m Q c n + λ 2 , ρ = c r + p t + θ ( Q ) , σ = 4 k m c r p t + θ Q + λ 2
1. When k m k r ξ 1 : t n c = t n d t n r ; p n c p n r p n d ; ω n d > ω n r ; q n r q n d q n c .
2. When k r > ξ 1 : t n c = t n d > t n r ; p n r < p n c p n d ; ω n d < ω n r ; q n r < q n d < q n c .
3. When k m k r ξ 2 : t r c = t r d t r r ; p r c p r r p r d ; ω r d > ω r r ; q r r q r d q r c .
4. When k r > ξ 2 : t r c = t r d > t r r ; q r r < p r c p r d ; ω r d < ω r r ; q r r < q r d < q n c .
Proof. 
As t n c = t n d , k m k r , it can be obtained from Proposition 7: t n c = t n d t n r , available from Δ ( p n ) = p n c p n r = ξ 3 , when k r ξ 1 , p n c p n r , It can be obtained by Proposition 7 that q n r q n d , then there is, when k m k r ξ 1 , p n c p n r p n d , the same can be proved of 1∼4. □
Proposition 13.
Note:
ξ 5 = 2 k r 2 λ 4 4 k r Q c n + λ 2 λ 8 k r Q c n + 2 λ 2 + 4 k r c n Q 4 k r c n Q + λ 2 2
ξ 6 = 2 k r 2 λ 4 4 k r θ Q c r p t + λ 2 2 λ 4 k r θ Q c r p t + λ 2 + 4 k r c r + p t + θ ( Q ) 4 k r c r + p t θ Q + λ 2 2
1. When k r < k m ξ 5 : t n c = t n d < t n r , p n c < p n d < p n r , ω n d > ω n r , q n d < q n r < q n c ;
2. When k m > ξ 5 : t n c = t n d < t n r , p n c < p n d < p n r , ω n d < ω n r , q n d < q n c < q n r ;
3. When k r < k m ξ 6 : t n c = t n d < t n r , p n c < p n d < p n r , ω r d > ω r r , q n d < q n r < q n c ;
4. When k m > ξ 6 : t n c = t n d < t n r , p n c < p n d < p n r , ω r d < ω r r , q n d < q n c < q n r .
The process of ascertaining proof is the same as for Proposition 12.
According to Propositions 12 and 13, when k m k r or k r < k m ξ 5 , the remanufacturing system should be selected to provide the product warranty. At this time, the remanufacturing system cannot obtain the lowest product price and the longest product warranty period, but can maximize the product output and maximize the profit of the remanufacturing system; when k m > ξ 6 , the seller should be selected as the warranty subject of the product, although the remanufacturing system cannot obtain the lowest product price and the highest production, but can enable the remanufactured products to obtain the longest warranty period, whereby the remanufacturing system profits will also reach their highest point.

5. Numerical Simulation

In order to more clearly reflect the latter conclusions, programming with Mathematica 11 and numerical simulations were performed on the results of the above models. We refer here to the parameter settings of Xu et al. (2014 [36]), and let the relevant parameters be c n = 2 , c r = 1.5 , p t = 1 , p m = 2 , Q = 20 , λ = 0.3 .

5.1. Impact Analysis of Warranty Cost k j and Consumer Preference θ on the Decision Variables of Warranty Models

1. Take k r = 0.6 , k m = { 0.4 , 0.6 , 0.8 } . The optimal solution of each variable is shown in Table 3 and Table 4.
Firstly, considering the impact of k j , θ on new product decisions. As can be seen from Table 3 and Table 5, when k r remains the same, t n d , t n c , ω n d , p n d , p n c , Π M d , Π R d , Π S c decrease with the increase of k m . While t n r , ω n r , p n r , Π M r , Π R r remain unchanged. The manufacturer’s warranty cost affects the warranty period under Model M and Model C to a large extent, and as the warranty cost increases, the warranty period decreases, which makes the supply chain system profit decrease. Table 4 and Table 5 indicate that consumer preference θ contains no relevance to new product pricing and warranty system profit.
Secondly, we consider the impact of k j , θ on remanufactured product decisions: as can be seen from Table 4 and Table 5, when k r remains the same, t r d , t r c , ω r d , p r d , p r c , Π M d , Π R d , Π S c all decrease with the increase of k m , while t r r , ω r r , p r r , Π M r , Π R r remain unchanged. The manufacturer’s warranty cost affects the warranty period under Model M and Model C to a large extent, and as the warranty cost increases, the warranty period decreases, which makes the supply chain system profit decrease. Table 4 and Table 5 demonstrate that t r d , t r r , t r c , ω r d , ω r r , p r d , p r r , p r c , Π M d , Π R d , Π M r , Π R r , Π S c increase with the increase of consumer preference θ , in turn indicating that consumer acceptance is beneficial to improving the optimal profitability of retailers, manufacturers and closed-loop supply chain systems, stimulating the realization of the potential value of remanufacturing.
2. Take k m = 0.6 , k r = { 0.4 , 0.6 , 0.8 } . The optimal solution of each variable here is shown in Table 6 and Table 7.
Firstly considering the impact of k j , θ on new product decisions. As can be seen from Table 6 and Table 8, when k m remains the same, t n r , ω n r , p n r , Π M r , Π R r decrease with the increase of k r , while t n d , t n c , ω n d , p n d , p n c , Π M d , Π R d , Π S c remain unchanged. The retailer’s warranty cost affects the warranty period under the model R to a large extent, and as the warranty cost rises, the warranty period decreases, which makes the supply chain system profit decrease. Table 6 and Table 8 indicate that consumer preference θ is independent of variables such as new product pricing and warranty system returns.
Secondly, considering the impact of k j , θ on remanufactured product decisions: as can be seen from Table 7 and Table 8, when k m remains the same, t r r , ω r r , p r r , Π M r , Π R r decrease with the increase of k r , while t r d , t r c , ω r d , p r d , p r c , Π M d , Π R d , Π S c remain unchanged. The retailer’s warranty cost affects the warranty period under the model R to a large extent, and as the warranty cost rises, the warranty period decreases, which makes the supply chain system profit decrease. Table 7 and Table 8 indicate that t r d , t r r , t r c , ω r d , ω r r , p r d , p r r , p r c , Π M d , Π R d , Π M r , Π R r , Π S c increase with the increase of the consumer preference θ , implying that consumer acceptance is beneficial to improving the optimal profitability of retailers, manufacturers and closed-loop supply chain systems, stimulating the realization of the potential value of remanufacturing.

5.2. Impact of Warranty Period t on Each Decision Model

1. Model M:
As shown in Figure 2a, when t r remains constant under model M, Π M d , Π R d are extended with t n d and there then manifests a trend of initial increase and then decrease, that is, reaching the maximum value when t n = t n d = λ 2 k m . As shown in Figure 2b, when t n is kept constant, Π M d , Π R d both first decrease and then increase with the extension of t r d ; that is, both reach the minimum value at t r = t r r = λ 2 k m , further proving Proposition 3.
2. Model R:
As shown in Figure 3a, when t r remains constant under model M, Π M r , Π R r are extended with t n r and there then manifests a trend of initial increase and then decrease, that is, reaching the maximum value when t n = t n r = λ 2 k r . As shown in Figure 3b, when t n is kept constant, Π M r , Π R r both first decrease and then increase with the extension of t r r ; that is, both reach the minimum value at t r = t r r = λ 2 k r , thus further proving Proposition 6.
3. Model C:
As shown in Figure 4, when t r remains constant under model C, Π S c first increases and then decreases with the extension of t n c ; that is, it reaches the maximum value at t n = t n c = λ 2 k m . When t n remains constant, Π S c tends to decrease first and then increase with the extension of t r c ; that is, it reaches a minimum at t r = t r c = λ 2 k m , thus further proving Proposition 11.
The above simulation results show that the new product warranty period affects the profit of the supply chain system to a large extent, and the profit of the supply chain system first increases and then decreases. The remanufactured product warranty period affects the profit of the supply chain system to a lesser extent, and the supply chain system The profit is first reduced and then increased. The warranty period is subject to the warranty cost, and the warranty cost comparison relationship (i.e., k m k r ) needs to be introduced to seek the optimal guarantee efficiency.

5.3. Effects of Changes in the Ratio k m / k r on the Difference between the Model Decision Variables Δ

1. As can be seen from Figure 5, the difference between t m and t r decreases as the ratio of k m / k r increases. When k m / k r 1 , that is, when k m k r , t m > t r ; when k m / k r 1 , that is, when k m k r , t m < t r .
2. As can be seen from Figure 6, p n d > p n c is constant, and the difference increases with the increase of k m / k r . p n r > p n c always hold, and its difference decreases with the increase of k m / k r . When k m / k r 1 , that is, when k m k r , p n d > p n r ; when k m / k r 1 , that is, when k m k r , p n d < p n r . The difference between p n d and p n r decreases as the ratio of k m / k r increases and there appears a threshold, such that the difference is less than zero.
3. As can be seen from Figure 7, p r d > p r c always hold, and the difference increases with the increase of k m / k r ; p r r > p r c always hold, and its difference decreases with the increase of k m / k r . When k m / k r 1 , that is, when k m k r , p r d > p r r ; when k m / k r 1 , that is, when k m k r , p r d < p r r , the difference between p r d and p r r shrinks as the ratio of k m / k r increases, a threshold appears such that the difference is less than zero.
4. As Figure 8 shows, the difference between Π M d and Π M r , Π R d and Π R r decreases with the increase of k m / k r . When k m / k r 1 , that is, when k m k r , Π M d > Π M r , Π R d > Π R r . When k m / k r 1 , that is, when k m k r , Π M d < Π M r , Π R d < Π R r .
5. As Figure 9 shows, Π S c > Π S d always hold, and the difference decreases with the increase of k m / k r . Π S c > Π S r always hold, and its difference decreases as k m / k r increases. When k m / k r 1 , that is, when k m k r , Π S d > Π S r ; when k m / k r 1 , that is, when k m k r , Π S d < Π S r .
6. As Figure 10 shows, when k m / k r ξ 6 , that is, when k m k r , ω n d > ω n r , ω r d > ω r r . When k m / k r ξ 6 , that is, when k m k r , ω n d < ω n r , ω r d < ω r r .

6. Conclusions

Based on the perspective of consumer behavior, this paper constructs a closed-loop supply chain system consisting of a single manufacturer and a single retailer. It analyzes the warranty service provided by the manufacturer (model M) and the warranty service provided by the retailer (model R), alongside the supply chain system that provides warranty services (model C). The decision-making efficiency of new products and remanufactured products occur under these three decision levels.
Research shows that consumer confidence in the purchase of remanufactured products has increased demand for new and remanufactured products, increased the interests of companies in the supply chain, and stimulated the realization of the potential value for remanufacturing, which is conducive to green growth. Then, consumer recognition has been found to have less impact on the warranty decision of new products, and a greater impact on the warranty decision of remanufactured products.In addition, the profit of each entity in the closed-loop supply chain increases first and then decreases with the extension of the new product warranty period. When the warranty period of the remanufactured product meets certain conditions, the member companies of the supply chain can obtain the optimal profit. In terms of supply chain warranty efficiency, the choice of the supply chain optimal warranty subject depends on the comparison of the warranty costs of each warranty party: when k m k r or k r < k m ξ 5 , the manufacturing system should be chosen to provide the product warranty. In this circumstance, although the remanufacturing system cannot obtain the lowest product price and the longest product warranty period, it can maximize the product output and maximize the profit of the remanufacturing system. when k m > ξ 6 , the seller should be selected as the warranty subject of the product. Although the lowest product price and the highest output cannot be obtained, the remanufactured product would be able to obtain the longest warranty period, and the remanufacturing system profit would also reach its highest point.
There are some key future research directions to consider here. First, the current paper only considers the Stackelberg game model dominated by manufacturers. However, strong retailers in the market often dominate the product sales network and market terminals, and an increasing numbers of supply chain leaders are turning from manufacturers to retailers. Secondly, the three decision models only consider a closed-loop supply chain system consisting of a single manufacturer and a single retailer, and can be further extended to a supply chain based on product competition or market competition. Finally, technological advancement drives the supply chain to upgrade its product strategy to further meet consumer demand. How to maintain the competitive position of remanufactured products in the context of the accelerated differentiation of new products and remanufactured products will be the next stage of research. Subsequent research considering the introduction of a warranty strategy will have practical guiding significance. Subsequent research considering the introduction of warranty strategy will be of practical significance.

Author Contributions

Conceptualization, X.Z. and L.Y. Methodology, L.Y. Software, L.Y. Formal Analysis, L.Y.Resources, X.Z.; Validation, L.Y.; Visualization, X.Z. and L.Y.; Project Administration, L.Y.

Funding

This research was funded by the Priority Academic Program Development of Jiangsu Higher Education Institutions, Top-notch Academic, Programs Project of Jiangsu Higher Education Institutions, Grant Number PPZY2015A072; the Practice Innovation Training Program of College Students in Jiangsu Province, Grant Number 201810300025Z.

Acknowledgments

This paper has received administrative and technical support from the China Institute of Manufacturing Development. Meanwhile, the authors would like to thank the anonymous reviewers for their valuable comments and suggestions to improve the quality of the paper.

Conflicts of Interest

The authors declare no conflict of interest.

References

  1. Song, M.; Peng, J.; Wang, J.; Dong, L. Better resource management: An improved resource and environmental efficiency evaluation approach that considers undesirable outputs. Resour. Conserv. Recycl. 2018, 128, 197–205. [Google Scholar] [CrossRef]
  2. Tseng, M.L.; Chiu, A.S.F.; Dong, L. Sustainable consumption and production in business decision-making models. Resour. Conserv. Recycl. 2018, 128, 118–121. [Google Scholar] [CrossRef]
  3. Ostojic, P. Pumps and circular economy. World Pumps 2016, 2016, 30–33. [Google Scholar] [CrossRef]
  4. Mai, D.T.; Liu, T.; Morris, M.D.; Sun, S. Quality coordination with extended warranty for store-brand products. Eur. J. Oper. Res. 2017, 256, 524–532. [Google Scholar] [CrossRef]
  5. Wang, Z.; Li, B.; Zhu, X.; Xin, B.; Wang, Y. The impact of donation subsidy of remanufactured products on Manufacturer’s pricing-production decisions and performances. J. Clean. Prod. 2018, 202, 892–903. [Google Scholar] [CrossRef]
  6. Alqahtani, A.Y.; Gupta, S.M. Warranty as a marketing strategy for remanufactured products. J. Clean. Prod. 2017, 161, 1294–1307. [Google Scholar] [CrossRef]
  7. Shafiee, M.; Chukova, S. Maintenance models in warranty: A literature review. Eur. J. Oper. Res. 2013, 229, 561–572. [Google Scholar] [CrossRef]
  8. Liao, B.; Li, B. Warranty as an Effective Strategy for Remanufactured Product. Int. J. Inf. Syst. Supply Chain Manag. 2016, 9, 41–57. [Google Scholar] [CrossRef]
  9. Hopp, W.J. Fifty years of management science. Manag. Sci. 2004, 50, 1–7. [Google Scholar] [CrossRef]
  10. Jiménez-Parra, B.; Rubio, S.; Vicente-Molina, M.A. Key drivers in the behavior of potential consumers of remanufactured products: A study on laptops in Spain. J. Clean. Prod. 2014, 85, 488–496. [Google Scholar] [CrossRef]
  11. Lei, Y.; Liu, Q.; Shum, S. Warranty pricing with consumer learning. Eur. J. Oper. Res. 2017, 26, 596–610. [Google Scholar] [CrossRef]
  12. Zhang, W.; He, Y. Optimal policies for new and green remanufactured short-life-cycle products considering consumer behavior. J. Clean. Prod. 2019, 214, 483–505. [Google Scholar] [CrossRef]
  13. Wang, Y.; Hazen, B.T.; Mollenkopf, D.A. Consumer value considerations and adoption of remanufactured products in closed-loopsupply chains. Ind. Manag. Data Syst. 2018, 118, 480–498. [Google Scholar] [CrossRef]
  14. Genc, T.S.; De Giovanni, P. Optimal return and rebate mechanism in a closed-loop supply chain game. Eur. J. Oper. Res. 2018, 269, 661–681. [Google Scholar] [CrossRef]
  15. Zhu, X.; Yu, L. Differential Pricing Decision and Coordination of Green Electronic Products from the Perspective of Service Heterogeneity. Appl. Sci. 2018, 8, 1207. [Google Scholar] [CrossRef]
  16. Bai, H.; Wang, J.; Zeng, A.Z. Exploring Chinese consumers’ attitude and behavior toward smartphone recycling. J. Clean. Prod. 2018, 188, 227–236. [Google Scholar] [CrossRef]
  17. Wu, C.-H. Price competition and technology licensing in a dynamic duopoly. Eur. J. Oper. Res. 2018, 267, 570–584. [Google Scholar] [CrossRef]
  18. Liao, B.-F.; Li, B.-Y. A Marketing Strategy in a Closed-Loop Supply Chain with Loss-Averse Consumers. Math. Probl. Eng. 2018, 2018, 2560153. [Google Scholar] [CrossRef]
  19. Savaskan, R.C.; Bhattacharya, S.; Wassenhove, V.L.N. Closed-loop supply chain models with product remanufacturing. Manag. Sci. 2004, 50, 239–252. [Google Scholar] [CrossRef]
  20. Shaharudin, M.R.; Tan, K.C.; Kannan, V.; Zailani, S. The mediating effects of product returns on the relationship between green capabilities and closed-loop supply chain adoption. J. Clean. Prod. 2019, 21, 233–246. [Google Scholar] [CrossRef]
  21. Taleizadeh, A.A.; Haghighi, F.; Niaki, S.T.A. Modeling and solving a sustainable closed loop supply chain problem with pricing decisions and discounts on returned products. J. Clean. Prod. 2019, 207, 163–181. [Google Scholar] [CrossRef]
  22. Chen, X.; Li, L.; Zhou, M. Manufacturer’s pricing strategy for supply chain with warranty period-dependent demand. Omega 2012, 40, 807–816. [Google Scholar] [CrossRef]
  23. Xu, L.; Wang, C. Sustainable manufacturing in a closed-loop supply chain considering emission reduction and remanufacturing. Resour. Conserv. Recycl. 2018, 131, 297–304. [Google Scholar] [CrossRef]
  24. Zou, H.; Qin, J.; Yang, P.; Dai, B. A Coordinated Revenue-Sharing Model for a Sustainable Closed-Loop Supply Chain. Sustainability 2018, 10, 3198. [Google Scholar] [CrossRef]
  25. Alamdar, S.F.; Rabbani, M.; Heydari, J. Pricing, collection, and effort decisions with coordination contracts in a fuzzy, three-level closed-loop supply chain. Expert Syst. Appl. 2018, 104, 261–276. [Google Scholar] [CrossRef]
  26. Zhang, C.T.; Ren, M.-L. Closed-loop supply chain coordination strategy for the remanufacture of patented products under competitive demand. Appl. Math. Model. 2016, 40, 6243–6255. [Google Scholar] [CrossRef]
  27. Saha, S.; Sarmah, S.P.; Moon, I. Dual channel closed-loop supply chain coordination with a reward-driven remanufacturing policy. Int. J. Prod. Res. 2016, 54, 1503–1517. [Google Scholar] [CrossRef]
  28. Cerchione, R.; Centobelli, P.; Shabani, A. Sustainability orientation, supply chain integration, and SMEs performance: A causal analysis. Benchmark. Int. J. 2018, 25, 3679–3701. [Google Scholar] [CrossRef]
  29. Dai, Y.; Zhou, S.X.; Xu, Y. Competitive and Collaborative Quality and Warranty Management in Supply Chains. Prod. Oper. Manag. 2012, 21, 129–144. [Google Scholar] [CrossRef]
  30. Bian, Y.; Yan, S.; Zhang, W.; Xu, H. Warranty strategy in a supply chain when two retailer’s extended warranties bundled with the products. J. Syst. Sci. Syst. Eng. 2015, 24, 364–389. [Google Scholar] [CrossRef]
  31. Qin, X.; Su, Q.; Huang, S.H. Extended warranty strategies for online shopping supply chain with competing suppliers considering component reliability. J. Syst. Sci. Syst. Eng. 2017, 26, 753–773. [Google Scholar] [CrossRef]
  32. Wang, J.; Zhou, Z.; Peng, H. Flexible decision models for a two-dimensional warranty policy with periodic preventive maintenance. Reliab. Eng. Syst. Saf. 2017, 162, 14–27. [Google Scholar] [CrossRef]
  33. Zhu, X.; Yu, L.; Zhang, J.; Li, C.; Zhao, Y. Warranty Decision Model and Remanufacturing Coordination Mechanism in Closed-Loop Supply Chain: View from a Consumer Behavior Perspective. Sustainability 2018, 10, 4738. [Google Scholar] [CrossRef]
  34. Li, K.; Mallik, S.; Chhajed, D. Design of extended warranties in supply chains under additive demand. Prod. Oper. Manag. 2012, 21, 730–746. [Google Scholar] [CrossRef]
  35. Tan, S.J.; Lee, K.S.; Lim, G.H. Warranty and warrantor reputations as signals of hybrid product quality. Eur. J. Mark. 2001, 35, 110–132. [Google Scholar] [CrossRef]
  36. Xu, M.; Tang, F. A Closed-loop Supply Chain Differential Pricing Model Considering Consumer Preference. Comput. Integr. Manuf. Syst. 2014, 20, 945–954. [Google Scholar]
Figure 1. (a) Manufacturer warranty. (b) Retailer warranty. (c) Supply chain system warranty.
Sustainability 11 01420 g001
Figure 2. (a) Trend of Π M d , Π R d with t n under model M. (b) Trend of Π M d , Π R d with t r d under model M.
Sustainability 11 01420 g002
Figure 3. (a) Trend of Π M r , Π R r with t n under model M. (b) Trend of Π M r , Π R r with t r r under model M.
Sustainability 11 01420 g003
Figure 4. Trend of Π M c , Π R c with t i under model C.
Sustainability 11 01420 g004
Figure 5. Trend of Δ t with k m / k r ratio.
Sustainability 11 01420 g005
Figure 6. Trend of Δ p n i with k m / k r ratio.
Sustainability 11 01420 g006
Figure 7. Trend of Δ p r i with k m / k r ratio.
Sustainability 11 01420 g007
Figure 8. Trend of Δ Π i with k m / k r ratio.
Sustainability 11 01420 g008
Figure 9. Trend of Δ Π S with k m / k r ratio.
Sustainability 11 01420 g009
Figure 10. Trend of Δ ω with k m / k r ratio.
Sustainability 11 01420 g010
Table 1. Definitions of variables.
NomenclatureDefinition
p t Retailer pays the price of consumer’s waste product recycling.
p m Manufacturer pays retailer to recover transfer price
ω i Wholesale price of new product or remanufactured product
p i Retail price of new or remanufactured products, i { n , r }
q i Demand function of new or remanufactured products
t i Warranty period of new or remanufactured products
c i Unit cost of new or remanufactured products
QPotential market size
μ Consumer utility function
θ Consumer preference (for remanufactured products), θ [ 0 , 1 ]
k j Cost coefficient for each warranty subject to provide warranty for unit remanufactured products, j { m , r }
λ The influence coefficient of the warranty period on market demand
Table 2. Notations.
Table 2. Notations.
NomenclatureDefinition
Indices
cRemanufacturing system provides warranty (model C)
dManufacturer provides warranty (model M)
rRetailer provides warranty (model R)
Subscript
MManufacturer
RRetailer
SRemanufacturing system
Table 3. Changes in the optimal solution of the decision variable of the new product in each warranty model with θ , k m when k r remains unchanged.
θ k m k r t n d t n r t n c ω n d ω n r p n d p n r p n c
0.40.67.093686.940037.0936811.084411.022515.598415.578811.0844
0.50.60.65.732936.940035.7329311.056311.022515.565615.578811.0563
0.80.64.934626.940034.9346211.042211.022515.549215.578811.0422
0.60.67.093686.940037.0936811.084411.022515.598415.578811.0844
0.60.60.65.732936.940035.7329311.056311.022515.565615.578811.0563
0.80.64.934626.940034.9346211.042211.022515.549215.578811.0422
0.40.67.093686.940037.0936811.084411.022515.598415.578811.0844
0.70.60.65.732936.940035.7329311.056311.022515.565615.578811.0563
0.80.64.934626.940034.9346211.042211.022515.549215.578811.0422
Table 4. Changes in the optimal solution of the decision variable of the remanufactured product in each warranty model with θ , k m when k r remains unchanged.
θ k m k r t r d t r r t r c ω r d ω r r p r d p r r p r c
0.40.64.721335.693514.721337.334387.27258.321888.203756.33438
0.50.60.63.794365.693513.794367.306257.27258.223448.203756.30625
0.80.63.255115.693513.255117.292197.27258.190638.203756.29219
0.40.65.26286.052395.26288.334388.27259.723449.703757.33438
0.60.60.64.23696.052394.236968.306258.27259.690639.703757.30625
0.80.63.63866.052393.638618.292198.27259.674229.703757.29219
0.40.65.756.390165.759.334389.272511.223411.20388.33438
0.70.60.64.635116.390164.635119.306259.272511.190611.20388.30625
0.80.63.983576.390163.983579.292199.272511.174211.20388.29219
Table 5. Changes in the optimal profit of supply chain members in each warranty model with θ , k m when k r remains unchanged.
θ k m k r Π M d Π R d Π M r Π R r Π S c
0.40.641.451820.725941.405420.702782.9037
0.50.60.641.374520.687341.405420.702782.749
0.80.641.335920.667941.405420.702782.6718
0.40.641.603520.801841.558820.779483.207
0.60.60.641.528920.764541.558820.779483.0579
0.80.641.491720.745941.558820.779482.9834
0.40.641.83720.918441.794320.897183.6735
0.70.60.641.76620.88341.794320.897183.532
0.80.641.73120.865341.794320.897183.4613
Table 6. Changes in the optimal solution of the decision variable of the remanufactured product in each warranty model with θ , k r when k m remains unchanged.
θ k m k r t n d t n r t n c ω n d ω n r p n d p n r p n c
0.60.46.278348.626046.2783411.506311.253116.090616.385911.5063
0.50.60.66.278346.851576.2783411.506311.168816.090616.090611.5063
0.60.86.278345.836636.2783411.506311.126616.090615.94311.5063
0.60.46.278348.626046.2783411.506311.253116.090616.385911.5063
0.60.60.66.278346.851576.2783411.506311.168816.090616.090611.5063
0.60.86.278345.836636.2783411.506311.126616.090615.94311.5063
0.60.46.278348.626046.2783411.506311.253116.090616.385911.5063
0.70.60.66.278346.851576.2783411.506311.168816.090616.090611.5063
0.60.86.278345.836636.2783411.506311.126616.090615.94311.5063
Table 7. Changes in the optimal solution of the decision variable of the remanufactured product in each warranty model with θ , k r when k m remains unchanged.
θ k m k r t r d t r r t r c ω r d ω r r p r d p r r p r c
0.60.44.184586.407464.184587.31757.278138.203758.223446.3175
0.50.60.64.184585.172314.184587.31757.268758.203758.190636.3175
0.60.84.184584.448974.184587.31757.264068.203758.174226.3175
0.60.44.669216.808554.669218.31758.278139.703759.723447.3175
0.60.60.64.669215.54.669218.31758.268759.703759.690637.3175
0.60.84.669214.732844.669218.31758.264069.703759.674227.3175
0.60.45.105217.186075.105219.31759.2781311.203811.22348.3175
0.70.60.65.105215.80845.105219.31759.2687511.203811.19068.3175
0.60.85.105215.15.105219.31759.2640611.203811.17428.3175
Table 8. Changes in the optimal solution of each supply chain member’s return in each warranty model with θ , k r when k m remains unchanged.
θ k m k r Π M d Π R d Π M r Π R r Π S c
0.60.442.626721.313443.345221.672685.2535
0.50.60.642.626721.313442.626721.313485.2535
0.60.842.626721.313442.271321.135785.2535
0.60.442.739921.369943.437521.718885.4798
0.60.60.642.739921.369942.739921.369985.4798
0.60.842.739921.369942.395521.197885.4798
0.60.442.919121.459643.587521.793885.8382
0.70.60.642.919121.459642.919121.459685.8382
0.60.842.919121.459642.590221.295185.8382

