Article

A Hybrid Methodology for Validation of Optimization Solutions Effects on Manufacturing Sustainability with Time Study and Simulation Approach for SMEs

by
Poorya Ghafoorpoor Yazdi
1,2,*,
Aydin Azizi
2,* and
Majid Hashemipour
3
1
Department of Mechanical Engineering, Eastern Mediterranean University, 99628 Famagusta, Northern Cyprus
2
Department of Engineering, German University of Technology, Muscat 130, Oman
3
Department of Mechanical Engineering, Cyprus International University, 99258 Nicosia, Cyprus
*
Authors to whom correspondence should be addressed.
Sustainability 2019, 11(5), 1454; https://0-doi-org.brum.beds.ac.uk/10.3390/su11051454
Submission received: 11 February 2019 / Revised: 19 February 2019 / Accepted: 5 March 2019 / Published: 8 March 2019
(This article belongs to the Special Issue Industry 4.0 for SMEs - Smart Manufacturing and Logistics for SMEs)

Abstract

:
The properties of small- and medium-sized enterprises (SMEs) make them one of the most important categories of enterprises for the economics of challenging world. SMEs, in most countries, are still enterprises with marketing and financial challenges. In addition, most of these challenges are related to their production and product characteristics. On the other hand, SMEs should fulfil the costumer’s demands. In order to reach these goals, SMEs must reach the highest level of production quality and quantity and successfully sustain them. Consequently, various manufacturing paradigms have been offered by an Industry 4.0 concept, which offers a variety of solutions to increase the productivity and enhance the performance of SMEs. It should be noted that implementation of these manufacturing paradigms for SMEs is quite difficult and sometimes risky for several reasons. Still, amidst all these difficulties and challenges, the benefits and idealism of the Industry 4.0 paradigms prevail. From productivity to market, it is difficult to deny that SMEs are frightened by the challenges they face and fleeing from the potential of overcoming them. This paper is an extended version of the research by Ghafoorpoor Yazdi et al. (2018) and conducts a hybrid methodology to satisfy the SMEs by validating and verifying any optimization idea before implementing the Industry 4.0 concept. To reach the study goals, an intelligent Material Handling System (MHS) with agent-based control architecture has been developed. The developed MHS has been utilized for auto parts distribution. The system performance has been evaluated, and some solutions have been provided to optimize the performance of system. To evaluate the target system’s performance, an analytical time study method has been utilized. The time study has an Overall Equipment Effectiveness (OEE) standard approach to identifying the matters that need to be resolved and optimized to increase system performance. The other part of the methodology is generating a simulation model of the real system by use of ARENA® software to evaluate the system’s performance before implementing the optimization idea and modifying the real system. Furthermore, as the sustainability strategies create many synergistic effects for SMEs, after evaluating the effects of the optimization ideas on OEE percentage, the influence of the OEE changes on manufacturing sustainability has been investigated. The results show that optimizing the OEE in SMEs with sustainability approaches can create competitive advantages, rather than simply focusing on reducing unsustainability.

1. Introduction

Nowadays, having businesses with increasing globalization and rapid technological changes requires more firms known as small- and medium-sized enterprises (SMEs), characterized by tight resources [1]. Industrial and commercial sectors, and large enterprises in particular, are changing due to globalization. These types of enterprises aim to shift and maintain their production, which are distributed to various regions abroad. For this reason, the impact of SMEs have become more prominent in an ever-changing globalized market [2,3]. SME firms need to produce admirable products with low cost, fast delivery to market, and appropriate quality. This strategy to meet these highly varying demands has made manufacturing systems more complex, dynamic, and demanding [4]. However, a manufacturing system including the mentioned capabilities requires proper control architecture, decision-making, and experts [5]. Moreover, it is difficult and quite risky for SMEs to utilize these systems before validation and verification of the possible advantages and disadvantages of these changes and its effects on their productivity [3]. Therefore, modelling, analysis, and simulation are essential aspects which can ensure the successful implementation and utilization of a new manufacturing system for SMEs [6].
One of the most important resources of a successful manufacturing system is the Material Handling System (MHS), which has a high level of influence on productivity [7]. Recently, automation of MHS has been focused on as an important feature of this type of system [8]. However, for a few SMEs which are currently utilizing automated/smart MHS, it would be risky and sometimes not feasible to apply any changes or optimization idea before validating and verifying their effects on different manufacturing aspects [9].
Many researchers have worked to develop a method to choose the right equipment and control architecture for MHS. Chan et al. (2011) proposed a model for improving MHS, called the Material Handling Equipment Selection Advisor (MHESA) [10]. Bhattacharya et al. (2002) also proposed another method, which is called the Multi-Criteria Decision-Making (MCDM) environment [11]. Shen et al. (2003) developed a new control architecture on their target MHS [12]. However, Fax and Murray (2004) proposed the use of a decentralized manufacturing control system which has the definition of an agent [13]. Durieux and Pierreval (2004) have proposed a study to design an automated manufacturing control system which is composed of machines working in parallel with MHS resources [14]. Schröder et al. (2016) developed an efficient way to manufacture products using automated MHS [15]. Johnstone et al. (2010) applied the concept behind the low-level control. This concept plays a huge role in preventing material collision in the considered MHS [16]. An operator-designed element-routing methodology for MHS was developed by Lau and Woo [17].
An increase in productivity and less rejections are the possible outcomes of increasing equipment effectiveness. The mentioned improvement is a major effect of the Industry 4.0 implementation on enterprises [18]. Considering the challenging market for SMEs, performance of the manufacturing system and reliable manufacturing equipment are currently considered the most important factors for increasing profitability [19]. Therefore, OEE is one of the best analytical methods for evaluating the performance of SMEs [20]. Generally, OEE focuses on the relationship between the loading time and the valuable time of the operations in manufacturing systems. Operating time can be defined as the time in which the equipment produces sufficient products, and loading time is the time in which the equipment needs to perform in a given period [21].
Many studies have been done about utilizing OEE to evaluate the performance of the enterprises. Nakajima (1988) introduced the total productive maintenance (TPM) concept. Overall Equipment Effectiveness (OEE) was the outcome of this concept as a quantative metric for measuring the productivity of individual equipment in an enterprise [22]. The quality rate, availability, and performance were the target aspects of OEE to be identified and measured. Huang et al. (2003) stated that the OEE concept has been widely used as a quantitative tool essential for the measurement of the manufacturing system’s productivity [23].
Nakajima (1988) stated that the effectiveness of the equipment in manufacturing systems can be evaluated by OEE standards to detect the system’s problems and limitations [22]. Jonsson and Lesshammar (1999) investigated the reason for losses during the production in manufacturing systems [24]. Muchiri et al. (2008) stated that there were six major losses available in manufacturing systems, which are downtime, Speed, Idling, and minor stoppage and losses due to speed reduction [25].
Calculation of performance, availability, and quality result in an obtainment of the OEE percentage [26]. The procedure for obtaining the percentage of each of these factors is illustrated in Figure 1 [27].
As stated previously, time is the most important factor when analyzing OEE. Consequently, a comprehensive time study can track each of the equipment and evaluate their behavior to identify the factors which might increase the system’s performance. To reach this goal, the manufacturing process can be divided into sub-processes. A summation of the time study for each part of the process leads to an obtainment of the overall system’s timing. Many studies have stated that utilization of a proper time study will identify the system’s waste time and limitations which might occur during the production process [27,28,29,30,31].
There are several time study techniques and methods, and there are many studies available in regard to each of them. Patel (2015) performed a stopwatch time study to calculate the cycle time for labor tasks, Overall Equipment Effectiveness (OEE), and in regard to minimizing the cycle time of the overall shifts [32]. Elnekave (2006) conducted a time study in a textile factory to obtain the standard time for a printing machine to calculate the system performance [33]. Bon and Daim (2010) investigated time as a measuring tool for the performance evaluation of a company [34]. Longo and Mirabelli (2009) utilized the Method Time Measurement (MTM) to analyze the primary model of the assembly line. Since the study was based on a nonexistent assembly line, a simulation tool was used to model the manufacturing system [35]. Kuhlang et al. (2011) presented a study on an assembly line and production-logistic process which aims to create more added-value elements in the process within a fixed time [36].
Simulation has played a significant role in evaluating, validating, and verifying any optimizing idea or modifications for a manufacturing system’s hardware, software, and layout design [37]. The operational performance of manufacturing systems could be obtained after any changes in simulation models before implementation on a real system [38,39]. There are different concepts in the investigation of the relationship between simulation and optimization, which are “simulation and optimization”, “simulation-based optimization”, and “simulation for optimization” [40,41,42]. ARENA simulation can be utilized to model different systems with different configurations to be subjected to optimization solutions and modifications. Therefore, ARENA is a proper simulation tool that can be used to validate, verify, and evaluate manufacturing systems which are modified by any optimization solution [43,44,45].

Manufacturing Sustainability Improvement

In order to evaluate the sustainability of the target manufacturing systems, the missions of the Organization for Economic Cooperation and Development (OECD) have been considered (Table 1). Based on OECD missions, a new business and production method, which is known as Sustainable Manufacturing, includes different types of green products and processes [46]. In addition, the concept of a sustainable manufacturing system is about decreasing the risk of business and increasing the chances which comes from the manufacturing system and process improvements [47].
According to the OECD, there are eight key factors that have to be considered during any sustainability investigation (Figure 2).
According to Yazdi et al. (2018), Figure 2 can be simplified to the energy intensity relation with manufacturing sustainability. In the other word, out of the effective factors related to manufacturing sustainability, energy consumption of the system and its related resources can be focused on [27].
As mentioned previously, time is the main effective factor when evaluating the OEE percentage of manufacturing systems. Thus, the relationship between time and manufacturing sustainability for SMEs is one of the targets in this research. However, to have a comprehensive evaluation of the effectiveness of a manufacturing system and its energy efficiency, considering time as the only factor of focus is not enough. Therefore, to evaluate the energy efficiency of a manufacturing system, the relationship between the energy consumption of a manufacturing system in a specific period of time and its power requirements should too be considered, so that it is possible to conduct an action plan to reduce the time and energy consumption in parallel [48,49].
This study is predominantly about assessing the challenges and possible difficulties that SMEs might face during the implementation of Industry 4.0. However, SMEs have a fear of utilizing these solutions until the management layer, being convinced of the possible performance improvements and effects. On the other hand, for the category of SMEs in which the Industry 4.0 is adopted, they are likely to want to improve their current manufacturing system by new control architectures and optimization ideas and some other manufacturing paradigms. Hence, the proposed methodology in this research is likely to make SMEs able to evaluate the system before and after implementation of the new control architecture and optimization idea.
In general, the study had two stages and used a hybrid methodology for the possible industrial category target (SMEs). The Overall Equipment Effectiveness (OEE) standard analysis was conducted to determine an appropriate relationship between performance evaluation and optimization in such material handling systems for SMEs.
In the first stage of the research, the proposed hybrid methodology was implemented on an educational manufacturing system at the German University of Technology in Oman (GUtech) [50]. Before any changes were made, the system was a semi-automated material handling system for part/product distribution. In order to represent the essence and effect of the adoption of Industry 4.0 and the way in which the system’s processes, operations, and overall performance could be improved, a new control architecture with a unique algorithm was developed. The reason behind this type of control architecture was to transform the target MHS from a semi-automated to an intelligent one, as this is significant for Industry 4.0 integration. To reach to an intelligent MHS, an agent-based control architecture was developed. The developed control architecture, including an algorithm for the target MHS, became a suitable solution due to the improvement in production planning and scheduling, as well as monitoring and control. Agent-based control architecture implementation resulted in improved decision-making and an effectively facilitated system.
In the second stage and in this paper, two categories of enterprises have been considered as the ones where the proposed method might be applicable for them. The first category included the enterprises which were going to initiate the production and which did not have a fixed control architecture, resources (hardware and software), or layout design. The other category was for the enterprises that were already producing and functioning, and where it was hard and risky to modify any of the hardware and software resources and layout design, especially the control architecture. Performance measurement of the system with new control architecture and the developed algorithm is indispensable to the target MHS, because if the efficiency of the control architecture cannot be measured, it cannot be properly modified and optimized. It is obvious that if the new proposed control architecture cannot improve the performance, some other hardware, software, and layout design problems will exist. Furthermore, these possible problems which may affect the system performance should be differentiated from the control architecture’s possible problems and limitations.
The first stage of the study established that considering the second category of the SMEs, time, as the main performance indicator will determine most of the problems and limitations in relation to the hardware, software, control architecture, and layout design [27]. The study made use of timing as the main key factor for OEE. Quantitative required data were collected using “ProTime” Estimation software as the time study tool. The selected time study method is a combination of different time study techniques to obtain the required information for OEE calculation. Implementation of the proposed methodology for target MHS required a comprehensive overview of the system functionality and tasks, such that the MHS with new control architecture were separated into a different district, including the available tasks for each of them. OEE was calculated for the target MHS before any modification. The OEE result was analyzed, and the system hardware, software, and layout design obtained for each district and each task.
In the second stage and in this paper, out of the detected problems and limitations available in the system with new control architecture, several influencing factors have been identified. In order to optimize the system in regard to these three categories of problems, the distance between the devices and speed was considered as the optimization objective function. To investigate the effect of the optimization idea, the target intelligent MHS was modelled on an ARENA simulation to investigate any possible changes in system performance. The study’s conclusion is that there were partial, as well as overall improvements in the systems. As the final stage of the research, the effect of the proposed methodology and optimization ideas on the sustainability of the target system were obtained.

2. Methodology

An intelligent material handling system, including the Master-Slave agent-based control architecture, was developed as the first stage of this research. The system layout and its agent-based control architecture and functionality has been described by Yazdi et al. in detail [27] (Figure 3 and Figure 4).
Referring to Figure 3 and Figure 4 and research done by Yazdi et al. [27], the system includes four phases. Phase 1 includes the storage, main conveyor, and its control unit (slave1). Phase 2 includes a robot arm and its control unit (slave6). Phases 3 and 4 include a slider with a control unit (Slave4 and 5), and a conveyor and its control units (Slave 2 and 3) and buffers [27].
A time study was done on the developed intelligent material handling system by Yazdi et al. [27] for each part of the process and the entire system. Detailed results of the time study in a previous part of the research is illustrated in Table 7, which is available in [27]. Obtaining the utilization time for all of the available resources in the system was the main target in doing the time study. In addition, with the selected time study technique, a comprehensive investigation of the difference between similar devices with the same functionalities was done. The time study results have been utilized to obtain the required factors for calculating the OEE percentages for every resource, as well as the entire system. Also, identification of the problems and limitations in hardware, software (control agents), and layout design was the result of the time study of the system. A combination of the outcomes of the time study and OEE evaluation led to the provision of proper optimization solutions for enhancing system performance. Due to the target system’s characteristics as an educational manufacturing system, as well as its limitations, the time study evaluation was done for a short functioning period of the system, and expanded for a long period theoretically.
The time study results and its associated Gantt chart showed the overall system performance within the entire sections of the system, including the utilization time of each resource and the conflicts that occur when two or more resources are working at the same time. A more detailed Gantt chart and explanation is given by Yazdi et al. in [27].
Since part of the previous objectives of this research was to obtain methods for optimizing the system, it was essential to point out the issues and problems related to the system’s performance and prepare a comprehensive overview of them. It has been stated by Yazdi et al. that a particular aspect which needs to be optimized in the system is idle time, since it affects the overall system utilization rate [27]. Thus, the authors presumed that there should be a direct relationship between a decrease in Busy time, Idle time, and overall production time [27]. As a result, all of the detected issues and possible solutions for enhancing system performance with the time study and visual observation point of view are listed in a Table in [27].
Once the problems and limitations and simulation model with functional specifications of the real system were clearly defined in the first stage of the research, it was possible to detect and gather the data, which was essential for verifying the simulation model with the same characteristics and properties of the real system. Once the necessary data were identified, determination of where the data came from was required. In utilizing the time study, the required data which needed to be collected manually was obtained.
In this research, the objective of the simulation was verification of the detected problems by time study and validation of the effects of implementation of the optimization method before execution on the real system.
When building the simulation model in ARENA, defining the primary aspects of the real manufacturing system plays an important role. These primary aspects include Resources, Variables, Attributes, and other elements. Once the fixed aspects have been defined, the simulation model’s control logic can be generated by utilizing ARENA’s flowchart-modelling methodology (Figure 5).
If the model’s behavior makes sense and it is functioning like the real system—for instance, when entities are moving in the path that they should, and process steps are taking place as expected—we can be sure that the model has been verified. To achieve system verification, functional specification should be followed properly during the model-building phase.
Here, in the second stage of research, validation means users’ approval about the output of the simulation model matching with the real system outputs. In this case, the model input may use real system data, and its output from the simulation model will be compared with the real system’s results (time study results). In all cases, the changes in the existing system are amended to reflect on the simulation model.
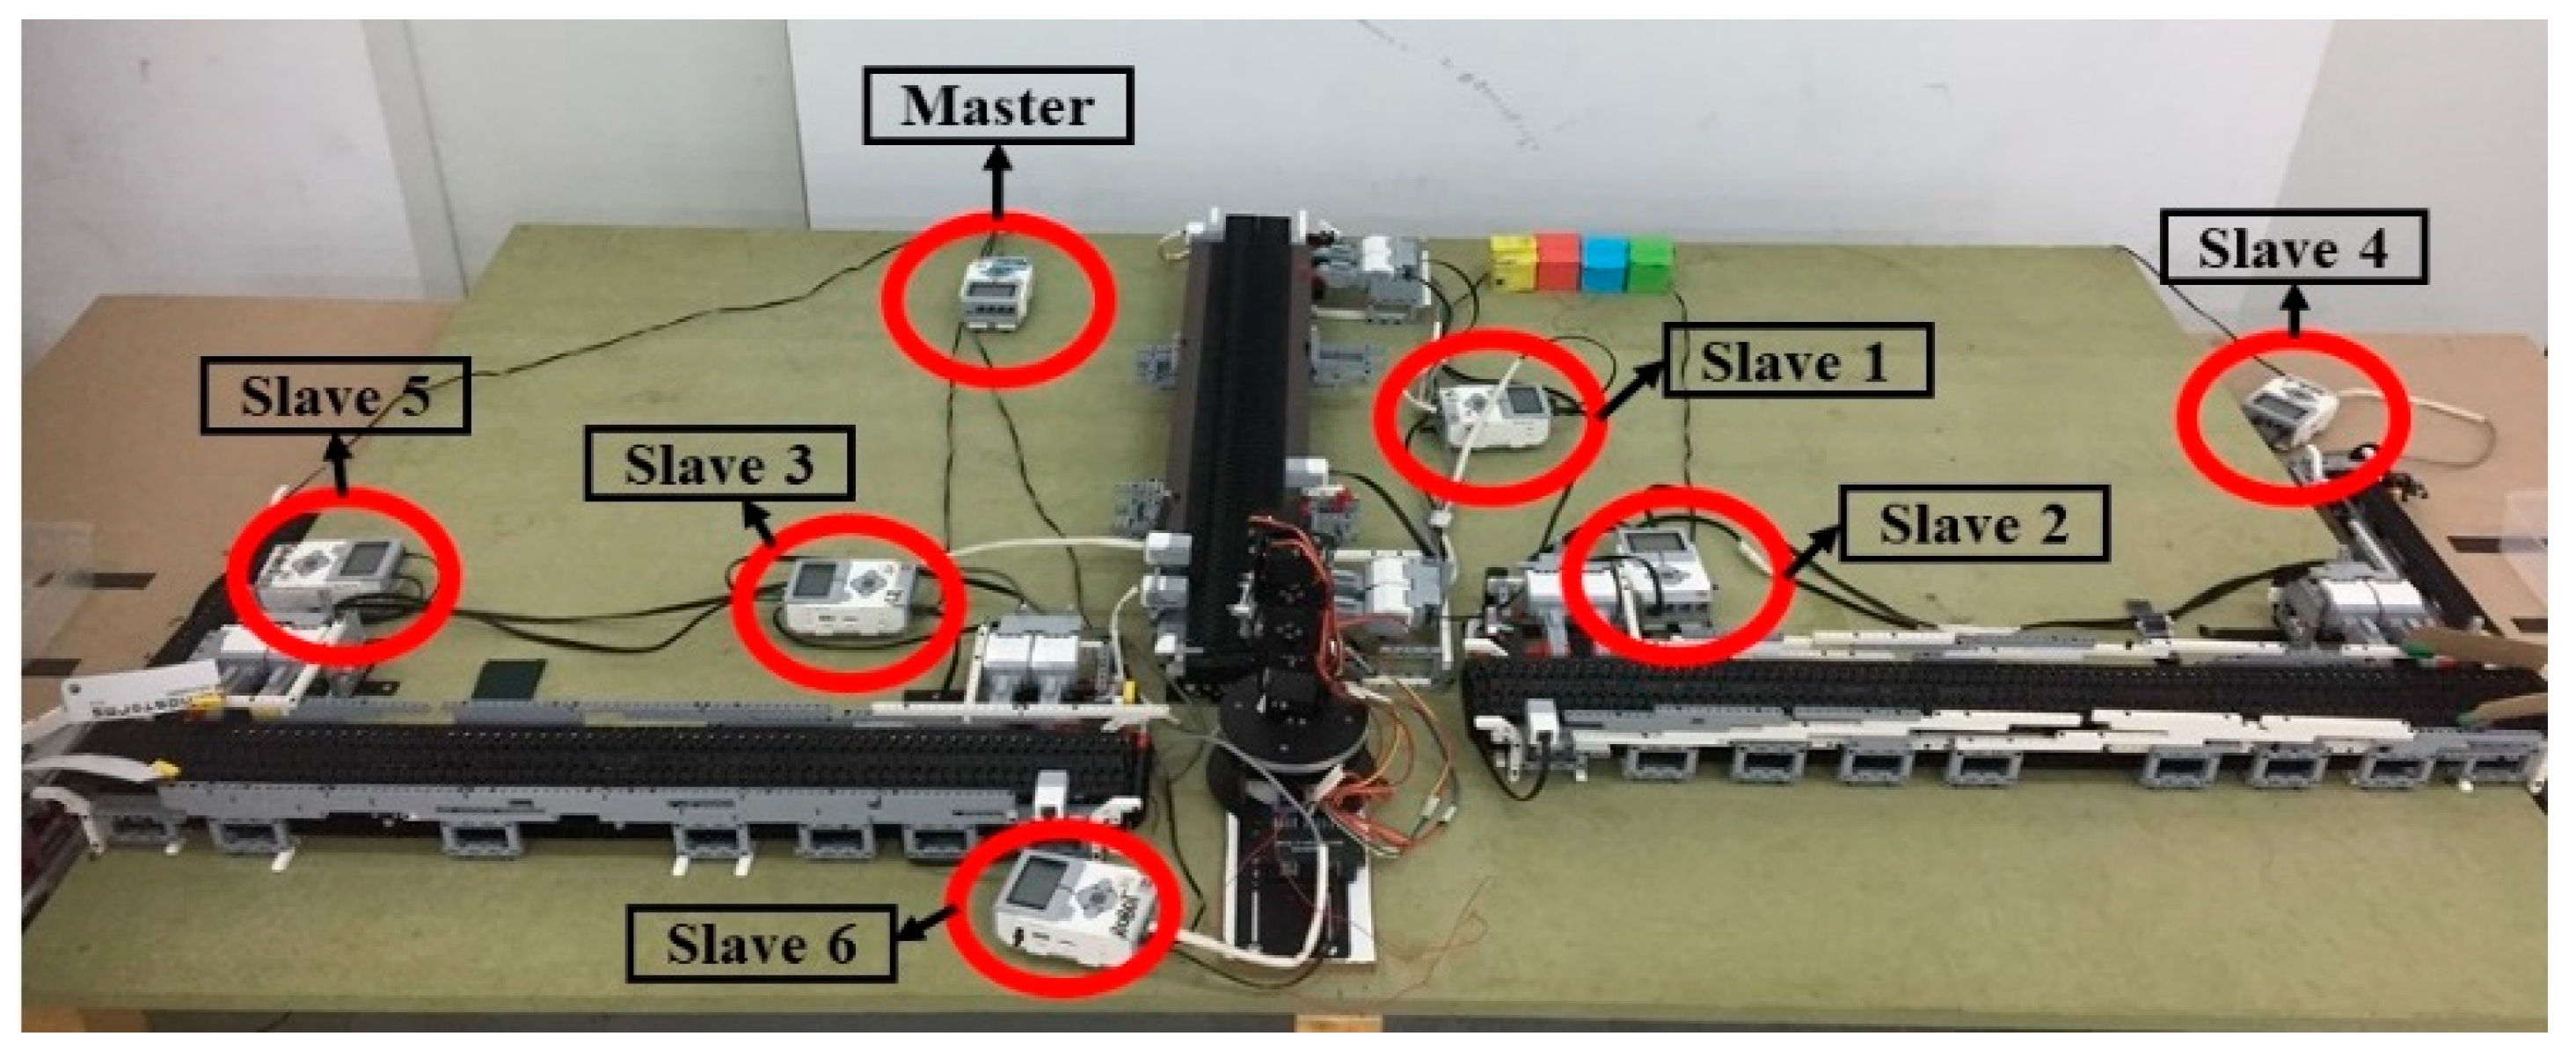
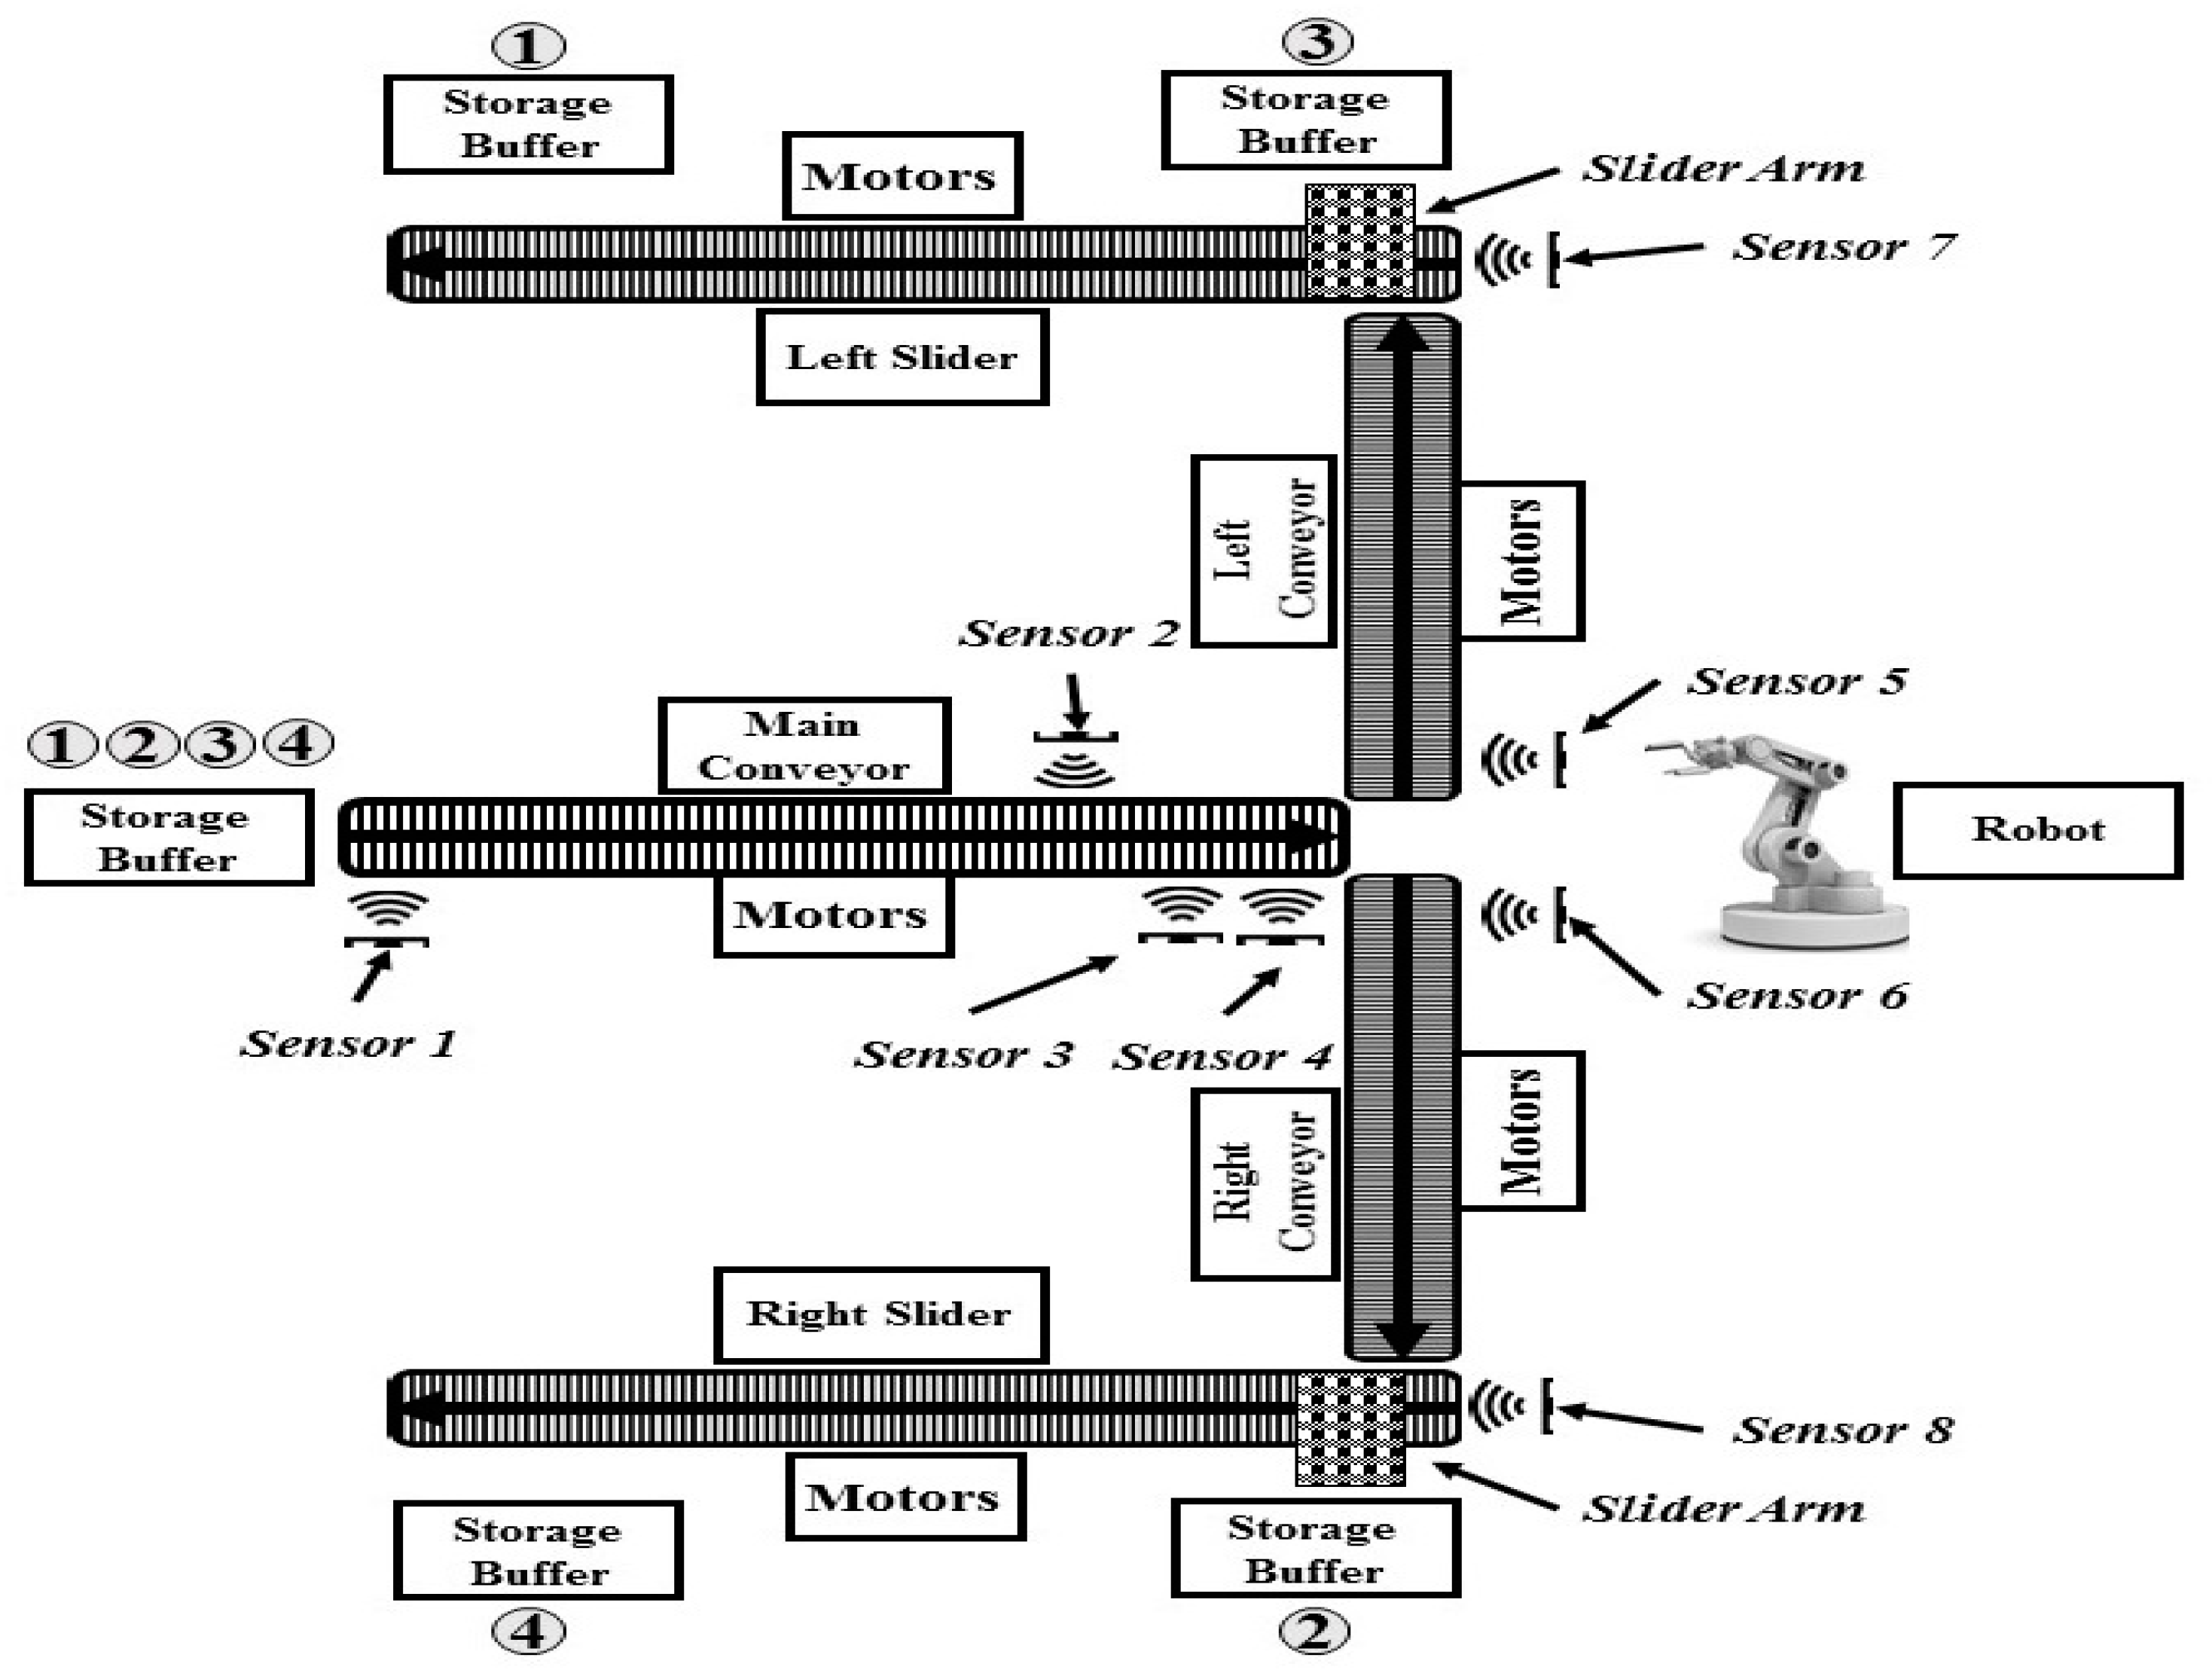
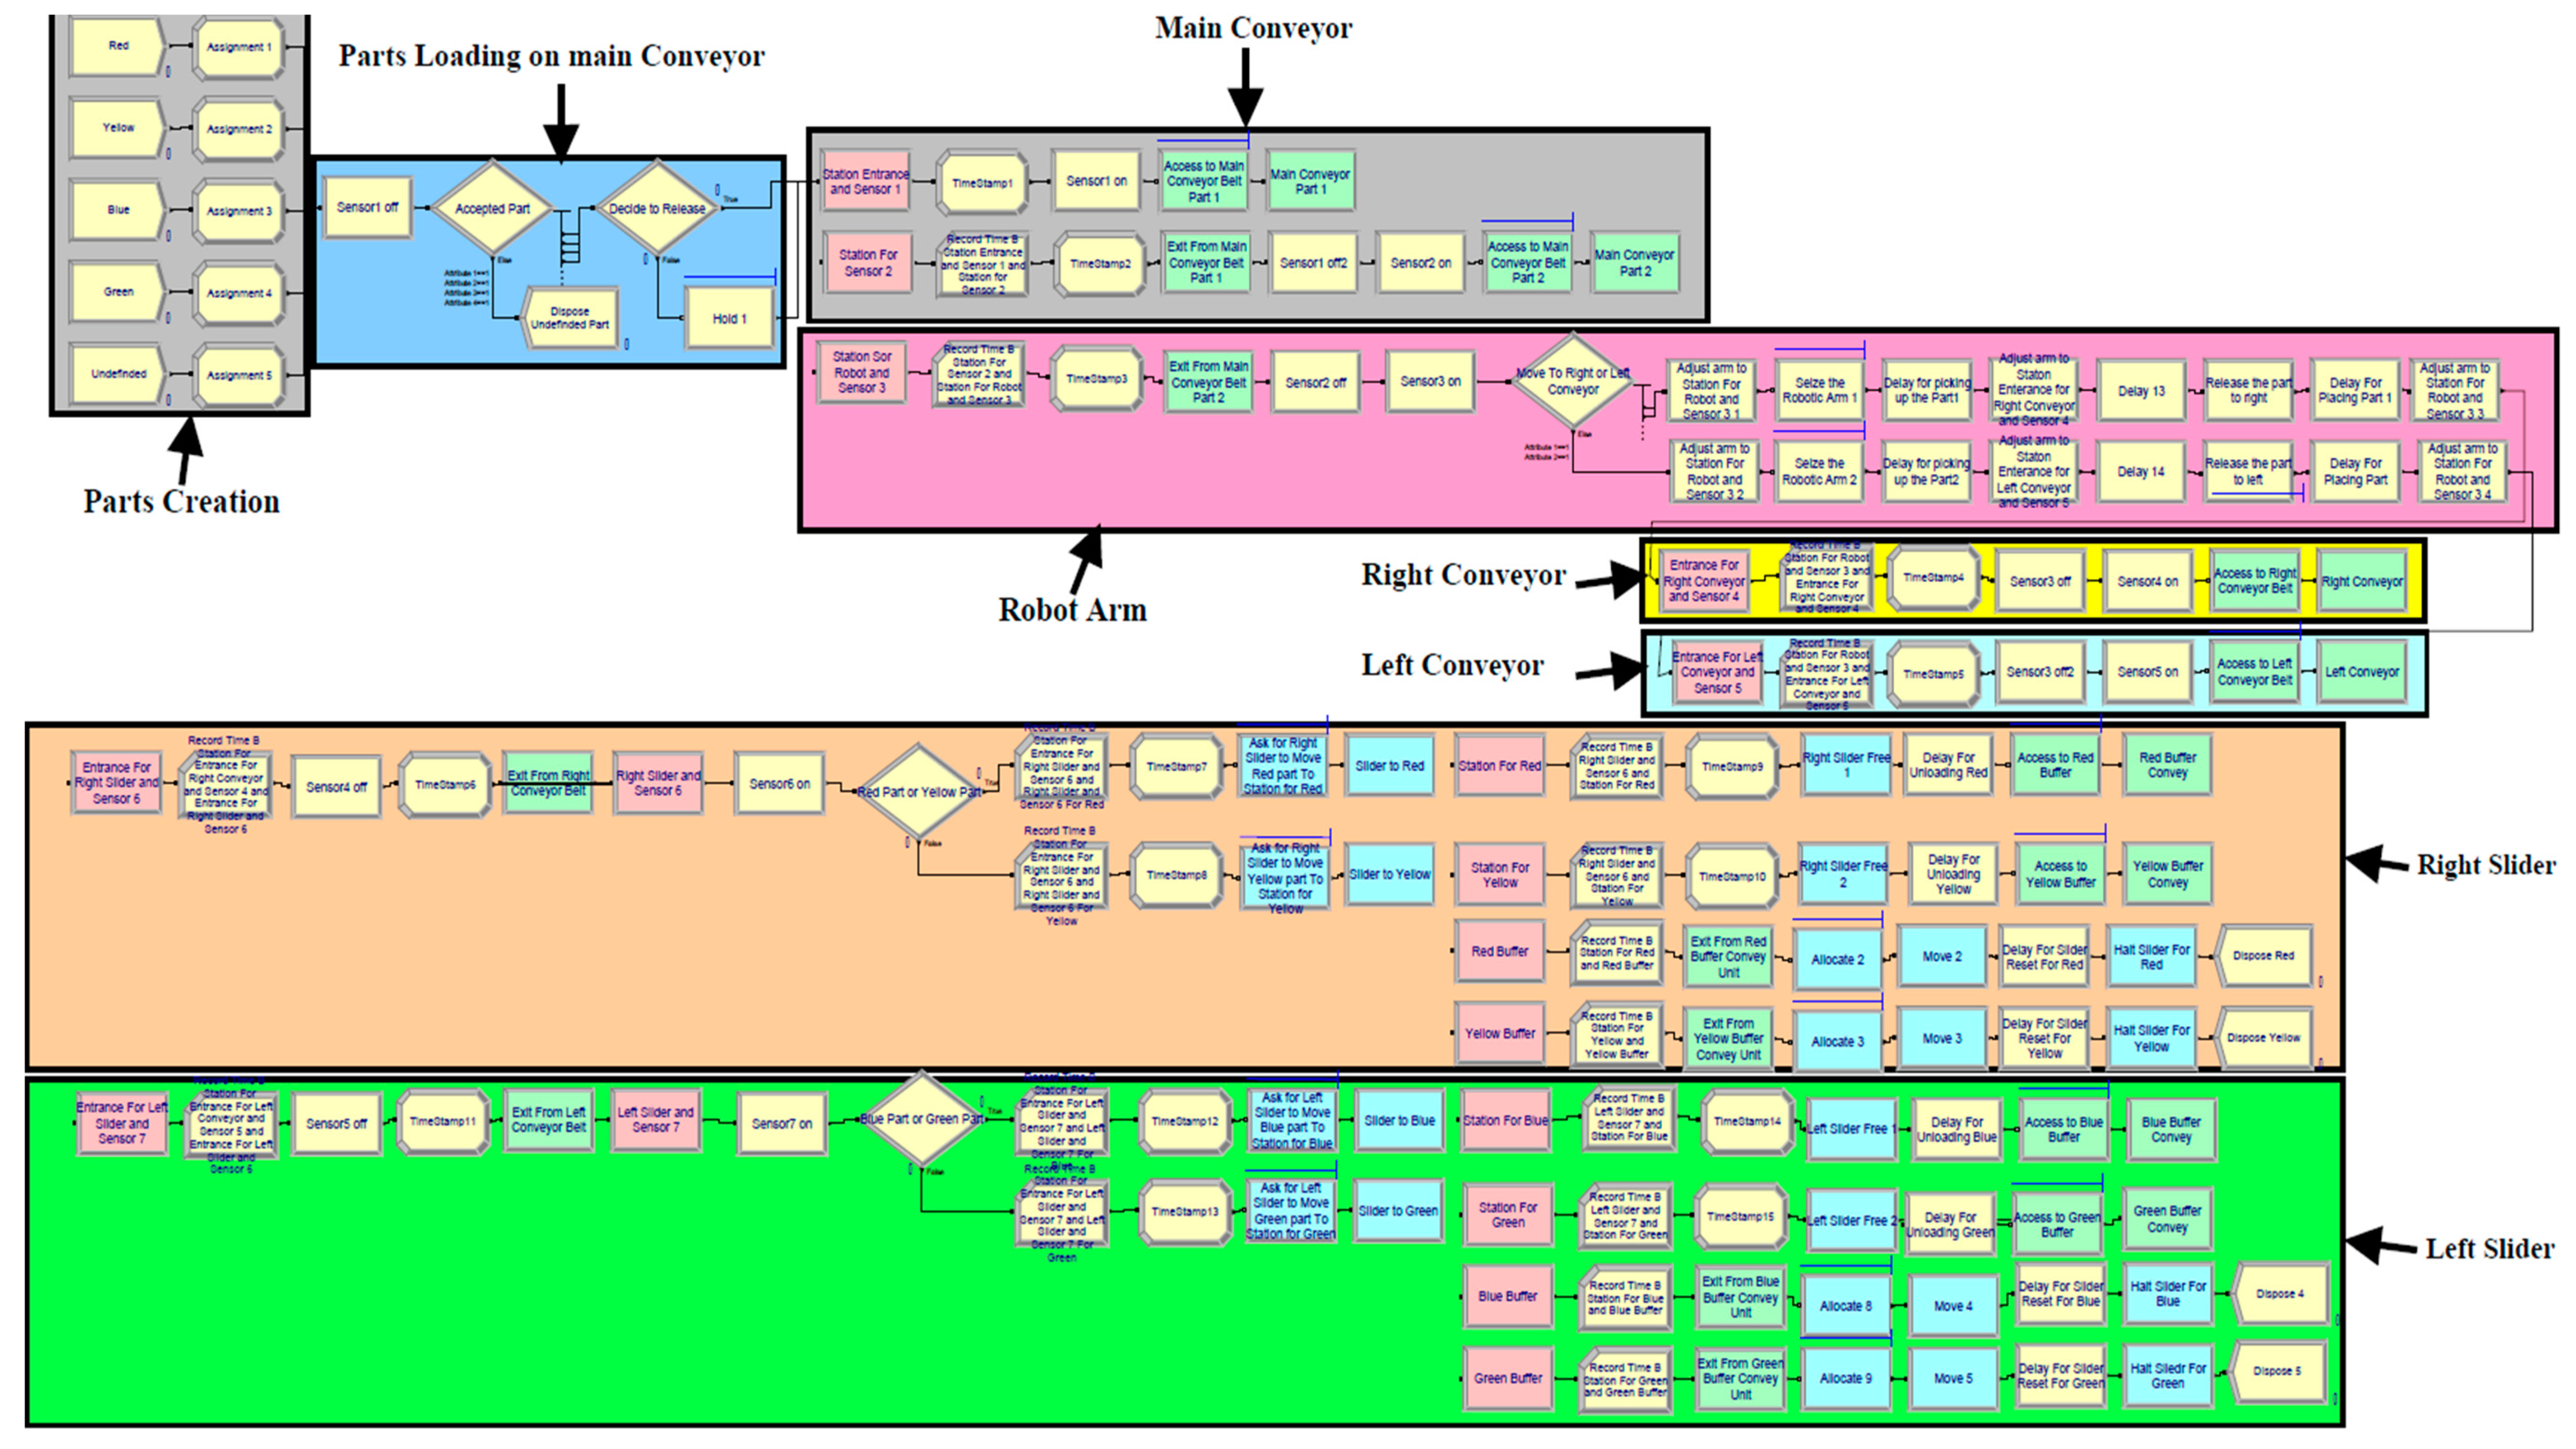
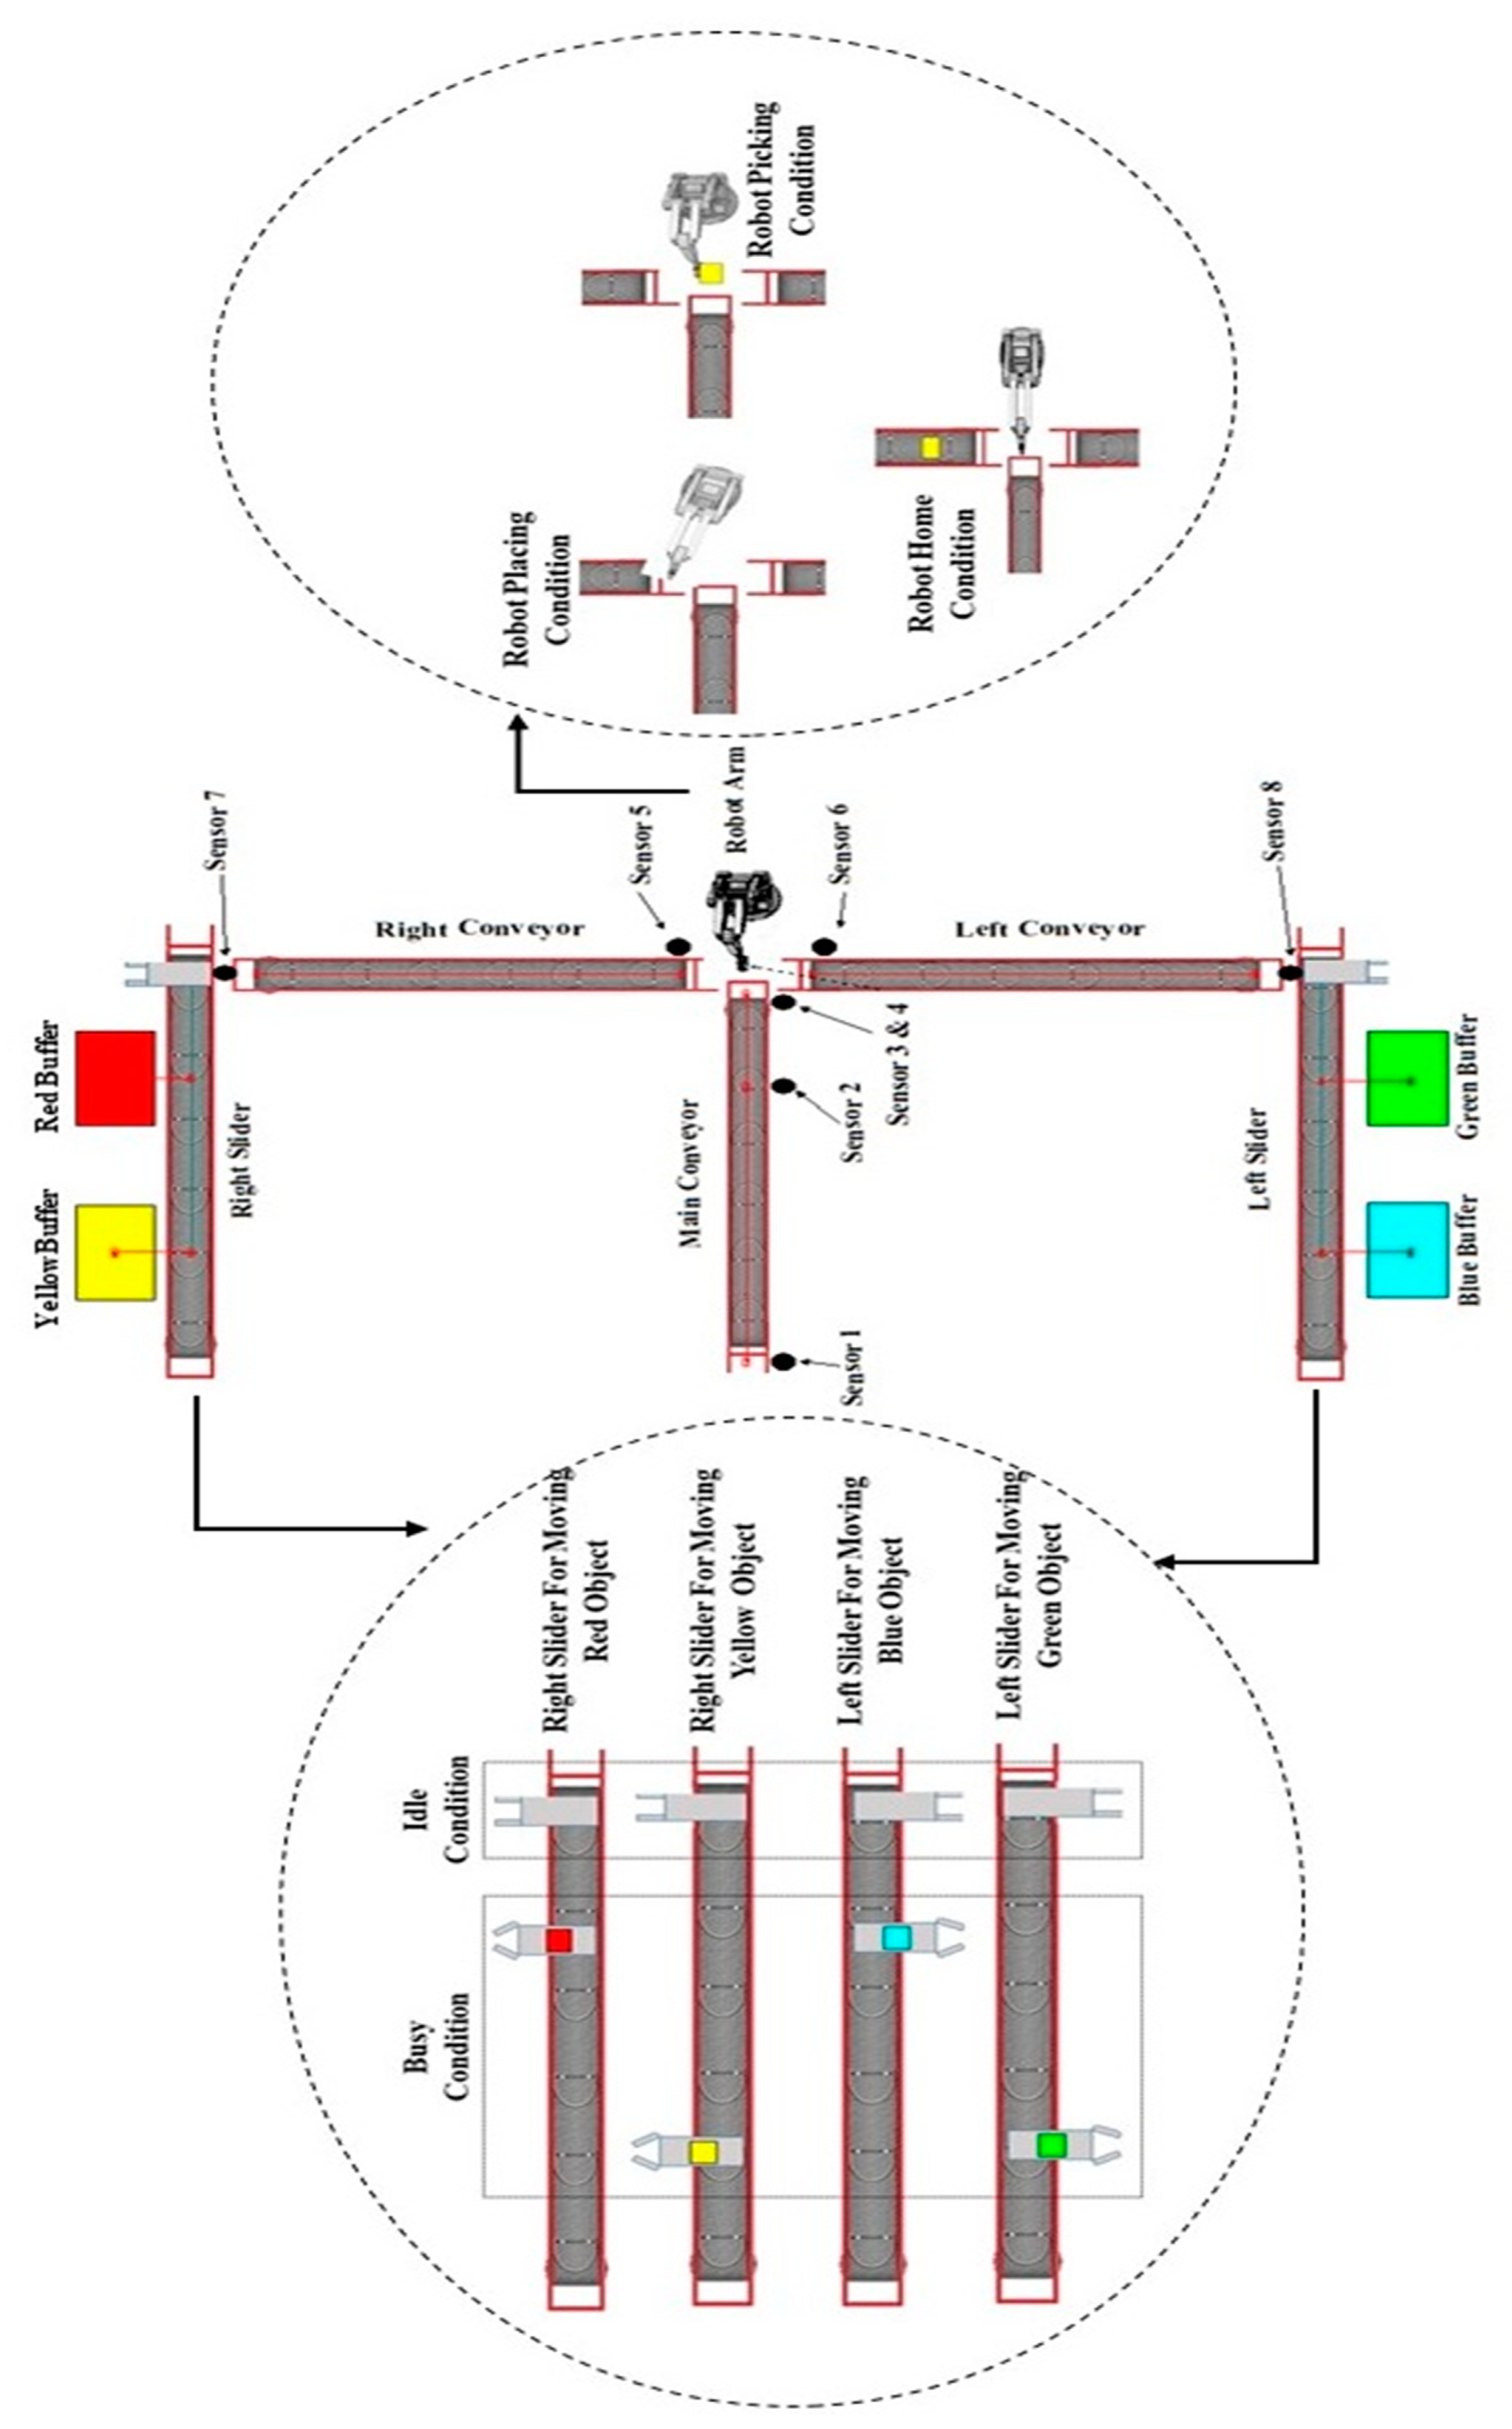
To achieve behavior most similar to the real system by way of the simulation mode, it is mandatory to consider every hardware, software, and layout design specification in the model as they are in the real system. For this reason, the model was divided into different districts, which were the entrance of the system and the points at which parts were being loaded onto the system, main conveyor, Right and Left Conveyor, Right and Left Slider units, and Robotic arm (identical to the available resources in the first stage of research).
Visualization was applied in ARENA simulation that provided graphics and animation of the system’s functionality. Through the use of graphics in the simulation, the user can gain better understanding of the system which has been modeled. As long as the implementation of any optimization and change in the existing real system which has been modeled is not possible before validation and verification, visualization of the system in ARENA provides one of the best methods for validating and verifying system optimization methods (Figure 6).
To generate an accurate model by ARENA and achieve similar behavior as it would be in a real system, Busy Time was considered as a target. Obtaining the Busy Time for each resource and related task/s required measurements of time, velocity, and distance between the resources for every section. For this reason, five participants with proper knowledge of the system and its functionality contributed to making this measurement have high-accuracy instrumentations. It is necessary to mention that the target factors required for creating the simulation model were obtained by human observation from the real system, meaning that human error may have affected the accuracy of the data. This means that as much as the observations, trials, and number of participants increases, the error will consequently be decreased.
The velocity of objects and resources was measured by utilizing a motion sensor. In this method, an electrostatic transducer in the face of the Motion Sensor transmitted a burst of 16 ultrasonic pulses with a frequency of about 49 kHz. The sensor measured the time between the trigger-rising edge and the echo-rising edge to measure the velocity. The distance between the resources and the displacement of the objects was measured with a laser distance meter to get the most accurate results. Each participant did the measurement individually and was asked to calculate the time while considering the velocity and measured distance (Table 2).
The result was imported into the simulation model, just as it was measured in the real system. Table 3 shows the obtained average Busy time for each task measured by the participants. Table 3 also shows the difference between the real system’s Busy time and average Busy time by the simulation, in which the model’s input data is from the participants’ measurements. The absolute time difference shows there is a 0.5 second difference between the Busy time in the simulation model and in the real system (Figure 7). Thus, the simulation model has the functional specifications of the real system, and is reliable for applying any modification.
The designed and implemented intelligent material handling system, with its related time study result and analysis, were evaluated by using the OEE standard to get the overall system performance. Detailed results of the OEE percentage for each resource and the entire system [27] have been illustrated by Yazdi et al. in [27], as well as in Table 5. This percentage provided an accurate view of how effectively the manufacturing process was running, and made it easier to track problems and improvements in the system over time. A detailed analysis of the OEE [27] results has been provided by Yazdi et al. in [27].

OEE Analysis after Optimization

After OEE analysis of the existing system and identifying the problems and limitations of the system which affected the OEE percentage, it was possible to modify the system to compensate and fix these issues and optimize the system. In order to reach this goal, an objective function was considered to evaluate the optimal methods and ideas.
For this reason, all of the system parameters which can be modified to optimize the system were formed as a parameter vector:
p = [ p 1 , p 2 , p 3 ]
where p is the objective function, p2 is the distance between the stations or segments, and p3 is the devices’ speed of motion.
p1 is the production time, including Idle and Busy times:
T i , T b p 1
where Ti is the Idle Time and Tb is the Busy time.
Time is influenced by the velocity and distance between the considered object, meaning that:
p 1 = p 2 p 3
p 1 , m i n = p 2 , m i n p 3 , m a x
It is obvious that by decreasing the tasks’ durations (Busy time), the system’s resource Idle times will be subsequently decreased. In addition, Idle time will be affected by many other parameters, such as the quality of the products and production planning. This means that idle time varies by changing different parameters. C1 is the effectiveness coefficient of idle time, and shows that in different systems, Idle time has different effects. C2 is the effectiveness coefficient of Busy time, which was evaluated internally for each resource and rarely affected by other parameters which are not related to the resources itself.
p 1 = t = 0 T C 1   T i + C 2 T b
The proposed optimization methods in this study focused on time, speed, velocity, and layout design of the system. These parameters simultaneously affected Idle and Busy time. However, the influence of the changes in Busy time was more than the Idle time. Thus, to investigate the influence of each of the proposed optimization ideas, C1 was assumed as 1 so as to only investigate the effects on Busy time.
C 1 = 1     p 1 = t = 0 T   C 2 T b
Since the aim of this study was to evaluate the optimization ideas and their effects on the OEE percentage, and as mentioned previously, time has been selected as the key affecting factor on OEE, optimization of timing was the outcome of the objective function. The time, p1, which is the production time, should be minimized. As mentioned previously, to reach the minimum p1, p2 (Distance) should be minimized and p3 (Velocity) should be maximized.
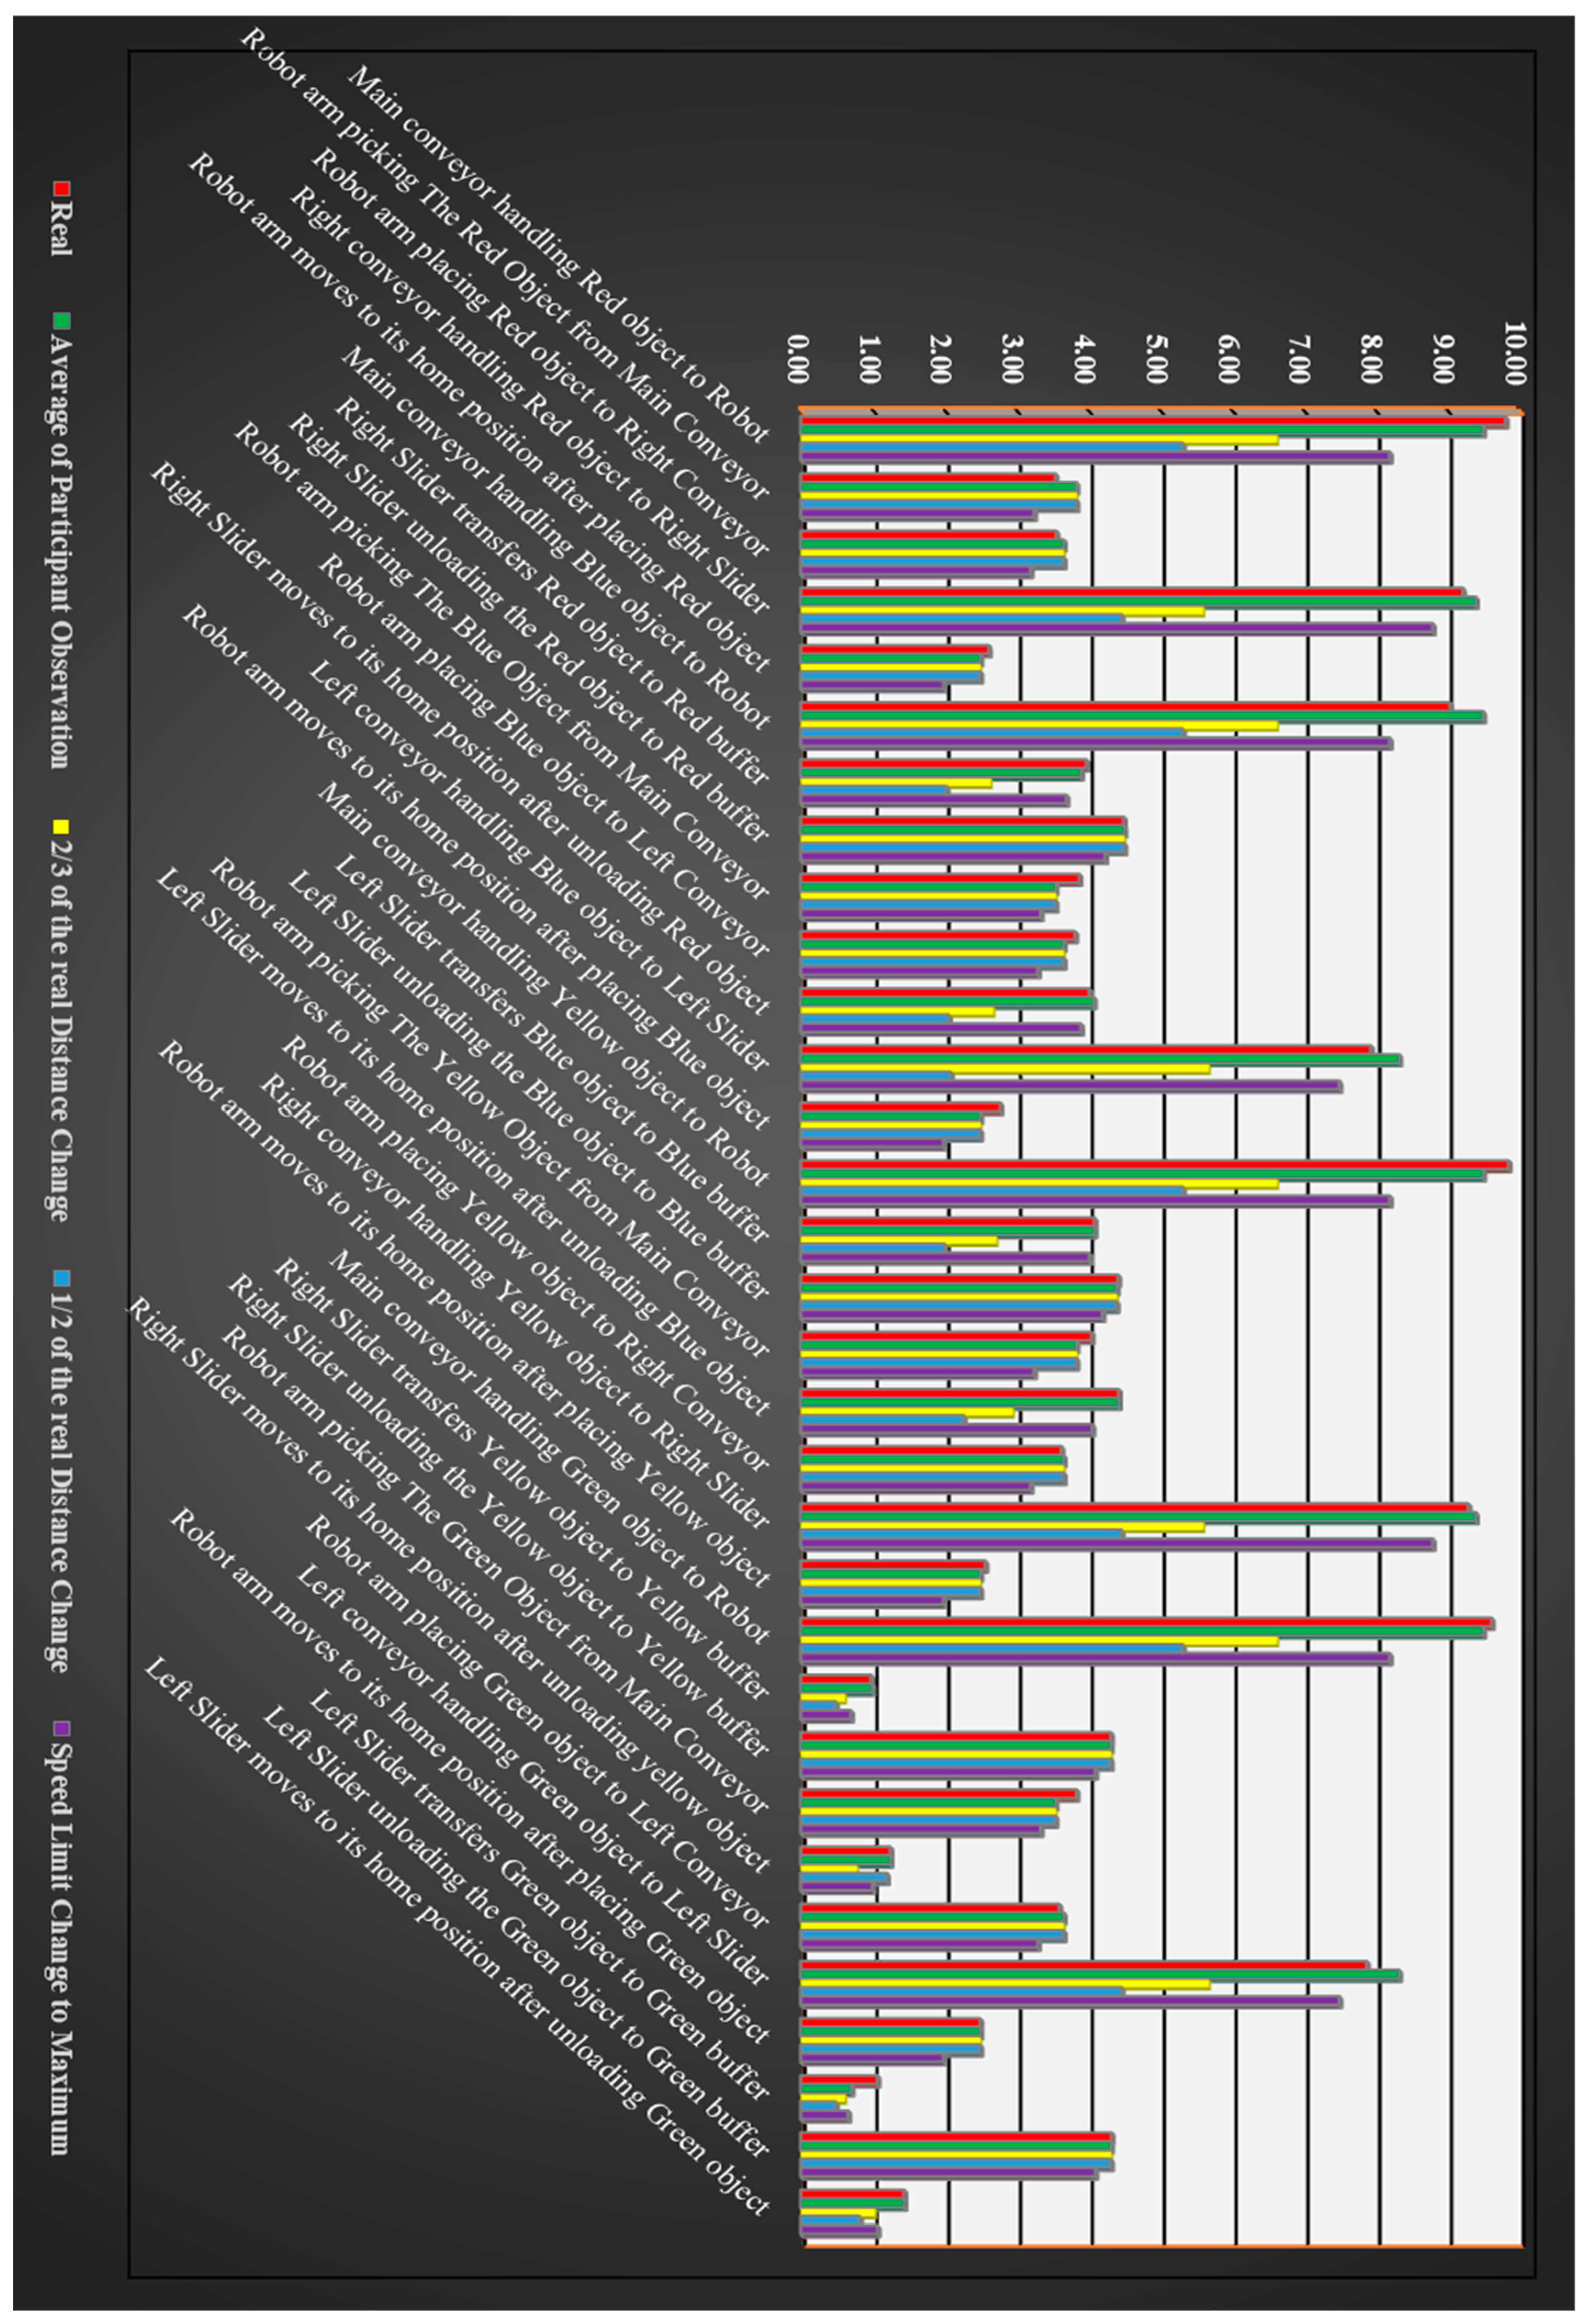
Following the instructions above and to verify the optimization ideas, the velocity of the resources was modified to the maximum possible value in the simulation model. The increasing of the velocity was based on the real resource’s capacity, and the properties and limitation of the proposed control architecture. For instance, the velocity of the conveyors was increased to the point that the conveyor could handle the objects accurately with less vibration during the transportation. For this reason, without changing the system layout, several tests have been done practically on the similar conveyor to get the maximum velocity value.
The effects of the layout design and distance between the segments were investigated by changing the place of the sensors, instead of changing the length of conveyors in the simulation model.
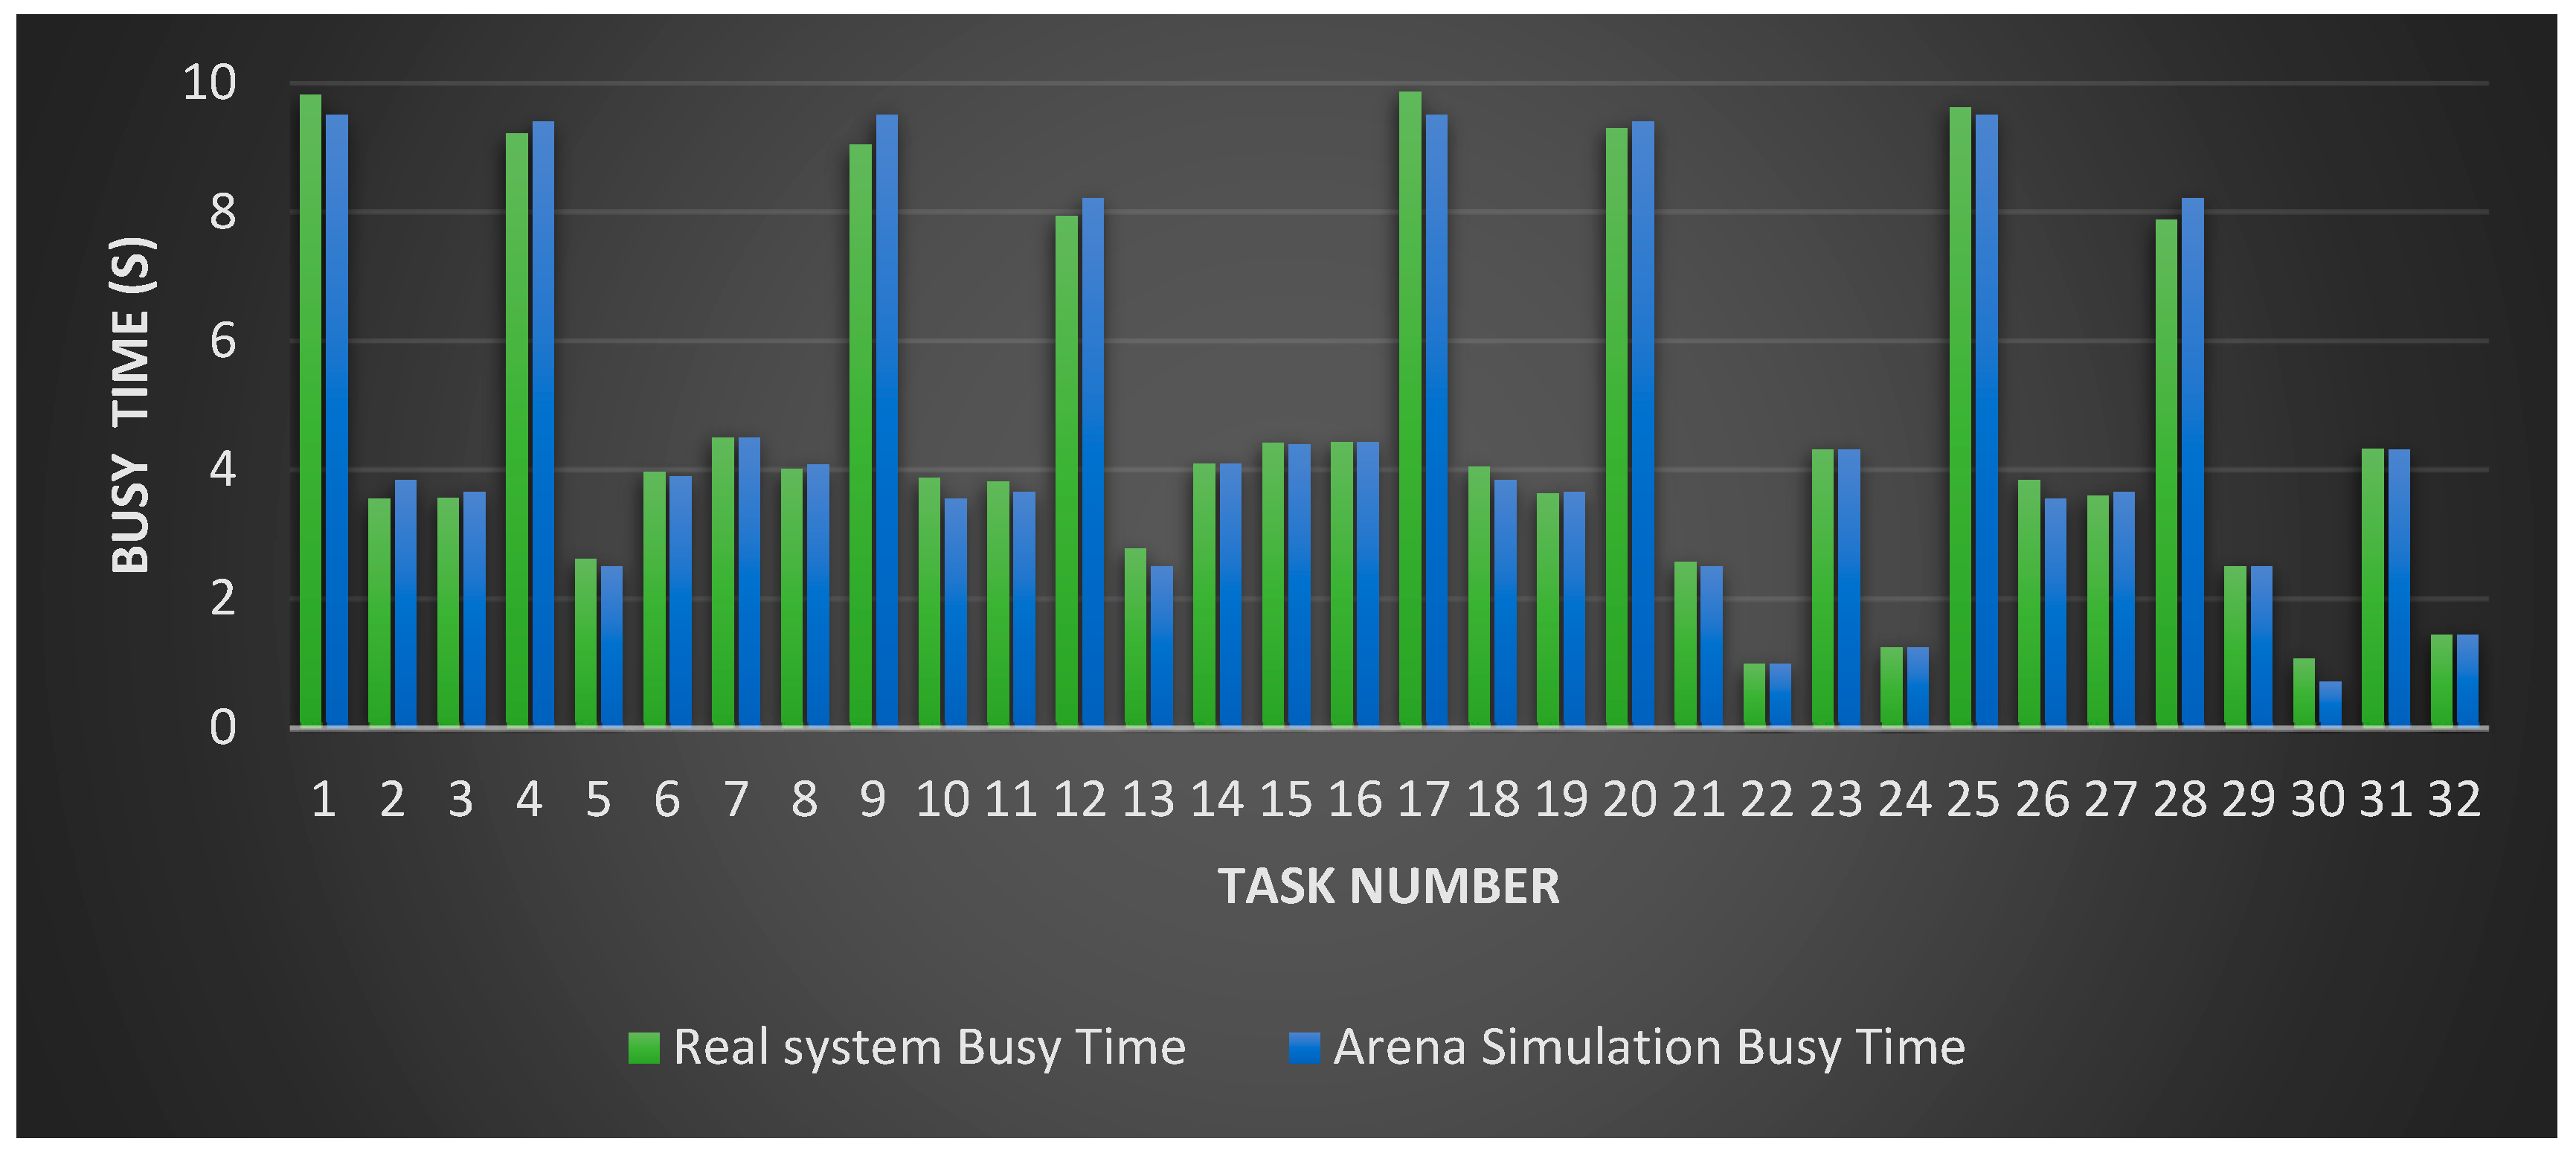
 Table 4 and Figure 8 show the simulation model modifications for investigating the effect of the optimization ideas on the system resource’s Busy times. In addition, a comprehensive comparison between the Busy times before and after implementing the optimization idea on the simulation model has been visualized in Figure 8.
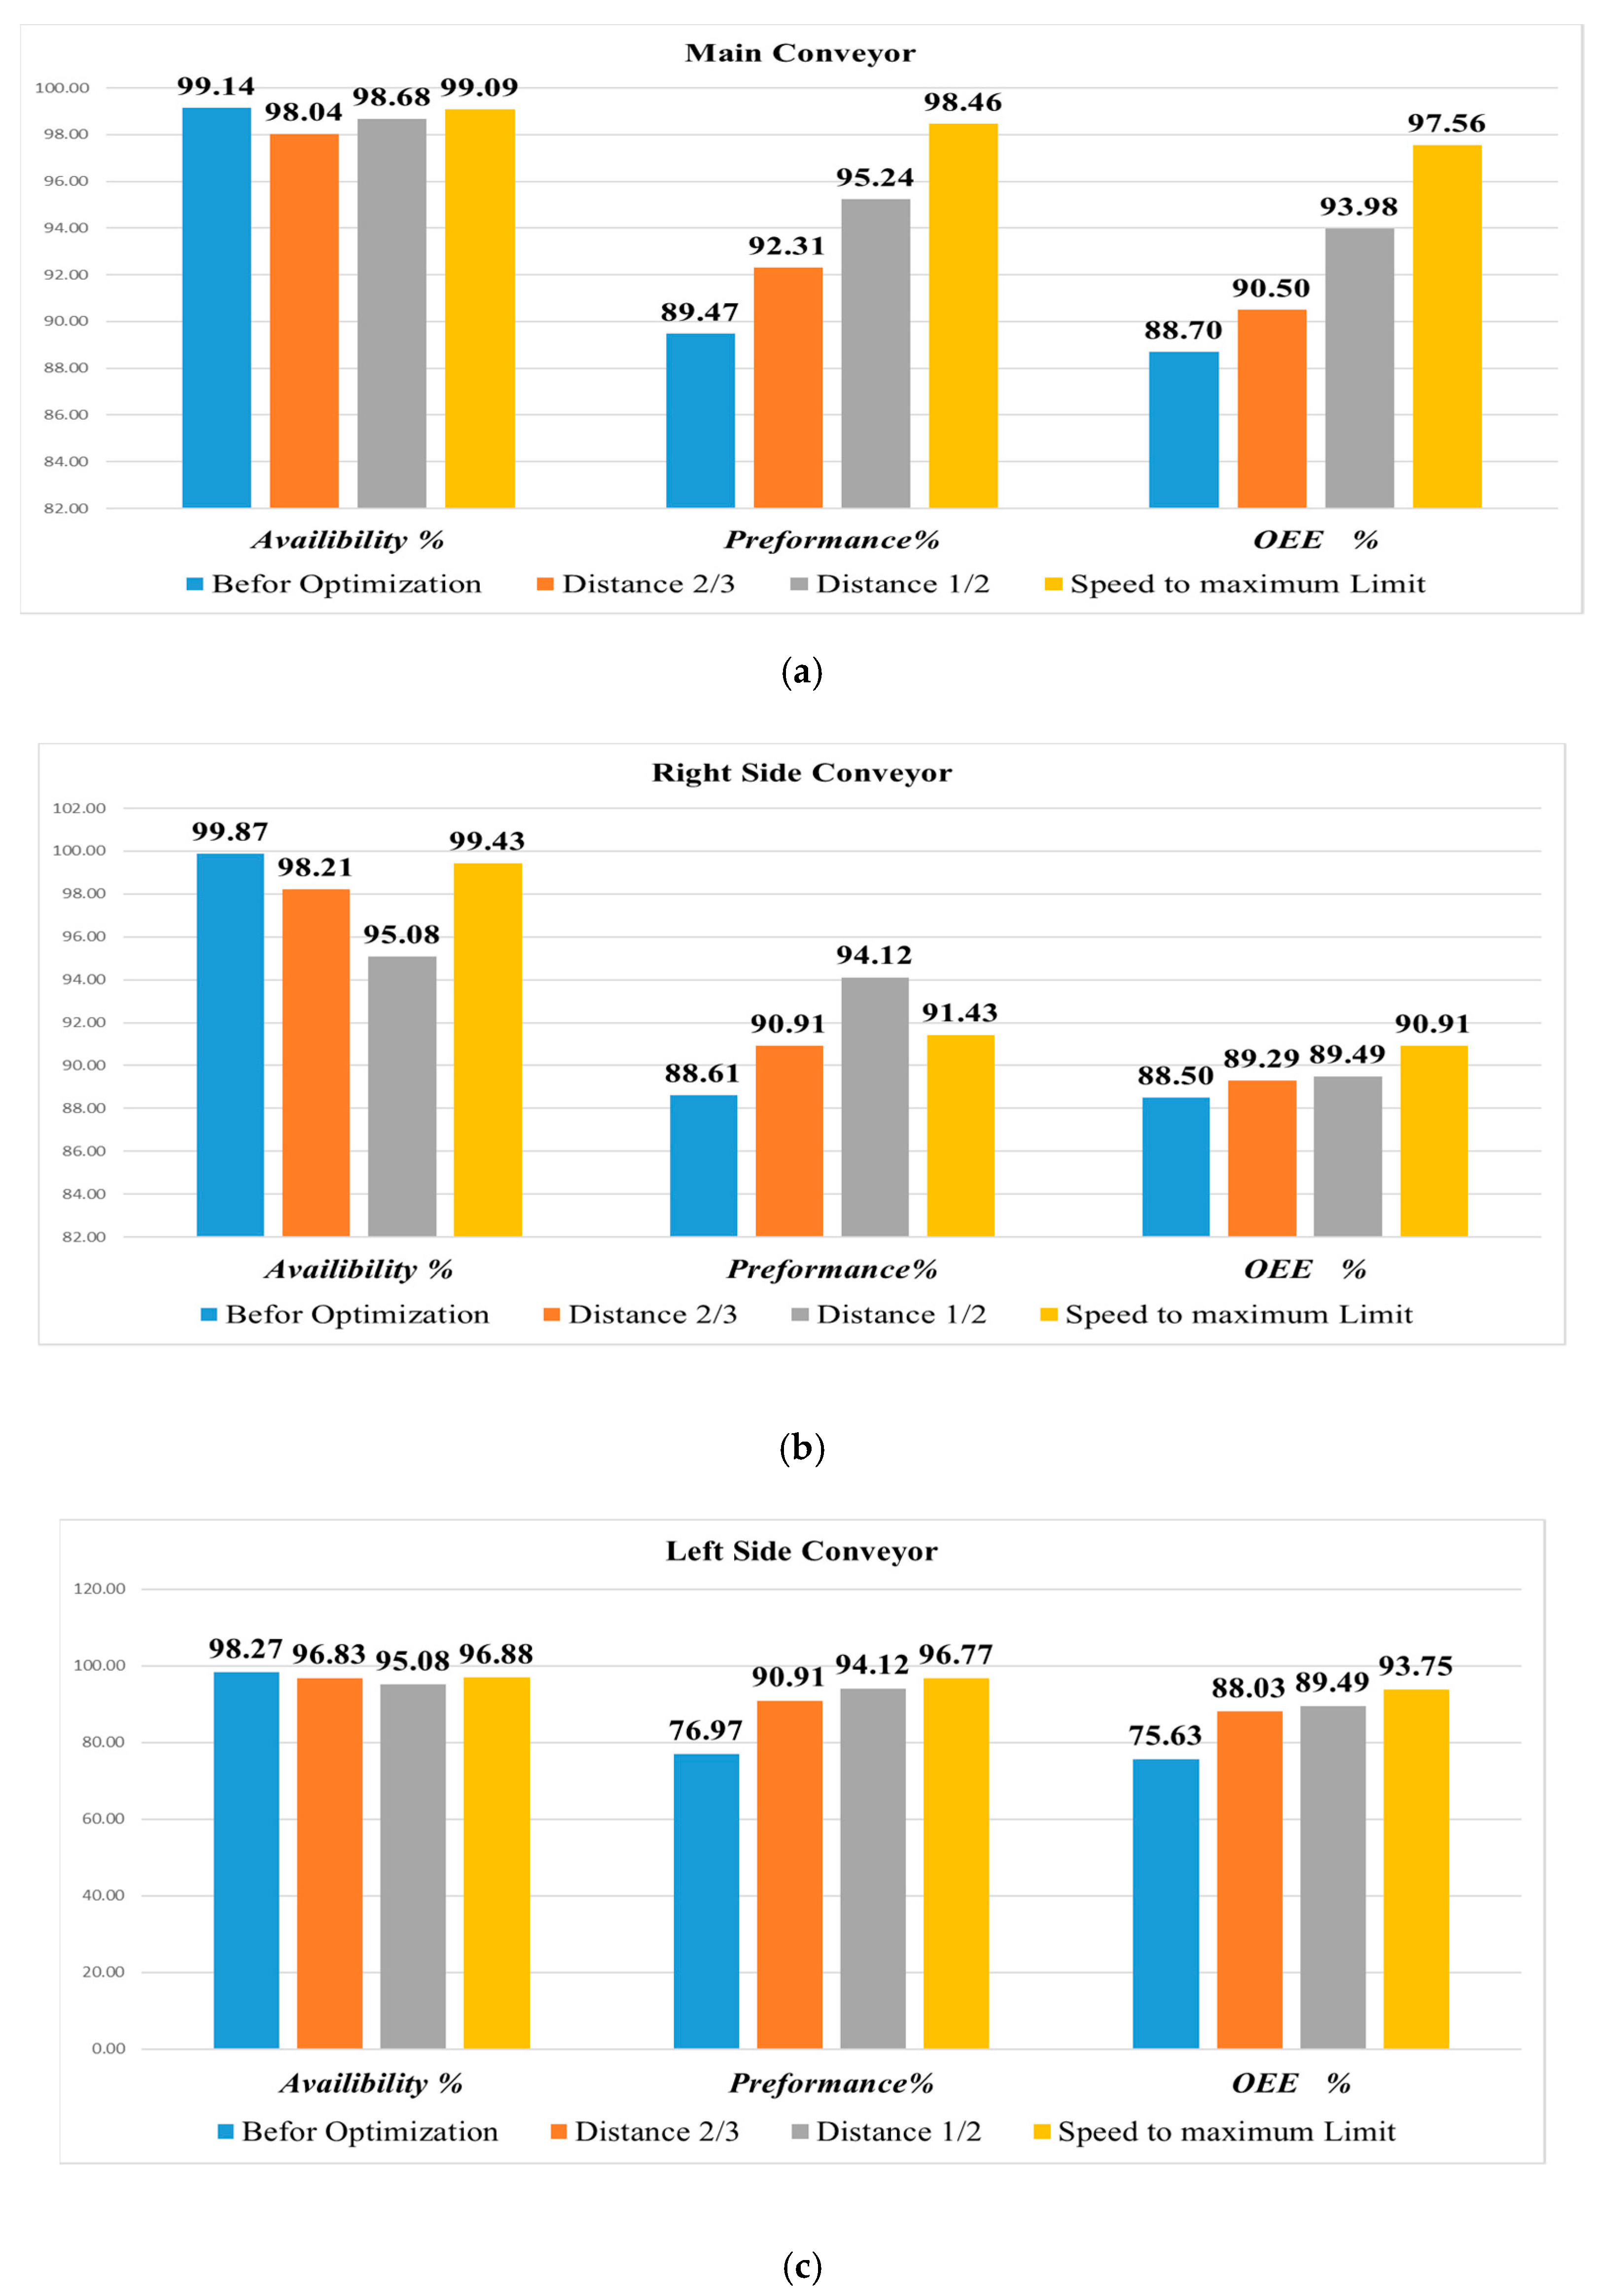
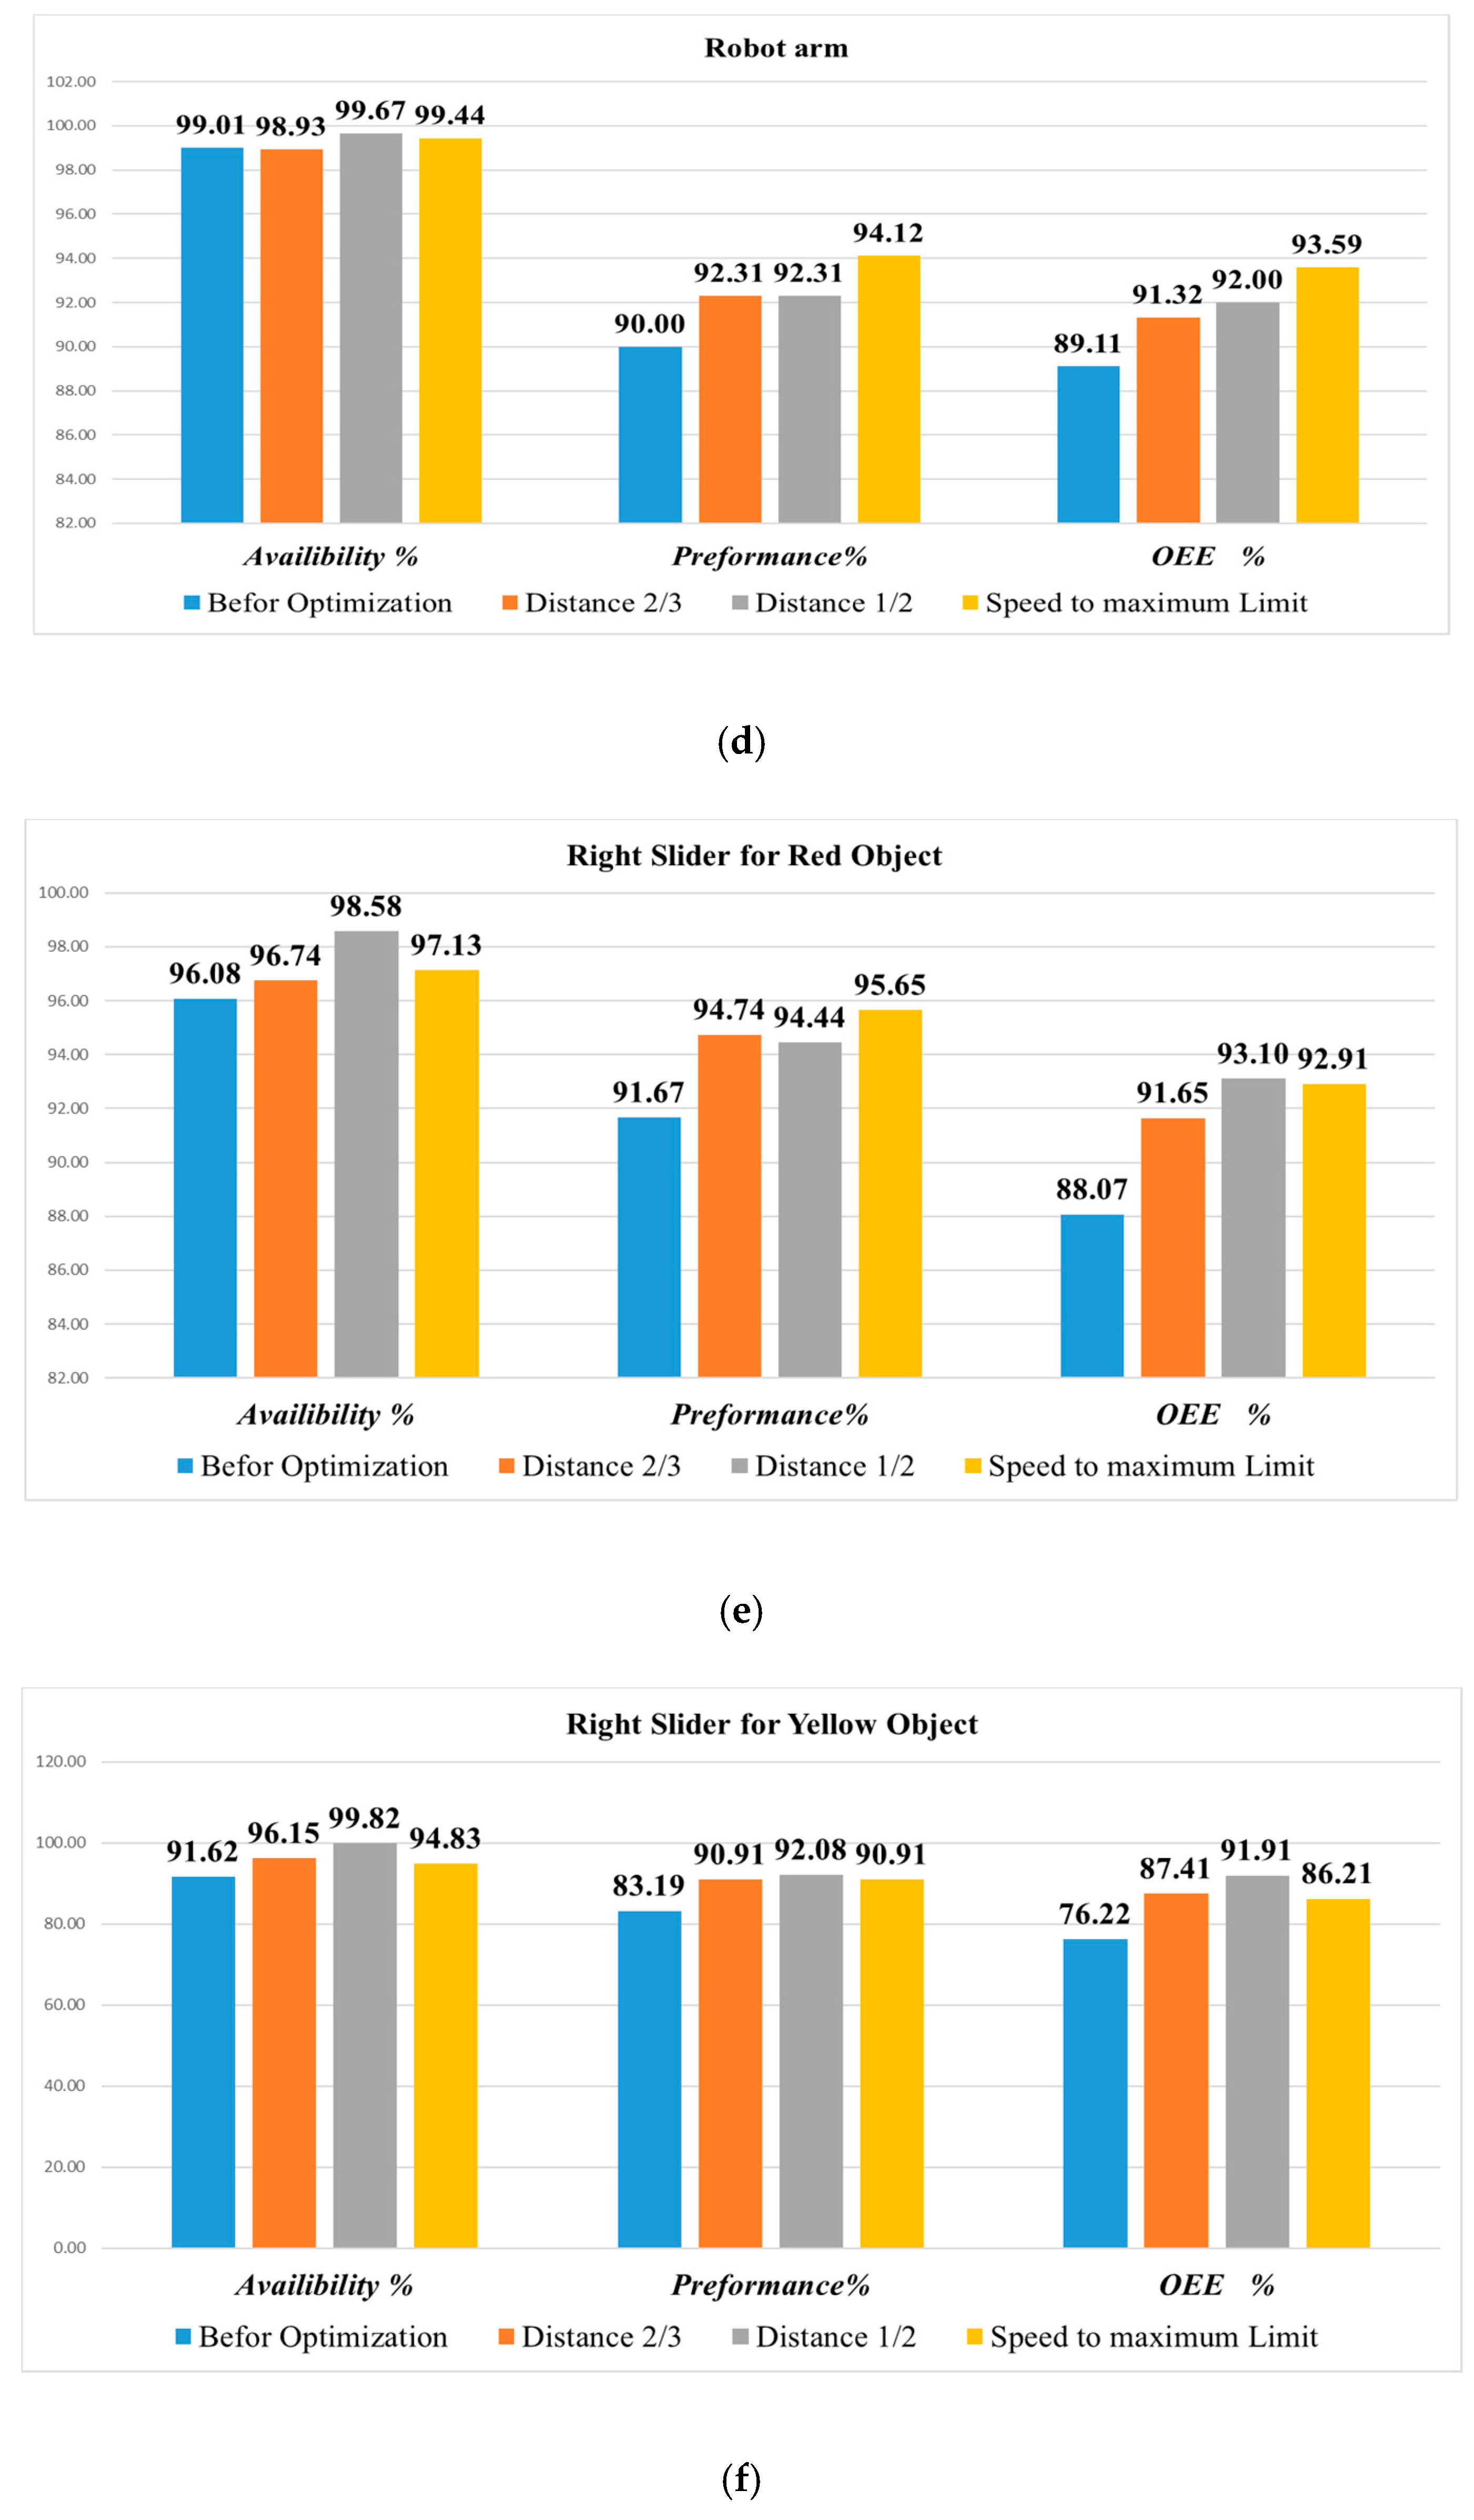
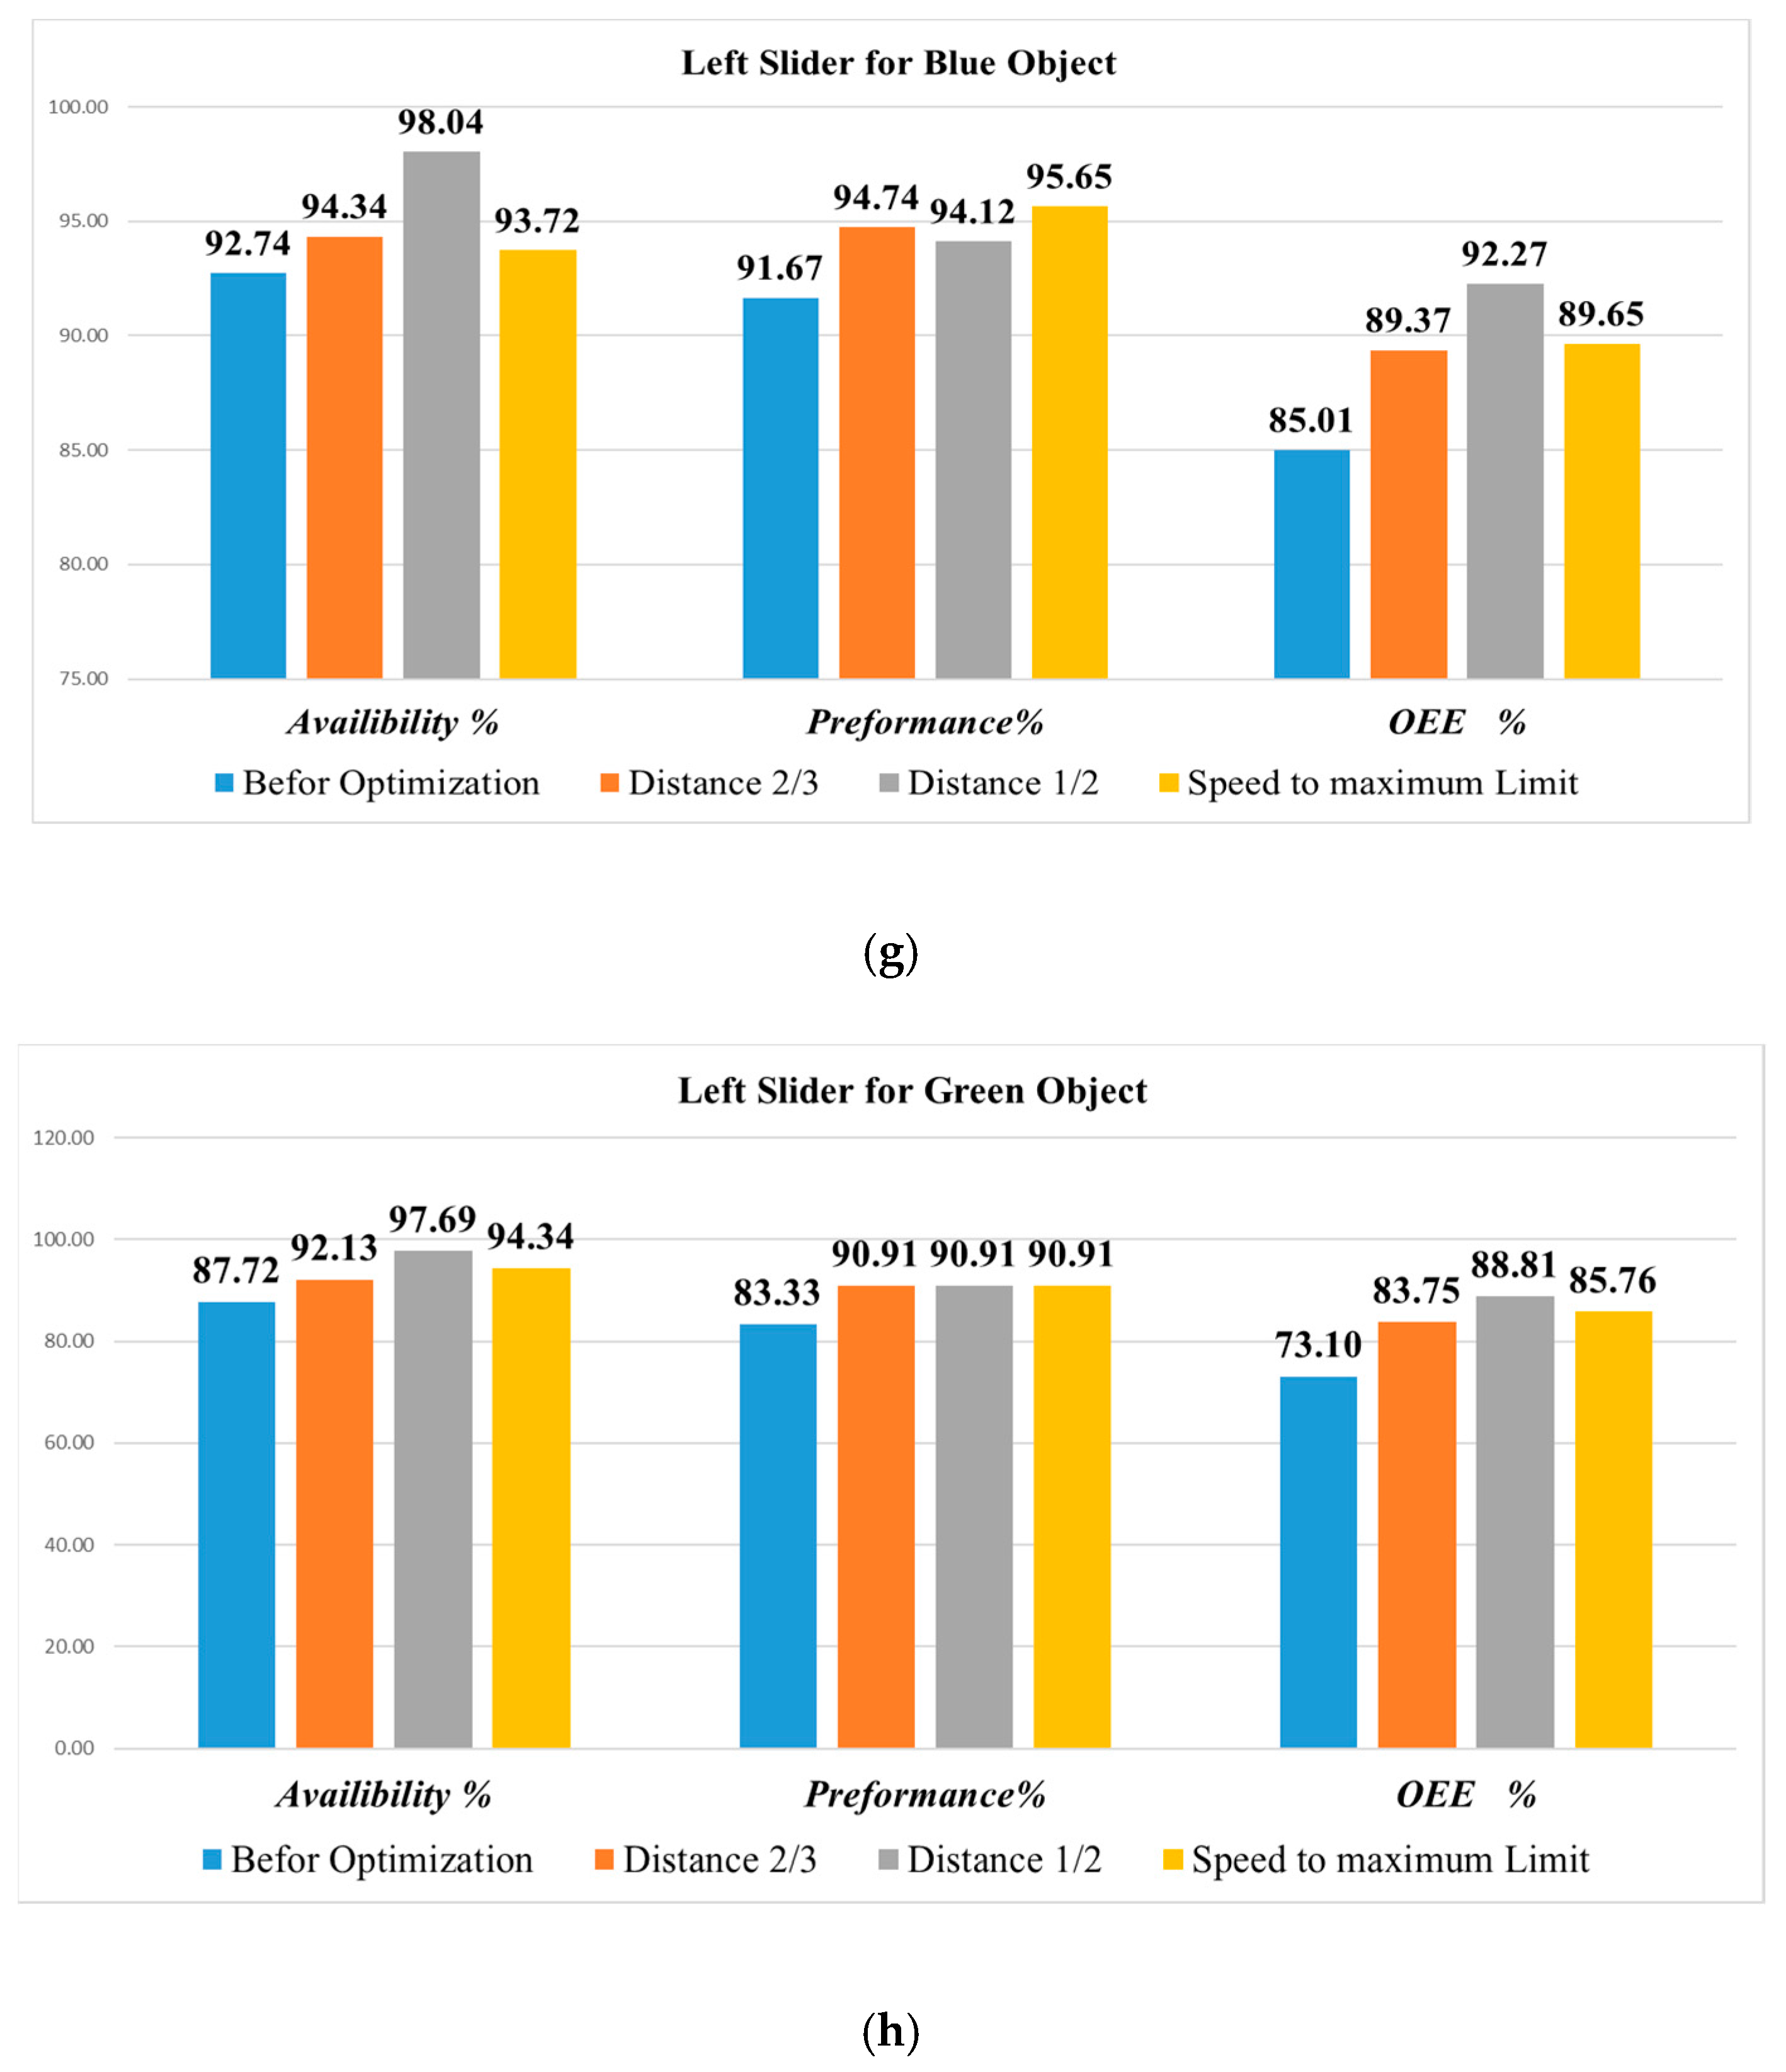
In order to investigate the effect of optimization solutions on OEE percentage, calculating the availability, performance, and quality are essential. As mentioned previously, the quality of the objects was considered as 100% because of the real system’s characteristic (parts distribution). The factors required to obtain the Availability and Performance percentages were calculated individually for each system modification and each resource (Table 5).
To obtain the effect of each optimization solution in each resource and choose the most effective one, Figure 9a–h have been provided to ease the investigation by visualizing the outcome of the system OEE and related factors after the optimization solution. Each part of Figure 9 shows the percentages of Availability, Performance, and OEE, respectively, for each resource.
Analyzing the outcome of the system modification on the simulation model verified that the overall equipment effectiveness (OEE) was significantly improved by each category of the optimization methods. However, this improvement has a direct relationship with system performance and availability. In almost all of the resources, all of the optimization methods increased the performance of the resources, but not equally.
Figure 9a–h shows that the layout design and changing the distance of the segments (decreasing the distances to 2/3 and ½ of the actual distance in the simulation model) by modifying the resources’ layout design improves the OEE percentages of all of the resources which are connected, along with the conveyor units.
In the main conveyor, due to having two different segments (between sensors 1 and 2 and sensors 2 and 3) with different speeds, modifying the speed had the most effect on the OEE percentage. The OEE percentage of the conveyor was increased between 1.8% to 8.8%, in which the minimum effect was due to decreasing the distances to 2/3 of the actual size, and the maximum effect was due to increasing the speed of the conveyor segments.
The same behavior of the OEE percentage changes was observed for the robot arm. However, it was not as significant, compared to the main conveyor. As long as the robot arm performance was affected by the main conveyor performance, it showed similar improvement to the main conveyor. Furthermore, the robot’s motion speed is the only factor that can change the robot OEE percentage, but the speed depends on the robot’s pick-and-place point distances to move the objects. This means that the distance and speed modification affected the Robot OEE percentages, and was between 2.21% and 4.48%.
The results which have been observed for the side conveyors are mostly like the main conveyor. The improvement in OEE percentage is between 0.79% to 2.41%, where the maximum improvement was the result of speed change. Negatively, the OEE percentage significantly improved in the left conveyor to between 12.4% to 18.12%. This considerable range of improvement is because of the equalization of the left conveyor length (this issue was discussed in the first stage of research).
Sliders have different behaviors in regard to the performance improvements by optimization methods. The percentage of OEE improves by changing the distance of the segments more than changing the speed. The right and left sliders are same in regard to the effectiveness of optimization methods for a short range of movement.
In the right slider, the OEE percentage of short-range transfer improved between 3.58% to 5.03%. The minimum and maximum values were the result of changing the distances to 2/3 and ½ of the actual distance. On the other hand, the OEE percentage improvement for the Left slider for a short range is between 4.64% to 7.26% for Speed and ½ of the actual distance, respectively.
The left slider for short-range transfer had a 9.99% to 15.69% improvement for speed and ½ of the actual distance change. Simultaneously, for the long range, there was a 12.66% to 15.71% improvement for modifying the speed to maximum limit and the distance to ½ of the actual distance.
Table 6 shows the OEE percentage improvement in detail as the result of the optimization method, considering the most effective parameter as the mentioned objective function parameters.
As the table above shows, all of the proposed optimization methods have improved the OEE percentage of the system simulation model. In addition, it is obvious that the Improvement percentages are not equal for all of the methods and neither for all of the resources. In order to generalize the solution to select the best method, a priority has been considered for all of the methods. This priority is based on the OEE percentage improvement amount.
As the general solution, to optimize the system for the main conveyor, right-side conveyor, left-side conveyor, and robot arm, the speed of the resources should be increased to the maximum limit, and there is no need to modify the distances between the segments due to the OEE percentage improvement being at the highest level. However, in some cases, increasing the speed is not a sufficient method because of the system control architecture limitations. This means that changing the distances between the segments will be the only solution, and as Table 6 shows, it is suggested to select the minimum distances between the segments by considering the layout design of the system.
This optimization of OEE could be generalized to all the systems, including resources which have material interaction by the conveyor and robot arm acting as the material handling system.
For slider units, or for the system generally containing a unit which slides a resource (i.e., Slider Robot arm), the optimization method will be different for a short and long range of motions. As Table 6 shows, for a short range of motions for both right and left sliders, changing the speed has the last priority. However, changing the distance between the segments further increases the OEE percentage. On the other hand, a long range of motion for the speed of both right and left sliders has second priority. This means that if the distance optimization is limited because of the layout design, hardware limitations make it impossible to decrease the distances to the minimum possible value, and changing the speed to the maximum limit is the most effective parameter to optimize the system.
It is worth mentioning that, as a general solution, it is possible to implement all the optimization methods if the enterprise has enough flexibility to handle all the modifications. However, in this research, SMEs are the target, where they are limited and less flexible to handle all of the proposed optimization methods, and it should be the chance for management to select the most effective method for increasing the OEE in the system.
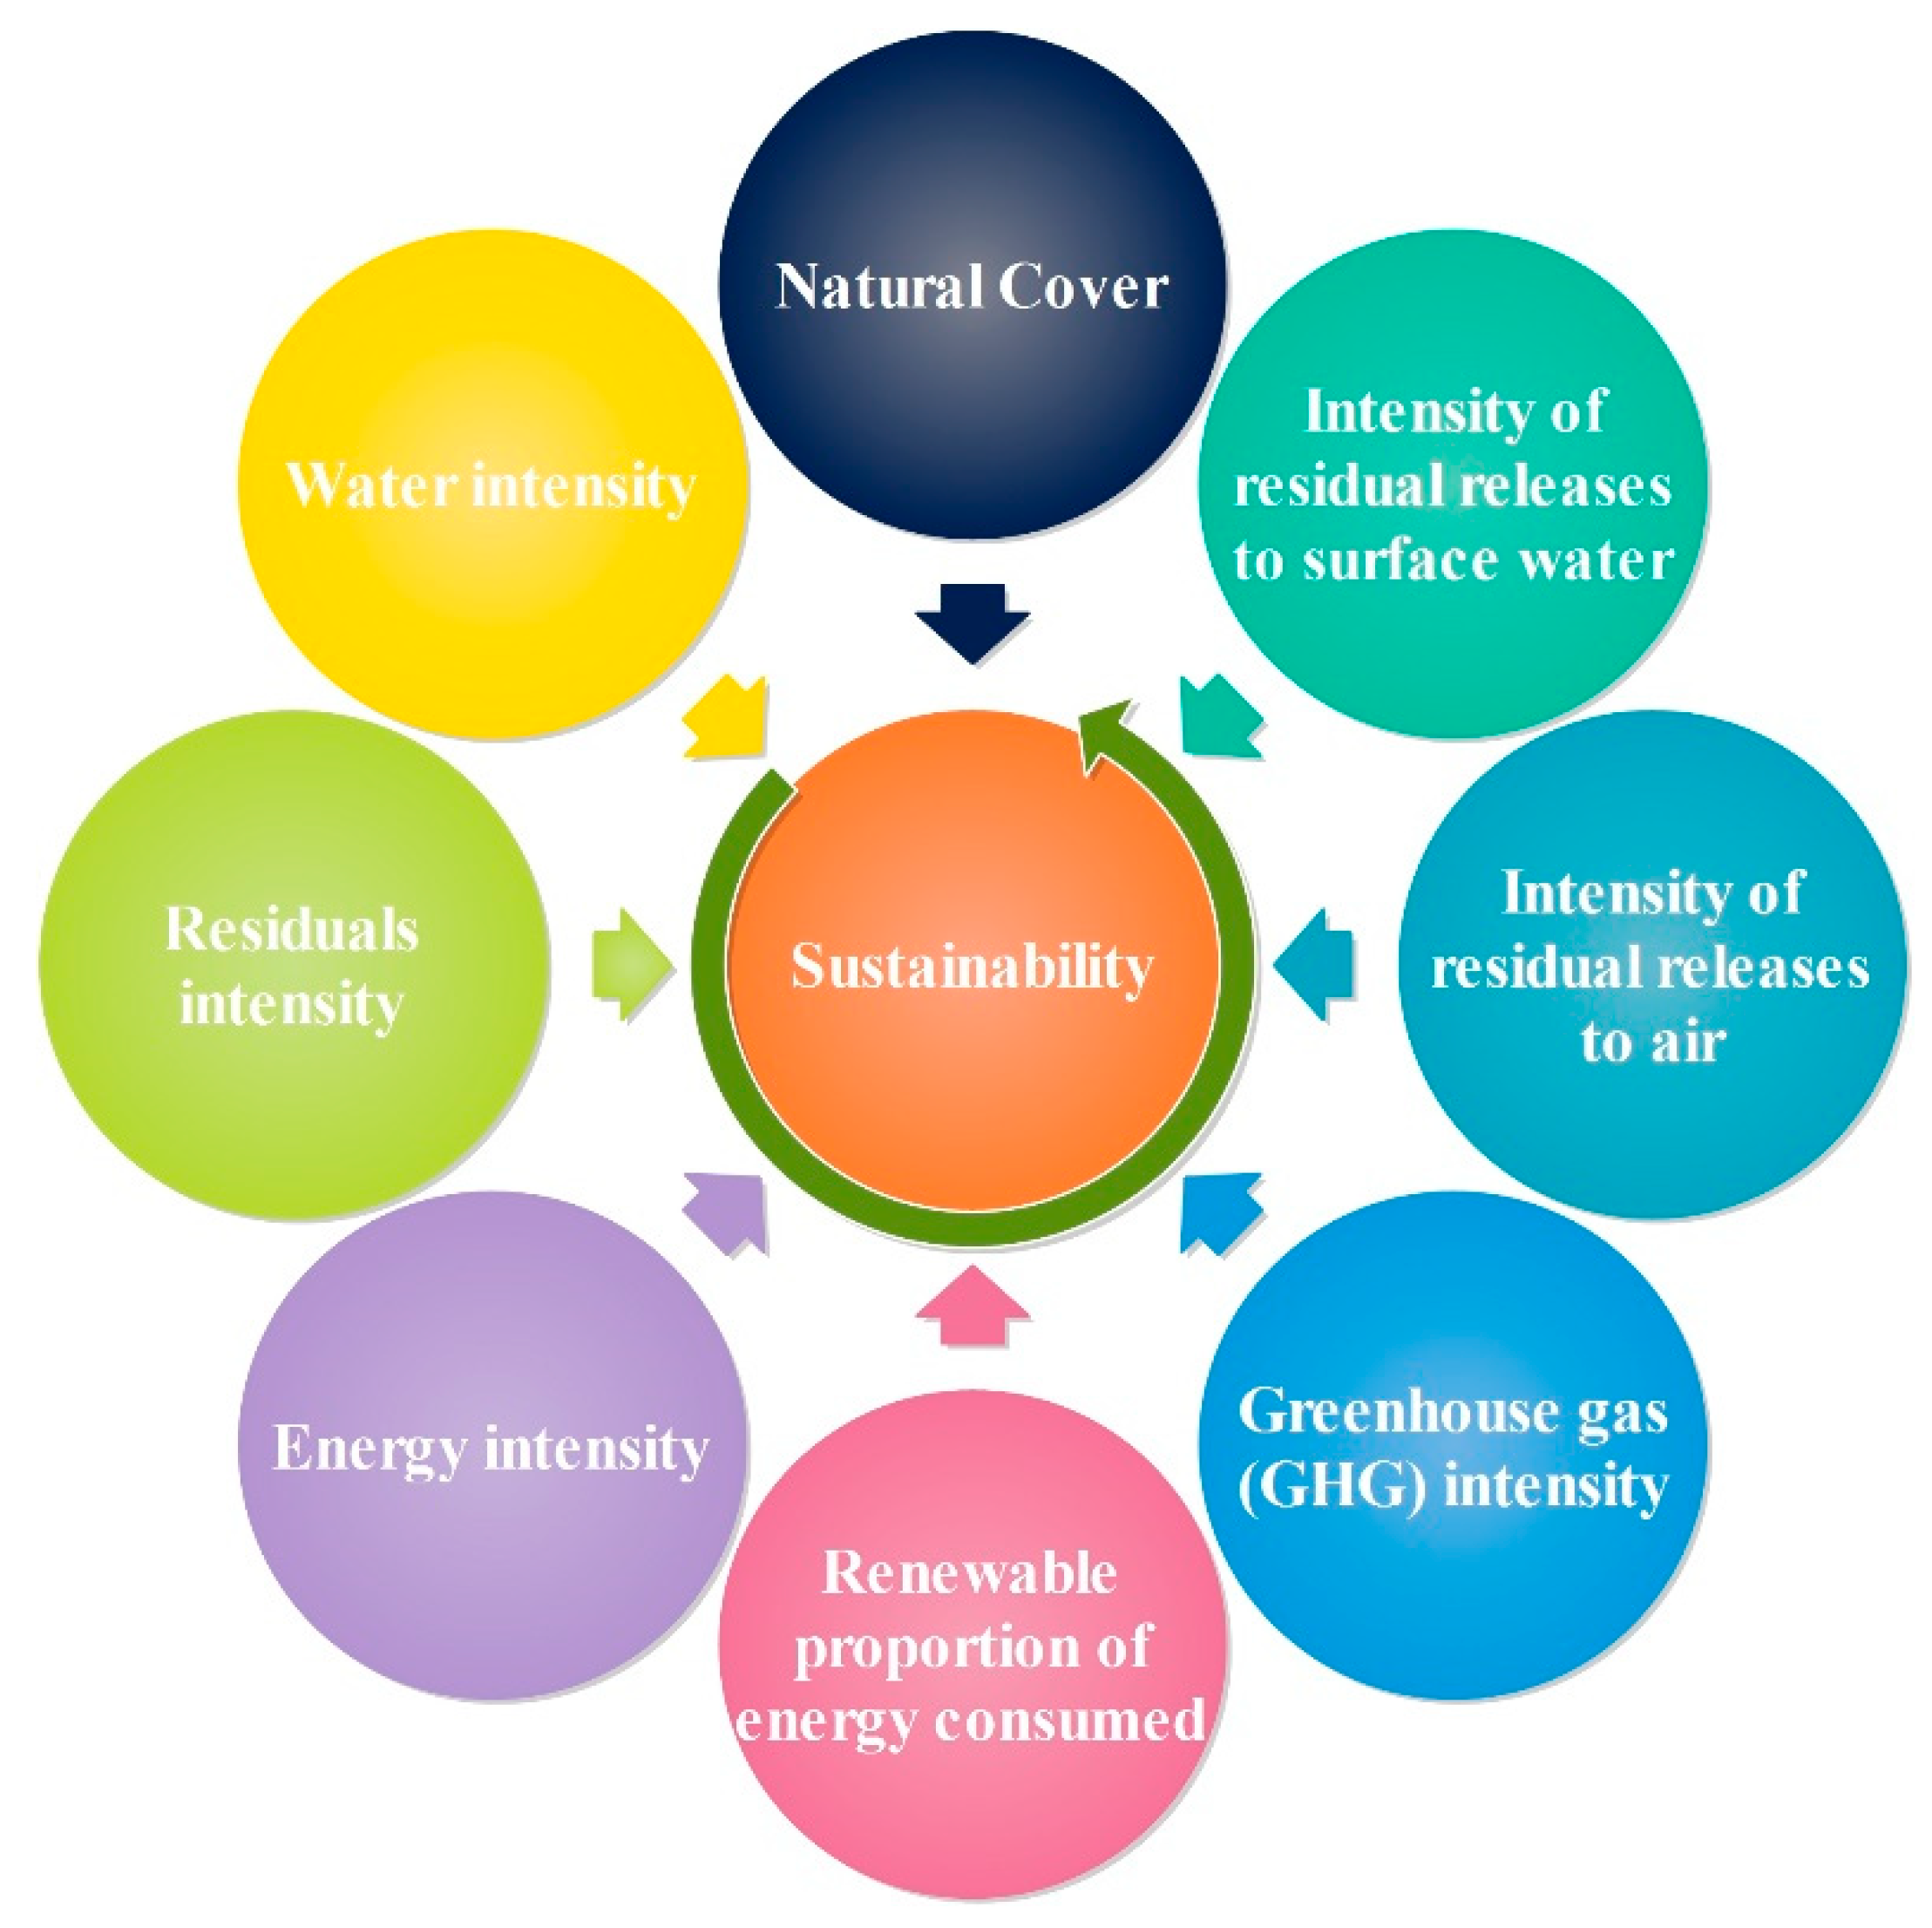
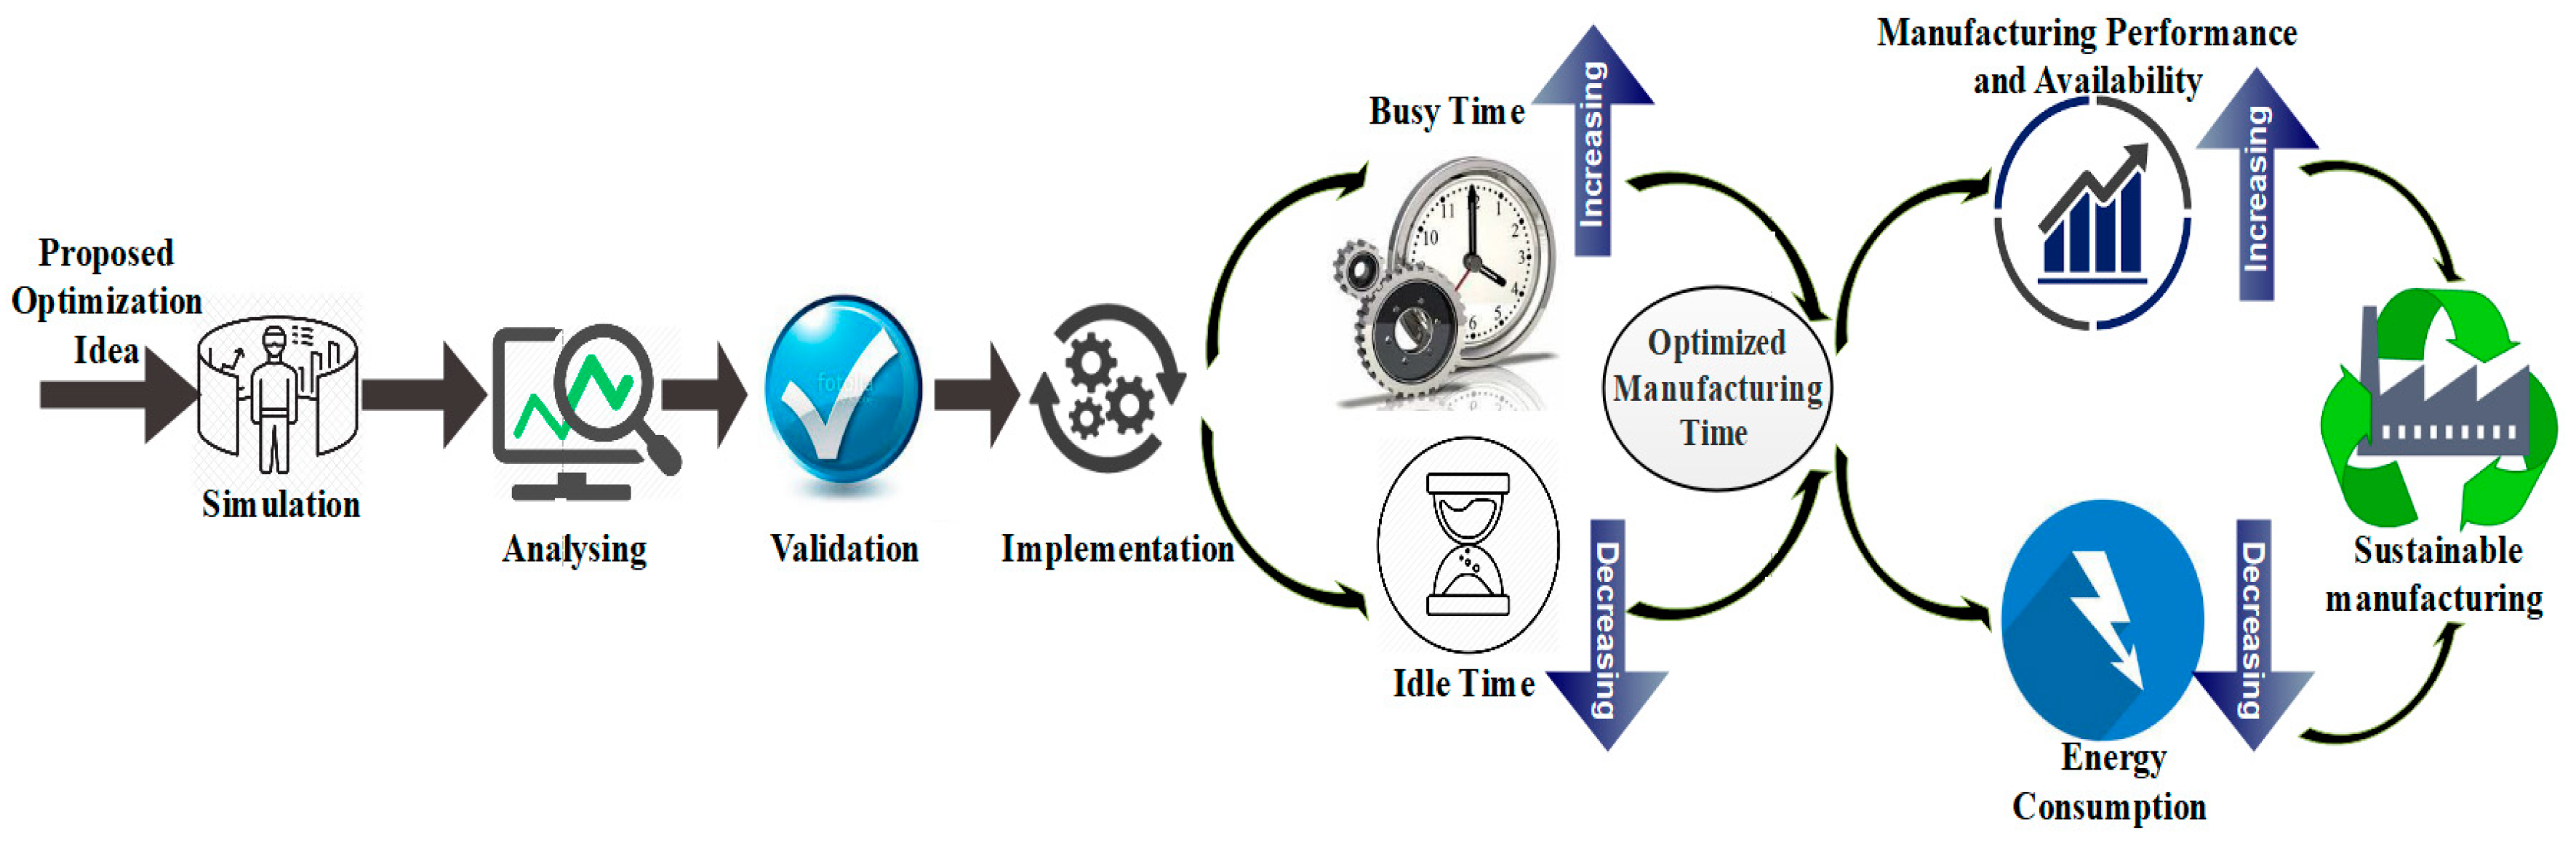
The sustainability of the system is the next target to be evaluated after the investigation of the importance of time in the evaluation of OEE with utilizing simulation. To accomplish this task, the requirement to obtain sustainability has been illustrated. Identification of the environmental impacts on the target system is the first step toward the evaluation of sustainability. Yazdi et al. (2018) stated that out of the available environmental impacts (Table 7), energy consumption has the highest priority. The authors also stated that they selected this impact as the only effective one, due to the property of the target manufacturing system [27]. The authors also identified the most effective factors to consuming energy in each part (resource) of the target system (Table 8).
Results of the time study and properties of the target system shows that there is a direct relationship between the system efficiency and time. In other words, any improvement in the system with consideration of the proposed optimization ideas will directly affect the system times. It is again worthy of mentioning that there is a direct relationship between the energy consumption and system functional time. An OEE percentage evaluation of the system shows that consideration of the proposed control architecture and, in most cases, increasing the busy times and decreasing the idle time increases the OEE percentage. However, Table 6 shows that all the optimization ideas have different effects on increasing the OEE percentage. This means that, with considering the priority of the effectiveness on Table 6, the optimization methods which would further increase the sustainability of the system will be highlighted. In this case, in order to have more sustainable manufacturing, the amount of consumed electricity should be minimal (Figure 10). The way in which to reach this goal in the target system is by reducing the idle times and increasing the busy times. In addition, in most of the cases in which the idle time is not unpreventable, there should be some alternative solution. Running a device continuously on the system, when the devices are in idle time, drives up energy use and maintenance costs, which impacts on the sustainability of the manufacturing system.
However, due to the property of the selected manufacturing system, and considering that as an example of SMEs and the energy resource which has been utilized, some limitations will show up. Calculations of energy consumption, OEE percentage evaluation, and its effects on sustainability of the target system require modification on the target system for it to perform for a longer time and consume more energy.

3. Conclusions

In the first stage of this research, an intelligent material-handling system for product differentiation was designed and implemented. A specific algorithm was created to deploy an agent-based control architecture across the system. The system was considered as the case study for this research and also as an example of SMEs with the same production cell. Different manufacturing aspects of the system were also evaluated. Time was focused on as the target manufacturing aspect. In order to evaluate the manufacturing system performance, OEE standards have been utilized. Due to the importance of time in the calculation of OEE percentages, the system was subjected to a proper time study. The OEE percentage was obtained for each resource available in the system, as well as the entire system. The results of the time study extracted some issues and limitations in the system during its performance. These problems and limitations were investigated in order to find a proper solution for them. They were categorized into different categories, and the effective parameters for each category have been achieved. Based on these achievements, some optimization methods have been proposed. In the second stage of the research, due to the SMEs being the target category of the enterprises, as well as their limitation and the difficulties which they might face in the implementation of the proposed methods, a simulation solution using ARENA software was considered. Each of the optimization methods were implemented on the simulation model to verify and validate the effects on the OEE percentage. A comprehensive solution was proposed for selecting the best optimization method and obtaining the best OEE percentage for SMEs. Finally, according to OECD definitions about the relationship between the time and energy consumption, manufacturing sustainability has also been investigated and described.
As mentioned previously, the system is a small-scale educational manufacturing system with a limited functionality period. Because of this selection, in the proposed methodology, system observation and data collection were conducted in a short period of time to prevent any system damage. As future work based on this research, the proposed methodology can be extended on such systems as a case study in order to execute all the evaluations over a long period of time.

Author Contributions

Conceptualization, G.Y.P. and A.A.; Methodology, G.Y.P.; Software, G.Y.P.; Validation, G.Y.P., A.A. and M.H.; Formal Analysis, G.Y.P.; Investigation, G.Y.P., A.A.; Resources, G.Y.P.; Data Curation, G.Y.P. and A.A.; Writing—Original Draft Preparation, G.Y.P.; Writing—Review & Editing, G.Y.P. and A.A.; Visualization, G.Y.P.; Supervision, A.A. and M.H.; Project Administration, A.A.

Funding

This research received no external funding.

Acknowledgments

This research was supported by German university of technology in Oman (GUtech). We thank our colleagues from GUtech who provided insight and expertise that greatly assisted the research.

Conflicts of Interest

The authors declare no conflict of interest.

References

  1. Azizi, A.; Yazdi, P.G.; Hashemipour, M. Interactive design of storage unit utilizing virtual reality and ergonomic framework for production optimization in manufacturing industry. Int. J. Interact. Des. Manuf. (IJIDEM) 2018, 1–9. [Google Scholar] [CrossRef]
  2. Jamali, D.; Lund-Thomsen, P.; Jeppesen, S. Smes and csr in developing countries. Bus. Soc. 2017, 56, 11–22. [Google Scholar] [CrossRef]
  3. Ahn, J.M.; Minshall, T.; Mortara, L. Open innovation: A new classification and its impact on firm performance in innovative smes. J. Innov. Manag. 2015, 3, 33–54. [Google Scholar]
  4. Barbosa, J.; Leitão, P.; Adam, E.; Trentesaux, D. Dynamic self-organization in holonic multi-agent manufacturing systems: The adacor evolution. Comput. Ind. 2015, 66, 99–111. [Google Scholar] [CrossRef]
  5. Hossain, M.; Kauranen, I. Open innovation in smes: A systematic literature review. J. Strategy Manag. 2016, 9, 58–73. [Google Scholar] [CrossRef]
  6. Mourtzis, D.; Papakostas, N.; Mavrikios, D.; Makris, S.; Alexopoulos, K. The role of simulation in digital manufacturing: Applications and outlook. Int. J. Comput. Integr. Manuf. 2015, 28, 3–24. [Google Scholar] [CrossRef]
  7. Esmaeilian, B.; Behdad, S.; Wang, B. The evolution and future of manufacturing: A review. J. Manuf. Syst. 2016, 39, 79–100. [Google Scholar] [CrossRef]
  8. Michalos, G.; Makris, S.; Papakostas, N.; Mourtzis, D.; Chryssolouris, G. Automotive assembly technologies review: Challenges and outlook for a flexible and adaptive approach. CIRP J. Manuf. Sci. Technol. 2010, 2, 81–91. [Google Scholar] [CrossRef]
  9. Islam, A.; Tedford, D.; Haemmerle, E. Risk determinants of small and mediumsized manufacturing enterprises (SMES)—An empirical investigation in New Zealand. J. Ind. Eng. Int. 2012, 8, 12. [Google Scholar] [CrossRef]
  10. Chan, F.; Ip, R.; Lau, H. Integration of expert system with analytic hierarchy process for the design of material handling equipment selection system. J. Mater. Process. Technol. 2001, 116, 137–145. [Google Scholar] [CrossRef]
  11. Bhattacharya, A.; Sarkar, B.; Mukherjee, S. A holistic multi-criteria approach for selecting machining processes. In Proceedings of the 30th International Conference on Computers & Industrial Engineering, Tinos Island, Greece, 28 June–1 July 2002; pp. 83–88. [Google Scholar]
  12. Shen, W.; Norrie, D.H.; Barthès, J.-P. Multi-Agent Systems for Concurrent Intelligent Design and Manufacturing; CRC Press: Boca Raton, FL, USA, 2003. [Google Scholar]
  13. Fax, J.A.; Murray, R.M. Information flow and cooperative control of vehicle formations. IEEE Trans. Autom. Control 2004, 49, 1465–1476. [Google Scholar] [CrossRef]
  14. Durieux, S.; Pierreval, H. Regression metamodeling for the design of automated manufacturing system composed of parallel machines sharing a material handling resource. Int. J. Prod. Econ. 2004, 89, 21–30. [Google Scholar] [CrossRef]
  15. Schröder, R.; Aydemir, M.; Glodde, A.; Seliger, G. Design and verification of an innovative handling system for electrodes in manufacturing lithium-ion battery cells. Procedia CIRP 2016, 50, 641–646. [Google Scholar] [CrossRef]
  16. Johnstone, M.; Creighton, D.; Nahavandi, S. Status-based routing in baggage handling systems: Searching verses learning. IEEE Trans. Syst. Man Cybern. Part C (Appl. Rev.) 2010, 40, 189–200. [Google Scholar] [CrossRef]
  17. Lau, H.Y.; Woo, S. An agent-based dynamic routing strategy for automated material handling systems. Int. J. Comput. Integr. Manuf. 2008, 21, 269–288. [Google Scholar] [CrossRef]
  18. Ramesh, C.; Manickam, C.; Prasanna, S. Lean six sigma approach to improve overall equipment effectiveness performance: A case study in the indian small manufacturing firm. Asian J. Res. Soc. Sci. Humanit. 2016, 6, 1063–1072. [Google Scholar] [CrossRef]
  19. Benjamin, S.J.; Marathamuthu, M.S.; Murugaiah, U. The use of 5-whys technique to eliminate oee’s speed loss in a manufacturing firm. J. Qual. Maint. Eng. 2015, 21, 419–435. [Google Scholar] [CrossRef]
  20. Yaşin, M.F.; Daş, G.S. Kobİ’lerde ekipman etkinliğinin iyileştirilmesinde tee tabanlı yeni bir yaklaşım: Bir ahşap işleme kuruluşunda uygulama. J. Fac. Eng. Archit. Gazi Univ. 2017, 32, 45–52. [Google Scholar]
  21. Iannone, R.; Nenni, M.E. Managing oee to optimize factory performance. In Operations Management; InTech: London, UK, 2013. [Google Scholar]
  22. Nakajima, S. Introduction to TPM: Total Productive Maintenance; Preventative Maintenance Series, Hardcover; Productivity Press: New York, NY, USA, 1988; ISBN 0-91529-923-2. [Google Scholar]
  23. Huang, S.H.; Dismukes, J.P.; Shi, J.; Su, Q.; Razzak, M.A.; Bodhale, R.; Robinson, D.E. Manufacturing productivity improvement using effectiveness metrics and simulation analysis. Int. J. Prod. Res. 2003, 41, 513–527. [Google Scholar] [CrossRef]
  24. Jonsson, P.; Lesshammar, M. Evaluation and improvement of manufacturing performance measurement systems-the role of oee. Int. J. Oper. Prod. Manag. 1999, 19, 55–78. [Google Scholar] [CrossRef]
  25. Muchiri, P.; Pintelon, L. Performance measurement using overall equipment effectiveness (oee): Literature review and practical application discussion. Int. J. Prod. Res. 2008, 46, 3517–3535. [Google Scholar] [CrossRef]
  26. Kumar, J.; Soni, V.; Agnihotri, G. Maintenance performance metrics for manufacturing industry. Int. J. Res. Eng. Technol. 2013, 2, 136–142. [Google Scholar]
  27. Ghafoorpoor Yazdi, P.; Azizi, A.; Hashemipour, M. An empirical investigation of the relationship between overall equipment efficiency (oee) and manufacturing sustainability in industry 4.0 with time study approach. Sustainability 2018, 10, 3031. [Google Scholar] [CrossRef]
  28. Stevenson, W.J.; Hojati, M.; Cao, J. Operations Management; McGraw-Hill/Irwin Boston: Boston, MA, USA, 2007; Volume 8. [Google Scholar]
  29. Syska, A. Methods-time-measurement (mtm). In Produktionsmanagement: Das A–Z Wichtiger Methoden und Konzepte für die Produktion von Heute; Springer: Berlin/Heidelberg, Germany, 2006; p. 99. [Google Scholar]
  30. Zandin, K.B. Most Work Measurement Systems; CRC Press: Boca Raton, FL, USA, 2002. [Google Scholar]
  31. Heyde, G. Modular Arrangement of Predetermined Time Standards. Woodbridge, VA. 1996. Available online: www.modapts.com (accessed on 8 March 2019).
  32. Patel, N. Reduction in product cycle time in bearing manufacturing company. Int. J. Eng. Res. Gen. Sci. 2015, 3, 466–471. [Google Scholar]
  33. Elnekave, M.; Gilad, I. Rapid video-based analysis system for advanced work measurement. Int. J. Prod. Res. 2006, 44, 271–290. [Google Scholar] [CrossRef]
  34. Bon, A.T.; Daim, D. Time motion study in determination of time standard in manpower process. In Proceedings of the 3rd Engineering Conference on Advancement in Mechanical and Manufacturing for Sustainable Environment, Kuching, Malaysia, 14–16 April 2010. [Google Scholar]
  35. Longo, F.; Mirabelli, G. Effective design of an assembly line using modelling and simulation. J. Simul. 2009, 3, 50–60. [Google Scholar] [CrossRef]
  36. Kuhlang, P.; Edtmayr, T.; Sihn, W. Methodical approach to increase productivity and reduce lead time in assembly and production-logistic processes. CIRP J. Manuf. Sci. Technol. 2011, 4, 24–32. [Google Scholar] [CrossRef]
  37. Negahban, A.; Smith, J.S. Simulation for manufacturing system design and operation: Literature review and analysis. J. Manuf. Syst. 2014, 33, 241–261. [Google Scholar] [CrossRef]
  38. Fui-Hoon Nah, F.; Lee-Shang Lau, J.; Kuang, J. Critical factors for successful implementation of enterprise systems. Bus. Process Manag. J. 2001, 7, 285–296. [Google Scholar] [CrossRef]
  39. Kelton, W.D.; Smith, J.S.; Sturrock, D.T. Simio & Simulation: Modeling, Analysis, Applications; Learning Solutions: Sacramento, CA, USA, 2011. [Google Scholar]
  40. Fu, M.C. Optimization for simulation: Theory vs. Practice. Inf. J. Comput. 2002, 14, 192–215. [Google Scholar] [CrossRef]
  41. Juan, A.A.; Faulin, J.; Grasman, S.E.; Rabe, M.; Figueira, G. A review of simheuristics: Extending metaheuristics to deal with stochastic combinatorial optimization problems. Oper. Res. Perspect. 2015, 2, 62–72. [Google Scholar] [CrossRef]
  42. Schriber, T.J.; Brunner, D.T.; Smith, J.S. Inside discrete-event simulation software: How it works and why it matters. In Proceedings of the 2014 Winter Simulation Conference, Savannah, GA, USA, 7–10 December 2014; pp. 132–146. [Google Scholar]
  43. Alfieri, A.; Matta, A.; Pedrielli, G. Mathematical programming models for joint simulation–optimization applied to closed queueing networks. Ann. Oper. Res. 2015, 231, 105–127. [Google Scholar] [CrossRef]
  44. Alfieri, A.; Matta, A. A time-based decomposition algorithm for fast simulation with mathematical programming models. In Proceedings of the Winter Simulation Conference, Berlin, Germany, 9–12 December 2012; p. 231. [Google Scholar]
  45. Figueira, G.; Almada-Lobo, B. Hybrid simulation–optimization methods: A taxonomy and discussion. Simul. Model. Pract. Theory 2014, 46, 118–134. [Google Scholar] [CrossRef]
  46. Toolkit, O.S.M. Seven Steps to Environmental Excellence; The Organization for Economic Co-operation and Development: Paris, France, 2014. [Google Scholar]
  47. Roni, M.; Jabar, J.; Mohamad, M.; Yusof, M. Conceptual study on sustainable manufacturing practices and firm performance. In Proceedings of the International Symposium on Research in Innovation and Sustainability, ISoRIS, Malacca, Malaysia, 15–16 October 2014; pp. 1459–1465. [Google Scholar]
  48. Lai-Ling Lam, M. Challenges of sustainable environmental programs of foreign multinational enterprises in china. Manag. Res. Rev. 2011, 34, 1153–1168. [Google Scholar] [CrossRef]
  49. May, A.D. Urban transport and sustainability: The key challenges. Int. J. Sustain. Transp. 2013, 7, 170–185. [Google Scholar] [CrossRef]
  50. Azizi, A.; Yazdi, P.; Humairi, A. Design and fabrication of intelligent material handling system in modern manufacturing with industry 4.0 approaches. Int. Robot. Autom. J. 2018, 4, 186–195. [Google Scholar] [CrossRef]
Figure 1. Overall Equipment Effectiveness (OEE) calculation procedure [27].
Sustainability 11 01454 g001
Figure 2. Considerable factors in manufacturing sustainability [27].
Sustainability 11 01454 g002
Figure 3. System overview [27].
Sustainability 11 01454 g003
Figure 4. Layout design, top view [27].
Sustainability 11 01454 g004
Figure 5. ARENA simulation model.
Sustainability 11 01454 g005
Figure 6. ARENA visualization of the real system.
Sustainability 11 01454 g006
Figure 7. Time difference between “Utilization” time of the real system and simulation model.
Sustainability 11 01454 g007
Figure 8. Comparison of “Busy” times before and after the optimization idea.
Sustainability 11 01454 g008
Figure 9. Comparison of OEE and its related factors’ percentages.
Sustainability 11 01454 g009aSustainability 11 01454 g009bSustainability 11 01454 g009c
Figure 10. Manufacturing sustainability based on OEE and the Organization for Economic Cooperation and Development (OECD).
Sustainability 11 01454 g010
Table 1. The Organization for Economic Cooperation and Development (OECD) requirements for sustainable manufacturing [27,46].
StepsDescription
PreparationMapping impact and set prioritiesIn this step, the manufacturing, environmental impact of small- and medium-sized enterprises (SMEs) should be reviewed. Also, the priorities of each should be defined. Based on the detected and the priorities of these environmental impacts, sustainability objectives should be defined.
Select useful performance indicatorsIndicators that are essential for SMEs to increase the performance and learn about what data should be collected to help drive continuous improvement should be identified.
MeasurementMeasure the inputs used in the productionThe ways in which materials and components used in SMEs production processes influence environmental performance should be identified.
Assess operations of the SMEs facilityThe impact and efficiency of the operations in SME facilities, such as energy intensity, greenhouse gas generation, and emissions to air and water should be considered.
ImprovementEvaluate your productsFactors such as energy consumption in use, recyclability, and use of hazardous substances that help determine the sustainability of SME end-products should be identified.
Understand measured resultsReading and interpreting the SME indicators and the methods for understanding trends in their performance should be learned.
Take action to improve performanceOpportunities to improve SME performance and creating action plans to implement them should be chosen.
Table 2. Distance and speed measurements by participants.
FromToAmongResourceDistance (Free Unit)Speed (Distance Unit Per Second)
Entrance/Sensor 1Sensor 2Main Conv.Main Conv.539.3
Sensor 2 Sensor 3&4Main Conv.Main Conv.123.35
Sensor 3&4Sensor 5Main Conv. And Right Conv. Robot Arm3412.9
Sensor 3&4Sensor 6Main Conv. And Left Conv.Robot Arm2910.4
Sensor 5Sensor 7/Right Slider EntranceRight Conv. and Right SliderRight Conv.859
Sensor 7/Right Slider EntranceRed BufferRight SliderRight Slider88
Sensor 7/Right Slider EntranceYellow BufferRight SliderRight Slider3910
Sensor 8/Left Slider EntranceGreen BufferLeft SliderLeft Slider78
Sensor 8/Left Slider EntranceBlue BufferLeft SliderLeft Slider3910
Sensor 6Sensor 8/Left Slider EntranceLeft Conv. and Left SliderLeft Conv.759
Right SliderRed BufferRight Slider and Red BufferRight Slider12
Right SliderYellow BufferRight Slider and Yellow BufferRight Slider13.13
Left SliderBlue BufferLeft Slider and Blue BufferLeft Slider13.13
Left SliderGreen BufferLeft Slider and Green BufferLeft Slider12.39
Table 3. Time difference between “Busy” times of the real system and simulation model.
Busy Time (s)
Task No.Task DescriptionReal System Average of Participants ObservationAbsolut Deference
1Main conveyor handling Red object to Robot9.819.500.31
2Robot arm picking The Red Object from Main Conveyor3.553.840.29
3Robot arm placing Red object to Right Conveyor3.563.660.10
4Right conveyor handling Red object to Right Slider9.229.400.18
5Robot arm moves to its home position after placing Red object2.622.500.12
6Main conveyor handling Blue object to Robot9.049.500.46
7Right Slider transfers Red object to Red buffer3.983.900.08
8Right Slider unloading the Red object to Red buffer4.54.500.00
9Robot arm picking The Blue Object from Main Conveyor3.883.550.33
10Robot arm placing Blue object to Left Conveyor3.823.660.16
11Right Slider moves to its home position after unloading Red object4.014.080.07
12Left conveyor handling Blue object to Left Slider7.948.330.39
13Robot arm moves to its home position after placing Blue object2.782.500.28
14Main conveyor handling Yellow object to Robot9.869.500.36
15Left Slider transfers Blue object to Blue buffer4.094.090.00
16Left Slider unloading the Blue object to Blue buffer4.424.400.02
17Robot arm picking The Yellow Object from Main Conveyor4.053.840.21
18Left Slider moves to its home position after unloading Blue object4.434.430.00
19Robot arm placing Yellow object to Right Conveyor3.633.660.03
20Right conveyor handling Yellow object to Right Slider9.39.400.10
21Robot arm moves to its home position after placing Yellow object2.572.500.07
22Main conveyor handling Green object to Robot9.629.500.12
23Right Slider transfers Yellow object to Yellow buffer0.980.990.01
24Right Slider unloading the Yellow object to Yellow buffer4.324.320.00
25Robot arm picking The Green Object from Main Conveyor3.843.550.29
26Right Slider moves to its home position after unloading yellow object1.251.250.00
27Robot arm placing Green object to Left Conveyor3.63.660.06
28Left conveyor handling Green object to Left Slider7.888.330.45
29Robot arm moves to its home position after placing Green object2.52.500.00
30Left Slider transfers Green object to Green buffer1.070.710.36
31Left Slider unloading the Green object to Green buffer4.334.320.01
32Left Slider moves to its home position after unloading Green object1.441.440.00
Table 4. System modification and “Busy” times after the optimization methods.
Task DescriptionRealAverage of Participant Observation with Simulation2/3 of the Real Distance Change1/2 of the Real Distance ChangeSpeed Limit Change to Maximum
Main conveyor handling Red object to Robot9.819.506.635.328.20
Robot arm picking The Red Object from Main Conveyor3.553.843.843.843.25
Robot arm placing Red object to Right Conveyor3.563.663.663.663.20
Right conveyor handling Red object to Right Slider9.229.405.604.478.80
Robot arm moves to its home position after placing Red object2.622.502.502.501.99
Main conveyor handling Blue object to Robot9.049.506.635.328.20
Right Slider transfers Red object to Red buffer3.983.902.642.033.70
Right Slider unloading the Red object to Red buffer4.504.504.504.504.24
Robot arm picking The Blue Object from Main Conveyor3.883.553.553.553.34
Robot arm placing Blue object to Left Conveyor3.823.663.663.663.30
Right Slider moves to its home position after unloading Red object4.024.082.682.063.90
Left conveyor handling Blue object to Left Slider7.948.335.684.477.50
Robot arm moves to its home position after placing Blue object2.782.502.502.501.99
Main conveyor handling Yellow object to Robot9.869.506.635.328.20
Left Slider transfers Blue object to Blue buffer4.094.092.722.004.02
Left Slider unloading the Blue object to Blue buffer4.424.404.404.404.20
Robot arm picking The Yellow Object from Main Conveyor4.053.843.843.843.25
Left Slider moves to its home position after unloading Blue object4.434.432.952.274.06
Robot arm placing Yellow object to Right Conveyor3.633.663.663.663.20
Right conveyor handling Yellow object to Right Slider9.309.405.604.478.80
Robot arm moves to its home position after placing Yellow object2.572.502.502.501.99
Main conveyor handling Green object to Robot9.629.506.635.328.20
Right Slider transfers Yellow object to Yellow buffer0.980.990.620.490.70
Right Slider unloading the Yellow object to Yellow buffer4.324.324.324.324.10
Robot arm picking The Green Object from Main Conveyor3.843.553.553.553.34
Right Slider moves to its home position after unloading yellow object1.251.250.781.201.00
Robot arm placing Green object to Left Conveyor3.603.663.663.663.30
Left conveyor handling Green object to Left Slider7.888.335.684.477.50
Robot arm moves to its home position after placing Green object2.502.502.502.501.99
Left Slider transfers Green object to Green buffer1.070.710.620.490.66
Left Slider unloading the Green object to Green buffer4.334.324.324.324.10
Left Slider moves to its home position after unloading Green object1.441.441.030.821.07
Table 5. Overall equipment effectiveness (OEE) analysis before and after optimization.
RecourseActual TimeExpected TimeDown TimeTotal Functional Period Idle TimePlanned Production TimeRun TimeAvailability %Ideal Cycle TimeTotal CountGood CountPerformance
%
Quality %OEE %
Speed to Maximum Limit
Main Conveyor32.8032.500.3058.3625.5632.8032.5099.098.004.004.0098.46100.0097.56
Left Conveyor 15.0014.500.5078.8862.8816.0015.5096.887.502.002.0096.77100.0093.75
Right Conveyor 17.6017.500.1078.3360.7317.6017.5099.438.002.002.0091.43100.0090.91
Robot Arm34.1934.000.1978.3344.1434.1934.0099.448.004.004.0094.12100.0093.59
Right Sliders for Red 11.8411.500.3463.8852.0411.8411.5097.1311.001.001.0095.65100.0092.91
Right Sliders for Yellow5.805.500.3043.0437.245.805.5094.835.001.001.0090.91100.0086.21
Left Slider for Blue12.2711.500.7772.4860.2112.2711.5093.7211.001.001.0095.65100.0089.65
Left Slider for Green5.835.500.3313.257.425.835.5094.345.001.001.0090.91100.0085.76
Distance 2/3
RecourseActual TimeExpected TimeDown TimeTotal Functional periodIdle timePlanned Production TimeRun TimeAvailability %Ideal Cycle TimeTotal CountGood CountPerformance %Quality %OEE %
Main Conveyor26.5226.000.5256.2329.7126.5226.0098.046.004.004.0092.31100.0090.50
Left Conveyor 11.3611.000.3675.0963.7311.3611.0096.835.002.002.0090.91100.0088.03
Right Conveyor 11.2011.000.2075.0963.8911.2011.0098.215.002.002.0090.91100.0089.29
Robot Arm39.4239.000.4265.9426.5239.4239.0098.939.004.004.0092.31100.0091.32
Right Sliders for Red 9.829.500.3250.9041.089.829.5096.749.001.001.0094.74100.0091.65
Right Sliders for Yellow5.725.500.2245.5439.825.725.5096.155.001.001.0090.91100.0087.41
Left Slider for Blue10.079.500.5769.1259.0510.079.5094.349.001.001.0094.74100.0089.37
Left Slider for Green5.975.500.4729.7923.825.975.5092.135.001.001.0090.91100.0083.75
Distance 1/2
RecourseActual TimeExpected TimeDown TimeTotal Functional periodIdle timePlanned Production TimeRun TimeAvailability %Ideal Cycle TimeTotal CountGood CountPerformance %Quality %OEE %
Main Conveyor21.2821.000.2850.6929.4121.2821.0098.685.004.004.0095.24100.0093.98
Left Conveyor 8.948.500.4468.0059.068.948.5095.084.002.002.0094.12100.0089.49
Right Conveyor 8.948.500.4467.6458.708.948.5095.084.002.002.0094.12100.0089.49
Robot Arm39.1339.000.1360.4121.2839.1339.0099.679.004.004.0092.31100.0092.00
Right Sliders for Red 9.139.000.1343.9634.839.139.0098.588.501.001.0094.44100.0093.10
Right Sliders for Yellow5.515.500.0142.5237.085.445.4399.825.001.001.0092.08100.0091.91
Left Slider for Blue8.678.500.1762.3753.708.678.5098.048.001.001.0094.12100.0092.27
Left Slider for Green5.635.500.1328.9823.355.635.5097.695.001.001.0090.91100.0088.81
Before Optimization
RecourseActual TimeExpected TimeDown TimeTotal Functional periodIdle timePlanned Production TimeRun TimeAvailability %Ideal Cycle TimeTotal CountGood CountPerformance %Quality %OEE %
Main Conveyor38.3338.000.3368.7930.4638.3338.0099.148.504.004.0089.47100.0088.70
Left Conveyor 15.8215.500.3290.9572.4418.5118.1998.277.002.002.0076.97100.0075.63
Right Conveyor 18.5218.000.5290.9575.1315.8215.3096.717.002.002.0091.50100.0088.50
Robot Arm40.440.000.4090.9550.5540.4040.0099.019.004.004.0090.00100.0089.11
Right Sliders for Red 12.4912.000.4968.8156.3212.4912.0096.0811.001.001.0091.67100.0088.07
Right Sliders for Yellow6.556.000.5552.3345.776.566.0191.625.001.001.0083.19100.0076.22
Left Slider for Blue12.9412.000.9484.1171.1712.9412.0092.7411.001.001.0091.67100.0085.01
Left Slider for Green6.846.000.8431.4424.66.846.0087.725.001.001.0083.33100.0073.10
Table 6. OEE improvement percentage for each resource.
OEE Improvement %
Resource½ of the Actual Distance (p2-1)2/3 of the Actual Distance (p2-2)Speed to Maximum Limit (p3)Priority of the Effectiveness
Main Conv.5.281.308.86p2-1 (2)  p2-2 (3)  p3 (1)
Right side Conv.0.990.792.41p2-1 (2)  p2-2 (3)  p3 (1)
Left Side Conv.13.8612.418.12p2-1 (2)  p2-2 (3)  p3 (1)
Robot arm2.892.204.48p2-1 (3)  p2-2 (2)  p3 (1)
Right Slider for Red Obj.5.033.584.48p2-1 (1)  p2-2 (3)  p3 (2)
Right slider for Yellow Obj.15.6911.199.90p2-1 (1)  p2-2 (2)  p3 (3)
Left Slider for Blue Obj.7.264.364.46p2-1 (1)  p2-2 (2)  p3 (3)
Left Slider for Green Obj.15.7110.5612.66p2-1 (1)  p2-2 (3)  p3 (2)
Table 7. Mapping impact and set priorities of the selected manufacturing system [27].
Mapping Impact and Set Priorities
ImpactsDefinition Priorities
Water intensityConsumption of water per unit of outputNot Selected0
Residuals intensityGeneration of wastes per unit of outputNot Selected0
Energy intensityEnergy consumed per unit of outputSelected1
Renewable proportion of energy consumedUsed Energy from Sustainable Resources (%)Not Selected0
Greenhouse gas (GHG) intensityGHGs produced during production per unit of outputNot Selected0
Intensity of residual releases to airRelease of air emissions per unit of outputNot Selected0
Intensity of residual releases to surface waterRelease of effluents per unit of outputNot Selected0
Natural CoverThe proportion of land occupied that is natural coverNot Selected0
Table 8. Measurement layer of the investigation of manufacturing sustainability [27].
Manufacturing SystemRelated DevicesEnergy Consumption ReasonEnergy Resource
Intelligent material handling systemConveyorsMotors related to conveyor motions Electricity
SlidersMotors related to Slider motions
Robot ArmMotors Related to Robot Motions
Control unitsprocessing the data
Sensorsexcitation signal

