Barriers to Adoption of Water-Saving Habits in Residential Buildings in Hong Kong


1
School of Technology, Harbin University, Harbin 150000, China
2
Department of Building Services Engineering, The Hong Kong Polytechnic University, Hong Kong, China
*
Author to whom correspondence should be addressed.
Sustainability 2019, 11(7), 2036; https://0-doi-org.brum.beds.ac.uk/10.3390/su11072036
Submission received: 25 February 2019
/
Revised: 28 March 2019
/
Accepted: 31 March 2019
/
Published: 5 April 2019
Abstract
:The fresh water supply is finite, but the fresh water demand is infinite. A sustainable supply of fresh water is emerging as one of the most critical resource issues in the world. Hong Kong is one of the highest per capita fresh water users in the world. This has led to many government initiatives to promote water-saving habits in Hong Kong. However, after almost a decade of efforts, there has been no obvious reduction in consumption. Little has been done to identify the reason for this. Through the use of questionnaire surveys, site measurements, and controlled experiments, the aim of this study is to investigate the level of adoption of different water-saving habits, the most influential water-saving habits, and the barriers to the adoption of water-saving habits in residential buildings in Hong Kong. It was found that if the policies are targeted to break the identified barriers, then there is a potential for reducing the total domestic fresh water consumption in Hong Kong by 14.7%. It was also found that the knowledge of water scarcity and good water use habits are not the barriers to the adoption of water-saving habits in Hong Kong households. Rather, the government should draw public’s attention to the environmental impact of water usage and the high fresh water consumption level of Hong Kong people to break the knowledge barrier and should re-examine the water tariff to break the motivation barrier. The results of this study provide useful information for decision makers in the context of water conservation in Hong Kong as well as elsewhere in the world.
1. Introduction
The fresh water supply is finite, but the fresh water demand is infinite. A sustainable supply of fresh water is emerging as one of the most critical resource issues in the world [1]. Previous studies are focused on investigating measures to reduce water consumption [2,3,4] and to increase water supply [5,6,7]. Amongst measures to reduce water consumption, campaigns to encourage the adoption of water-saving habits has been identified as an effective policy.
Water scarcity is a big problem in Hong Kong. In 2015, Hong Kong’s per capita water resources were 133 m3 [8], while in mainland China it was 2039.2 m3 [9]. Hence, the supply of water from Dongjiang in mainland China was started in 1965, and these supplies now account for about 74% of the total water supply [10]. Despite Hong Kong relying heavily on Dongjiang for stable water supply, Hong Kong’s domestic per capita water consumption was high at 124.7 Litre/day (L/d) in 2012. The figure was higher than many other global cities like Singapore, Sydney, and Madrid, in which the average water consumption was 110 L/d at the same time.
In 2008, the Hong Kong Water Supplies Department (WSD) introduced a territory-wide total water management strategy [11,12]. The strategy is to encourage the adoption of water-saving habits. A follow-up survey was conducted in 2011, and 98.8% of the households claimed that they supported a consumption cut [13]. At the end of 2014, expert consultants were employed to review the total water management strategy, but it had not yet been completed at the time of writing [14]. However, what can be seen is that after seven years of implementation, the per capita fresh water consumption figure was increased to 132 L/d in 2015. This corresponds to a total growth rate of 5.9 % (124.7 vs. 132 L/d) [8,10]. The figure clearly shows that the efforts made are not sufficient to reduce water consumption in Hong Kong.
To achieve water savings, many studies have suggested encouraging the adoption of water-saving habits [15,16]. Habit is the usual way of behaving or a fixed way of reaction that tends to repeat regularly and occur unconsciously [17]. Kiang conducted a study in Singapore and identified a strong linkage between users’ habits and water conservation [18]. Randolph and Troy used telephone interview surveys supplemented by focused group interviews to search for ways to reduce water use in Australia. It was found that raising public consciousness on this issue so as to change the habits can be an effective measure [19]. Adams [20] conducted an evaluation based on data collected from the 2010 General Social Survey in the United States. It was concluded that people who have pro-environmental behavior have a greater tendency to conserve water compared to those who are not. Gilg and Barr [21] employed a questionnaire to identify the British people’s environmental habits and concluded that water saving policies and initiatives should take into account people’s lifestyles and behaviors. Domene and Saurí [22] conducted a case study in the Metropolitan region of Barcelona to investigate the relationships between urbanization and residential water use. The results confirmed that user habits play an important role in domestic water use. Jorgensen et al. developed a water use model to investigate the influence of previous and current behaviors on water use in Australia and concluded that factors affecting water use habits should be the future research focus [23].
To drive for habit change, Martínez-Espiñeira and García-Valiñas [24] identified the need for more educational campaigns. Seyranian et al. [25] also identified that knowledge deficit is one major barrier. Levin and Muehleisen [26], however, categorized the obstacles as knowledge barriers and motivation barriers.
Habit formation is a long process. It is socio-demographically dependent [27,28]. To encourage adoption of water-saving habits to solve the water scarcity problem in Hong Kong, there is a need to identify the most influential water-saving habits to target Hong Kong households, the associated savings, and the barriers to their adoption. Apparently, this information is not available in published literature.
Through the use of questionnaire surveys, site measurements, controlled experiments, and statistical analyses, the aim of this study is to investigate the adoption of water-saving habits in residential buildings in Hong Kong. The focus was on water use of showerheads and kitchen and toilet faucets because they contribute to 46.6% and 43.3% of the domestic fresh water consumption in Hong Kong, respectively [13]. The results of this study provide useful information for decision makers in the context of water conservation in Hong Kong as well as elsewhere in the world.
2. Methods
2.1. Questionnaire Survey
Questionnaire surveys were carried out from October 2015 to February 2016 with due consideration of the ethical issues. In the surveys, the convenience sampling approach was adopted for selecting households for participation [29]. Conducting the survey on a household basis is according to a study by Fielding et al. [15] concluding that the dynamics of the household play an important part in domestic water use. In the convenience sampling, families of undergraduate students of the Hong Kong Polytechnic University were selected as the candidate households to participate in the survey because they reside almost everywhere in Hong Kong. A total of 216 undergraduate students from different academic departments of the university volunteered to serve as candidate household. They were briefed on the contents and the objectives of the questionnaires and were asked to clarify any misunderstanding. They were also informed about their right to terminate the survey at any time and the confidentiality of their personal data.
To ensure the respondents were aware that they were treated as the representative households and the majority view shall be taken as the response, a self-declaration statement was added.
2.1.1. Minimum Sample Size
The minimum sample size was determined based on Equation (1) as recommended by Franklin [30]. This equation has been widely used in similar research studies [31,32,33]. Based on the number of domestic households in Hong Kong, that is, 2.504 million [34], and the number of undergraduate students, that is, 120,000 in 2015/16 [35], the probability of a household with an undergraduate student (p) is 0.048. Assuming the sampling error (e) to be ±5 %, and for achieving confidence of 95%, the minimum sample size (Smin) can be estimated by Equation (1), which is 70.
Smin = (Z2∙p∙(1 − p))/e2
- p = probability of a household with undergraduate students
- Z = test statistic which is 1.96 for 95% confidence level
Representativeness of the responding households is checked by a statistical test of significance. Due consideration is given to the existence of single-person households in Hong Kong.
2.1.2. Survey Questions
The questionnaire was written in Chinese and was divided into four parts, aiming to ascertain the adoption level of water-saving habits of Hong Kong households and the barriers to their adoptions. Water-saving habits are good practices promoted by the Hong Kong Government and elsewhere in the world [21,23], which are summarized in Table 1.
The questions were constructed either in forced-choice format or in numeric response format for collection of both quantitative and qualitative data of the studied households. A pilot test on the questionnaire was carried out with 11 households to modify and refine the questionnaire. After refining, 216 copies of the questionnaires were sent to candidate households of which 72 households responded, which satisfied the minimum sample size requirement.
Part 1 collects their demographic characteristics which include the household size and the housing district. Part 2 gathers their adoption of water-saving habits. Part 3 collects the water bills. Part 4 is to find out the barriers for adoption of water-saving habits. Based on the results in Part 2, and the water bills collected in Part 3, the take-up rate of water-saving habits and the influential water-saving habits that suit Hong Kong people’s socio-demographic characteristics can be ascertained.
While for Part 4, it has been pointed out that the key barriers to the adoption of water-saving habits are the knowledge [24,25,26] and motivation barriers [26]. However, as habits tend to occur subconsciously, people may not know why and how they have acquired the habits [36]. Thus, instead of asking the respondents to name the barriers, the questions were structured to identify the barriers from their consumption patterns.
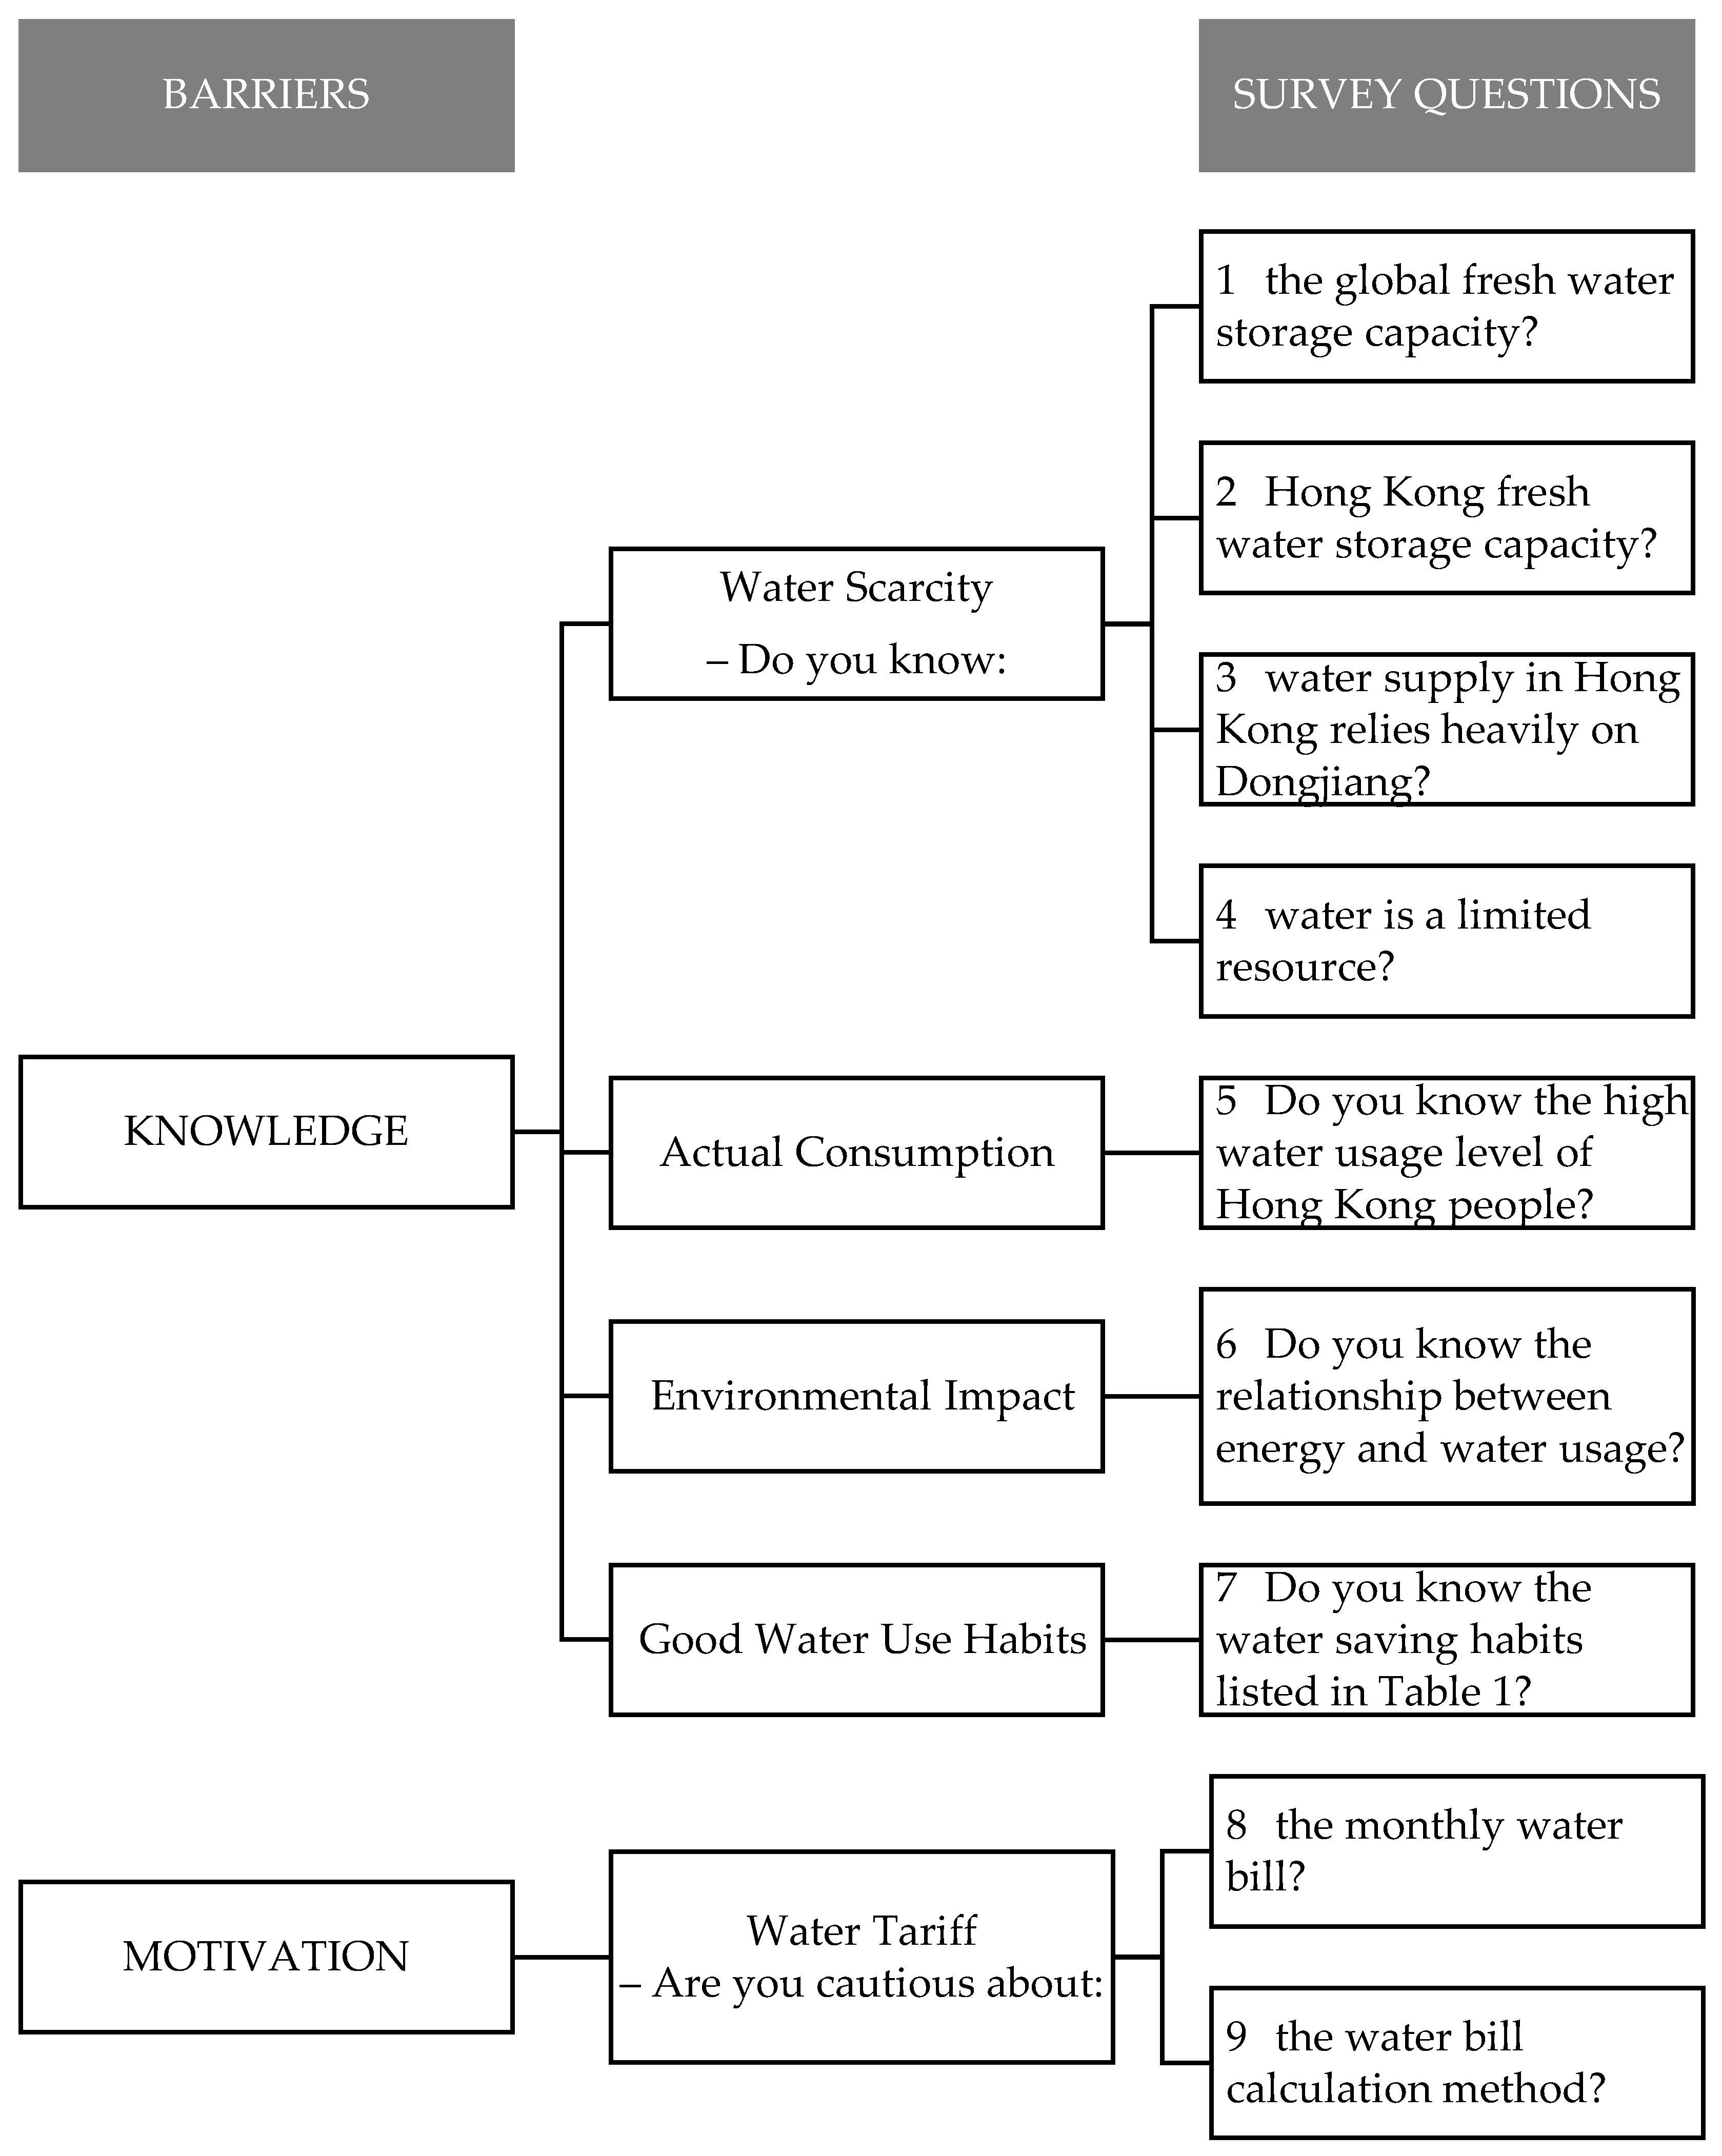
According to studies, knowledge barriers include a lack of awareness of the following issues: (1) water scarcity [24]; (2) actual consumption; (3) environmental impact [37]; (4) good water use habits [15]. The motivation barrier may arise due to the relatively low water tariff as compared to other utility bills [26]. It is because the water supply is considered as one of the social amenities and services, so it is often heavily subsidized [26].
Mapping of barriers to the survey questions (Part 4) is shown in Figure 1. It can be seen that there are altogether nine questions. All questions were structured in a forced-choice format for the collection of quantitative data. The respondents were required to indicate “Yes” and “No” to indicate their agreement with the statement.
2.2. Controlled Experiments and Site Measurements
Controlled experiments and site measurements were used to ascertain the potential territory-wide water saving associated with the adoption of water-saving habits.
The potential territory-wide habits-related water saving can be determined by Equation (2):
where ST is the habits-related water-saving potential in Hong Kong (m3/d); N is the total number of domestic households in Hong Kong (=2.504 million) [34]; ∆Hi is the amount of saving achieved by the adoption of the influential water-saving habit i (m3 per day per household); Ri is the take-up rate of the influential water-saving habit i determined in the questionnaire survey, and n is the number of influential water-saving habits.
To determine ∆Hi, a family of four from among the responding households was selected for a controlled experiment and site measurement. The family was selected because they had the typical characteristics of households in Hong Kong, which are: (1) household size of four; (2) composed of parents and 2 unmarried children in an age range of 20 to 54; (3) residing in public housing; (4) flat area less than 40 m2 [38]. To ensure accuracy in the controlled experiment and site measurement, all measurements were repeated three times [39].
The controlled experiment was conducted in February-March 2016 for a period of four weeks. The family members were requested to adopt the influential water-saving habits identified in the habit survey in the first two weeks and the water-inefficient habits in the following two weeks. The daily water consumption was recorded by a water meter connected to the main water supply point. The water meter was installed according to WSD’s requirements [40]. The metered consumption was down to 0.1 L.
The family members were also asked to record their frequency and duration of use for different activities. Together with the flow rates ascertained by site measurements, water consumption for the two studied periods was calculated.
A direct reading plastic rotameter was used to measure the flow rate (L/min) of the showerhead when individual family members were taking a shower. A stopwatch was used to record the showering and soaping durations. A simple container, a measuring cylinder, and a stopwatch were used to measure the flow rate of the kitchen and toilet faucets. Container volumes were determined by filling up the measuring cylinder. Prior to the measurements, the family members were invited to regulate the faucets to their usual level.
The metered readings were used to validate the calculated results.
The accuracy of the measurement instruments is summarized in Table 2.
3. Results and Discussions
3.1. Representativeness of the Responding Households
The demographic characteristics of the responding households are summarized in Table 3. The collected data were codified and summarized for a preliminary analysis. The preliminary analysis was to confirm if the responding households can collectively represent households in Hong Kong. A statistical test of significance was employed to compute the test statistics of the household size and the domestic per capita water consumption, as shown in Equation (3).
where,
- = sample mean of the ith parameter
- = population mean of the ith parameter
- = standard deviation of the ith parameter
- S = number of samples
- Zi = test statistic of the ith parameter
In the analysis, it was hypothesized that there was no difference between the sample mean and the population mean to claim representativeness of the candidate households. Considering the sample data and the government statistics given in Table 4 [41], it can be seen that the computed Z values for household size (ZHZ) and domestic per capita water consumption (ZCON) are −0.19 and 0.915, respectively. Taking the generally stated significance level of 0.05 as being statistically significant, the corresponding critical region, as obtained from the cumulative normal distribution curve, is 1.96. It can be concluded that the computed ZHZ and ZCON fall beyond the critical region to support the claim, and the population mean can be used in the subsequent analysis, that is, household size equals to the Hong Kong average of 2.8. The domestic per capita water consumption is 132 L/d.
Note that the government statistics on household size (Table 4) have been adjusted to 3.21 by removing the 0.46 million single-person households (out of 2.504 million households) who have no affiliations with undergraduate students.
3.2. Take-Up Rate of Water-Saving Habits
The take-up rate (Ri in Equation (2)) of each of the ten water-saving habits is summarized in Table 5. It can be seen that amongst them, the highest is “Take showers instead of baths” (91.7%). This is reasonable because over 30% of the population in Hong Kong resides in public housing, where shower cubicle is a standard provision [42]. The lowest is “wash face by filling up the wash basin instead of using running water” (18.5%).
3.3. The Influential Water-Saving Habits
To identify water-saving habits that affect domestic fresh water consumption the most, the bivariate correlations procedure was employed to compute the Pearson correlation coefficients between each water-saving habit and per capita water consumption (L/d.capita). The value 0 or one was assigned to indicate the absence or presence of a water-saving habit.
According to Pearson correlation coefficients, at 0.01 significance level (two-tailed), correlations between per capita water consumption and “Turn off the tap while cleaning teeth” (HT) (−0.697), “Take quick shower” (HQS) (−0.567), “Turn the water off while soaping” (HSP) (−0.491), and “Wash dishes in a pan of water instead of under running water” (HD) (−0.587) were significant and confirmed that they are the four influential water-saving habits that impact domestic fresh water consumption. It can be seen that all correlation coefficients are negative. This is judged reasonable because the presence of a water-saving habit can obviously reduce domestic per capita water consumption. It is also reasonable to note that washing machine-related habits (HW and HWT) are not influential because water consumption of this activity contributes only 9% to the fresh water consumption in Hong Kong [13].
3.4. Prediction of Overall Saving in Hong Kong
The measured results are summarized in Table 6, illustrating the water consumption in the absence and presence of a water-saving habit and the associated savings. The frequency of use is determined based on the recorded usage pattern of the household members.
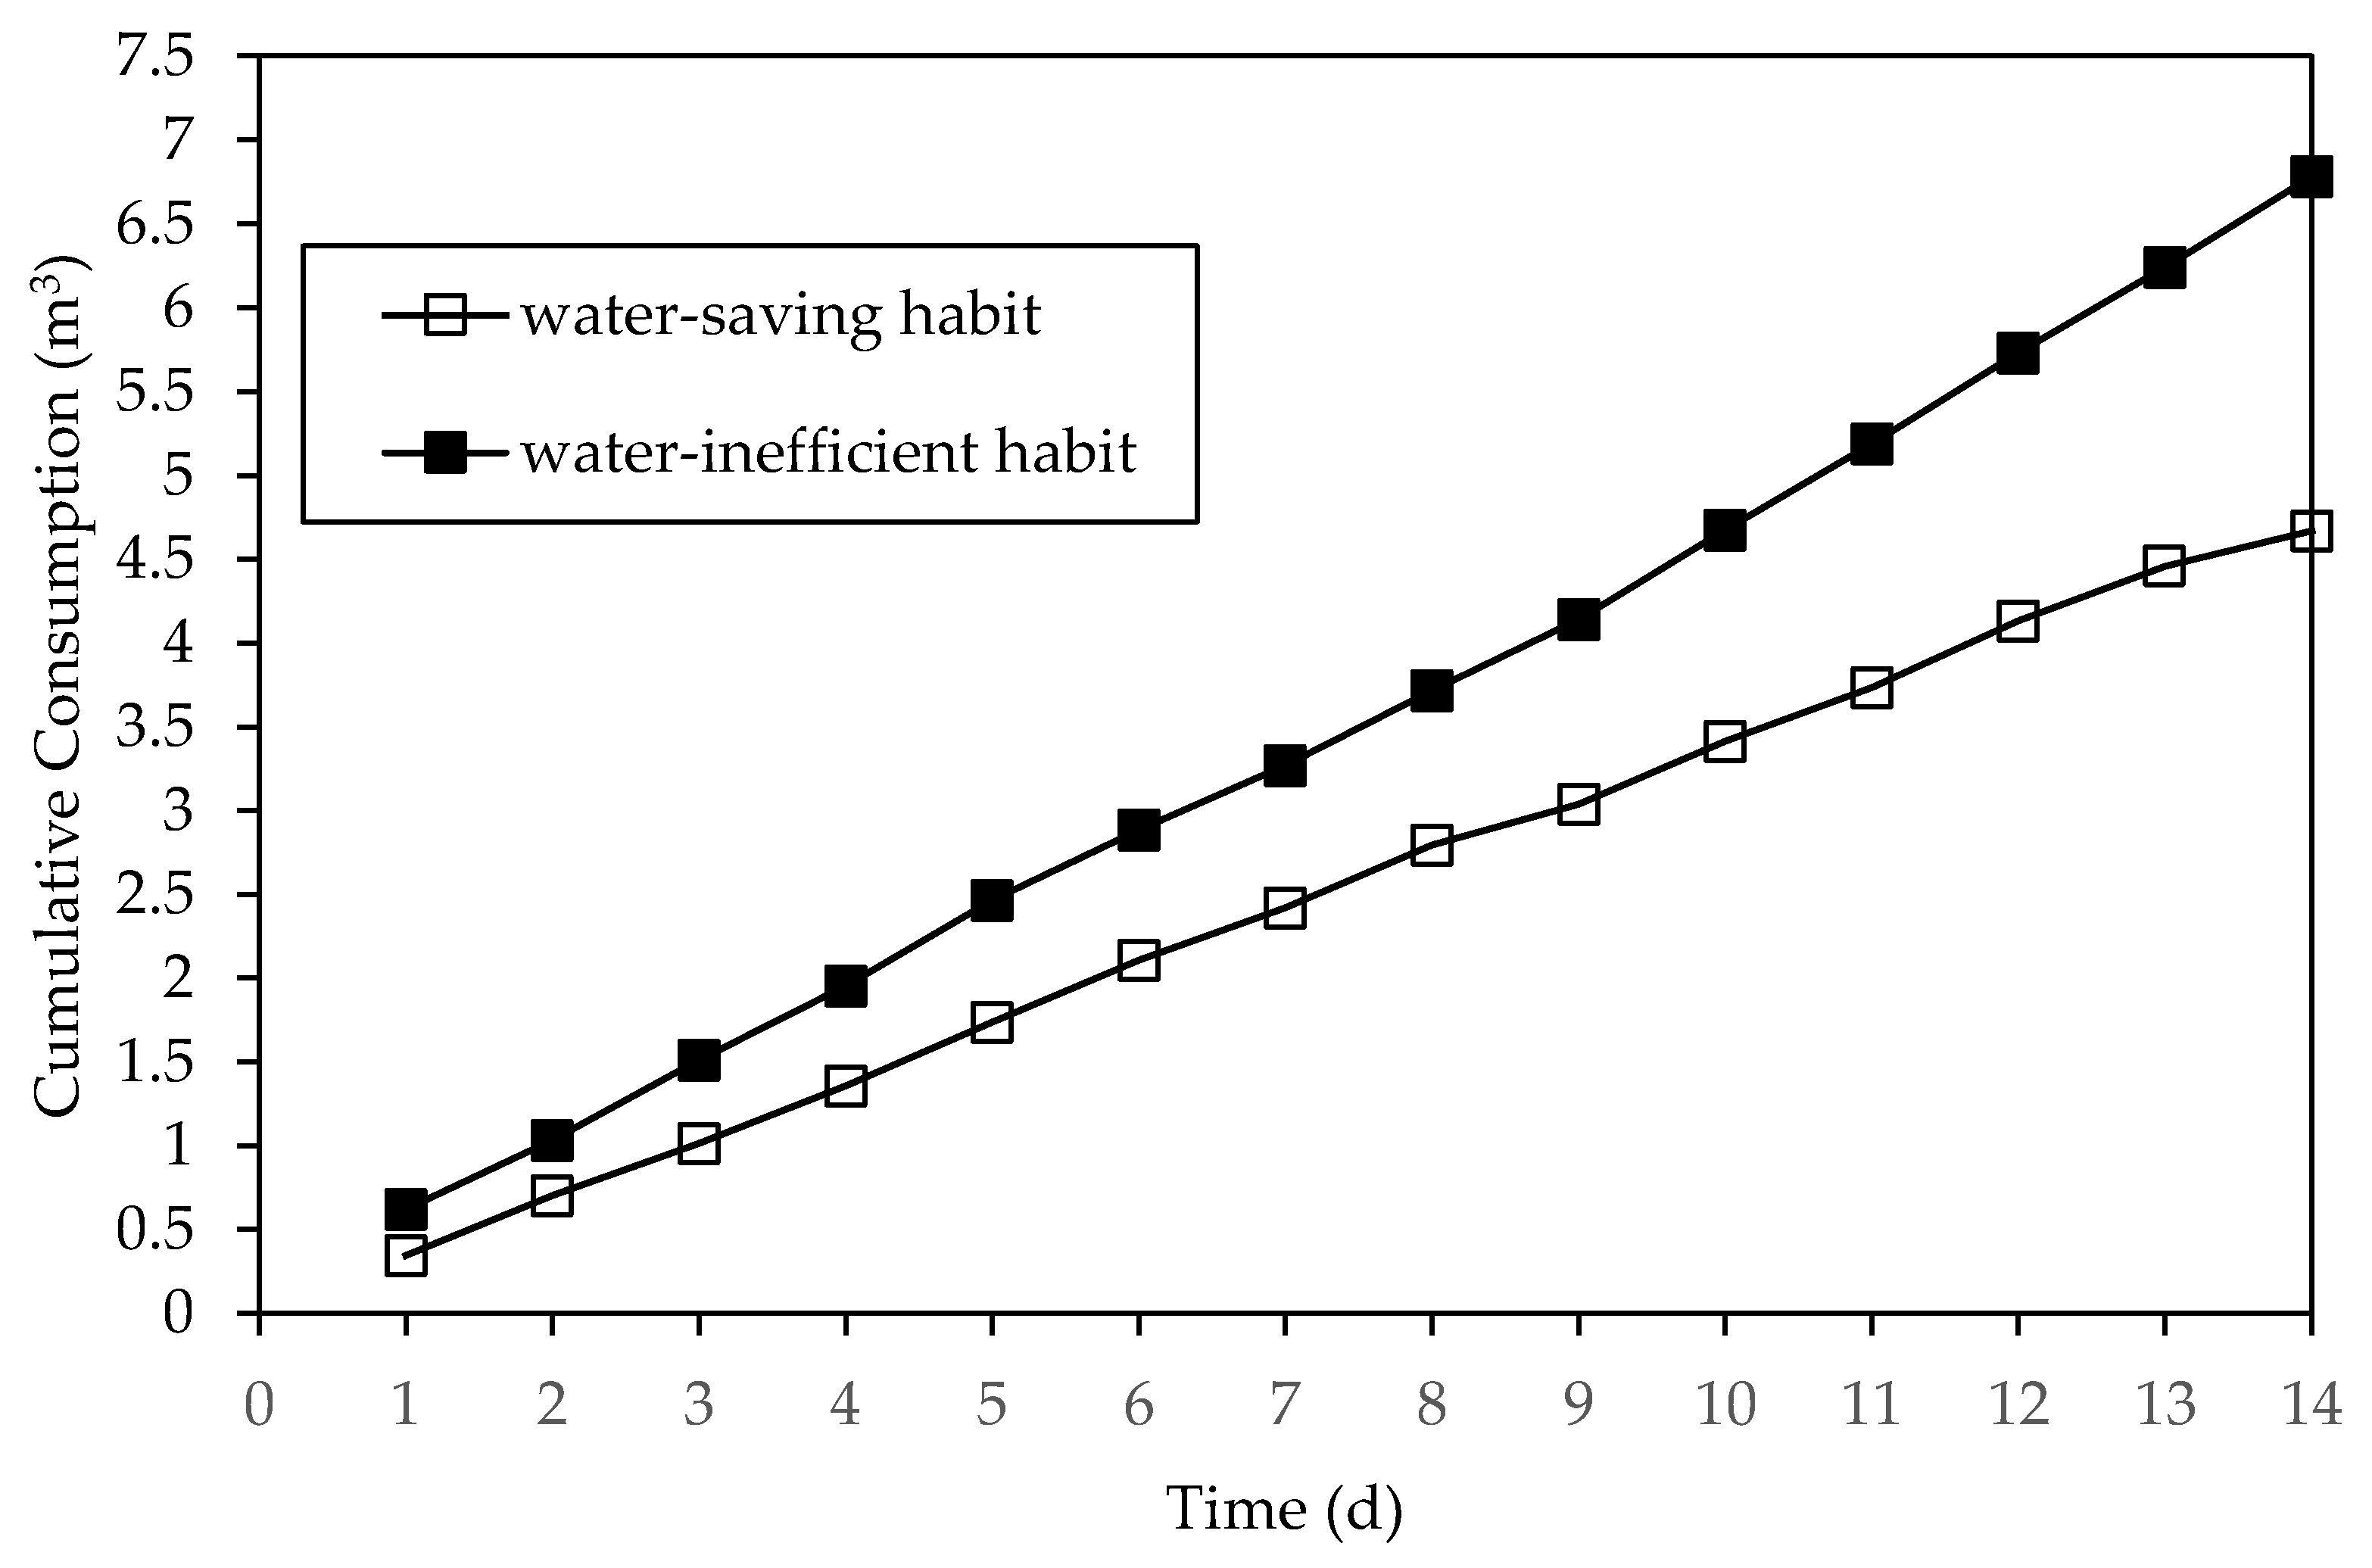
The metered readings, as recorded by the water meter from midnight to midnight each day, of the two controlled experiment periods are summarized in Table 7 and compared in Figure 2. It can be seen that the total consumption in the two periods is 4.67 m3 and 6.78 m3, respectively, indicating a total saving of 2.11 m3 over a period of two weeks when the four influential water-saving habits are present. This corresponds to a saving of 151 L/d.
The small difference in the measured and metered results (151 L vs. 153.1 L) confirms the reliability of the measured saving for each individual water-saving habit.
As the savings (L/d) were derived from a family of four members, they were therefore adjusted according to average household size (=2.8 people) to become ∆Hi (Table 6) for prediction of the overall saving in Hong Kong by Equation (2). Results are summarized in Table 8. It can be seen that the overall savings amount to 14.7% of the total domestic fresh water consumption in Hong Kong.
It is interesting to note that if Hong Kong people are encouraged to adopt the four influential water-saving habits to realize the 14.7% saving (132 × 0.853 = 112.6 L/d), the domestic per capita consumption will just be comparable to other global cities of 110 L/d on average.
3.5. Barriers to the Adoption of Water-Saving Habits
Pearson correlation analysis was again employed to examine the correlations between the responses of the respondents in Part 4 and per capita water consumption. The value one or 0 was assigned to indicate “Yes” or “No” response.
It is noted that at a significance level of 0.01 (two-tailed), the correlations between per capita water consumption and “Q6—aware of the relationship between energy and water usage” (−0.631), “aware of the high water usage level of Hong Kong people” (−0.563), and “cautious about the monthly water bill” (−0.556) were significant and confirmed that they are the three most influential issues related to the adoption of water-saving habits. It can be seen that the correlation coefficients are negative. This is judged reasonable because an awareness of the identified issues can obviously reduce per capita water consumption. A relatively weak correlation is observed for other issues.
It can, therefore, be concluded that possessing the knowledge about water scarcity and good water use habits are not barriers to the adoption of water-saving habits. While knowing the actual consumption, the environmental impact, and a cautious attitude about the water bill amount are the three influential issues. Measures and policies should, therefore, be established to break these knowledge and motivation barriers.
3.6. Policy Gap
To break the barriers to adoption of water-saving habits in Hong Kong, a review on the government’s initiatives has been done. It is noted that government initiatives are mainly educational and promotional activities undertaken by the WSD. The activities aim to boost public awareness of water scarcity and good water use habits [12]. On water scarcity, there are educational materials prepared for students of different learning levels from kindergarten to secondary school [43]. On good water use habits, water-saving tips are promoted on WSD’s website [44] by a mascot called Water Save Dave [45], and there are a series of campaigns like “let’s save 10 L water” and “water conservation week” [8]. However, little has been said about the high fresh water consumption level of Hong Kong people, the inter-relationship between energy and water usage, and the fact that water tariff in Hong Kong is heavily subsidized.
The review explains the knowledge and motivation barriers identified in Section 3.3 and reveals the need to boost public awareness on energy consumption related to water usage and the high fresh water consumption level of Hong Kong people to break the knowledge barrier and to re-examine the water tariff to break motivation barrier. As reflected from the success in raising the public’s awareness of water scarcity and good water use habit, breaking the knowledge barrier will not be a difficult task. The concern is water tariff. Domestic consumers in Hong Kong are billed for their water charges every four months (121.64 days). The tariff structure consists of four tiers with progressively increasing prices of which the first tier of 12 m3 is free of charge, the second tier of 31 m3 is charged at HK$4.16/m3, the third tier of 19 m3 is charged at HK$6.45/m3, and the fourth tier for any consumption above the level of 62 m3 (summation of consumption in the first three tiers = 12 + 31 + 19) is charged at HK$9.05/m3 [46].
To re-examine the water tariff, there is a need to identify the true water production costs from source to waste treatment. However, such information has never been made known to the public. An attempt has been made to estimate the water production cost in Hong Kong based on the discrete information collected from different sources [46,47,48,49]. Results are shown in Table 9. It can be seen that water production cost (excluding waste treatment) is estimated at HK$23.34/m3, while the water price based on average consumption of households in Hong Kong (Table 10) is only HK$3.15/m3, which is less than one-seventh of the true water production costs.
The raw water cost covers water treatment and water distribution cost in mainland China. The energy cost, which is rarely mentioned in literature, refers to the energy used in Hong Kong across the entire chain of operations for supplying water to consumers. The capital investment includes upgrading works of the slope in the reservoir areas [49], which have been designated as country parks for the purposes of nature conservation, countryside recreation, and outdoor education [50]. Thus, whether the expenses should be included in the production costs calculation is subject to debate. However, even after excluding this amount from the cost calculation, the government subsidy is still about two times the water price (8.34 vs. 3.15 HK$/m3).
How the water tariff should be reformed is beyond the scope of this study. However, the government should take the initiative to carry out a comprehensive audit of Hong Kong’s full water costs and to re-examine its water tariff.
4. Conclusions
Hong Kong, as one of the most densely populated cities in the world, is well known for its high-rise high-density residential buildings. Concerns about the high domestic fresh water consumption of Hong Kong households has increased in the last decade and has led to the introduction of a territory-wide total water management strategy by the government. However, almost a decade after the introduction, no obvious reduction in consumption has been observed. In this study, questionnaires were sent to 216 households, a controlled experiment was conducted at one of the representative households, and site measurements were conducted at 72 responding households to collect water use information. Representativeness of the 72 responding households was verified by statistical analysis. Based on the collected information, the adoption level of different water-saving habits was ascertained. The four most influential water-saving habits were identified, and the barriers to the adoption of the water-saving habits were determined. It was found that if the measures and policies are introduced to break the identified barriers, then there will be a potential saving of 14.7% of the total domestic fresh water consumption in Hong Kong. It was also found that the knowledge of water scarcity and good water use habits are not barriers to the adoption of water-saving habits in Hong Kong households. It was identified that the government should boost public awareness of environmental impact of water usage and the high fresh water consumption level of Hong Kong people to break the knowledge barrier and should re-examine the water tariff to break the motivation barrier. The results of this study provide useful information for decision makers in the context of water conservation in Hong Kong as well as elsewhere in the world.
Author Contributions
Conceptualization, W.L.L.; Methodology, Y.Z. and W.L.L.; Validation, Y.Z. and Y.B.; Formal Analysis, Y.Z. and Y.B.; Investigation, Y.Z. and Y.B.; Data Curation, Y.Z.; Writing-Original and Draft Preparation, Y.Z.; Writing-Review & Editing, W.L.L.
Funding
This research received no external funding.
Acknowledgments
The authors wish to thank their students TH Chung, SW Leung, WH Lau, KY Chan and KK Wong for their assistance in collecting data for this paper.
Conflicts of Interest
The authors declare no conflict of interest.
References
- Lundqvist, J. Water as a Human Resource. In Encyclopedia of Inland Waters; Academic Press: Oxford, UK, 2009; pp. 31–42. [Google Scholar]
- Vallès-Casas, M.; March, H.; Saurí, D. Examining the reduction in potable water consumption by households in Catalonia (Spain): Structural and contingent factors. Appl. Geogr. 2017, 87, 234–244. [Google Scholar] [CrossRef]
- Stavenhagen, M.; Buurman, J.; Tortajada, C. Saving water in cities: Assessing policies for residential water demand management in four cities in Europe. Cities 2018, 79, 187–195. [Google Scholar] [CrossRef]
- Fan, L.; Gai, L.; Tong, Y.; Li, R. Urban water consumption and its influencing factors in China: Evidence from 286 cities. J. Clean. Prod. 2017, 166, 124–133. [Google Scholar] [CrossRef]
- Kaya, A.; Tok, M.E.; Koc, M. A Levelized Cost Analysis for Solar-Energy-Powered Sea Water Desalination in The Emirate of Abu Dhabi. Sustainability 2019, 11, 1691. [Google Scholar] [CrossRef]
- Park, J.H.; Han, Y.S.; Ji, S.W. Investigation of mineral-processing waste water recycling processes: A pilot study. Sustainability 2018, 10, 3069. [Google Scholar] [CrossRef]
- Lu, W.; Leung, A.Y. A preliminary study on potential of developing shower/laundry wastewater reclamation and reuse system. Chemosphere 2003, 52, 1451–1459. [Google Scholar] [CrossRef]
- WSD. Hong Kong Water Supplies Department: Annual Report 2015/16 Water Security and Climate Resilient Development; WSD: Hong Kong, China, 2016.
- NBS. National Bureau of Statistics of China: China’s per Capita Water Resources in 2015. China, 2015. Available online: http://data.stats.gov.cn/easyquery.htm?cn=C01&zb=A0C02&sj=2015 (accessed on 18 July 2017).
- WSD. Hong Kong Water Supplies Department: Miscellaneous Data. Hong Kong, 2018. Available online: http://www.wsd.gov.hk/en/publications-and-statistics/statistics/key-facts/miscellaneous-data/index.html (accessed on 13 July 2018).
- WSD. Hong Kong Water Supplies Department: Total Water Management Strategy; WSD: Hong Kong, China, 2018. Available online: http://www.wsd.gov.hk/en/core-businesses/total-water-management-strategy/index.html (accessed on 13 July 2018).
- WSD. Hong Kong Water Supplies Department: Water Conservation. Hong Kong, 2018. Available online: https://www.wsd.gov.hk/en/water-conservation/index.html (accessed on 18 July 2018).
- WSD. Hong Kong Water Supplies Department: Domestic Water Consumption Survey; WSD: Hong Kong, China, 2012.
- WSD. Hong Kong Water Supplies Department: Total Water Management Strategy; WSD: Hong Kong, China, 2017.
- Fielding, K.S.; Russell, S.; Spinks, A.; Mankad, A. Determinants of household water conservation: The role of demographic, infrastructure, behavior, and psychosocial variables. Water Resour. Res. 2012, 48, 1–12. [Google Scholar] [CrossRef]
- March, H.; Hernández, M.; Saurí, D. Assessing domestic water use habits for more effective water awareness campaigns during drought periods: A case study in Alicante, eastern Spain. Nat. Hazards Earth Syst. Sci. 2015, 15, 963–972. [Google Scholar] [CrossRef]
- Andrews, B.R. Habit. Am. J. Psychol. 1903, 14, 121–149. [Google Scholar] [CrossRef]
- Kiang, T.T. Singapore’s experience in water demand management. In Proceedings of the 13th IWRA World Water Congress, Montpellier, France, 1–4 September 2008. [Google Scholar]
- Randolph, B.; Troy, P. Attitudes to conservation and water consumption. Environ. Sci. Policy 2008, 11, 441–455. [Google Scholar] [CrossRef]
- Adams, E.A. Behavioral Attitudes towards Water Conservation and Re-use among the United States Public. Resour. Environ. 2014, 4, 162–167. [Google Scholar] [CrossRef]
- Gilg, A.; Barr, S. Behavioural attitudes towards water saving? Evidence from a study of environmental actions. Ecol. Econ. 2006, 57, 400–414. [Google Scholar] [CrossRef]
- Domene, E.; Saurí, D. Urbanisation and water consumption: Influencing factors in the metropolitan region of Barcelona. Urban Stud. 2006, 43, 1605–1623. [Google Scholar] [CrossRef]
- Jorgensen, B.; Graymore, M.; O’Toole, K. Household water use behavior: An integrated model. J. Environ. Manag. 2009, 91, 227–236. [Google Scholar] [CrossRef] [PubMed]
- Martínez-Espiñeira, R.; García-Valiñas, M.Á. Adopting versus adapting: Adoption of water-saving technology versus water conservation habits in Spain. Int. J. Water Resour. Dev. 2013, 29, 400–414. [Google Scholar] [CrossRef]
- Seyranian, V.; Sinatra, G.M.; Polikoff, M.S. Comparing communication strategies for reducing residential water consumption. J. Environ. Psychol. 2015, 41, 81–90. [Google Scholar] [CrossRef]
- Levin, T.; Muehleisen, R. Saving Water Through Behavior Changing Technologies. In Proceedings of the 2016 ACEEE Summer Study on Energy Efficiency in Buildings, Pacific Grove, CA, USA, 21–26 August 2016. [Google Scholar]
- Matos, C.; Teixeira, C.A.; Bento, R.; Varajão, J.; Bentes, I. An exploratory study on the influence of socio-demographic characteristics on water end uses inside buildings. Sci. Total Environ. 2014, 466–467, 467–474. [Google Scholar] [CrossRef]
- Gardner, B. Habit Formation and Behavior Change. Psychology 2016. [Google Scholar] [CrossRef]
- Etikan, I. Comparison of Convenience Sampling and Purposive Sampling. Am. J. Theor. Appl. Stat. 2016, 5, 1–4. [Google Scholar] [CrossRef]
- Franklin, L.A. Sample size determination for lower confidence limits for estimating process capability indices. Comput. Ind. Eng. 1999, 36, 603–614. [Google Scholar] [CrossRef]
- Chen, H.; Lee, W.L. Combined space cooling and water heating system for Hong Kong residences. Energy Build. 2010, 42, 243–250. [Google Scholar] [CrossRef]
- Fung, Y.W.; Lee, W.L. Developing a simplified parameter for assessing view obstruction in high-rise high-density urban environment. Habitat Int. 2012, 36, 343–422. [Google Scholar] [CrossRef]
- HKU POP Site. The University of Hong Kong Public Opinion Programme; HKU POP Site: Hong Kong, China, 2018. [Google Scholar]
- C&SD. Hong Kong Census and Statistics Department: Statistics on Domestic Households; C&SD: Hong Kong, China, 2017. Available online: https://www.censtatd.gov.hk/hkstat/sub/sp150.jsp?tableID=005&ID=0&productType=8 (accessed on 23 July 2018).
- EDB. Hong Kong Education Bureau: Publications and Statistics; EDB: Hong Kong, China, 2016. Available online: https://www.edb.gov.hk/en/about-edb/list-page.html (accessed on 23 July 2018).
- Gregory, G.D.; Di Leo, M. Repeated Behavior and Environmental Psychology: The Role of Personal Involvement and Habit Formation in Explaining Water Consumption. J. Appl. Soc. Psychol. 2003, 33, 1261–1296. [Google Scholar] [CrossRef]
- Uche, J.; Martínez-Gracia, A.; Círez, F.; Carmona, U. Environmental impact of water supply and water use in a Mediterranean water stressed region. J. Clean. Prod. 2015, 88, 196–204. [Google Scholar] [CrossRef]
- C&SD. Hong Kong Census and Statistics Department: Hong Kong Monthly Digest of Statistics; C&SD: Hong Kong, China, 2016. [CrossRef]
- Vardeman, S.B.; Jobe, J.M. Chapter 2: Statistics and Measurement. In Statistical Methods for Quality Assurance; Springer: New York, NY, USA, 2016. [Google Scholar] [CrossRef]
- WSD. Hong Kong Water Supplies Department: Handbook on Plumbing Installation for Buildings; WSD: Hong Kong, China, 2001.
- C&SD. Hong Kong Census and Statistics Department: 2017 Population Census. Hong Kong, 2017. Available online: https://www.censtatd.gov.hk/hkstat/sub/so20.jsp (accessed on 23 July 2018).
- HD. Hong Kong Housing Department: Public Housing; HD: Hong Kong, China, 2018. Available online: https://www.housingauthority.gov.hk/en/public-housing/index.html (accessed on 23 July 2018).
- WSD. Hong Kong Water Supplies Department: Water Conservation Education; WSD: Hong Kong, China, 2017. Available online: https://www.wsd.gov.hk/en/water-conservation/education/index.html (accessed on 23 July 2018).
- WSD. Hong Kong Water Supplies Department: Water Saving Tips; WSD: Hong Kong, China, 2017. Available online: https://www.wsd.gov.hk/en/water-conservation/domestic/water-saving-tips/index.html (accessed on 23 July 2018).
- WSD. Hong Kong Water Supplies Department: Water Save Dave; WSD: Hong Kong, China, 2016. Available online: https://www.wsd.gov.hk/en/home/highlights/index_id_104.html (accessed on 23 July 2018).
- Chan, P. Press Releases, LCQ20: Fresh Water Supply 2013. pp. 1–4. Available online: http://www.info.gov.hk/gia/general/201302/27/P201302270327.htm (accessed on 18 July 2018).
- WSD. Hong Kong Water Supplies Department: Annual Report 2013/14 Water Security Conservation; WSD: Hong Kong, China, 2014.
- LegCo Secretariat. Legislative Council Secretariat: Water resources in Hong Kong. Res. Brief 2015, 1–18. [Google Scholar] [CrossRef]
- WSD. Hong Kong Water Supplies Department: Annual Report 2014/2015 Exploit New Water Resources and Foster Water Conservation Culture; WSD: Hong Kong, China, 2015.
- AFCD. Hong Kong Agriculture Fisheries and Conservation Department: HONG KONG THE FACTS—Country Parks and Conservation 2018. Available online: http://www.afcd.gov.hk/english/country/cou_lea/the_facts.html (accessed on 23 July 2018).
Figure 1.
Mapping of the barriers to the survey questions (Part 4).

Figure 2.
Metered consumption for the two two-week measurement periods.


Table 1.
Water-saving habits.
| No. | Habits |
|---|---|
| H1 | Turn off the tap while cleaning teeth |
| H2 | Washing face by filling up the wash basin instead of using running water |
| H3 | Take showers instead of baths |
| H4 | Take quick showers |
| H5 | Turn off the shower while soaping |
| H6 | Defrost food early instead of thawing food under running water |
| H7 | Wash dishes in a pan of water instead of under running water |
| H8 | Wash vegetables and fruits in a pan of water instead of under running water |
| H9 | Run washing machine with a full load |
| H10 | Adjust the washing time/water level for different types/amounts of clothes |
Table 2.
Instruments used for in-situ measurement.
| Parameters | Instrument | Brand * | Model | Accuracy * |
|---|---|---|---|---|
| Water Consumption | Water Meter | WSD approved | M08-218656 | ±3% |
| Water Flow Rate | Plastic Rotameter | Omega | FL-86C | ±6% FS/± 1% |
* WSD is Water Supply Department and FS is Full Scale.
Table 3.
Demographic characteristics of the responding households.
| Family Size | Housing District * | Daily Consumption (L/s.capita) * | |||||
|---|---|---|---|---|---|---|---|
| No. of Persons | Frequency | District | Frequency | District | Frequency | ||
| 6 | 1 | Central | 0 | Islands | 0 | Maximum | 304.8 |
| 5 | 3 | Eastern | 11 | Kwai Tsing | 1 | Minimum | 67.2 |
| 4 | 21 | Southern | 1 | North | 4 | Median | 125.5 |
| 3 | 31 | Wan Chai | 2 | Sai Kung | 4 | Mean | 136.8 |
| 2 | 16 | Kowloon City | 10 | Sha Tin | 4 | Standard deviation | 44.5 |
| 1 | 0 | Kwun Tong | 6 | Tai Po | 2 | ||
| Sham Shui Po | 2 | Tsuen Wan | 5 | ||||
| Yau Tsim Mong | 3 | Tuen Mun | 11 | ||||
| Wong Tai Sin | 0 | Yuen Long | 6 | ||||
* Hong Kong is geographically divided into 18 housing districts; L/s.capita is Litre/second.person.
Table 4.
Population and sample mean.
| Parameter | Population Mean μ | Sample | No. of Samples S | Test Statistic Z | |
|---|---|---|---|---|---|
| Mean | Standard Deviation σ | ||||
| Household Size | 3.21 | 3.19 | 0.88 | 72 | −0.19 |
| Domestic per Capita Water Consumption (Litre/day) | 132 | 136.8 | 44.5 | 72 | 0.915 |
Table 5.
Take-up rate of ten water-saving habits.
| Abbreviation | Habit | Take-Up Rate Ri |
|---|---|---|
| HT | Turn off the tap while cleaning teeth | 45.8% |
| HF | Washing face by filling up the wash basin instead of using running water | 18.5% |
| HS | Take showers instead of baths | 91.7% |
| HQS | Take quick shower | 48.1% |
| HSP | Turn the water off while soaping | 63.7% |
| HDF | Defrost the food early instead of thawing food under running water | 88.9% |
| HD | Wash dishes in a pan of water instead of under running water | 43.1% |
| HV | Wash vegetables and fruits in a pan of water instead of under running water | 52.8% |
| HW | Run washing machine with a full load | 73.6% |
| HWT | Adjust the washing time/water level for different types/amounts of clothes | 59.3% |
Table 6.
Measured water consumption.
| Influential Habit* | Water Consumption (L/use) | Saving (L/use) | Frequency of Use (times/d) | Saving ∆Hi (L/d) | ||
|---|---|---|---|---|---|---|
| Absence | Presence | Measured | Adjusted | |||
| HT | 6.608 | 0.975 | 5.633 | 8 | 45.1 | 31.5 |
| HQS | 33.615 | 27.69 | 5.925 | 4 | 23.7 | 16.6 |
| HSP | 7.5 | 0 | 7.500 | 4 | 30.0 | 21.0 |
| HD | 42 | 14.859 | 27.141 | 2 | 54.3 | 38.0 |
| Total | 153.0 | 107.1 | ||||
HT: Turn off the tap while cleaning teeth; HQS: Take quick shower; HSP: Turn the water off while soaping; HD: Wash dishes in a pan of water instead of under running water.
Table 7.
Metered readings.
| Water-Saving Habits | Water-Inefficient Habits | ||||||
|---|---|---|---|---|---|---|---|
| Date | Meter Reading * | Consumption (L) | Cumulative Consumption (m3) | Date | Meter Reading * | Consumption (L) | Cumulative Consumption (m3) |
| 23-Feb | 11864100 | 0 | 10-Mar | 11917260 | 621.0 | 0.621 | |
| 24-Feb | 11867514 | 341.4 | 0.3414 | 11-Mar | 11923470 | 408.4 | 1.0294 |
| 25-Feb | 11871127 | 361.3 | 0.7027 | 12-Mar | 11927554 | 481.1 | 1.5105 |
| 26-Feb | 11874232 | 310.5 | 1.0132 | 13-Mar | 11932365 | 443.3 | 1.9538 |
| 27-Feb | 11877647 | 341.5 | 1.3547 | 14-Mar | 11936798 | 508.6 | 2.4624 |
| 28-Feb | 11881461 | 381.4 | 1.7361 | 15-Mar | 11941884 | 422.6 | 2.885 |
| 1-Mar | 11885159 | 369.8 | 2.1059 | 16-Mar | 11946110 | 381.8 | 3.2668 |
| 2-Mar | 11888275 | 311.6 | 2.4175 | 17-Mar | 11949928 | 447.7 | 3.7145 |
| 3-Mar | 11892032 | 375.7 | 2.7932 | 18-Mar | 11954405 | 424.3 | 4.1388 |
| 4-Mar | 11894464 | 243.2 | 3.0364 | 19-Mar | 11958648 | 535.2 | 4.674 |
| 5-Mar | 11898219 | 375.5 | 3.4119 | 20-Mar | 11964000 | 514.8 | 5.1888 |
| 6-Mar | 11901441 | 322.2 | 3.7341 | 21-Mar | 11969148 | 540.4 | 5.7292 |
| 7-Mar | 11905399 | 395.8 | 4.1299 | 22-Mar | 11974552 | 510.4 | 6.2396 |
| 8-Mar | 11908661 | 326.2 | 4.4561 | 23-Mar | 11979656 | 541.6 | 6.7812 |
| 9-Mar | 11910771 | 211.0 | 4.6671 | 24-Mar | 11985072 | ||
* 8-digit number shown on the water meter. Water consumption in a period is the difference between two metered readings.
Table 8.
Prediction of overall water-saving.
| Influential Habit | Saving ∆Hi (L/d) | Take-Up Rate Ri | Saving for 2.504 Million Households (m3/d) |
|---|---|---|---|
| HT | 31.5 | 45.80% | 42,818.4 |
| HQS | 16.6 | 48.10% | 21,563.4 |
| HSP | 21.0 | 63.70% | 19,091.0 |
| HD | 38.0 | 43.10% | 54,146.4 |
| Total Saving ST | 137,619.2 | ||
| % of Saving = 137,619.2/939,066 # × 100% =14.7% | |||
# Total annual domestic fresh water consumption of the residential sector in Hong Kong = 132/1000 (m3 /person) × 711,4136 (population of Hong Kong) = 939,066 m3. HT: Turn off the tap while cleaning teeth; HQS: Take quick shower; HSP: Turn the water off while soaping; HD: Wash dishes in a pan of water instead of under running water.
Table 9.
Water production costs in Hong Kong.
| Production Costs | HK$/yr | HK$/yr/household | HK$/m3 | Remarks | ||
|---|---|---|---|---|---|---|
| Capital investment [47] | 5062 million | 2021.6 1 | 15.0 2 | 1 Total number of households in Hong Kong = 2.504 million 2 Consumption per year per household = 132 L/capita.d × 2.8 persons/household × 365 days = 135 m3/year/household | ||
| Raw water [46,48] | Dongjiang (79%) | 8.6 | 7.6 (Average) | |||
| Local rainwater (21%) | 4 | |||||
| Energy cost for distribution system [49] | 0.74 3 | 3 Energy cost = 0.568 kWh/m3 and Electricity Tariff = 1.3 HK$/kWh | ||||
| Total Production Cost (HK$/m3) | 23.34 (= 8.34 if capital investment is excluded) | |||||
Table 10.
Water price and government subsidy in Hong Kong.
| Water Price [46] | HK$/4-month | HK$/4-month | HK$/m3 | Remarks |
| (Based on consumption of 45 m3/household for 4-month) 1 | ||||
| first tier 12 m3 free | 0 | 141.9 (Total) | 3.15 | 1 Consumption per household for 4-month = 132 L/capita.d × 2.8 persons/household × 121.64 days = 45.0 m3/household for 4-month |
| second tier (31 m3 at HK$4.16/m3) | 31 × 4.16 = 129 | |||
| third tier (19 m3 at HK$6.45/m3) | (45 − 31 − 12) × 6.45 = 12.9 | |||
| fourth tier (above 62 m3 at HK$9.05/m3) | 0 | |||
| Total Water Price (HK$/m3) | 3.15 | |||
| Government Subsidy (HK$/m3) = Production Cost (Table 9) − Water Price | = 23.34 − 3.15 = 20.19 = 8.34 − 3.15 = 5.19 (if exclude capital investment) | |||
© 2019 by the authors. Licensee MDPI, Basel, Switzerland. This article is an open access article distributed under the terms and conditions of the Creative Commons Attribution (CC BY) license (http://creativecommons.org/licenses/by/4.0/).
Share and Cite
MDPI and ACS Style
Zhao, Y.; Bao, Y.; Lee, W.L. Barriers to Adoption of Water-Saving Habits in Residential Buildings in Hong Kong. Sustainability 2019, 11, 2036. https://0-doi-org.brum.beds.ac.uk/10.3390/su11072036
AMA Style
Zhao Y, Bao Y, Lee WL. Barriers to Adoption of Water-Saving Habits in Residential Buildings in Hong Kong. Sustainability. 2019; 11(7):2036. https://0-doi-org.brum.beds.ac.uk/10.3390/su11072036
Chicago/Turabian StyleZhao, Ying, Yani Bao, and Wai Ling Lee. 2019. "Barriers to Adoption of Water-Saving Habits in Residential Buildings in Hong Kong" Sustainability 11, no. 7: 2036. https://0-doi-org.brum.beds.ac.uk/10.3390/su11072036
Note that from the first issue of 2016, this journal uses article numbers instead of page numbers. See further details here.