Article

Impact of Landscape Structure on the Variation of Land Surface Temperature in Sub-Saharan Region: A Case Study of Addis Ababa using Landsat Data (1986–2016)

by
DMSLB Dissanayake
1,2,*,
Takehiro Morimoto
3,
Yuji Murayama
3 and
Manjula Ranagalage
1,2,*
1
Graduate School of Life and Environmental Sciences, University of Tsukuba, 1-1-1, Tennodai, Tsukuba, Ibaraki 305-8572, Japan
2
Department of Environmental Management, Faculty of Social Sciences and Humanities, Rajarata University of Sri Lanka, Mihintale 50300, Sri Lanka
3
Faculty of Life and Environmental Sciences, University of Tsukuba, 1-1-1, Tennodai, Tsukuba, Ibaraki 305-8572, Japan
*
Authors to whom correspondence should be addressed.
Sustainability 2019, 11(8), 2257; https://0-doi-org.brum.beds.ac.uk/10.3390/su11082257
Submission received: 13 March 2019 / Revised: 9 April 2019 / Accepted: 10 April 2019 / Published: 15 April 2019

Abstract

:
Urbanization has bloomed across Asia and Africa of late, while two centuries ago, it was confined to developed regions in the largest urban agglomerations. The changing urban landscape can cause irretrievable changes to the biophysical environment, including changes in the spatiotemporal pattern of the land surface temperature (LST). Understanding these variations in the LST will help us introduce appropriate mitigation techniques to overcome negative impacts. The research objective was to assess the impact of landscape structure on the variation in LST in the African region as a geospatial approach in Addis Ababa, Ethiopia from 1986–2016 with fifteen-year intervals. Land use and land cover (LULC) mapping and LST were derived by using pre-processed Landsat data (Level 2). Gradient analysis was computed for the pattern of the LST from the city center to the rural area, while intensity calculation was facilitated to analyze the magnitude of LST. Directional variation of the LST was not covered by the gradient analysis. Hence, multidirectional and multitemporal LST profiles were employed over the orthogonal and diagonal directions. The result illustrated that Addis Ababa had undergone rapid expansion. In 2016, the impervious surface (IS) had dominated 33.8% of the total lands. The IS fraction ratio of the first zone (URZ1) has improved to 66.2%, 83.7%, and 87.5%, and the mean LST of URZ1 has improved to 25.2 °C, 26.6 °C, and 29.6 °C in 1986, 2001, and 2016, respectively. The IS fraction has gradually been declining from the city center to the rural area. The behavior of the LST is not continually aligning with a pattern of IS similar to other cities along the URZs. After the specific URZs (zone 17, 37, and 41 in 1986, 2001, and 2016, respectively), the mean LST shows an increasing trend because of a fraction of bare land. This trend is different from those of other cities even in the tropical regions. The findings of this study are useful for decision makers to introduce sustainable landscape and urban planning to create livable urban environments in Addis Ababa, Ethiopia.

1. Introduction

At the turn of the 20th century, there were 371 cities with one million or more inhabitants around the world and this increased to 548 cities in 2018 [1]. It is projected that in 2030, there will be 706 such cities. The number of global urban residents surpassed the global rural population in 2007. Moreover, about 60% and 66% of the global population is expected to be lodged in urban areas in 2030 and 2050 respectively [2]. From the urbanization viewpoint, Africa and Asia have been notable regions since 1950, and Ethiopia has been identified as a country with relatively rapid urbanization similar to that of developing counties [3]. The population of Addis Ababa, the capital city of Ethiopia, is more than 3 million and is predicted to be 12 million in 2024 [4]. Changing landscape and biophysical attributes of the urban environment are some of the offshoots of overpopulation in the urban area. They resulted in rapid changes in the urban landscape by converting natural vegetation into the impervious surface (IS) [5].
Landscape structure consists of anthropogenic and natural components and their spatial pattern [6,7]. Building materials and non-vegetative surface (bare soil) can trap solar radiation [8] in the daytime and then re-radiate during the nighttime due to the decline in albedo [9]. They are one of the reasons for the increasing land surface temperature (LST), which can also be the cause of the fluctuation of surface energy balance [10]. Generally, cities produce urban heat island due to the high LST regardless of size and location. However, the magnitude of the LST can depend on the size of the city and it often decreases as city size decreases [11]. Hence, LST is the most crucial parameter for various kinds of applications at the local and global level, including the physical, chemical, and biological [12,13]. Changing landscape structure affects LST and has negative consequences for the socioeconomic and environmental attributes in an urban area. Elevated temperature or heatwaves in an urban area can affect the natural environmental and human health. The air quality decreases as the surface air gets warmer [14]. Heat waves can affect the wellbeing of urban dwellers [13,15,16]. Hence, LST and its causal factors have been becoming a significant research topic among the scientific community [17,18]. To the best of our knowledge, studies related to the LST combining with urban landscape structure and geospatial application are scarce. Hence, focusing research on addressing this limitation is an important, timely task.
Previous studies have shown various approaches for assessing landscape structure and its impact on the variation of the LST over the urban area [19,20,21,22]. A few popular approaches include (i) observing the pattern of the LST along the urban-rural zone (URZ) and (ii) studying the variation of the LST concerning land use and land cover [23,24,25,26,27]. However, these approaches necessitate the classification of Land use and land cover(LULC ) and the computation of LST (LULC as a local climate zone). Geospatial and remote sensing (RS) techniques are facilitated for the classification and investigation of the changes in LULC in both spatial and temporal viewpoints, as conventional approaches such as ground-based methods are limited as they are time- and capital-consuming [28,29,30]. Similarly, calculation of the LST from thermal infrared RS data is a large-scale time-consuming approach and a solution for the absence of ground-based temperature data [13,31]. Assessing the composition of the LULC provides necessary information to understand the spatial and temporal distribution pattern of the landscape. Variation in the magnitude of both LST and LULC can be observed through intensity calculation. The influence of LST on the dynamic urban landscape structure is difficult to study from a single perspective, and a multidirectional and multitemporal approach can overcome this obstacle by generating a comprehensive LST profile.
In this context, Addis Ababa, the capital of Ethiopia and a diplomatic landmark of Africa, is one of the fastest growing cities in the continent [4,16]. The city has an abundance of sunshine as it lies in the tropical region, close to the equator, which is an essential attribute for LST studies [13]. The minimum and maximum mean annual temperature are about 12 °C and 24 °C, respectively [32]. Urban expansion and overpopulation are some of the anthropogenic activities that resulted in changes in the landscape structure, while physical attributes such as the dry season and the desert [1] (location of the sub-Saharan region) could affect LST. Keeping the objective of this research was to assess the impact of the landscape structure for the variation of LST in the African region as a geospatial approach. The results of this study will be useful as a proxy indicator for sustainable urban planning, and the methodology could be applied to other similar cities, especially in the African region.

2. Materials and Methods
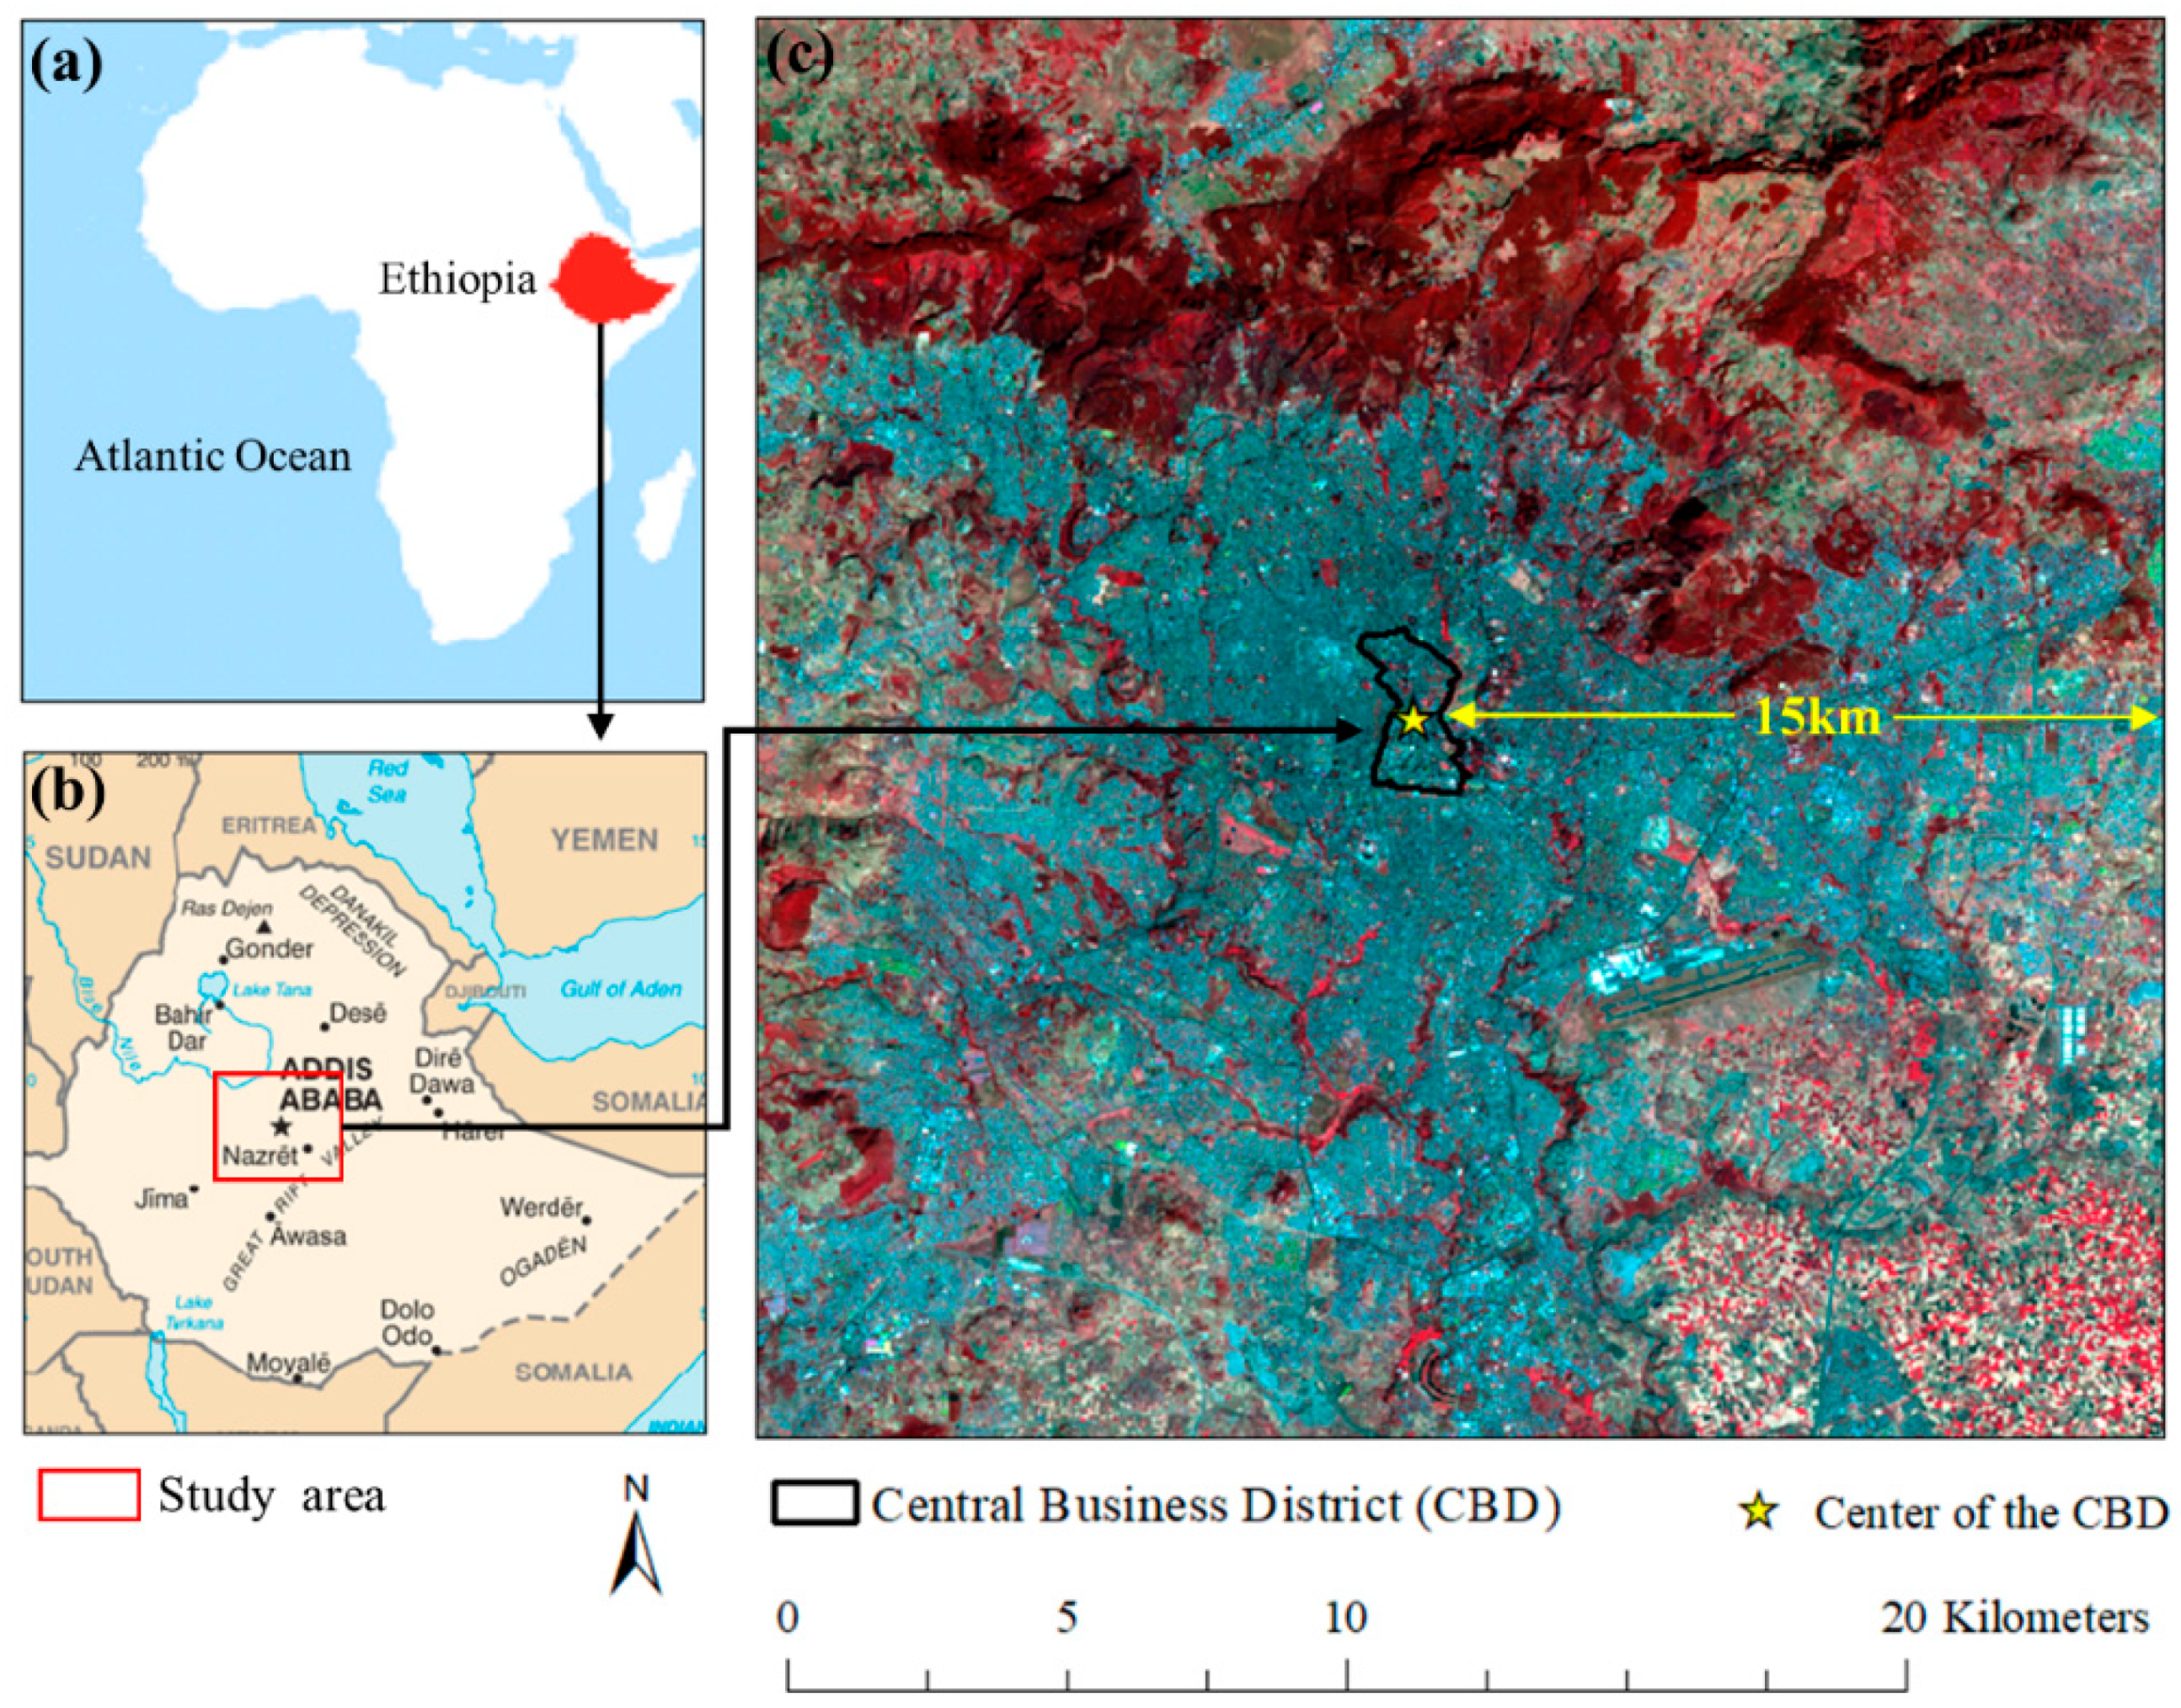
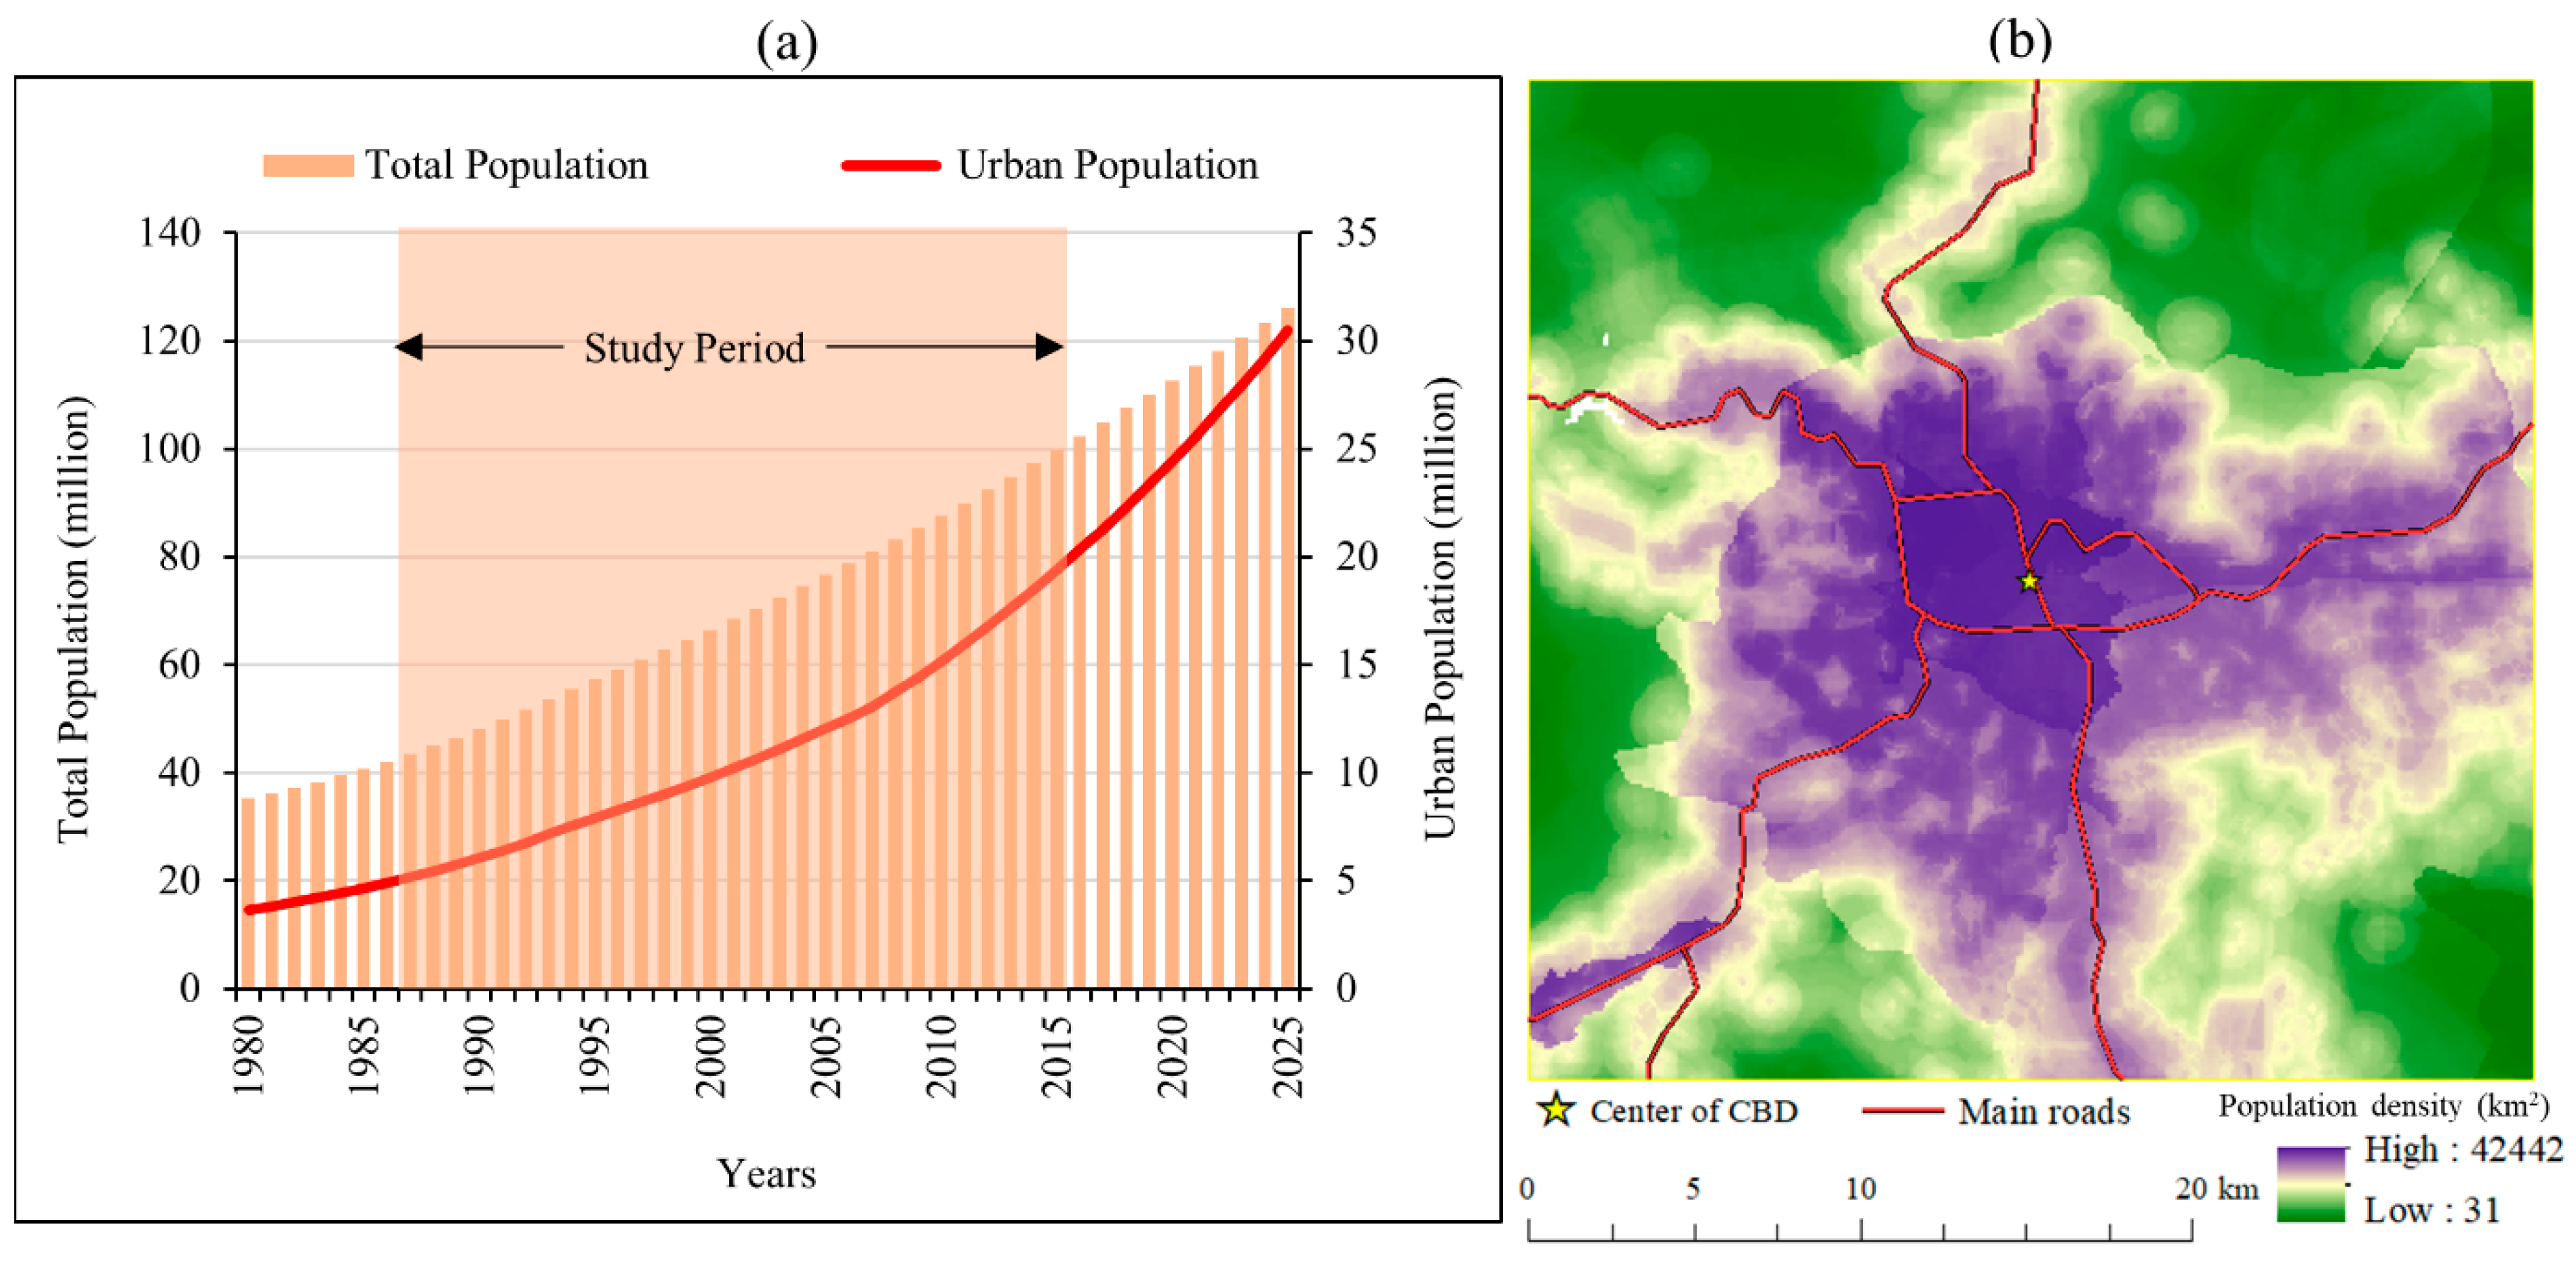
2.1. Study Area

Addis Ababa is the capital and also the largest city in Ethiopia that lies in the central highland of the Ethiopian federal government and on the western edge of the Rift valley in the Eastern Africa region. The climate is generally sub-tropical with an average temperature of 10–15 °C in the night and 20–24 °C in the daytime in the dry period [33]; rainfall peaks during the summer from July to August and is minimum during the winter (December–February) [34]. The mean center of the Central Business District (CBD) of Addis Ababa is defined as the central point (9.02130° N, 38.75163° E) of the study area. We have selected a 30 km × 30 km geographical area as the study area with a 15 km radius from the city center covering 900 km2 (Figure 1), bound by latitude 9.141622° N to 8.811627° N and longitude 38.605921° E to 38.906661° E.

2.2. Datasets and Data Pre-Processing

Radiometric-calibrated and atmospheric-corrected Landsat Level 2 (On-Demand) data were obtained from the United States Geological Survey (USGS) official website, including Normalized Difference Vegetation Index (NDVI). Landsat-8 TIRS (Band 10) and Landsat-5 TM (Band 6) were provided as the atmospheric brightness temperature in Kelvin (K), which is generated from Landsat top of atmosphere [35,36]. All multispectral bands (Landsat-8 OLI and Landsat-5 TM) were provided as surface reflectance [36]. In this process, the authors were responsible for maintaining the dry season daytime data and cloud-free images or minimum cloud cover data (<10%). Furthermore, the temporal resolution of the data was maintained as much as possible by considering the availability of free data, but it is important to note that the same temporal resolution data were not available. Hence, the same month of the dry season [37] (December) was selected to maintain the temporal uniformity over the study period. However, this issue did not significantly affect the final result because (i) the research emphasized the LST pattern along the URZs rather than the absolute value and (ii) necessary atmospheric and radiometric calibrations were conducted by USGS. Table 1 shows the comprehensive summary of the raw data.

2.3. Land Use/Cover Mapping

An attempt is made to conduct four types of classifications which are facilitated by R software (support vector machine, K-nearest neighbor, random forest, and neural networks); both overall accuracy and kappa statistics were the highest for the neural networks method [38]. Hence, this method was selected. The three images used were classified into six categories: Impervious surface (IS), forest, grassland, bareland, cropland, and water. The authors used (i) IS, (ii) green space 1 (GS1) as forest, (iii) green space 2 (GS2) as grassland and cropland, and (iv) bareland (BL) as the same bareland for the current study.

2.4. Computation of LST

First, the proportion of vegetation was calculated (Equation (1)) by using the NDVI data downloaded from the USGS as explained in Section 2.2.
P v = ( ( NDVI NDVI min ) / ( NDVI max   NDVI min ) ) 2
where Pv represents the amount of vegetation, NDVImin represents the minimum values of the NDVI, and NDVImax represents the maximum value of the NDVI.
Second, land surface emissivity (ε) was computed by using Equation (2).
ε = m   P v + n
where ε represents land surface emissivity; m represents (εvεs) − (1 − εs) v; Pv represents the amount of vegetation; n represents εs + (1 − εs) v; εs is the soil emissivity; εv is the vegetation emissivity; and F is a shape factor whose mean value, assuming different geometrical distributions, is 0.55 [39]. In this study, we adopted m as 0.004 and n as 0.986 based on previous results [33].
Finally, emissivity-corrected LST was calculated by using Equation (3) as follows:
LST = T b / 1 + ( λ   × T b ρ ) ln   ε
where Tb is the at-satellite brightness temperature in degrees Kelvin; λ is the central band wavelength of emitted radiance (11.5 μm for Band 6 and 10.8 μm for Band 10 [40]); ρ is h × c/σ (1.438 × 10⁻² m K) with σ being the Boltzmann constant (1.38 × 10⁻²³ J/K), h is Planck’s constant (6.626 × 10⁻³⁴ J·s), and c is the velocity of light (2.998 × 10⁸ m/s) [6]; and ε is the land surface emissivity estimated using Equation (3). Then, the calculated LST values (Kelvin) were converted to degrees Celsius (°C).

2.5. Urban-Rural Gradient Analysis

Several steps have been taken for the formation of urban-rural zones (URZ) from the city center to the rural area [41]. A set of polygon grids with the same snapped with LST map were created, and the dimensions of each grid were 210 m × 210 m [41,42]. The mean center of the CBD conceded as the center grid, and its value was 0; 70 zones were designed from the centroid grid to cover the whole study area.

2.5.1. The Fraction of LULC and Urban-Rural Zone

The fraction ratio of LULC in each zone was computed to assess the effect of the composition of LULC on LST variation. In this process, fraction ratios of IS, GS1, GS2, and BL were computed. The urban and rural boundary was demarcated based on the fraction ratio of IS from the city center if the composition of IS fraction is less than 10 (<10%) when compared to the zone designated as rural area [41]. This method was introduced by Estoque and Murayama in 2017 [41]. Various studies have shown that this method generated reliable results [43].

2.5.2. LST Intensity

LST variation among the gradient zone is determined as the LST intensity (LSTI), or it can be expressed as the inter-zone temperature difference [41,43,44]. In this study, the mean LST of each LULC type in each gradient zone was determined by following the methodology explained in Section 2.5. Mean LST of the IS, GS1, GS2, and BL in each gradient zone was calculated, except for the water class. The reason for this exclusion is that it does not represent the study area well (Table 1); hence, there will not be a significant influence on the result due to this exclusion.

2.5.3. The Magnitude of the LSTI

Relative mean LST and fraction ratios of IS, GS1, GS2, and BL were subtracted with URZ1, and the method was applied for all zones (URZ1–URZ2, URZ1–URZ3, and URZ1–URZ…n(70)). This methodology was proposed by Estoque and Murayama in 2017 [41]; Ranagalage et al. obtained reliable results with this method in 2018 [43]. The method illustrates changes in the magnitude of mean LST and magnitude of the fraction ratios of IS, GS1, GS2, and BL when compared with the URZ1 along the urban-rural gradient.

2.6. LST Profile

Multidirectional and multitemporal LST profiles were computed by following the orthogonal and diagonal directions. First, LST values were extracted to a set of grids, with the dimensions of 210 m × 210 m, by following the orthogonal direction to cover the north-south and east-west direction. Second, LST values of the northeast-southwest and northwest-southeast direction were also extracted along the diagonal by following the same grid [41]. Finally, four profiles were made in eight directions.
All the derived values were used to prepare various kinds of graphs and statistical analyses to visualize the results and assess the statistical significance.

2.7. Population Data

This study used 100 m × 100 m continuous spatial population data (2006) provided by the Geo-data Institute of the University of Southampton, UK [45]. However, this source could not provide continuous data to cover the study period. Hence, Ethiopia’s total population and urban population data were used as a proxy indicator to visualize the population growth pattern (world population prospects 2017 by UN) [46]. Some studies have adopted this population density data approach effectively [47,48,49]. The population or population density does not directly affect the LST variation or its intensity, but overpopulation can enhance some attributes of LST including the expansion of built-up area [6]. In additional to that, some spaces are required for settlements, industrial zones, and infrastructure to cater to the urban community. These improvements are directly influenced by the changes in landscape structure. By considering these facts, population data were incorporated.

3. Results

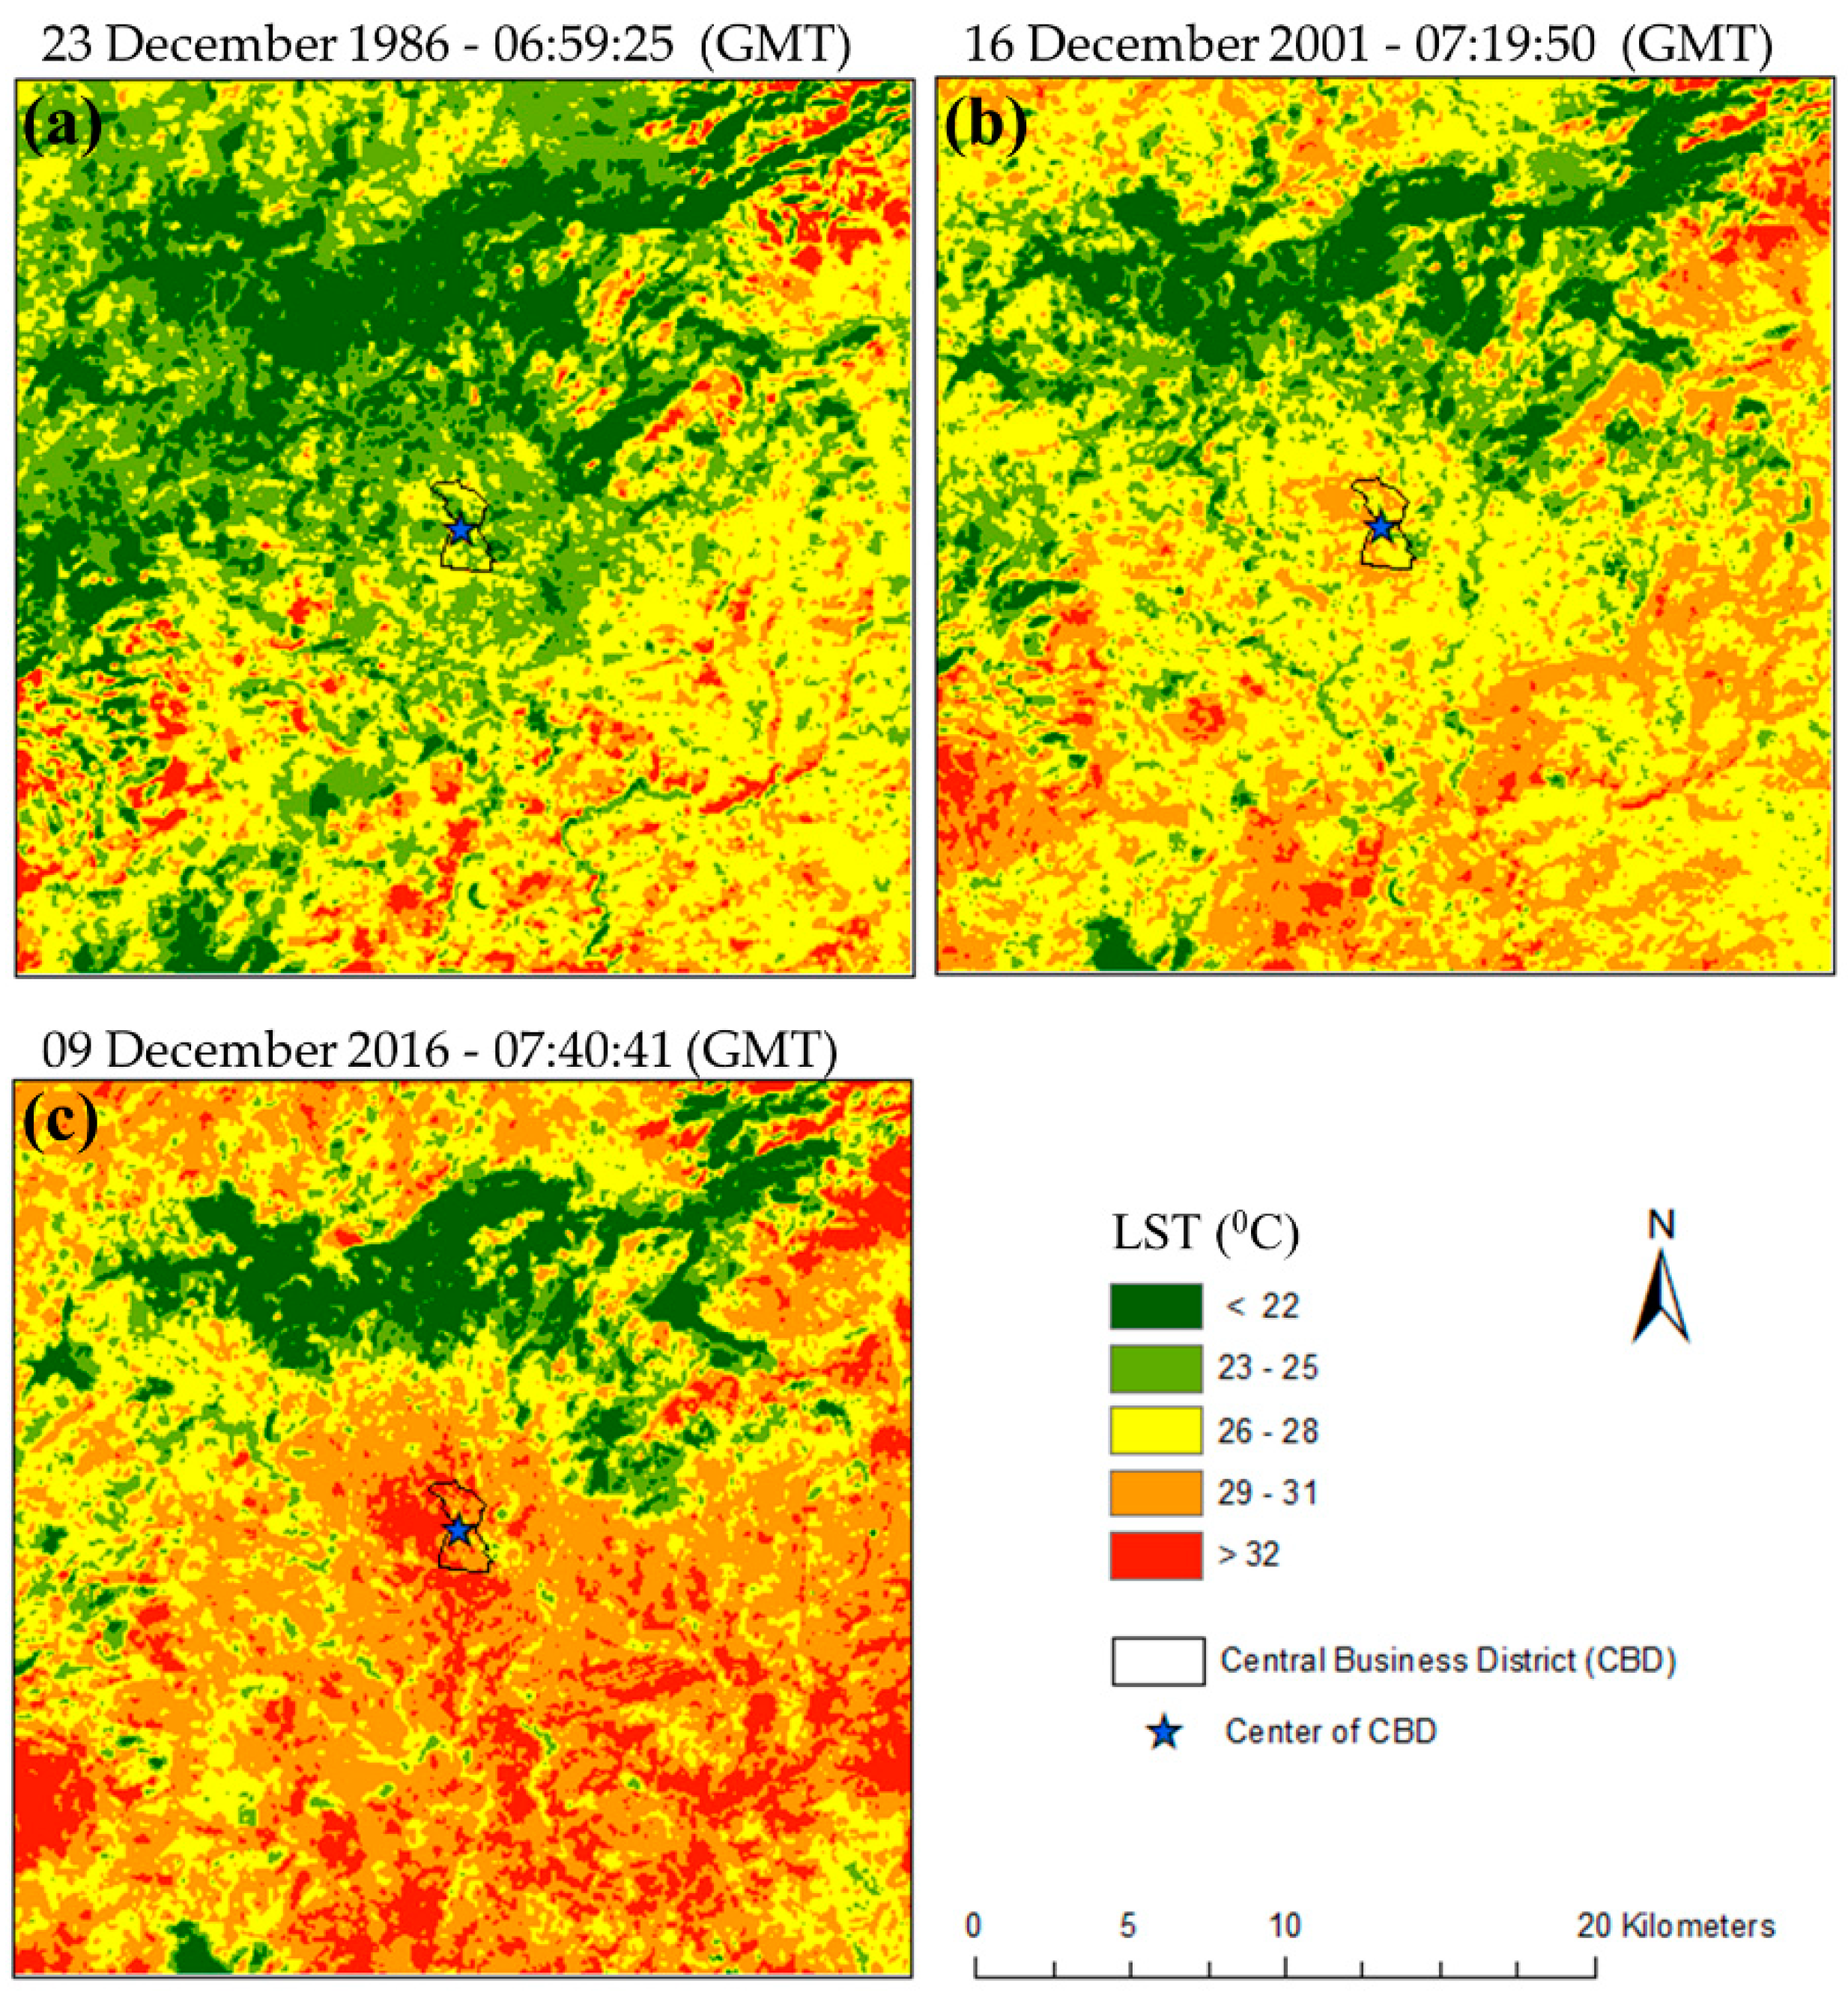
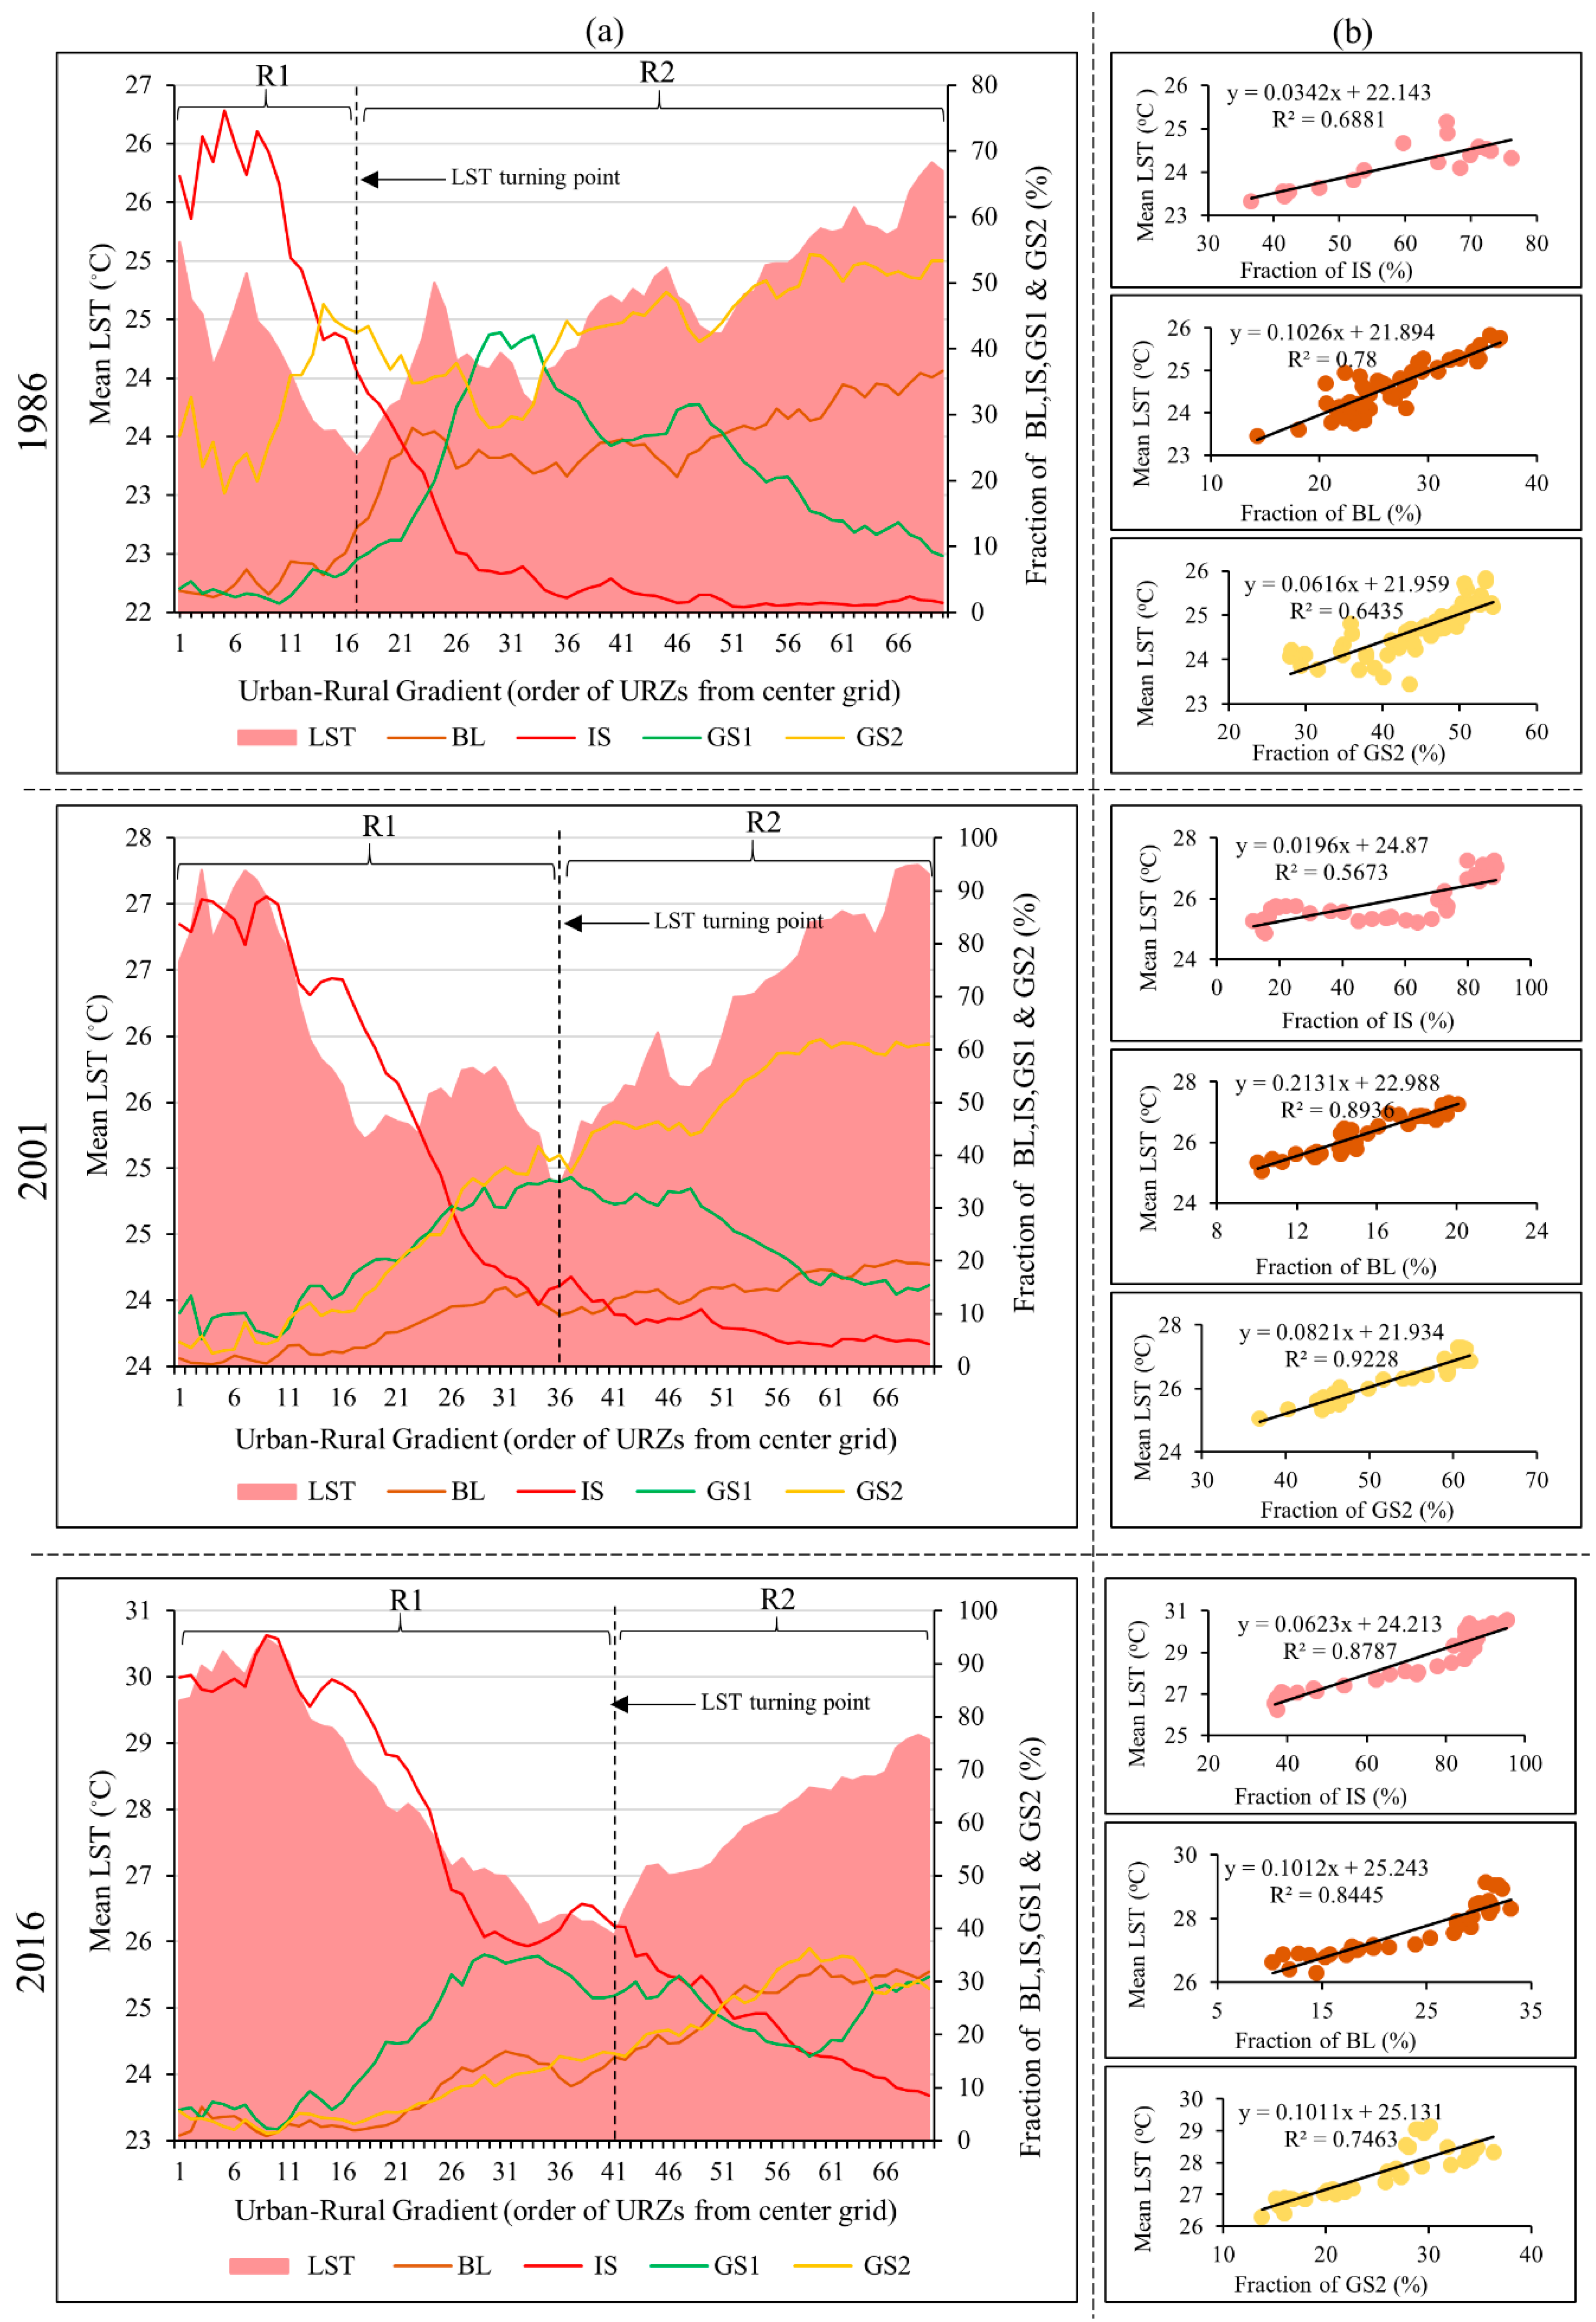
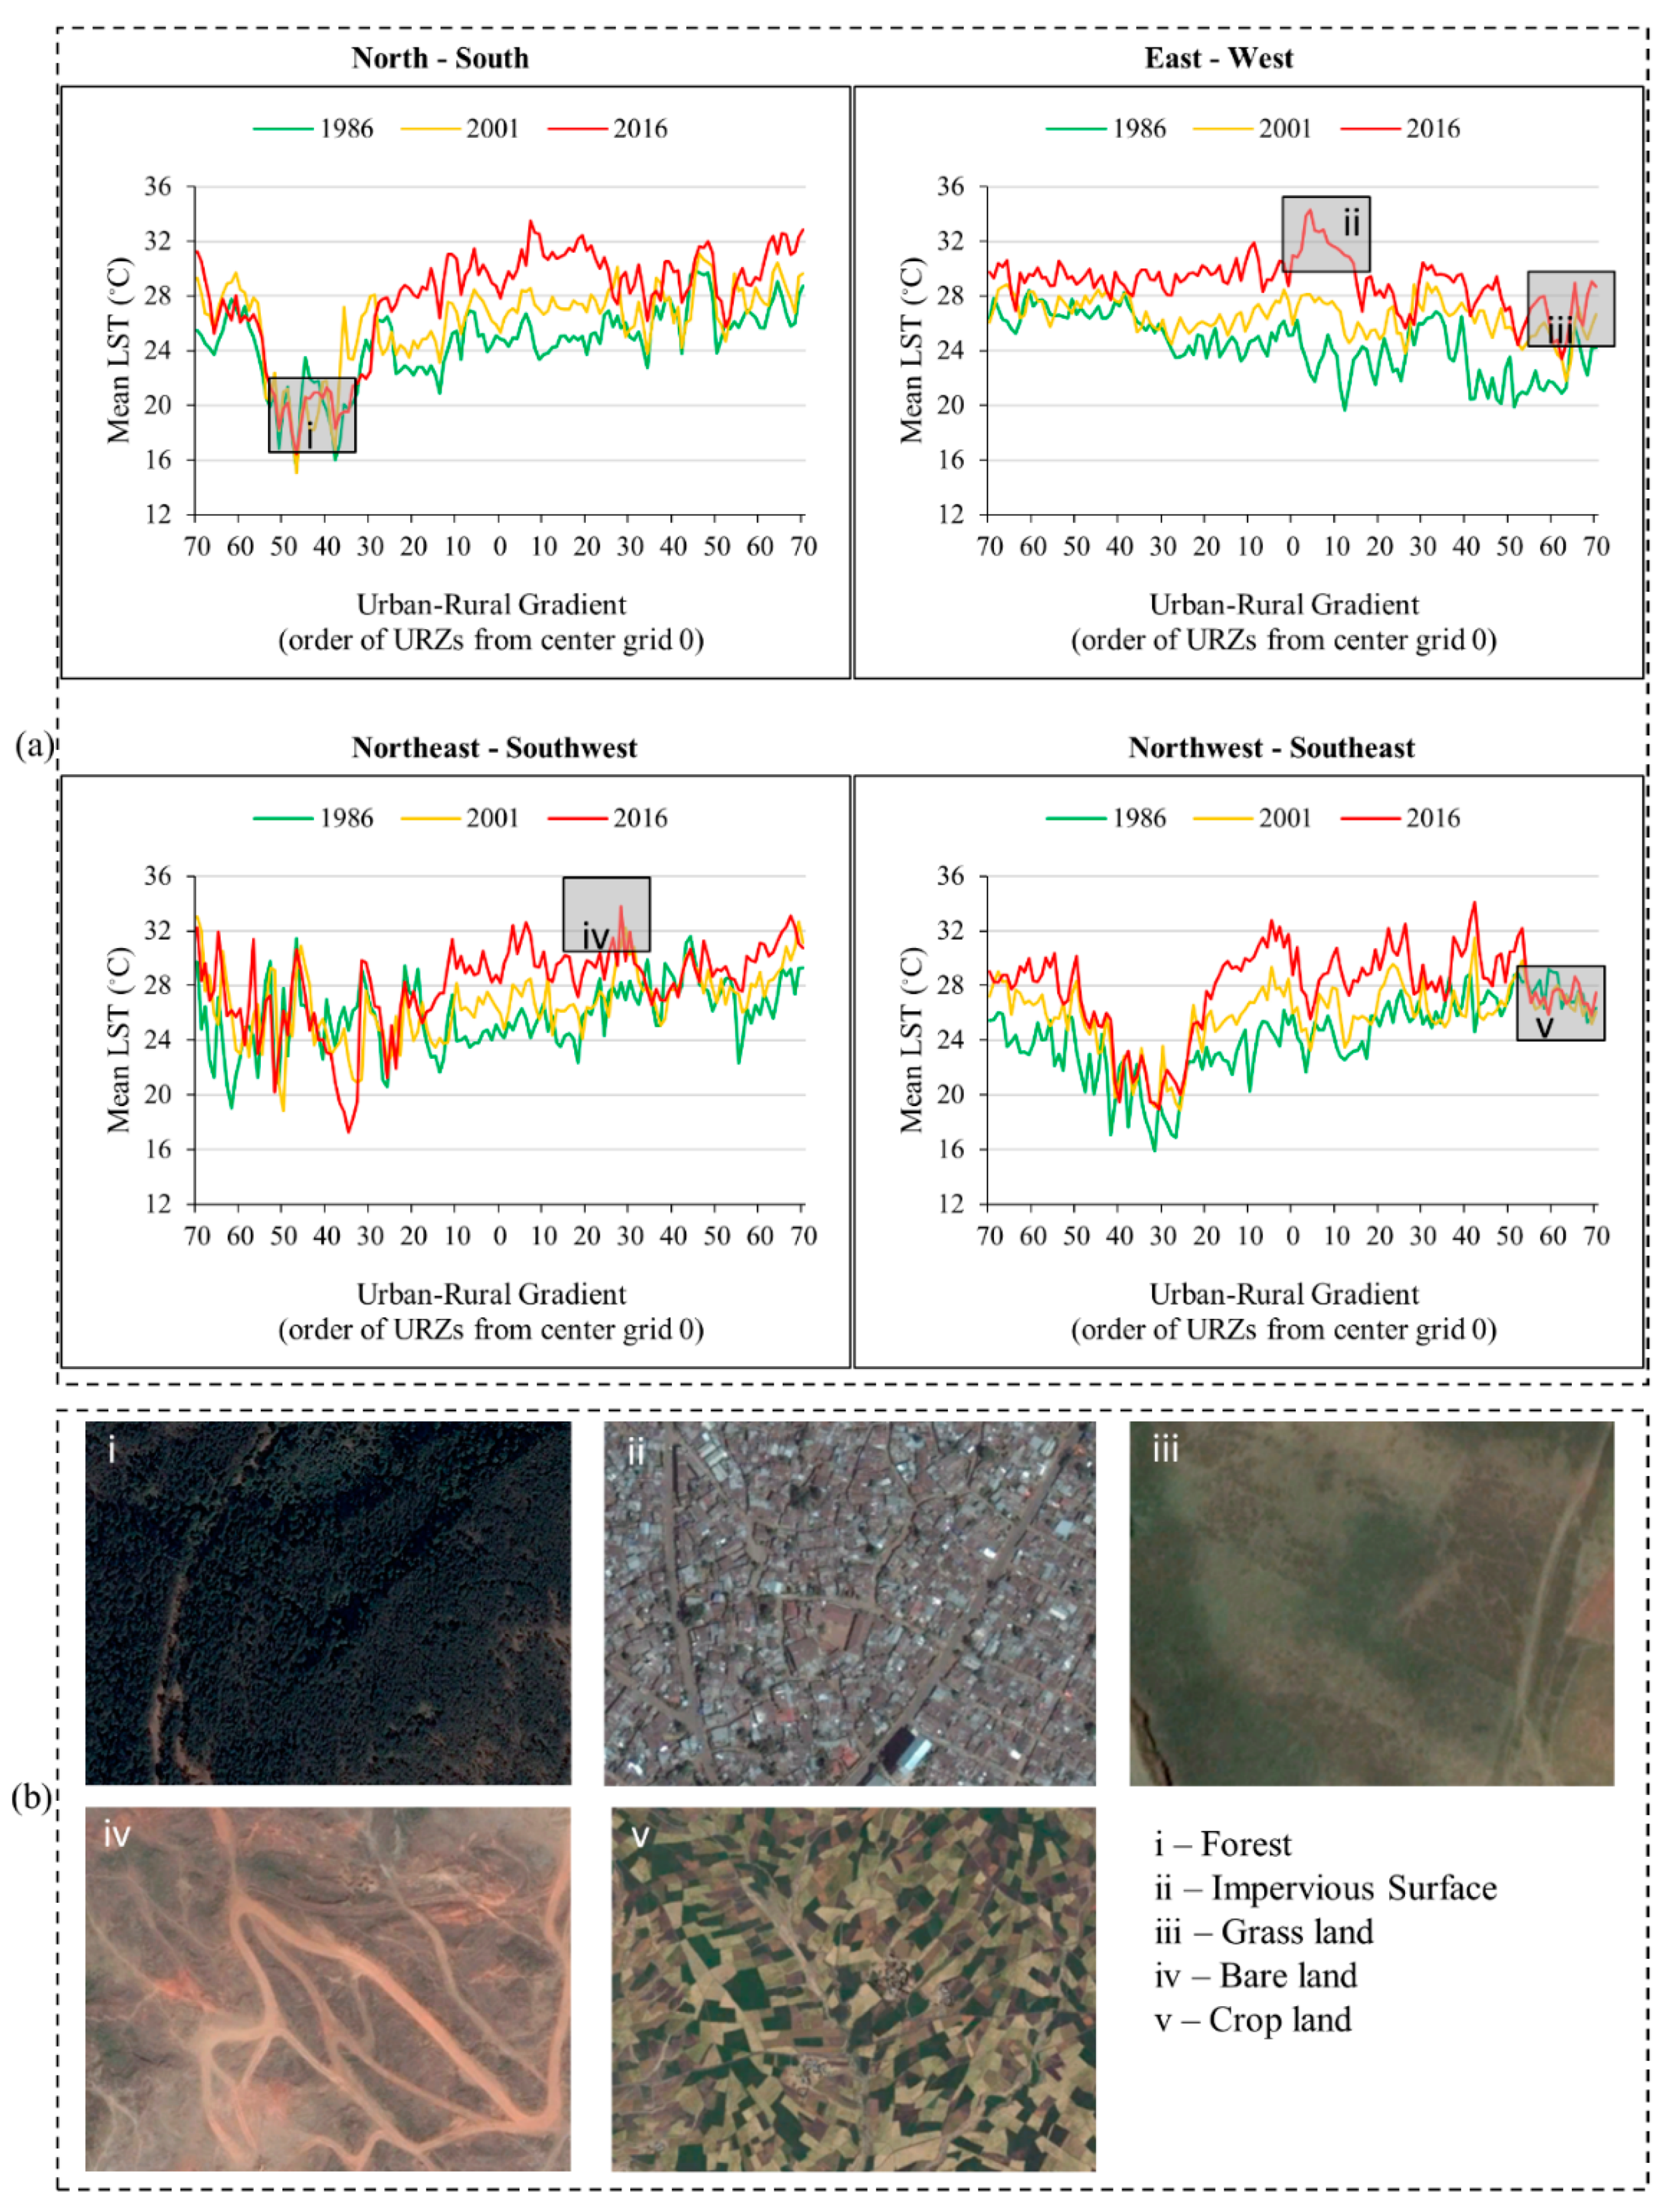
3.1. The Spatiotemporal Distribution Pattern of the LST

The spatial distribution pattern of the LST of Addis Ababa is shown in Figure 2. On 23 December 1986, the LST ranged from 10.8–35.4 °C, with an average of 24.8 °C. It ranged from 11.2–37.4 °C, and the average was 26.2 °C on 16 December 2001. On 9 December 2016, it ranged from 14.6–38.8 °C, and the average was 27.9 °C. A significant LST distribution pattern can be observed both in the southern and eastern parts of the study area. However, an improvement can be seen in the high LST area in the northern part in 2006 (Figure 2b) compared to 1986, and it matured in 2016, as shown by Figure 2c.

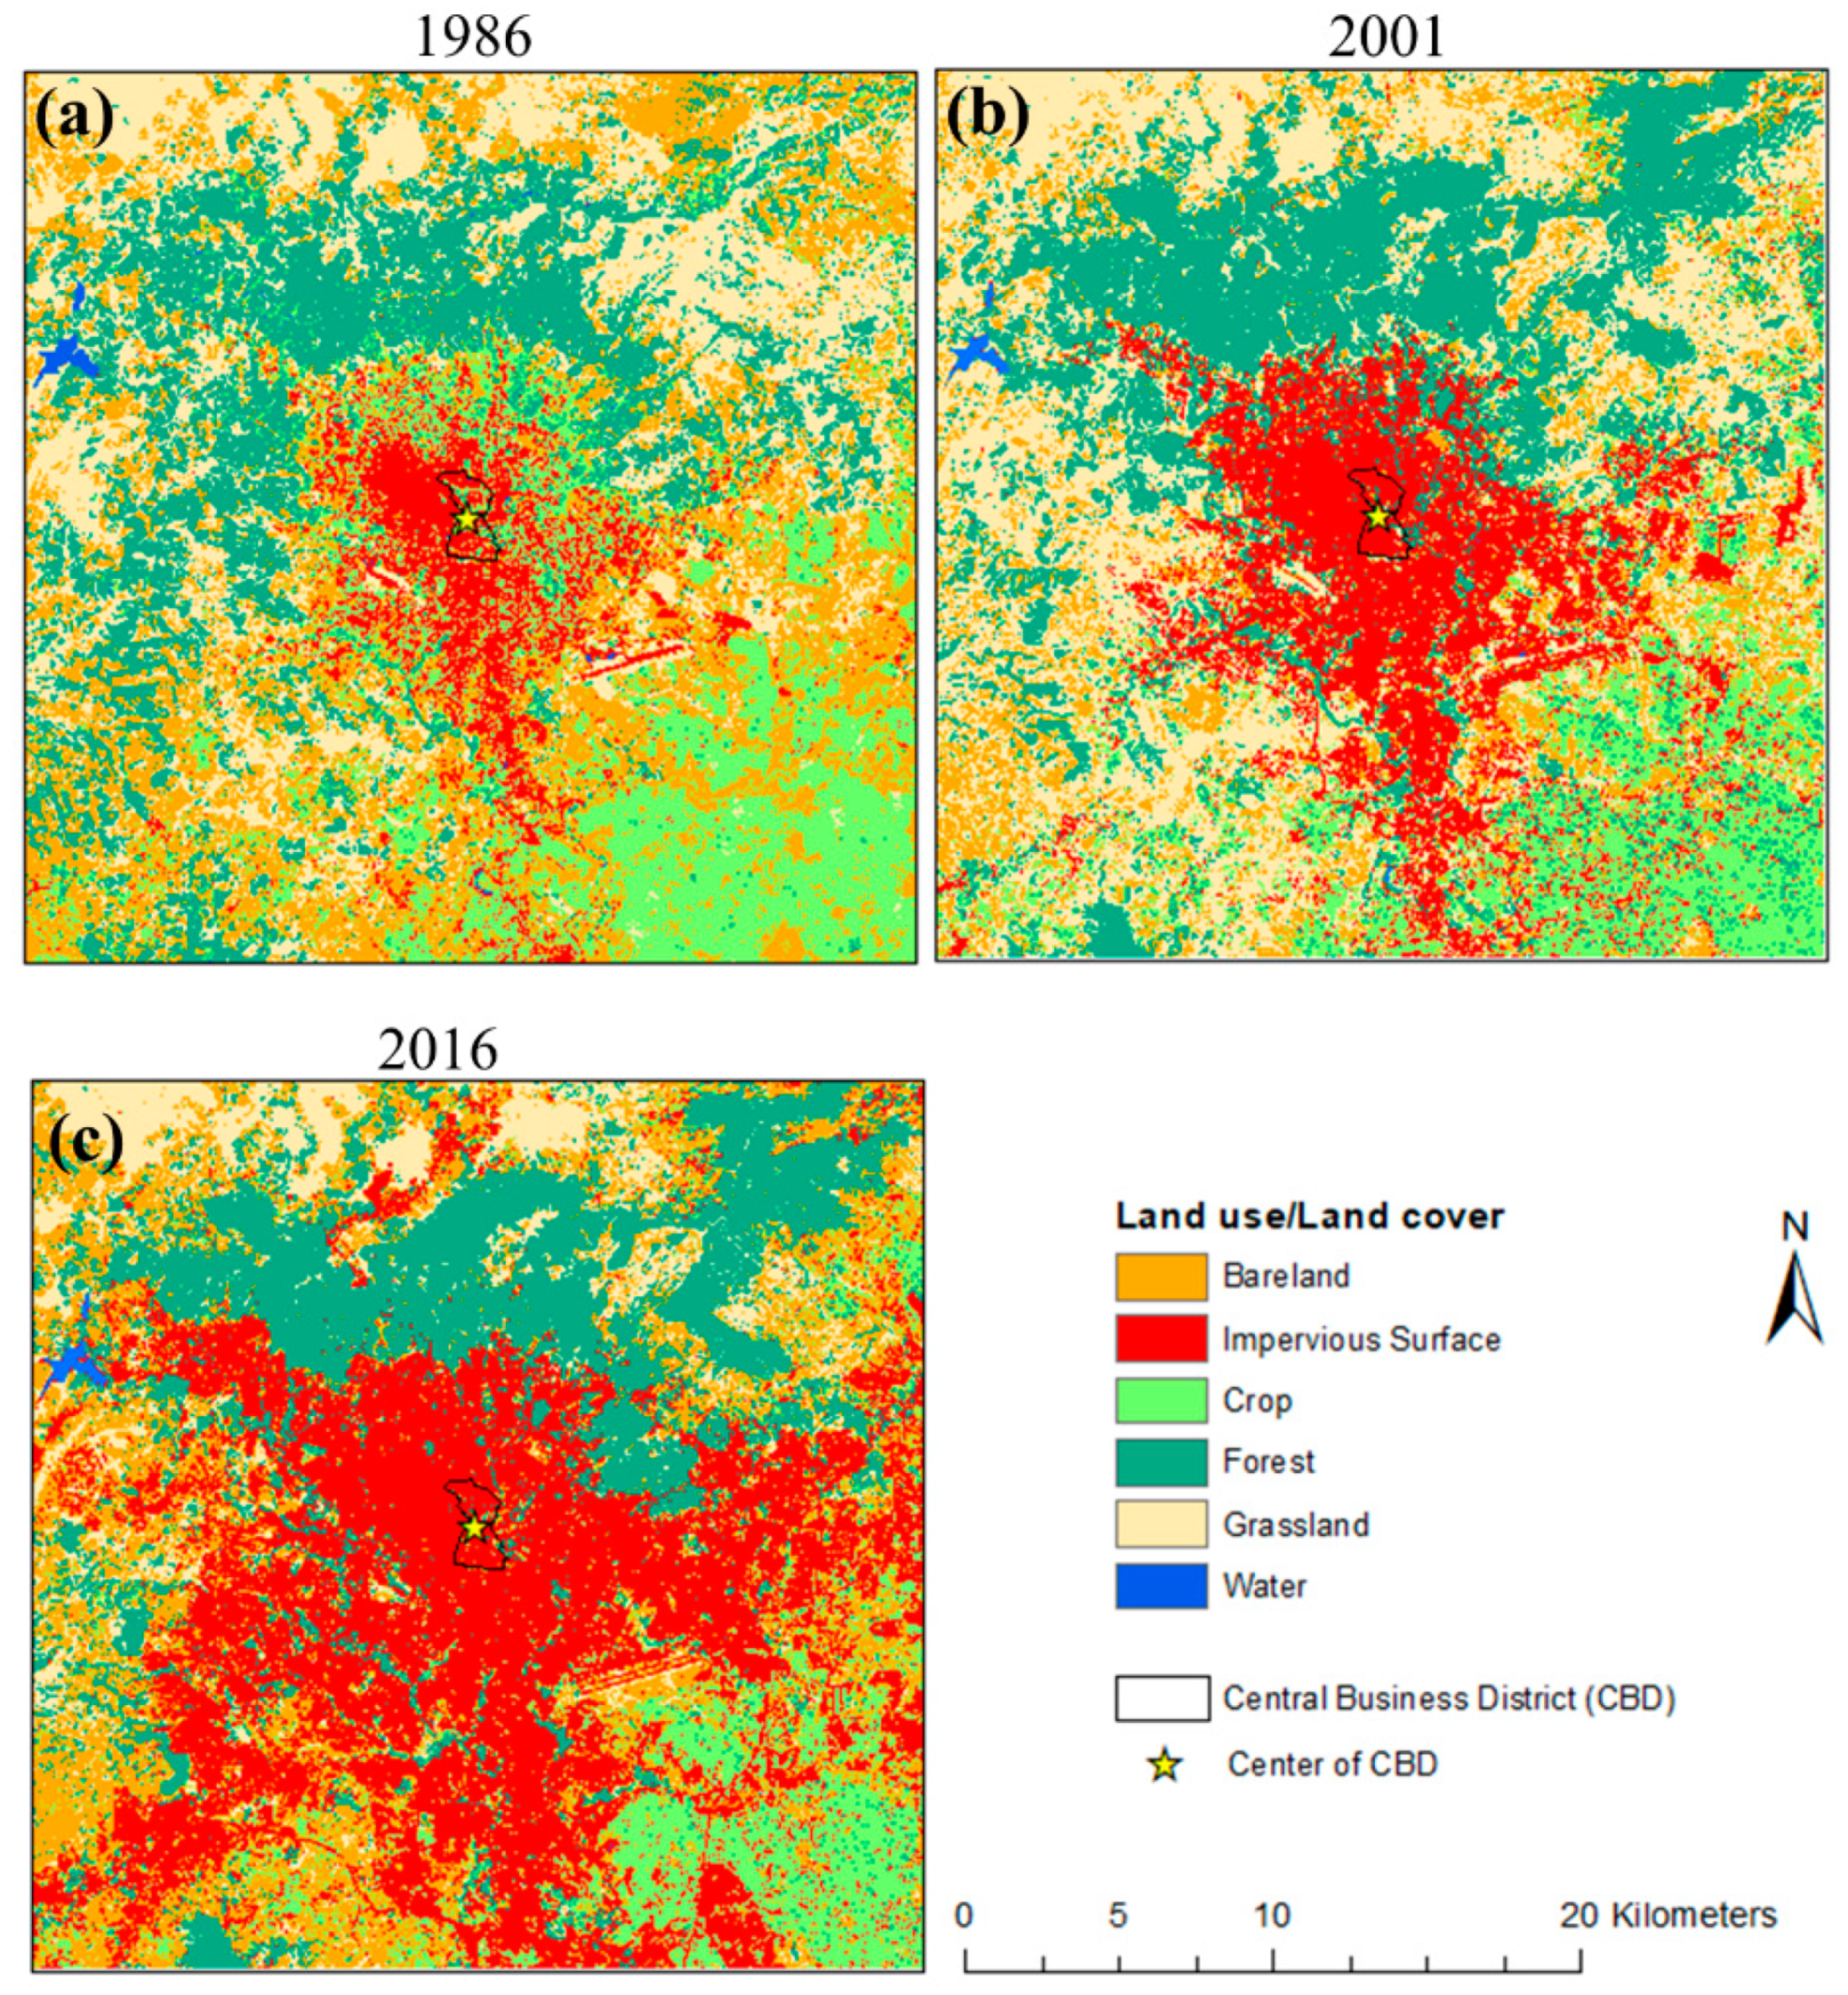
3.2. Landscape Pattern and Its Changes

The classification was performed by following the methodology explained in Section 2.3. To determine the accuracy of the LULC classification, 970 training samples (40% of the total) were selected to cover the six LULC types, and Google Earth image was used as reference data for accuracy assessment. The overall accuracy of the classified LULC was 91%, 89%, and 90% in 1986, 2001, and 2016, respectively. Further, the kappa statistic was 0.88 in 1986, 0.87 in 2001, and 0.88 in 2016. This method is commonly used in similar studies and details of which can be found elsewhere [43,50,51].
The results of the LULC classification (Figure 3) shows that rapid urbanization has taken place over the past 30 years. It can be observed that IS has dramatically increased from 6262 ha to 30,700 ha, contributing to 34.1% of the total area in 2016 (Table 2). The annual growth rate of IS was 11 ha−1 year−1 (1986–2016). Croplands and grasslands declined and registered a total net loss of 5982 ha and 13,493 ha, over the study period. The results of the LULC classification show that forest area remains only over the mountain region (Entoto mountain). Significant efforts have been made in the past decade through forest plantation [52] to make the green environment in the central mountain region.

3.3. The Composition of the LULC and Expansion of IS

Spatial and temporal variations of the composition of IS, GS1, GS2, BL and variation of the LST distribution pattern along the URZs are shown in Figure 4. The figure clearly illustrates the pattern of the expansion of IS and urban-rural demarcation boundary. As explained in Section 2.5.1, the urban area was demarcated based on the fraction ratio of the IS. URZ26 in 1986, URZ43 in 2001, and URZ69 in 2016 are the first zones with IS < 10% that are observed as rural areas, as shown in Figure 4.

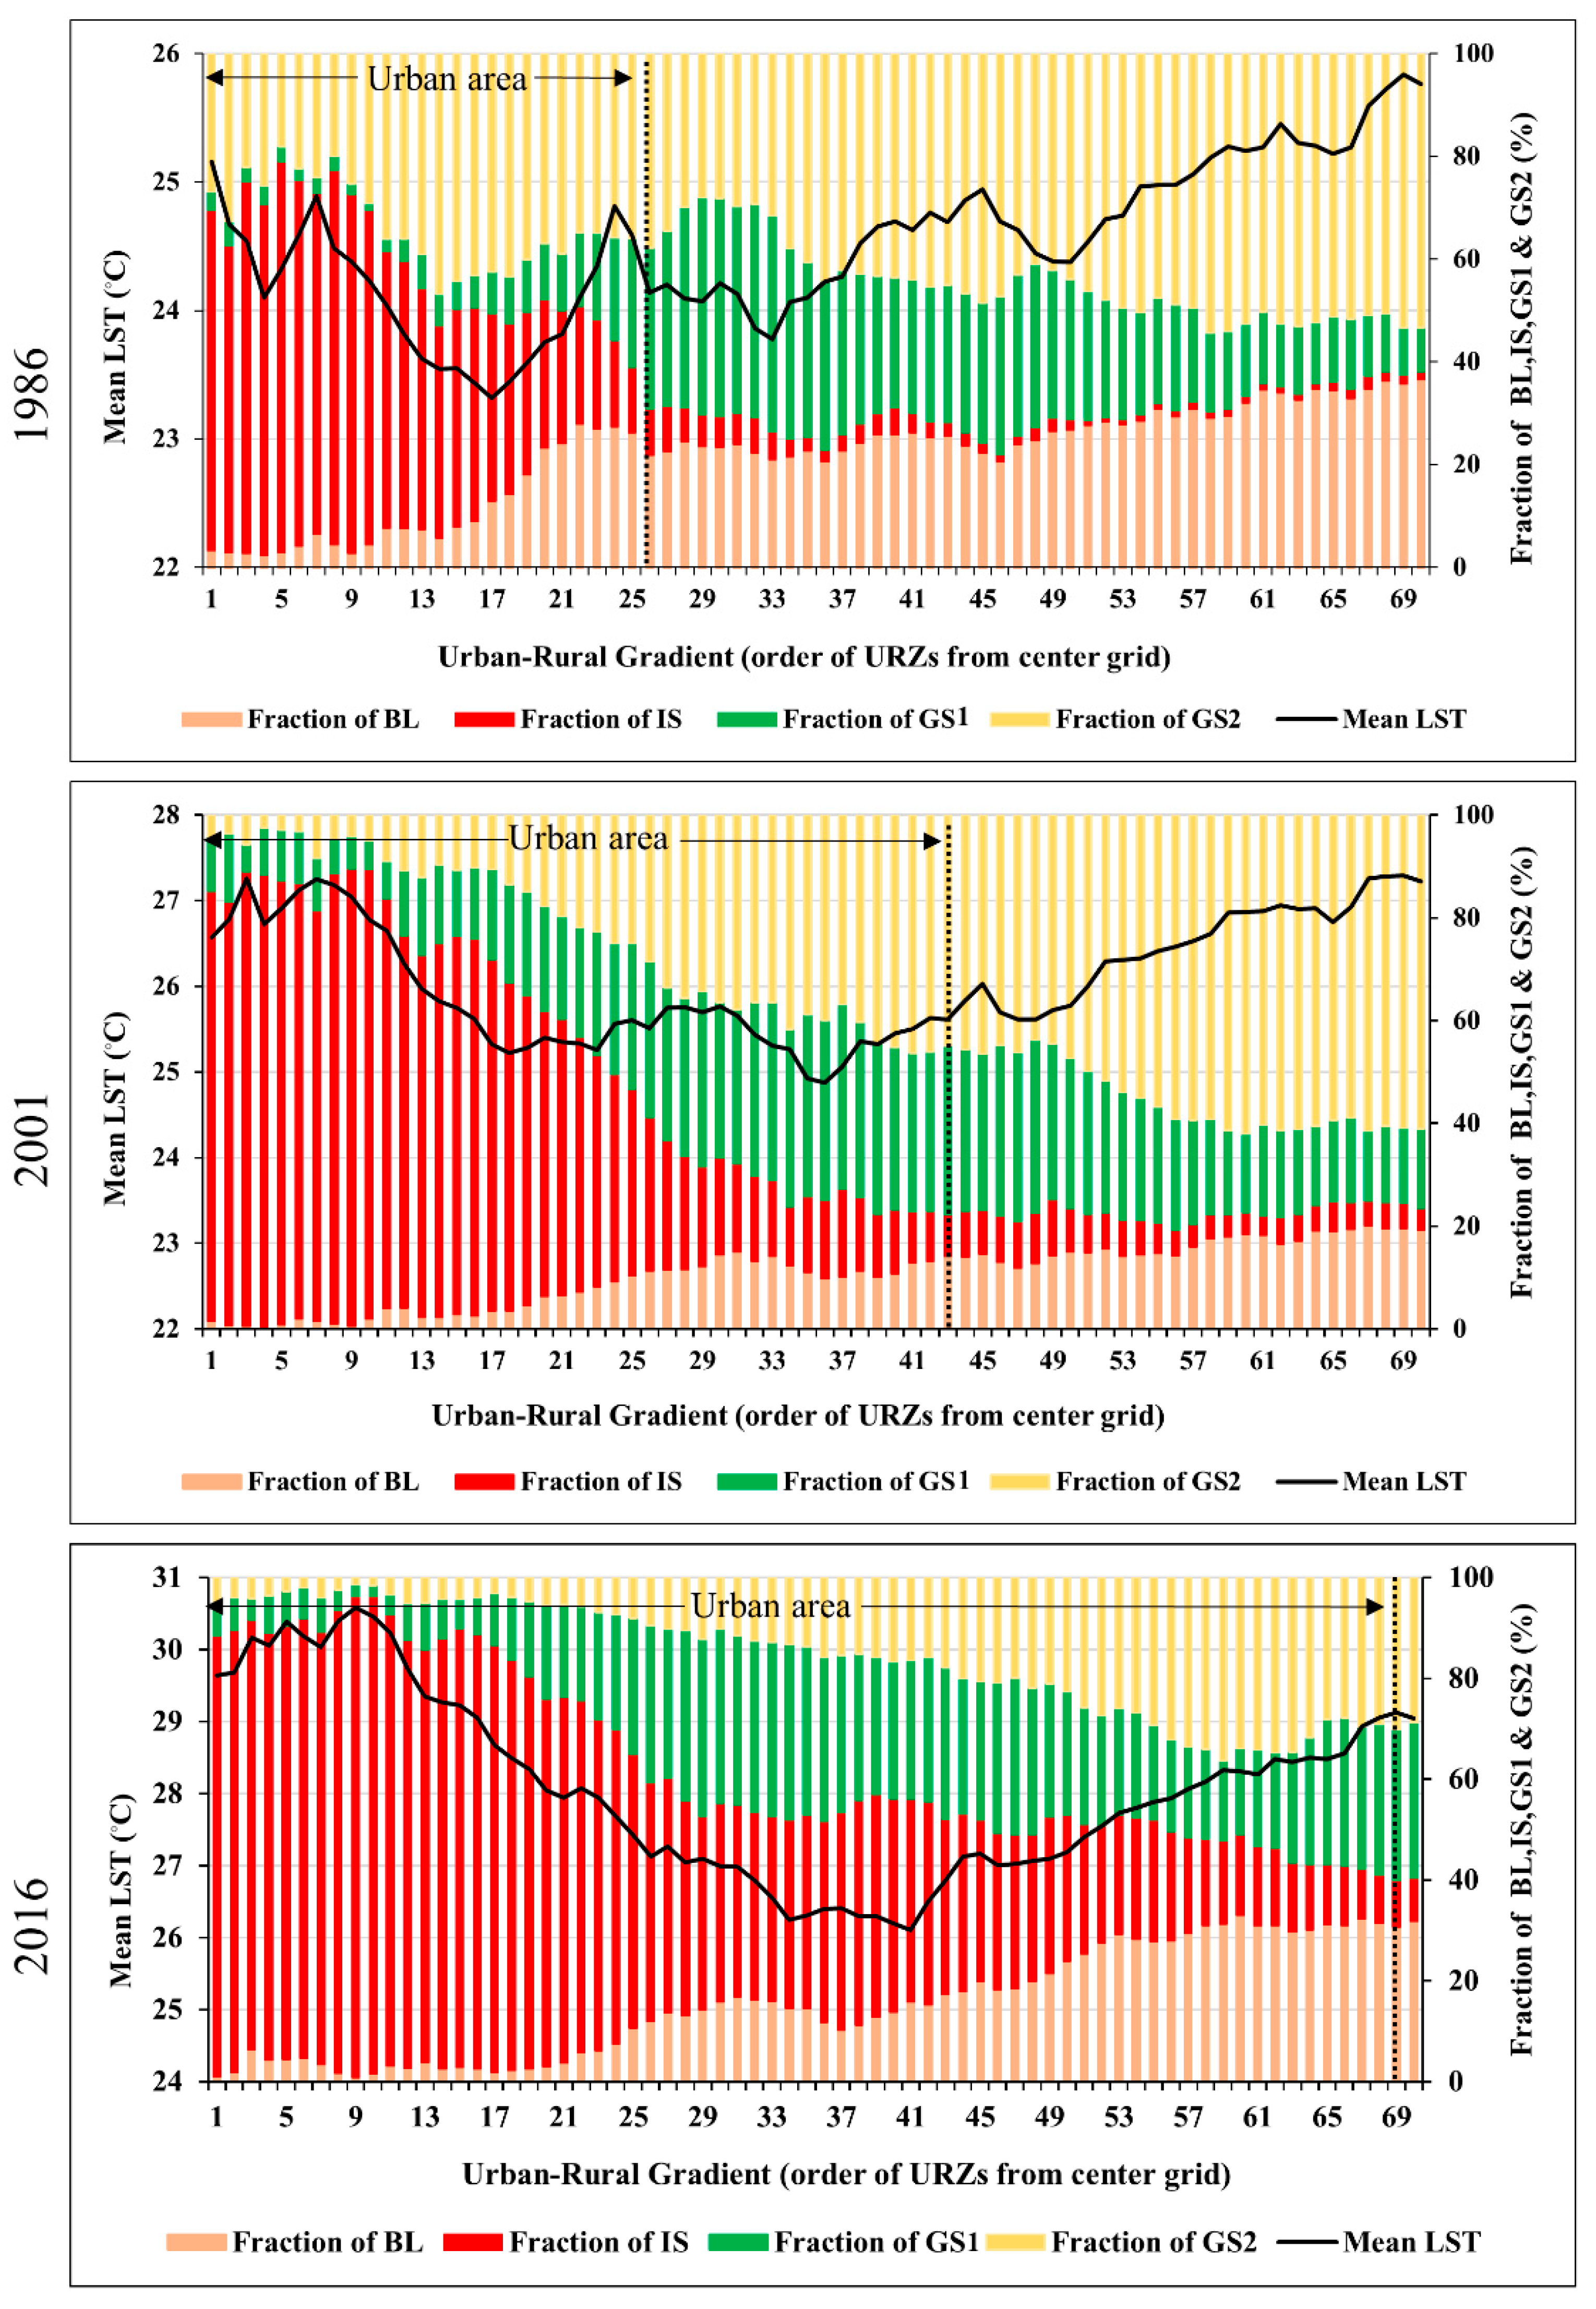
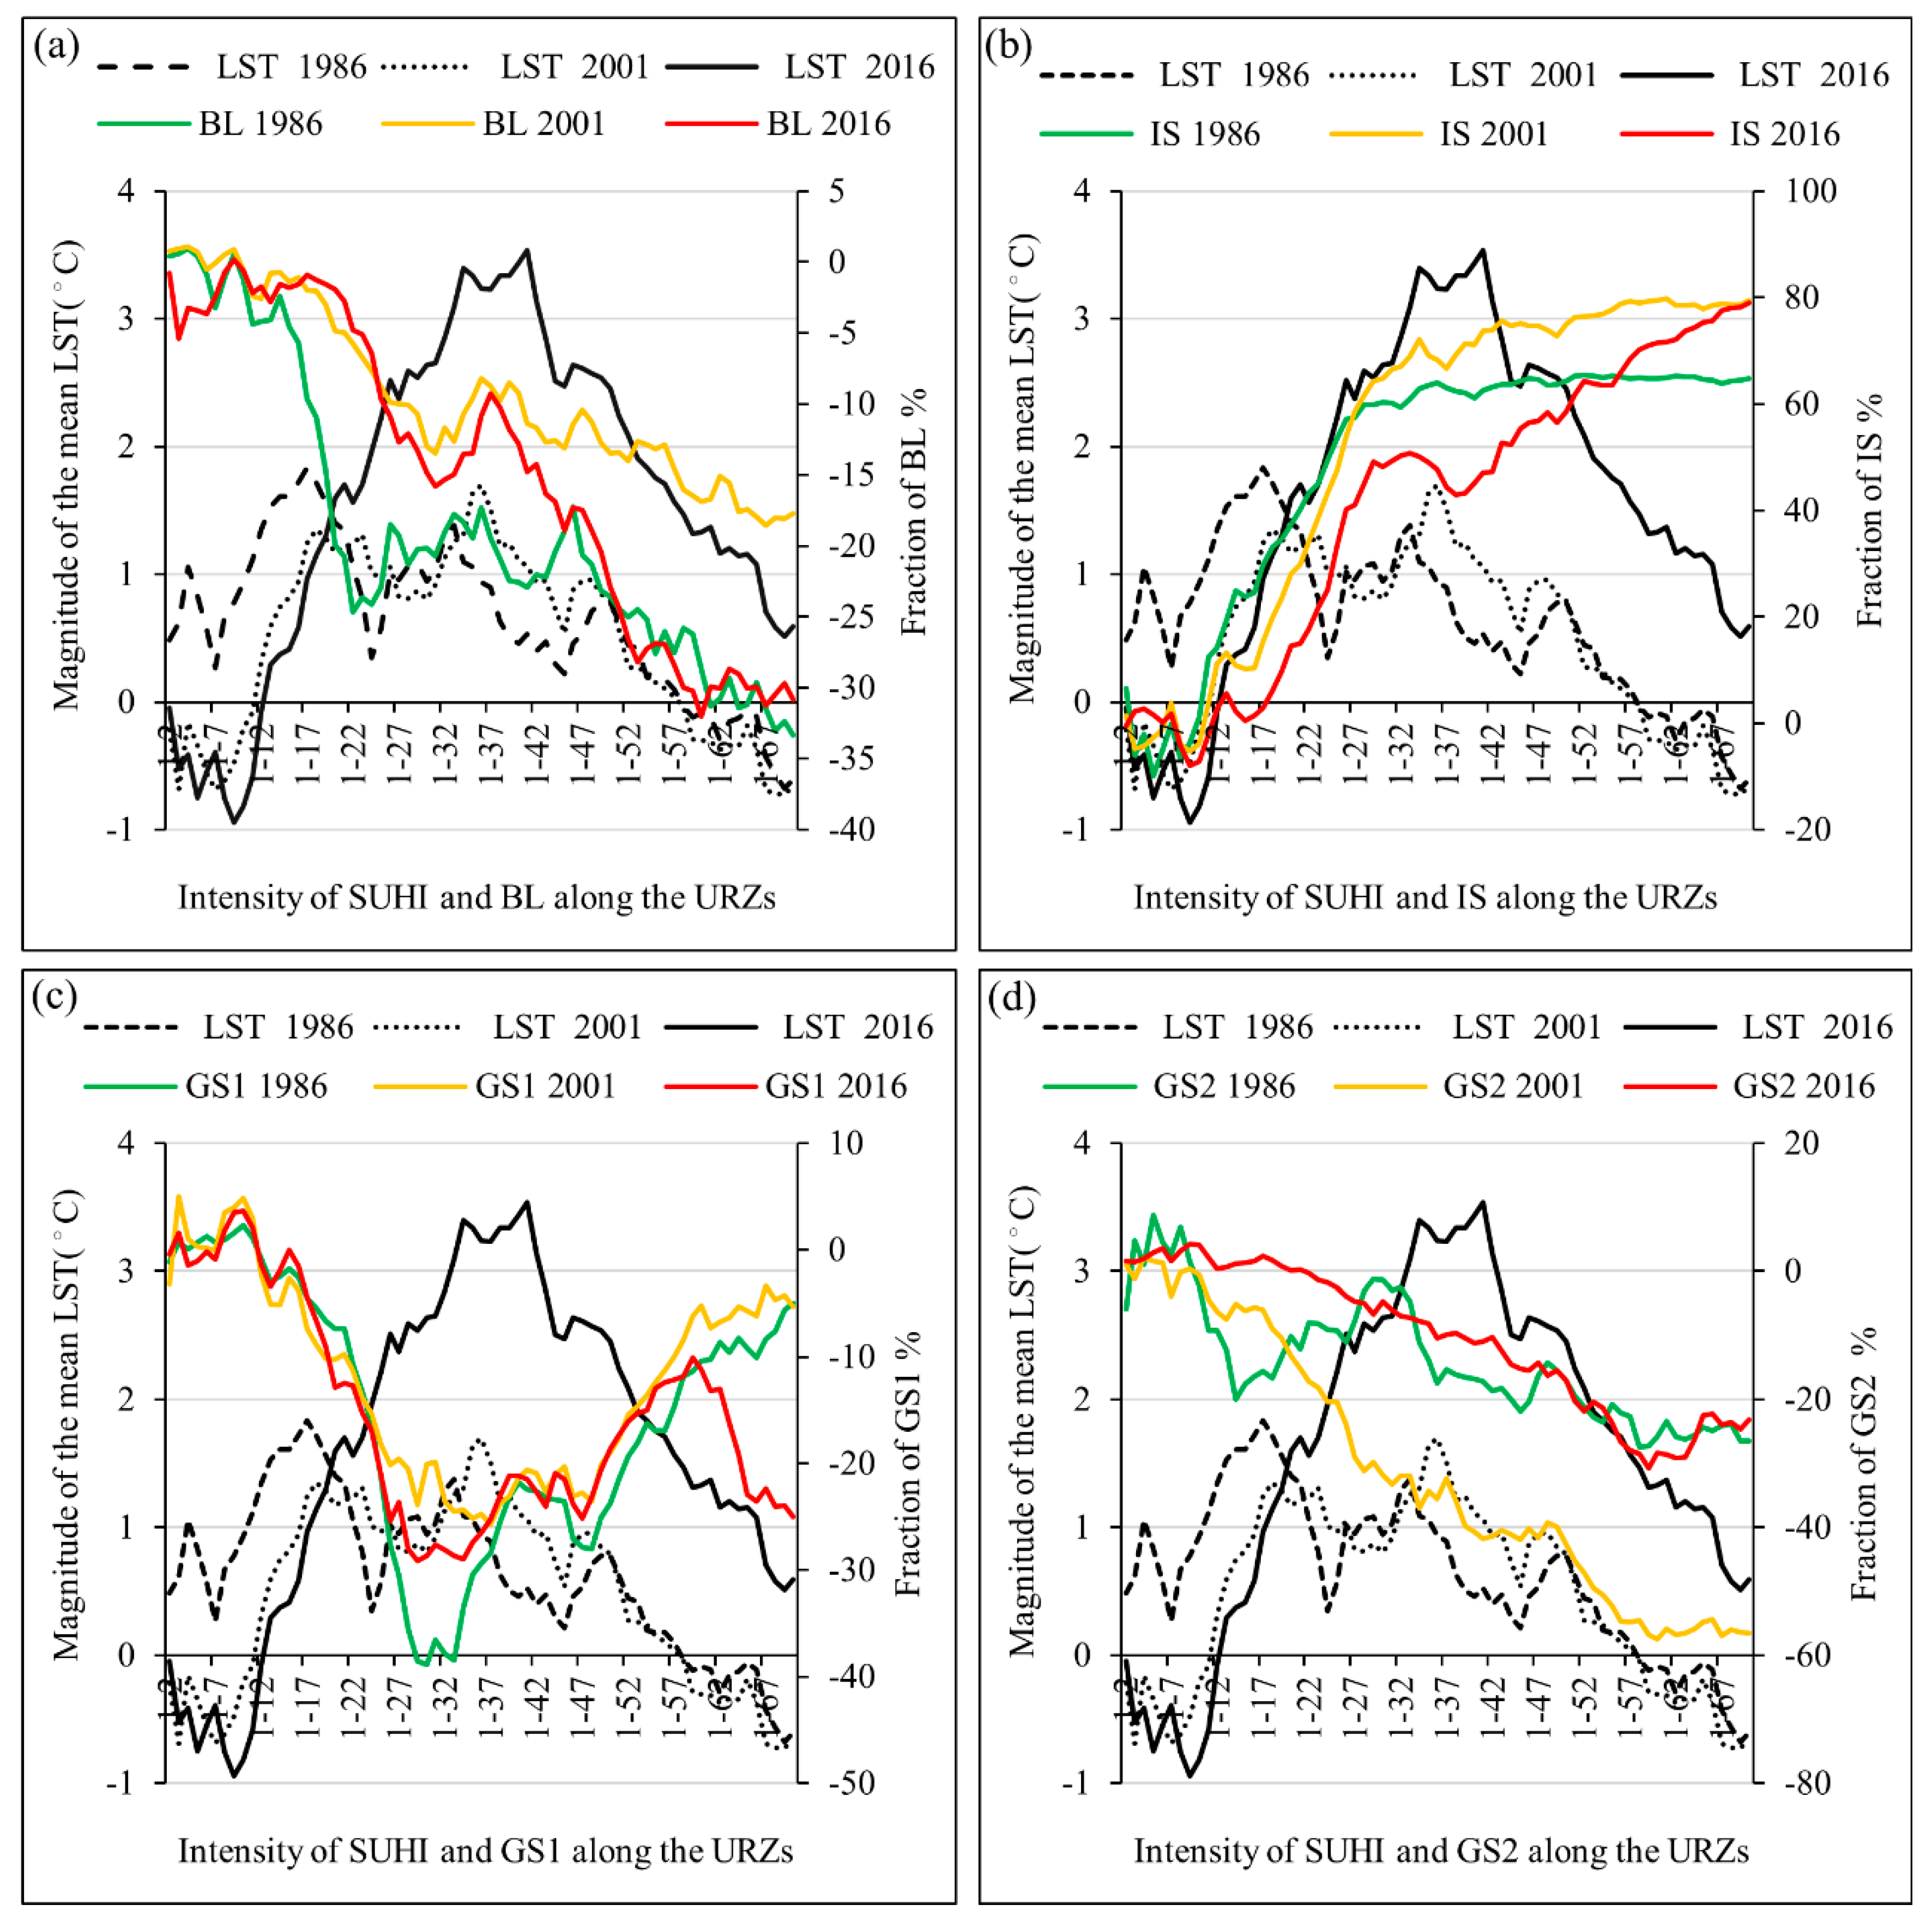
3.4. LST Behavior Pattern

The fraction ratio of IS has gradually declined when moving away from the city center to the rural area along the URZs, while contrasting the fraction ratio of BL. GS2 fraction has gradually increased along the URZs except in 1986, but the irregular pattern could be observed for the fraction ratio of GS1 throughout the study period.
In general, the behavior of the LST in an urban area declines to move away from the city center to the rural area [41,43], but this pattern cannot be observed in Addis Ababa. It is declining from the city center to some extent and shows an increasing trend moving to the suburban and rural area. This is a significant observation in understanding the power that landscape structure affects the LST variation. By observing this pattern, mean LST turning point has been determined, as shown in Figure 5a. To this end, the lowest value of LST in each year was considered: 23.3 °C, 24.9 °C, and 26.5 °C in 1986, 2001, and 2016, respectively. The zone that ranges from the center grid to the LST turning point is designated as “Region 1” (R1), and the area spread away from the LST turning poin toward the rural area is designated as “Region 2” (R2), as shown in Figure 5a. In 1986, the R1 extended from URZ1 to URZ17, and R2 ranged from URZ18 to URZ70. In 2001, the first 36 zones (URZ36) belonged to R1, and the rest of the zones (URZ37–70) belonged to R2. The R1 in 2016 extended from URZ1 to URZ41 and R2 included RUZ42–70. The linear regression analysis plotted based on all 70 URZs in the three-time points shows a significant (p < 0.001) positive relationship between mean LST and fraction ratios of IS, BL, and GS2. The statistical data on the composition of the LULC is provided in Table 3. It is worthy to note that the major fraction of the R1 is IS over the three-time points and that R2 has largely been dominated by GS2, except in 2016.
The magnitude of the mean LST with BL, IS, GS1, and GS2 along the URZs is shown in Figure 6. Any positive values of the mean LST or fraction ratio of BL, IS, GS1, and GS2 in any zone mean that the magnitude of the corresponding zone is less than that of the previous one (Z1–Z2 > 0). On the other hand, it shows a declining trend along the URZ. Any negative values of the mean LST or fraction ratio of IS, BL, GS1, and GS2 represent the opposite scenario (Z1–Z2 < 0). It is observed that the magnitude of the mean LST in a rural area is higher than in the urban area. The magnitudes of the BL (Figure 6a) and GS2 (Figure 6d) gradually incline from the city center to the rural area, while the magnitude of IS declines (as shown as Figure 6b); moreover, the magnitude of the GS1 shows a pattern opposing that of the LST: It is low where the magnitude of IS is high, as shown in Figure 6c.
Multidirectional and multitemporal profiles of the LST in Figure 7 show the cross-sectional outline of surface temperature described in Section 2.6. The reason could be that the fraction ratio of IS was weak in 1986 because of a lower degree of urbanization (Table 2), but it matured in 2016, as shown by the increase in IS fraction. Mean LST has declined in the area where natural forest is located (the North and Northwest direction), especially in the central mountain area. Figure 5b shows the types of LULC and their respective geographical locations overlaid onto the multidirectional and multi-temporal LST profile following chronological order.

4. Discussion

4.1. Urbanization and Changes in the LULC Structure

Addis Ababa is the capital city of the Federal Democratic Republic of Ethiopia, an essential administrative and economic hub not only for Ethiopia but also for the whole of Africa [53]. It has made impressive socioeconomic progress in the past three decades. According to the official statistics, the gross domestic product (GDP) was 10.9 while per capita income was USD 691 for the past one-and-a-half decades [53]. Employment opportunities and infrastructure development have encouraged people to live in the urban area or close to the urban area, as result of which the population of Addis Ababa is rapidly increasing, and it will continue in the future following the same increasing pattern (Figure 8). Rural–urban migration has also been a significant influence on the growth of the urban population [32]. Both total population and urban population show an increasing trend from 1980–2024, as depicted in Figure 8a. Proportion to the total population, the urban population, was 11.6% in 1986, 14.92% in 2001, and 19.86% in 2016. However, Ethiopia’s Data Ecosystem annual report published by UNDP shows that 25% of the Ethiopians live in Addis Ababa [54]. Hence, it can be realized that the proxy data have mirrored the pattern of the urban population in Addis Ababa.
In Addis Ababa, the population has nearly doubled every decade; it was 1.4 million in 1984 and 2.6 million in 1994. It will be 12 million in 2024 as predicted by UN-Habitat [4]. However, population or its density is not directly influenced by the LST variation or its intensity, but overpopulation can enhance some attributes of LST, such as the expansion of IS [6]. Additional space is required for settlements, industrial zones, and infrastructure to cater to the urban community. Consequences of this scenario are the expansion of the urban area by acquiring space from other LULC. Our analysis shows that the IS area has expanded. In 2016, it comprised 34.1% (30,700 ha) of the total land (Table 2), but in 1986, it was only 6262.3 ha, which is 7% of the total land. The growth rate of the IS fraction was 11 ha−1 year−1 from 1986 to 2016. The urban area with an IS fraction greater than 10% (IS > 10%) was expanded to 5.46 km (URZ26), 9.03 km (URZ43), and 14.49 km (URZ69) in 1986, 2001, and 2016, respectively. In other words, this indicates a diminishing rural area. The expanded IS fraction has directly resulted in a decrease in cropland and grassland (GS2) as illustrated by Table 2: A decline from 31.4% to 18.8% and 6.2% in 1986, 2006 and 2016, respectively at the rate of −4.2 ha−1 year−1. These results demonstrate that urban expansion has an influence not only on the urban landscape but also on the suburban landscape.

4.2. The Relationship between LST and LULC Composition

Behavior pattern of the LST in Addis Ababa over the study period is in contrast to those of other cities as explained in Section 3.4. Two separate regions (R1 and R2) were identified (Figure 5a). It can be observed that R1 has shifted toward the periphery or rural area, with a distance of 3.57 km (URZ17), 7.56 km (URZ37), and 8.61 km (URZ41) in 1986, 2001, and 2016, respectively. The relative mean LST of these three zones were reported to be 23.3 °C in 1986, 25.1 °C in 2001, and 26.9 °C in 2016. The changes could be the result of urbanization as depicted in Figure 4. The IS fraction in R1 has dominated more than half of the land in all three-time points as illustrated in Table 3, and the IS fraction positively correlated with the mean LST with high R2 values (0.68 in 1986, 0.56 in 2001, and 0.87 in 2016), as shown in Figure 5a. However, the fraction of IS in R2 is less than that in R1, but it can also be observed that mean LST has increased in R2 (Figure 5a). If so, the mean LST behavior pattern of R2 is debatable and causal factors should be explored further. Our analysis shows that the fraction of BL (bare land) and GS2 (cropland and grassland) together dominate nearly 50% of the total land. In 1986, it was 70.5% (26.8% from BL and 43.7% from GS2), in 2001 it was 68.3% (15.4% from BL and 52.9% from GS2), and in 2016 it was 49.1% (24% from BL and 25.1% from GS2). Scatter plots confirm their significant (p < 0.001) positive correlation with LST, as illustrated by Figure 5b. Hence, it can be realized that BL and GS2 are the factors that influence LST in suburban and rural areas.
Addis Ababa as a sub-Saharan city shows the signs of desert attributes including bare land/bare soil. Economic and Social Council of the United Nations stated in 2007 that “Seventy percent of Ethiopia is reported to be prone to desertification” [55]. Non-vegetated land can be directly exposed to the sun, and the results could be more solar radiation back to the atmosphere, called “heat back to the atmosphere” [43]. Nevertheless, GS2 represents grassland and cropland, but we observed that it does not look like as green as that of healthy vegetation. We have selected dry season Landsat images for the LULC classification, as explained in Section 2.2 and Table 1. In the dry season, grassland and cropland can be seen as off-green or open land because of the low chlorophyll content, as shown by Figure 7b. The LST profile can be further visualized by displaying the cross-section characteristics of the landscape structure in the rural area. Figure 7b, Grassland (Figure 7b(iii)), bare land (Figure 7b(iv)) and cropland (Figure 7b(v)) where located rural areas show high LST value compared to the forest (Figure 7b(i)). The LST profiles depict the power of BL and GS2 in influencing the enhancement of magnitude of LST in rural areas.

4.3. The Implication of the Results for Urban Sustainability

The negative effect of the LSTI resulted not only in the expansion of IS but also in losing green cover. The vegetated urban fraction can regulate the effect of LSTI by providing shade to the land and accelerate higher albedo through evapotranspiration to generate a cool island against the heat island [41,56], as shown by Figure 7b. This study also identified lower LST areas that have covers with natural forest: As an example, the Entoto mountain area and the green parks located in the heart of the city center close to the National Palace. Furthermore, the rapid decrease in the LST profile along the north, northeast, and northwest (Figure 7a) provides evidence for the ability of vegetated land to maintain a lower level of LST. The results are consistent with past research findings [13]. Uncomforted air which resulted in LST will be a cause for the increase of energy demand for making comfort indoor air using an air conditioner or related equipment both day and night [6,43]. Heat-related illnesses can affect the city dwellers [6,14]. Losing the green fraction may result in food security and ecosystem services of the urban area.
To overcome these obstacles, appropriate measures need to be taken as indicated by our results, which are not only consistent with past research also but are also sustainable oriented [41,57]. In the viewpoint of sustainability of Addis Ababa, an environmentally friendly, socially acceptable, and economically accountable land administration process is compulsory. Past research has shown that green walls can mitigate indoor temperatures in tropical countries by 2.4 °C [58]. Addis Ababa—as a city in a tropical country—will be able to apply these concepts to generate low indoor temperatures and increase the green zone in the urban area. Additionally, green belts along the transportation line and green parks in residential areas will result in a cool island and encourage the natural air regulation process to make a comfortable living environment. From this perspective, the plan should be green-oriented aligning with “goal 11” of sustainable development [59]. Vertical, rather than horizontal, urban development is a space-preserving technique [60] that can be applied to Addis Ababa also.

5. Conclusions

This study has examined the influence of landscape structure on the spatiotemporal variation in the LST along the urban-rural gradient as a geospatial application by using the Landsat data from 1986–2016 with fifteen-years intervals in Addis Ababa, Ethiopia. We have adopted the relative variation in LST rather than the absolute value to understand the influence of landscape structure for the variation of mean LST. It is noted that the urban area has expanded and LST has grown more intense with a substantial loss of green fraction. When IS fraction improved to 27% with an annual growth rate of 11.1 ha−1 year−1, the relative mean LST of URZ1 increased by 4.5 °C over the study period. The behavior pattern of the LST is specific to the city as we discussed by applying R1 and R2. Previous studies have shown that the phenomenon does not appear in the sub-Saharan region. It is a new trend of LST behavior in the urban area, especially in the sub-Saharan region. However, shifting the R1 region toward the peripheral area in parallel to urban shifting is designated that LST becomes stronger in the future.
Hence, future city planning should consider this scenario to overcome the effect of LST and its intensity. Our results prove that improving the green fraction as much as possible is one of the mitigation measures. Urban expansion should not violate the balance of the landscape structure. As shown by the statistical plots, bare land has made a significant influence on the improvement of LST in rural areas than other land use types. However, more studies are required to examine the mechanism for managing geographical and climatological attributes that occur in the sub-Saharan region. Indeed, the outcomes of this research indicate the dissimilarity in the LST results of the structure of the landscape. We conclude that the overall findings of this study can be used as a proxy indicator for the sustainability of Addis Ababa.

Author Contributions

The corresponding author, D.D., has proposed the topic and spearheaded the data processing and analysis, as well as the writing of the manuscript. T.M., Y.M., and M.R. helped in the design, research implementation and analysis, and writing of the manuscript.

Funding

This study was supported by the Japan Society for the Promotion of Science (JSPS) through Grant-in-Aid for Challenging Exploratory Research 16K12816 and Scientific Research (B) 18H00763.

Acknowledgments

The authors express their gratefulness to the anonymous reviewers for their valuable comments and suggestions.

Conflicts of Interest

The authors declare no conflict of interest.

References

  1. United Nations. The World’s Cities in 2018; United Nations, Department of Economic and Social Affairs, Population Division: New York, NY, USA, 2018. [Google Scholar]
  2. United Nations. World Urbanization Prospects: The 2014 Revision, Highlights; United Nations, Department of Economic and Social Affairs, Population Division: New York, NY, USA, 2015. [Google Scholar]
  3. United Nations. The Speed of Urbanization around the World; United Nations: New York, NY, USA, 2018; pp. 1–2. [Google Scholar]
  4. United Nations. Addis Ababa—Urban Profile; United Nations, Regional and Technical Cooperation Division, United Nations Human Settlements Programme (UN-HABITAT): New York, NY, USA, 2008. [Google Scholar]
  5. Guo, L.; Liu, R.; Men, C.; Wang, Q.; Miao, Y.; Zhang, Y. Quantifying and simulating landscape composition and pattern impacts on land surface temperature: A decadal study of the rapidly urbanizing city of Beijing, China. Sci. Total Environ. 2019, 654, 430–440. [Google Scholar] [CrossRef] [PubMed]
  6. Dissanayake, D.; Morimoto, T.; Murayama, Y.; Ranagalage, M.; Handayani, H.H. Impact of urban surface characteristics and socio-economic eariables on the spatial variation of land surface temperature in Lagos City, Nigeria. Sustainability 2019, 11, 25. [Google Scholar] [CrossRef]
  7. Feyissa, G.; Gebremariam, E. Mapping of landscape structure and forest cover change detection in the mountain chains around Addis Ababa: The case of Wechecha Mountain, Ethiopia. Remote Sens. Appl. Soc. Environ. 2018, 11, 254–264. [Google Scholar] [CrossRef]
  8. Staniec, M.; Nowak, H. The application of energy balance at the bare soil surface to predict annual soil temperature distribution. Energy Build. 2016, 127, 56–65. [Google Scholar] [CrossRef]
  9. Arsiso, B.K.; Mengistu Tsidu, G.; Stoffberg, G.H.; Tadesse, T. Influence of urbanization-driven land use/cover change on climate: The case of Addis Ababa, Ethiopia. Phys. Chem. Earth. 2018, 105, 212–223. [Google Scholar] [CrossRef]
  10. Munn, R.E. Descriptive Micrometeorology; Atmospheric Environment Service; Academic Press: Toronto, ON, Canada, 1966; p. 198. [Google Scholar]
  11. Oke, T.R. Boundary Layer Climates; Methuen and Co., Ltd.: London, UK, 1978; p. 372. [Google Scholar]
  12. Li, Z.-L.; Duan, S.-B. Land Surface Temperature. Compr. Remote Sens. 2018, 5, 264–283. [Google Scholar]
  13. Geremeskel, T.; Abera, M. The need for transformation: Local perception of climate change, vulnerability and adaptation versus ‘Humanitarian’ response in Afar Region, Ethiopia. In Climate Change Adaptation in Africa. Climate Change Management; Leal Filho, W., Belay, S., Kalangu, J., Menas, W., Munishi, P., Musiyiwa, K., Eds.; Springer: Cham, UK, 2017. [Google Scholar]
  14. IPCC. Climate Change 2013: The Physical Science Basis. Contribution of Working Group I (WGI) to the Fifth Assessment Report (AR5) of the Intergovernmental Panel on Climate Change (IPCC); Cambridge University Press: Cambridge, UK, 2013. [Google Scholar]
  15. World Health Organization. WHO Guidance to Protect Health from Climate Change through Health Adaptation Planning; WHO, Department of Public Health Environment and Social Determinants of Health: Geneva, Switzerland, 2014. [Google Scholar]
  16. Feyisa, G.L.; Dons, K.; Meilby, H. Efficiency of parks in mitigating urban heat island effect: An example from Addis Ababa. Landsc. Urban Plan. 2014, 123, 87–95. [Google Scholar] [CrossRef]
  17. Ranagalage, M.; Estoque, R.C.; Murayama, Y. An urban heat island study of the Colombo Metropolitan Area, Sri Lanka, Based on Landsat Data (1997–2017). Isprs Int. J. Geo-Inf. 2017, 6, 189. [Google Scholar] [CrossRef]
  18. Ranagalage, M.; Estoque, R.C.; Handayani, H.H.; Zhang, X.; Morimoto, T.; Tadono, T.; Murayama, Y. Relation between urban volume and land surface temperature: A comparative study of planned and traditional cities in Japan. Sustainability 2018, 10, 2366. [Google Scholar] [CrossRef]
  19. Zhou, X.; Wang, Y.C. Dynamics of land surface temperature in response to land-use/cover change. Geogr. Res. 2011, 49, 23–36. [Google Scholar] [CrossRef]
  20. Handayani, H.H.; Murayama, Y.; Ranagalage, M.; Liu, F.; Dissanayake, D. Geospatial analysis of horizontal and vertical urban expansion using multi-spatial resolution data: A case study of Surabaya, Indonesia. Remote Sens. 2018, 10, 25. [Google Scholar] [CrossRef]
  21. Zhao, H.; Zhang, H.; Miao, C.; Ye, X.; Min, M. Linking heat source–sink landscape patterns with analysis of urban heat islands: Study on the fast-growing Zhengzhou City in Central China. Remote Sens. 2018, 10, 1268. [Google Scholar] [CrossRef]
  22. Li, J.; Song, C.; Cao, L.; Zhu, F.; Meng, X.; Wu, J. Impacts of landscape structure on surface urban heat islands: A case study of Shanghai, China. Remote Sens. Environ. 2011, 115, 3249–3263. [Google Scholar] [CrossRef]
  23. Pal, S.; Ziaul, S. Detection of land use and land cover change and land surface temperature in English Bazar urban centre. Egypt. J. Remote Sens. Sp. Sci. 2017, 20, 125–145. [Google Scholar] [CrossRef] [Green Version]
  24. Tarawally, M.; Xu, W.; Hou, W.; Mushore, T.D. Comparative analysis of responses of land surface temperature to long-term land use/cover changes between a coastal and Inland City: A case of Freetown and Bo Town in Sierra Leone. Remote Sens. 2018, 10, 112. [Google Scholar] [CrossRef]
  25. Fitts, Y.; Comby, J.; Renard, F.; Hadjiosif, A.; Alonso, L. Evaluation of the effect of urban redevelopment on surface urban heat islands. Remote Sens. 2019, 11, 299. [Google Scholar]
  26. Gunaalan, K.; Ranagalage, M.; Gunarathna, M.; Kumari, M.; Vithanage, M.; Srivaratharasan, T.; Saravanan, S.; Warnasuriya, T.W.S. Application of geospatial techniques for groundwater quality and availability assessment: A case study in Jaffna Peninsula, Sri Lanka. Isprs Int. J. Geo-Inf. 2018, 7, 20. [Google Scholar] [CrossRef]
  27. Wijesundara, N.C.; Abeysingha, N.S.; Dissanayake, D.M. GIS-based soil loss estimation using RUSLE model: A case of Kirindi Oya river basin, Sri Lanka. Model. Earth Syst. Environ. 2018, 4, 251–262. [Google Scholar] [CrossRef]
  28. Demissie, F.; Yeshitila, K.; Kindu, M.; Schneider, T. Land use/land cover changes and their causes in Libokemkem District of South Gonder, Ethiopia. Remote Sens. Appl. Soc. Environ. 2017, 8, 224–230. [Google Scholar] [CrossRef]
  29. Kindu, M.; Schneider, T.; Teketay, D.; Knoke, T. Land use/land cover change analysis using object-based classification approach in Munessa-Shashemene landscape of the ethiopian highlands. Remote Sens. 2013, 5, 2411–2435. [Google Scholar] [CrossRef]
  30. Dissanayake, D.; Morimoto, T.; Ranagalage, M. Accessing the soil erosion rate based on RUSLE model for sustainable land use management: A case study of the Kotmale watershed, Sri Lanka. Model. Earth Syst. Environ. 2018, 5, 291–306. [Google Scholar] [CrossRef]
  31. Liu, Y.; Peng, J.; Wang, Y. Efficiency of landscape metrics characterizing urban land surface temperature. Landsc. Urban Plan. 2018, 180, 36–53. [Google Scholar] [CrossRef]
  32. Kifle Arsiso, B.; Mengistu Tsidu, G.; Stoffberg, G.H.; Tadesse, T. Climate change and population growth impacts on surface water supply and demand of Addis Ababa, Ethiopia. Clim. Risk Manag. 2017, 18, 21–33. [Google Scholar] [CrossRef]
  33. Wubneh, M. Addis Ababa, Ethiopia—Africa’s diplomatic capital. Cities 2013, 35, 255–269. [Google Scholar] [CrossRef]
  34. Abo-El-Wafa, H.; Yeshitela, K.; Pauleit, S. The use of urban spatial scenario design model as a strategic planning tool for Addis Ababa. Landsc. Urban Plan. 2018, 180, 308–318. [Google Scholar] [CrossRef]
  35. United States Geological Survey (USGS) Earth Explorer Home Page. Available online: https://earthexplorer.usgs.gov (accessed on 7 February 2019).
  36. United States Geological Survey (USGS) Landsat Missions: Landsat Science Products. Available online: https://www.usgs.gov/land-resources/nli/landsat/landsat-science-products (accessed on 7 February 2019).
  37. Ebabu, K.; Tsunekawa, A.; Haregeweyn, N.; Adgo, E.; Meshesha, D.T.; Aklog, D.; Masunaga, T.; Tsubo, M.; Sultan, D.; Fenta, A.A.; et al. Effects of land use and sustainable land management practices on runoff and soil loss in the Upper Blue Nile basin, Ethiopia. Sci. Total Environ. 2019, 648, 1462–1475. [Google Scholar] [CrossRef]
  38. Jin, B.; Ye, P.; Zhang, X.; Song, W.; Li, S. Object-Oriented method combined with deep convolutional neural networks for land-use-type classification of remote sensing images. J. Indian Soc. Remote Sens. 2019, 3, 1–15. [Google Scholar] [CrossRef]
  39. Sobrino, J.A.; Jiménez-Muñoz, J.C.; Paolini, L. Land surface temperature retrieval from LANDSAT TM 5. Remote Sens. Environ. 2004, 90, 434–440. [Google Scholar] [CrossRef]
  40. Weng, Q.; Lu, D.; Schubring, J. Estimation of land surface temperature-vegetation abundance relationship for urban heat island studies. Remote Sens. Environ. 2004, 89, 467–483. [Google Scholar] [CrossRef]
  41. Estoque, R.C.; Murayama, Y. Monitoring surface urban heat island formation in a tropical mountain city using Landsat data (1987–2015). Isprs J. Photogramm. Remote Sens. 2017, 133, 18–29. [Google Scholar] [CrossRef]
  42. Myint, S.W.; Brazel, A.; Okin, G.; Buyantuyev, A. Combined effects of impervious surface and vegetation cover on air temperature variations in a rapidly expanding Desert City. GIScience Remote Sens. 2010, 47, 301–320. [Google Scholar] [CrossRef]
  43. Ranagalage, M.; Dissanayake, D.; Murayama, Y.; Zhang, X.; Estoque, R.C.; Perera, E.; Morimoto, T. Quantifying surface urban heat island formation in the World Heritage Tropical Mountain City of Sri Lanka. Isprs Int. J. Geo-Inf. 2018, 7, 341. [Google Scholar] [CrossRef]
  44. Stehman, S.V. Sampling designs for accuracy assessment of land cover. Int. J. Remote Sens. 2009, 30, 5243–5272. [Google Scholar] [CrossRef]
  45. World Population Data Website. Available online: https://www.worldpop.org/geodata/summary?id=2880 (accessed on 7 February 2019).
  46. United Nations—Population Division. World Population Prospects 2017. Available online: https://population.un.org/wpp/ (accessed on 17 February 2019).
  47. Tatem, A.J. WorldPop, open data for spatial demography. Sci. Data 2017, 4, 2–5. [Google Scholar] [CrossRef] [PubMed]
  48. Wei, C.; Taubenböck, H.; Blaschke, T. Measuring urban agglomeration using a city-scale dasymetric population map: A study in the Pearl River Delta, China. Habitat Int. 2017, 59, 32–43. [Google Scholar] [CrossRef] [Green Version]
  49. Ye, T.; Zhao, N.; Yang, X.; Ouyang, Z.; Liu, X.; Chen, Q.; Hu, K.; Yue, W.; Qi, J.; Li, Z.; et al. Improved population mapping for China using remotely sensed and points-of-interest data within a random forests model. Sci. Total Environ. 2019, 658, 936–946. [Google Scholar] [CrossRef] [PubMed]
  50. Estoque, R.C.; Murayama, Y.; Akiyama, C.M. Pixel-based and object-based classifications using high- and medium-spatial-resolution imageries in the urban and suburban landscapes. Geocarto Int. 2015, 30, 1113–1129. [Google Scholar] [CrossRef]
  51. Ye, S.; Pontius, R.G.; Rakshit, R. A review of accuracy assessment for object-based image analysis: From per-pixel to per-polygon approaches. Isprs J. Photogramm. Remote Sens. 2018, 141, 137–147. [Google Scholar] [CrossRef]
  52. Bewket, W.; Abebe, S. Land-use and land-cover change and its environmental implications in a tropical highland watershed, Ethiopia. Int. J. Environ. Stud. 2013, 70, 126–139. [Google Scholar] [CrossRef]
  53. Melka, S.G. Ethiopia’s Data Ecosystem; United Nations, African Data Report: New York, NY, USA, 2016. [Google Scholar]
  54. World Bank Group. Addis Ababa, Ethiopia Enhancing Urban Resilience; World Bank Group: Washington, DC, USA, 2015. [Google Scholar]
  55. United Nation. Africa Review on Drought and Desertification; Economic and Social Council: New York, NY, USA, 2007. [Google Scholar]
  56. Manawadu, L.; Ranagalage, M. Urban Heat Islands and Vegetation Cover as a Controlling Factor. In Proceedings of the International Forestry and Environment Symposium 2013 of the Department of Forestry and Environmental Science, University of Sri Jayewardenepura, Thulhiriya, Sri Lanka, 10–11 January 2014; p. 125. [Google Scholar]
  57. Ranagalage, M.; Estoque, R.C.; Zhang, X.; Murayama, Y. Spatial changes of urban heat island formation in the Colombo District, Sri Lanka: Implications for sustainability planning. Sustainability 2018, 10, 1367. [Google Scholar] [CrossRef]
  58. Galagoda, R.U.; Jayasinghe, G.Y.; Halwatura, R.U.; Rupasinghe, H.T. The impact of urban green infrastructure as a sustainable approach towards tropical micro-climatic changes and human thermal comfort. Urban For. Urban Green. 2018, 34, 1–9. [Google Scholar] [CrossRef]
  59. United Nations. Transforming Our World: The 2030 Agenda for Sustainable Development; United Nations General Assembly: New York, NY, USA, 2015; Volume 16301, pp. 1–35. [Google Scholar]
  60. Lin, J.; Huang, B.; Chen, M.; Huang, Z. Modeling urban vertical growth using cellular automata-Guangzhou as a case study. Appl. Geogr. 2014, 53, 172–186. [Google Scholar] [CrossRef]
Figure 1. Study area. (a) Map of the African continent showing Ethiopia; (b) map of Ethiopia with Addis Ababa; and (c) Landsat-8 image in a false color composite (band 5, 4, 3) (9 December 2016) with central business district (CBD).
Sustainability 11 02257 g001
Figure 2. Land surface temperature (LST) map of Addis Ababa; (a) LST in 1986; (b) LST in 2001; and (c) LST in 2016.
Sustainability 11 02257 g002
Figure 3. Land use and land cover (LULC) map of Addis Ababa; (a) LULC in 1986; (b) LULC in 2001; and (c) LULC in 2016.
Sustainability 11 02257 g003
Figure 4. Distribution of the LULC composition and LST along the urban-rural zones (URZs) and expansion of the urban area in Addis Abba from 1986–2016.
Sustainability 11 02257 g004
Figure 5. (a) Relationship between LST and LULC composition in 1986, 2001, and 2016; and (b) scatter plot diagram between LST and LULC in 1986, 2001, and 2016. Scatter plot diagrams between mean LST and IS fraction only belongs to R1, and the remaining two belong to R2.
Sustainability 11 02257 g005
Figure 6. The magnitude of LST along the URZs with a fraction ratio of (a) BL, (b) IS, (c) GS1, and (d) GS2 in Addis Ababa.
Sustainability 11 02257 g006
Figure 7. (a) Multidirectional and multitemporal land surface temperature intensity (LSTI) profile of Addis Ababa; (b) Different kinds of LULC illustrations along the orthogonal and diagonal direction in 2016. (Image Source: Google Earth, accessed on 7 February 2019).
Sustainability 11 02257 g007
Figure 8. (a) Total and urban population in Ethiopia from 1980–2025 including the forecasted population (2019–2025) [46]; and (b) spatial distribution of the 2006 population with the main transportation line [45].
Sustainability 11 02257 g008
Table 1. Experimental data collection.
SensorLandsat-5 TMLandsat-5 TMLandsat-8 OLI/TIRS
Landsat Sensor IDLT51680541986357XXX10LT51680542001350RSA00LC81680542016344LGN01
Temporal resolution23 December 198616 December 20019 December 2016
Spatial resolution30 × 30 m * (except for pan, TIR, and TIRS)
Row/Path54/168
Time (GMT) **06:59:2507:19:5007:40:41
* The spatial resolution of the pan (15 m) on Landsat-8 OLI, TIR (120 m) of the Landsat-5 TM, and TIRS (100 m) of the Landsat-8 TIRS. ** GMT is known as Greenwich Mean Time. GMT is 3 h behind Addis Ababa, Ethiopia time.
Table 2. Details of LULC changes in Addis Ababa in 1986, 2001, and 2016.
LULC198620012016
Area (ha.)%Area (ha.)%Area (ha.)%
Bare land24,372.027.112,723.014.119,200.021.3
Built-up6262.37.014,033.015.630,700.034.1
Crop17,002.218.912,544.013.911,020.012.2
Forest18,406.020.520,957.023.318,713.020.8
Grassland23,721.326.429,611.032.910,228.011.4
Water236.20.3132.00.1139.00.2
Total90,000.010090,000.010090,000.0100
Table 3. The distribution pattern of the LULC in R1 and R2 in 1986, 2001, and 2016.
LULCFraction Ratio
198620012016
R1
(URZ1–17)
R2
(URZ18-70)
R1
(URZ1–37)
R2
(URZ37–70)
R1
(URZ1–41)
R2
(URZ42–70)
BL5.626.86.315.46.624.0
IS59.06.154.97.570.825.5
GS14.023.420.024.216.425.4
GS231.443.718.852.96.225.1
Mean LST (°C)24.224.625.926.328.327.8

