Article

The Economic-Environmental Impacts of China’s Action Plan for Soil Pollution Control

1
Soil Environmental Protection Center, Chinese Academy for Environmental Planning, Beijing 100012, China
2
School of Environmental Science and Engineering, Tianjin University, Tianjin 300072, China
3
International Center for Environmental Technology, International Environmental Cooperation Center, Ministry of Ecology and Environment, Beijing 100035, China
4
State Environmental Protection Key Laboratory of Environmental Planning and Policy Simulation, Chinese Academy for Environmental Planning, Beijing 100012, China
*
Authors to whom correspondence should be addressed.
Sustainability 2019, 11(8), 2322; https://0-doi-org.brum.beds.ac.uk/10.3390/su11082322
Submission received: 25 March 2019 / Revised: 12 April 2019 / Accepted: 12 April 2019 / Published: 17 April 2019
(This article belongs to the Section Economic and Business Aspects of Sustainability)

Abstract

:
To effectively control soil pollution, an action plan (called Soil Plan) was carried out by Chinese government in 2016, which may cost CNY 1.14 trillion during the 2016–2020 period. To evaluate the potential impacts of this action plan on the national economy and environmental control, this study employed a closed macro input-output model to quantitatively account for the economic and environmental impacts from the view of the whole domestic supply chain. Our results show that the implementation of the Soil Plan may stimulate economic development and bring more jobs. It will help generate a gross domestic product (GDP) of CNY 2.72 trillion, with CNY 358.11 billion (15%) made from direct contributions, and CNY 2.36 trillion (85%) from indirect contributions. Meanwhile, the scheme could also produce 2 million jobs within five years, of which 580,000 (29%) are a direct contribution, and 1.42 million (71%) are an indirect contribution. On the other hands, increased demands for products and services of various sectors (such as power/heat production and supply, and chemical products) would also cause more air and water pollutants along with domestic supply chains. The emissions of sulfur dioxide(SO2), nitrogen oxide(NOx), chemical oxygen demand (COD) and ammonia nitrogen(NH3-N) would increase by a total of 5.20 × 10⁵ t, 5.27 × 10⁵ t, 1.62 × 10⁵ t and 9.36 × 10³ t, respectively. Our results may raise the concern about the indirect impacts of an environmental policy for the policy maker from both economic and environmental perspectives.

1. Introduction

Soil plays a fundamental role in the functioning of the ecosystem; it is, therefore, critical to ensure the health of soil [1]. However, the soil has been seriously polluted in many parts of the world, and recent estimates suggest that in some parts of China’s agricultural soil has been contaminated by heavy metals [2]. According to the latest findings of the national survey on soil quality, 16.1% of all samples taken nationwide exceeded healthy levels of metal pollution, with 19.4% of samples taken from agricultural areas exceeding the standards, the main pollutants being Cd, Ni, Cu, As, Hg, Pb, DDT and PAHs [3]. Over the last few decades, many surveys of this kind have been carried out in China, including in the North China Plain, the Pearl River Delta, the Yangtze River Basin, and South China. They have shown agricultural soil in China to be suffering from heavy metal pollution [4].
Soil pollution not only affects the quality of the soil environment, but also poses a threat to food security, human health and ecological environments [5]. Soil pollution has become a hot topic, with many pollution incidents reported by the media, such as high Cd levels being found in rice, and “contaminated land” [6,7]. Meanwhile, the itai-itai disease caused by Cd poisoning has already broken out among some villages in Hunan Province [8]. It is an urgent requirement, therefore, to implement measures to reduce the risk of soil pollution.
In May 2016, the State Council of China issued the Action Plan for Prevention and Control of Soil Pollution (Soil Plan) to effectively control soil pollution and gradually improve soil quality. The Action Plan pledged to make about 90% of polluted arable land and over 90% of polluted sites safe for human use by 2020, with an increase to both over 95% by 2030 [9]. Ten special measures have been drafted alongside the Soil Plan to ensure the fulfillment of these targets. A total of CNY 1.14 trillion is expected to be invested during the 5-year scheme (2016–2020).
The implementation of the Soil Plan requires a huge investment, which aims to improve China’s soil quality, but also promotes the development of soil pollution control-related sectors, boosting the macroeconomic system through the upstream and downstream supply chains [10,11]. Therefore, a scientific evaluation of the social and economic impact of the Soil Plan can assist industrial planners and environmental practitioners in scientific decision making. Meanwhile, during the Soil Plan, rising demands for products and services (such as power and steel) will inevitably lead to the use of more natural resources and generate pollutants, which poses environment issues [12]. Therefore, the impact of the Soil Plan on the emission of pollutants should be scientifically evaluated.
The input-output model is a quantitative economic analysis method with which the technical and economic relationship between different sectors of the national economy, as well as each step of reproduction, can be scientifically analyzed against an input-output table [12]. This model has been widely applied to analyze the impacts of large-scale infrastructure investment, the government economic stimulus plan, and environmental protection investments on the macroeconomy [13,14]. Economists have also used the model to analyze the effectiveness of environmental investments made in an attempt to fuel the economy [15,16,17]. Additionally, resources and environmental input-output can also be simulated by inputting industrial pollution emissions and resource consumption data into the model, and evaluating the impact of environmental protection investment on resource consumption and emissions [12].
In this study, a closed macro input-output model mapping the spillover and linkage effects of industrial and residential consumption was established to quantitatively evaluate the impacts of the Soil Plan on China’s economy. Meanwhile, the impact of the Soil Plan on employment within different sectors was also quantitatively simulated. In addition, an environmental input-output model was established to evaluate the impact of the Soil Plan on emissions.

2. Methodology and Data

2.1. Environmentally Extended Input-Output Framework

First developed by Leontief in 1970, the input-output model has been widely used across different fields: economic analyses, policy simulations, plan argumentation and economic forecasts [10,18,19,20,21]. The calculations of economic impacts and emission contributions are based on environmentally extended input-output (IO) analysis. This well established method is the basis of the System of National Accounts and is well suited to the analysis of the economic and environmental Impacts of the massive investment induced by Soil Plan. The 2015 China Monetary Input-Output Table, published by China’s National Bureau of Statistics, was used as the input-output (IO) table for the present study. Table 1 shows the structure of this IO table, which consists of 42 sectors (listed in Appendix A, Table A1).
Assuming that aij, xi, xj and yi represent the direct consumption coefficient, column vector and row vector of total output, and column vector of final demand, respectively, a transverse equation of input-output can be established as:
aij·xj + yi = xi
Equation (1) could be further expressed as a matrix equation:
X = (IA)−1Y
where the vector X (n × 1 column) indicates each sector’s total output (in RMB); the vector Y (n × 1 column) indicates each sector’s final demand; and the n × n matrix (IA)−1 is Leontief inverse matrix, which reflects the underlying relationship between final demand and total output. Changes in final demand (ΔY) would lead to changes in total output (ΔX) [22], written as:
ΔX = (IA)−1ΔY
The Soil Plan’s investment projects were further divided into fixed capital formation and the consumption of goods and services, and classified according to different sectors. A column vector (ΔYe) was then obtained and added into Equation (3).
ΔX = (IA)−1ΔYe
More final demands resulting from investment during the Soil Plan leads to a rise in residents’ consumption (income), again boosting various production sectors of China’s national economy [23]. However, the growth in residents’ income cannot be completely converted into local investment and consumption, due to savings, taxes, and imports—resulting in economic leakage. Therefore, it is necessary to establish a closed macro input-output model, excluding the impact of consumption growth and economic leakage. Using the derivation path proposed by previous research [24], the equation below can be obtained:
Δ X = ( I A ) 1 ( I C ( 1 t ) h ^ F i W ^ ( I A ) 1 ) 1 Δ ϒ e
C represents the marginal propensity to consume (to deduct the effect of consumption leakage); t represents the marginal propensity to tax (to deduct the effects of tax paid); ĥ represents the diagonal matrix of domestic availability rates of final products (to deduct the effects of import leakage); F represents the column vector of residents’ direct consumption coefficients, i′ represents the unit row vector, and Ŵ represents the diagonal matrix of compensation coefficients. The domestic availability rates of final products illustrate the proportion of domestic products to final products in various sectors; residents’ direct consumption coefficients refer to the proportion of residents’ consumption in various sectors to residents’ total consumption; and compensation coefficients refer to coefficients of compensation in various sectors divided by total output.
Economic impact evaluation. Adding a row vector of economic growth coefficients (Ĝ) and a row vector of input coefficients of labor force (Ĵ) into Equation (5), GDP growth (ΔG) and employment positions (ΔJ) can be described respectively as:
ΔG = ĜΔX
ΔJ = ĴΔX
The economic growth coefficient for a sector is the ratio of economic growth to total output; the input coefficient of the labor force for a sector is the ratio of employment positions to total output. The economic growth of all sectors can be directly obtained from the third quadrant of the input-output table. All the employment data has been taken from the 2017 China Labour Statistical Yearbook [25].
Environmental impact evaluation. Adding a row vector of emission intensity (Ŝ) into Equation (5), the growth in emissions (ΔS) of typical pollutants (SO2, NOx, COD and NH3-N) can be described as:
ΔS = ŜΔX
Emission data of these four typical pollutants across various sectors were taken from the 2015 China Environmental Statistics [26].

2.2. Data Sources

Investment of the Soil Plan: Investment data for the Soil Plan was taken from the Table of Funding Estimates for the Soil Plan. As shown in Table 2, the Soil Plan’s investment will be categorized into four main fields, namely, fundamental capacity building, soil pollution risk management and control, soil pollution treatment and remediation, and soil pollution source control. A total of CNY 1.14 trillion will be invested during the period 2016–2020.
Investment direction data: The investment sums for these four main fields should be re-calculated to define the amount of investment in final products (goods and services) by sector, which would facilitate the evaluation of macroeconomic impact. Usually, a soil remediation project is composed of the following endeavours: survey design, equipment purchase, engineering management, scientific research and technical services. In the present study, the investment in the aforementioned four main fields was further segmented, merged, and then assigned to each sector in the input-output table, against investment expenditure data of several soil pollution control projects in Sichuan, Hunan, and Hubei provinces. The investment by sector was then summarized (Table 3), corresponding to ΔYe in the input-output model.

3. Results

3.1. The Economic Impact of the Soil Plan

As shown in Table 4, the CNY 1142 billion investments in the Soil Plan would help increase China’s GDP by CNY 2716 billion over five years (2016 to 2020)—direct and indirect contributions making up CNY 358.11 billion and CNY 2358 billion, respectively. The input-output ratio of investment in the Soil Plan is 1:2.38, which means that each yuan investment of the Soil Plan would induce GDP of CNY 2.38. The 10 main sectors that benefit from investment of Soil Plan include Construction, Agriculture/forestry/animal husbandry/fishery, Transportation and warehousing, Wholesale and retail, Special-purpose equipment manufacturing, Finance, Oil and natural gas mining, Black metal smelting and rolling processing, Non-metal mineral products, as well as Comprehensive technical services. The induced GDP of these 10 sectors is CNY 1500 billion, which accounts for 55% of the total induced GDP by the investment of Soil Plan. The GDP growth of the Construction and Special-purpose equipment manufacturing will be a direct contribution of the investment during the Soil Plan, whereas the growth of some basic sectors of the national economy—such as the Agriculture, forestry, animal husbandry and fishing, and Transportation and warehousing, will only be indirectly attributable to Soil Plan investments through industrial supply chains.

3.2. Impacts of the Soil Plan on Employment

As shown in Table 5, 198 × 104 new jobs would be created over five years during the implementation of the Soil Plan. Among them, 62 × 104 jobs (31%) would be a direct contribution, while 137 × 104 (69%) jobs would be created indirectly. The 10 main sectors to benefit from the Soil Plan’s investments would include Construction, Wholesale and retail, Transportation and warehousing, Special-purpose equipment manufacturing, Accommodation and catering, Non-metal mineral products, Residential and other services, Metal products, Clothing and textiles, and Agriculture, forestry, animal husbandry and fishing. These sectors alone would see the creation of 63 × 104 new jobs, accounting for 32% of total figures. The new jobs created for sectors such as Construction and Special-purpose equipment manufacturing would result from direct contribution, whilst the jobs created in other less labor-intensive sectors, such as the Wholesale retail, Accommodation and catering, and Residential services, would be categorized as an indirect contribution.

3.3. The Impact of the Soil Plan on Main Pollutant Emissions

More products and services would be used during the implementation of the Soil Plan. Using existing production technologies and processes, many more pollutants are sure to be released into the environment. For this reason, the impact of the Soil Plan on emissions of atmospheric and water pollutants was also calculated. The results are shown in Figure 1 and Figure 2 below.
During the implementation of the Soil Plan, additional SO2 and NOx emissions, amassing 5.20 × 10⁵ t and 5.27 × 10⁵ t, respectively, would be produced. Several sectors, such as production and supply of Electricity and heat, Metal smelting and calendering products, and Non-metallic mineral products caused more SO2 and NOx emissions than others, accounting for 73.8% and 74.1% of total new emissions of each pollutant, respectively (Figure 1). As illustrated in the 2015 Bulletin of National Environmental Statistics [27], the amounts of emissions of SO2 and NOx were 1859.1 × 104 t and 1851.9 × 104 t, respectively. During the implementation of the Soil Plan, additional SO2 and NOx emissions associated with the Soil Plan were equivalent to 2.80%, 2.85% of yearly emissions in 2015, respectively. These statistics all pose serious ramifications for the atmospheric environment. Previous studies have found that environmental protection investment impacts the emission of pollutants. Zhang et al. [12] evaluated the potential environmental impacts of China’s Action Plan on Prevention and Control of Air Pollution based on the environmental input-output model. The results showed that annual averages of new SO2 and NOx emissions accounted for 3.8% and 2.2% of the expected emission reductions proposed by the Action Plan, respectively.
On the other hand, the release of potential water pollutants was also predicted to increase during the Soil Plan’s implementation period, with emissions of COD and NH3-N rising by 1.62 × 10⁵ t and 9.36 × 10³ t, respectively. In addition, the Agriculture, forestry, animal husbandry and fishing, Wholesale and retail, and Chemical products contributed a total of 79.1% and 74.3% of new COD and NH3-N emissions, respectively (Figure 2). Moreover, the Metal smelting and calendering products would cause 0.72 kt of new NH3-N emissions. As illustrated in the 2015 Bulletin of National Environmental Statistics [27], the amount of emissions of COD and NH3-N were 2223.5 × 104 t and 229.9 × 10⁴ t, respectively. During the implementation of the Soil Plan, new COD and NH3-N emissions were equivalent to 0.73% of yearly emissions in 2015, respectively.

4. Discussion

4.1. The Soil Plan’s Main Investments and Associated Economic Impacts

As shown in Table 3, of the CNY 582.3 billion investment in Construction, most investment would be used to renovate tailing reservoirs, solid waste storage and landfill sites. As by-products of mining and mine-processing activities, tailings are a mixture of sand, fine-grained solid materials, water and significant quantities of heavy metals [28]. Tailings are generally deposited in open-air tailing reservoirs without any treatment [29]. It was estimated that China had more than 12,000 tailing reservoirs, occupying a large expanse of land across the nation [30]. Tailing reservoirs are the main cause of acid mine drainage (AMD). AMD is easily produced after the oxidation of various sulfide minerals in tailings [31]. Featuring low pH value and a high concentration of toxic metals, AMD can seriously contaminate the surrounding environment [32]. Meanwhile, due to the aeolian transport of tailing sand, metal pollution can spill to soils of the adjacent agricultural and pasture land [33]. Solid waste storage and landfill sites can also contaminate adjacent areas and cause serious damage [34]. Therefore, efforts should be made to immediately reduce such environmental risks. A portion of the investment should also be used for isolating and retaining contaminated soil, preventing further expansion of polluted areas.
General equipment manufacturing would receive an investment of CNY 252.3 billion, for three main areas: purchase of general equipment in pollution prevention and control projects for tailing reservoirs, solid waste storage and landfill sites, and soil pollution rehabilitation projects. For soils of different pollution levels, different remediation strategies are laid out in the Soil Plan: for slightly contaminated soils, agronomy regulation and alternative planting can be used to ensure the soil’s continued use as well as food safety; for heavily contaminated soil, adjustment of plant structures, and returning farmland to forest or grassland was suggested to reduce the migration of pollutants into the food chain. The implementation of these strategies would generate new demands for seeds, saplings and grass, as well as planting and afforestation services. Therefore, a total of CNY 225.73 billion would be invested in Agriculture, forestry, animal husbandry and fishing and services.
The launch of environmental protection projects and construction of related equipment would increase the demand for steel products and, therefore, facilitate the development of ferrous metals, smelting and calendering. Meanwhile, environmental protection projects are likely to use large quantities of stones, cement and other construction materials, thereby contributing to the development of non-metallic mineral products. During the implementation of the Soil Plan, the development of the ferrous metal smelting and calendering and non-metallic mineral products would contribute a GDP growth of CNY 103.21 billion and CNY 93.70 billion, respectively. In addition, the development of other sectors would also be boosted by the upstream and downstream supply chains. The Soil Plan’s investments would also see the development of various other sectors, creating more jobs and a new basis for GDP growth. As a result of the Soil Plan’s investments, China’s GDP would grow by CNY 2.716 trillion and 2 million new jobs would be created over five years (2016–2020).

4.2. Potential Environmental Impact and Risk of the Soil Plan

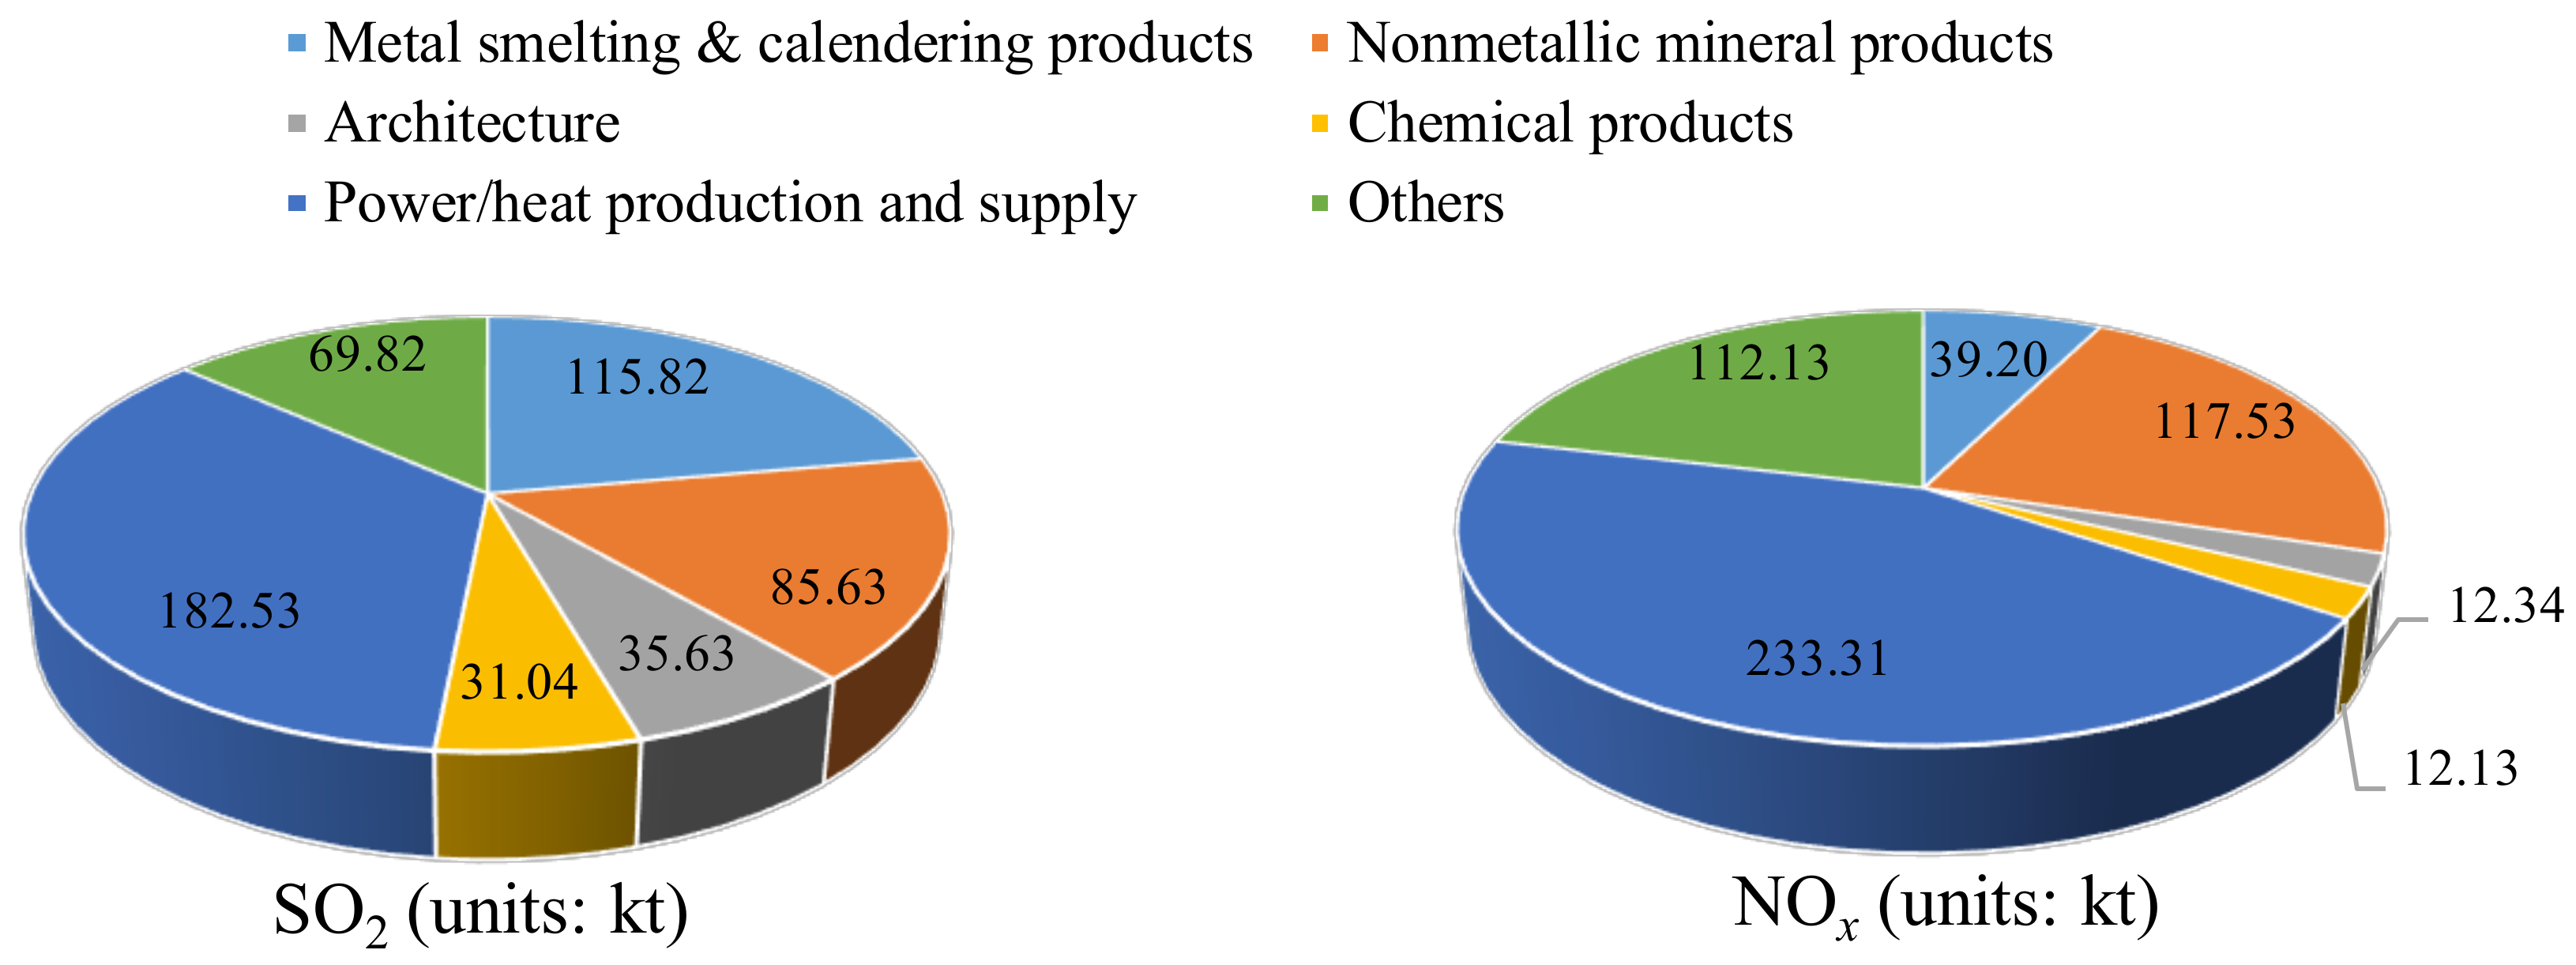
The Soil Plan would increase the demand for products and services of various sectors, resulting in an increased consumption of resources and more emissions. Over the five years of its implementation, the Soil Plan would induce more atmospheric pollutants released into the environment, due to a huge consumption of power [12]—especially taking into account China’s heavy reliance on thermal power. Meanwhile, ferrous metal smelting and calendering will lead to more atmospheric pollutants due to vast consumption of coal. During the Soil Plan, the power, heat production and supply, ferrous metal smelting and calendering would contribute new SO2 emissions of 1.83 × 10⁵ t and 1.16 × 10⁵ t, and new NOx emissions of 2.33 × 10⁵ t and 1.18 × 10⁵ t, respectively.
The Soil Plan will also lead to an increase in wastewater pollutants. The Agricultural sector accounted for 48.06% of total COD emissions, and 31.58% NH3-N emissions. Nitrogenous fertilizers, livestock manure and other fertilizers used in the agricultural production process risk contaminating neighboring water bodies due to farmland runoff and sediment [35,36]. The Soil Plan will may consume more produce of Agriculture, forestry, animal husbandry, fishing and also likely to lead to higher emissions. The development of agriculture, meanwhile, is likely to result in greater demand for chemical products, such as fertilizers and pesticides; further promoting the development of chemical products. This will also lead to higher emissions according to the input-output model used in this research. During the Soil Plan, Agriculture, forestry, animal husbandry, fishing and service and Chemical products would contribute new COD emissions of 6.22 × 10⁴ t and 1.16 × 10⁴ t, and new NH3-N emissions of 4.35 × 10 3 t and 1.92 × 10³ t, respectively.
Greater demands for more products and services from various sectors, which are likely to accompany the Soil Plan, will lead to higher emissions. There are also similar examples in other fields. Previous research shows that the production of olives needs more than 90% of non-renewable energy requirements throughout the whole production chain [37]. It may pose health threats to those residing in those areas. Therefore, more efforts should be made to promote technological advancements and industrial revamps for an accelerated circular economy, and clean production in key sectors [38]. This may need greener supply chains to minimize negative environmental impact the Soil Plan [39].

4.3. Limitation and Future Directions

In this study, a closed macro input-output model was used to simulate the economic impact of the Soil Plan’s investment. Our results were based on the following assumptions: (1) the Soil Plan’s investments would be solely used for the consumption of products, and that all projects undertaken during the Soil Plan would be implemented as originally planned; (2) industrial production technologies will remain unchanged between 2016 and 2020. The second assumption is a defect of the input-output model, as the simulation results will not reflect the impact of the technical advancements on future environmental protection activities. Therefore, it is recommended that the dynamic input-output model is used in future studies to improve prediction accuracy.
It is important that the Soil Plan is primarily used as a means of improving China’s soil environmental quality. Economic and environmental concerns, therefore, should not be the primary concern of investments. Furthermore, investment differs by region, as do the industrial structures of each individual province and city. Further study is needed to assess the economic and environmental impacts of investment in different regions. This would help provide appropriate policy recommendations for environmental protection in local regions.

5. Conclusions

The Soil Plan will play a significant role in the improvement of China’s soil quality and the development of the economy. During the implementation period (2016–2020), the Soil Plan is predicted to lead to a GDP growth of CNY 2.7 trillion, creating 2 million new jobs. In terms of GDP, those sectors most likely benefit from Soil Plan’s implementation include Construction, Agriculture, forestry, animal husbandry, fishing, Transportation and warehousing, Wholesale and retail, and Special-purpose equipment manufacturing. The Soil Plan will give a direct impetus to the development of relevant sectors, such as Construction and Debugging, environmental protection equipment manufacturing and comprehensive technical services. This will answer the demands of emerging environmental protection. However, with more demands for products and services within various sectors (such as the power, heat and chemical products), emissions of typical atmospheric and wastewater pollutants such as SO2, NOx, COD and NH3-N will also rise, with potentially serious environmental ramifications. Therefore, energy efficiency and pollution control must be improved across a range of sectors in order to reduce potential environmental impacts incurred by the Soil Plan.

Author Contributions

Conceptualization, Z.L., X.W. and W.Z.; methodology, Z.L. and W.Z.; validation, R.L. and Z.S.; formal analysis, Z.L.; resources, J.L. and G.H.; data curation, L.M.; writing—original draft preparation, Z.L. and J.L.; writing—review and editing, Z.L., X.W. and W.Z.; visualization, R.L. and W.Z.; supervision, X.W. and W.Z.; project administration, Z.L. and W.Z.; funding acquisition, X.W.

Funding

This work was supported by the National Key R&D Program of China (Grant 2018YFC1800205) and the National Science Foundation of China (Grants 71603097, 71433007).

Conflicts of Interest

The authors declare no conflict of interest.

Appendix A

Table A1. The sectors in China’s input-output table.
Sectors Sectors
1Agriculture, Forestry, Animal Husbandry and Fishery22Other manufacturing
2Mining and washing of coal23Comprehensive use of waste resources
3Extraction of petroleum and natural gas24Repair of metal products, machinery and equipment
4Mining and processing of metal ores25Production and distribution of electric power and heat power
5Mining and processing of nonmetal and other ores26Production and distribution of gas
6Food and tobacco processing27Production and distribution of tap water
7Textile 28Construction
8Manufacture of leather, fur, feather and related products29Wholesale and retail trades
9Processing of timber and furniture30Transport, storage, and postal services
10Manufacture of paper, printing and articles for culture, education and sport activity31Accommodation and catering
11Processing of petroleum, coking, processing of nuclear fuel32Information transfer, software and information technology services
12Manufacture of chemical products33Finance
13Manufacture of non-metallic mineral products34Real estate
14Smelting and processing of metals35Leasing and commercial services
15Manufacture of metal products36Scientific research and polytechnic services
16Manufacture of general purpose machinery37Administration of water, environment, and public facilities
17Manufacture of special purpose machinery38Resident, repair and other services
18Manufacture of transport equipment39Education
19Manufacture of electrical machinery and equipment40Health care and social work
20Manufacture of communication equipment, computers and other electronic equipment41Culture, sports, and entertainment
21Manufacture of measuring instruments42Public administration, social insurance, and social organizations

References

  1. Coppolecchia, D.; Puglisi, E.; Vasileiadis, S.; Suciu, N.; Hamon, R.; Beone, G.M.; Trevisan, M. Relative sensitivity of different soil biological properties to zinc. Soil Biol. Biochem. 2011, 43, 1798–1807. [Google Scholar] [CrossRef]
  2. Li, J.; Ma, Y.B.; Hu, H.W.; Wang, J.T.; Liu, Y.R.; He, J.Z. Field-based evidence for consistent responses of bacterial communities to copper contamination in two contrasting agricultural soils. Front. Microbiol. 2015, 6, 31. [Google Scholar] [CrossRef] [PubMed]
  3. Ministry of Ecology and Environment of PRC. The Nationwide Survey Communique of Soil Pollution. Available online: http://www.gov.cn/foot/site1/20140417/782bcb88840814ba158d01.pdf (accessed on 12 April 2019).
  4. Du, P.; Xie, Y.; Wang, S.; Zhao, H.; Zhang, Z.; Wu, B.; Li, F. Potential sources of and ecological risks from heavy metals in agricultural soils, Daye City, China. Environ. Sci. Pollut. Res. 2015, 22, 3498–3507. [Google Scholar] [CrossRef] [PubMed]
  5. Li, Z.; Ma, Z.; van der Kuijp, T.J.; Yuan, Z.; Huang, L. A review of soil heavy metal pollution from mines in China: Pollution and health risk assessment. Sci. Total Environ. 2014, 468, 843–853. [Google Scholar] [PubMed]
  6. Li, X.; Jiao, W.; Xiao, R.; Chen, W.; Chang, A. Soil pollution and site remediation policies in China: A review. Environ. Rev. 2015, 23, 263–274. [Google Scholar] [CrossRef]
  7. Liu, X.; Tian, G.; Jiang, D.; Zhang, C.; Kong, L. Cadmium (Cd) distribution and contamination in Chinese paddy soils on national scale. Environ. Sci. Pollut. Res. 2016, 23, 17941–17952. [Google Scholar] [CrossRef] [PubMed]
  8. Zhang, L. Absorption and Accumulation of Cadmium in Rice Intercropped by Echinodorus Osiris and the Change of Plant Rhizophere Soil Physicochemical Property; Guangxi University: Guangxi, China, 2013. [Google Scholar]
  9. Zhang, F.; Li, G. China released the action plan on prevention and control of soil pollution. Front. Environ. Sci. Eng. 2016, 10, 19. [Google Scholar]
  10. Miller, R.E.; Blair, P.D. Input-Output Analysis: Foundations and Extensions; Cambridge University Press: Cambridge, UK, 2009. [Google Scholar]
  11. Pasurka, C.A., Jr. The short-run impact of environmental protection costs on US product prices. J. Environ. Econ. Manag. 1984, 11, 380–390. [Google Scholar] [CrossRef]
  12. Zhang, W.; Wang, J.; Jiang, H.; Lei, Y.; Bi, J. Potential economy and environment impacts of China’s National Air Pollution Control Action Plan. Res. Environ. Sci. 2015, 28, 1–7. [Google Scholar]
  13. Jiang, H. The Principle and Contribution Models of Environment Protection Investment on Economic. Syst. Eng. Theory Pract. 2014, 24, 8–12. [Google Scholar]
  14. Yang, Y. Effect of 2008 Olympic Games on Beijing Economy. China Sport Sci. 2005, 25, 3–6. [Google Scholar]
  15. Jiang, H.; Cao, D.; Wagn, J.; Guo, X. The study on action principle of environmental protection investment on national economy and the contribution models. Res. Environ. Sci. 2005, 18, 71–74. [Google Scholar]
  16. Li, L.; Lu, H.; He, S. Contribution of the environmental protection activity of Dianchi Lake Basin to GDP measured through green input-output table. Syst. Eng. Theory Pract. 2002, 9, 121–127. [Google Scholar]
  17. Zhang, W.; Wang, J.; Zhang, B.; Bi, J.; Jiang, H. Can China comply with its 12th five-year plan on industrial emissions control: A structural decomposition analysis. Environ. Sci. Technol. 2015, 49, 4816–4824. [Google Scholar] [CrossRef] [PubMed]
  18. Dietzenbacher, E.; Los, B. Structural decomposition techniques: Sense and sensitivity. Econ. Syst. Res. 1998, 10, 307–324. [Google Scholar] [CrossRef]
  19. Hoekstra, R.; Van den Bergh, J.C. Constructing physical input–output tables for environmental modeling and accounting: Framework and illustrations. Ecol. Econ. 2006, 59, 375–393. [Google Scholar] [CrossRef]
  20. Llop, M. Economic structure and pollution intensity within the environmental input–output framework. Energy Policy 2007, 35, 3410–3417. [Google Scholar] [CrossRef]
  21. Rose, A.; Casler, S. Input–output structural decomposition analysis: A critical appraisal. Econ. Syst. Res. 1996, 8, 33–62. [Google Scholar] [CrossRef]
  22. Liu, Q.; Cheng, W. Macroeconomic Forecasting and Planning; China Commodity Price Press: Beijing, China, 1998. [Google Scholar]
  23. Peng, Z.; Qi, S. Multiplier analysis on the national economy. Stat. Res. 1998, 5, 49–53. [Google Scholar]
  24. Liu, B. Analysis of input-output multipliers. Stat. Res. 1999, 5, 55–58. [Google Scholar]
  25. China National Bureau of Statistics. China Labour Statistical Yearbook 2017; China Statistics Press: Beijing, China, 2018.
  26. Ministry of Ecology and Environment of PRC. China Environmental Statistics Yearbook 2010; China Statistics Press: Beijing, China, 2012.
  27. Ministry of Ecology and Environment of PRC. Bulletin of National Environmental Statistics in 2015; China Statistics Press: Beijing, China, 2017.
  28. Santibañez, C.; de la Fuente, L.M.; Bustamante, E.; Silva, S.; León-Lobos, P.; Ginocchio, R. Potential use of organic-and hard-rock mine wastes on aided phytostabilization of large-scale mine tailings under semiarid Mediterranean climatic conditions: Short-term field study. Appl. Environ. Soil Sci. 2012, 2012. [Google Scholar] [CrossRef]
  29. Wang, L.; Ji, B.; Hu, Y.; Liu, R.; Sun, W. A review on in situ phytoremediation of mine tailings. Chemosphere 2017, 184, 594–600. [Google Scholar] [CrossRef] [PubMed]
  30. Yin, G.; Li, G.; Wei, Z.; Wan, L.; Shui, G.; Jing, X. Stability analysis of a copper tailings dam via laboratory model tests: A Chinese case study. Miner. Eng. 2011, 24, 122–130. [Google Scholar] [CrossRef]
  31. Shu, X.-H.; Zhang, Q.; Lu, G.-N.; Yi, X.-Y.; Dang, Z. Pollution characteristics and assessment of sulfide tailings from the Dabaoshan Mine, China. Int. Biodeter. Biodegrad. 2018, 128, 122–128. [Google Scholar] [CrossRef]
  32. Lefticariu, L.; Walters, E.R.; Pugh, C.W.; Bender, K.S. Sulfate reducing bioreactor dependence on organic substrates for remediation of coal-generated acid mine drainage: Field experiments. Appl. Geochem. 2015, 63, 70–82. [Google Scholar] [CrossRef]
  33. Rodríguez, L.; Gómez, R.; Sánchez, V.; Villaseñor, J.; Alonso-Azcárate, J. Performance of waste-based amendments to reduce metal release from mine tailings: One-year leaching behaviour. J. Environ. Manag. 2018, 209, 1–8. [Google Scholar] [CrossRef] [PubMed]
  34. Sharholy, M.; Ahmad, K.; Mahmood, G.; Trivedi, R. Municipal solid waste management in Indian cities—A review. Waste Manag. 2008, 28, 459–467. [Google Scholar] [CrossRef]
  35. Borin, M.; Bonaiti, G.; Giardini, L. Controlled drainage and wetlands to reduce agricultural pollution. J. Environ. Qual. 2001, 30, 1330–1340. [Google Scholar] [CrossRef]
  36. Elias, D.; Wang, L.; Jacinthe, P.-A. A meta-analysis of pesticide loss in runoff under conventional tillage and no-till management. Environ. Monit. Assess. 2018, 190, 79. [Google Scholar] [CrossRef]
  37. Cappelletti, G.M.; Ioppolo, G.; Nicoletti, G.M.; Russo, C. Energy requirement of extra virgin olive oil production. Sustainability 2014, 6, 4966–4974. [Google Scholar] [CrossRef]
  38. Nssén, J.; Holmberg, J.; Wadeskog, A.; Nyman, M. Direct and indirect energy use and carbon emissions in the production phase of buildings: An input–output analysis. Energy 2007, 32, 1593–1602. [Google Scholar]
  39. Abdallah, T.; Farhat, A.; Diabat, A.; Kennedy, S. Green supply chains with carbon trading and environmental sourcing: Formulation and life cycle assessment. Appl. Math. Model. 2012, 36, 4271–4285. [Google Scholar] [CrossRef]
Figure 1. Emission of atmospheric pollutants (SO2 and NOx) by sector.
Sustainability 11 02322 g001
Figure 2. Emission of wastewater pollutants (COD and NH3-N) by sector.
Sustainability 11 02322 g002
Table 1. The structure of China monetary input-output table used in this study.
OutputIntermediate UseFinal UseImportsTotal Output
Input Sector 1Sector 42Final ConsumptionCapital FormationExports
Intermediate inputsSector 1XijYjIMjXi
Sector 42
Value addedEmployee compensationGij
Net taxes on production
Depreciation of fixed capital
Operating surplus
Total inputsXj
Table 2. Investment of the Soil Plan.
No.AspectDetailsInvestment Amount (Billion Yuan)
AFundamental capacity buildingA detailed survey on soil pollution; revision of laws, regulations, relevant standards and technical specifications; capacity building for soil monitoring and law enforcement; construction of soil pollution control laboratories and engineering technology centers72.50
BRisk management and controlSafe utilization measures (agricultural regulation, alternative planting, etc. for slightly polluted farmland); risk control measures (planting structure adjustment, returning farmland to forest or grassland etc.) for seriously polluted farmland; barrier and enclosure etc. for contaminated sites321.00
CPollution treatment and remediationPilot and demonstration of pollution management and remediation; construction of pilot areas of soil pollution management; management and remediation of contaminated farmland179.00
DPollution source controlHeavy metal pollution prevention and remediation; comprehensive control and treatment of tailings ponds, solid waste dumps and informal landfills; construction of pilot areas for collaborative control and treatment569.52
Total1142.02
Table 3. Investment directions and their corresponding sectors of Soil Plan.
Investment DirectionCorresponding SectorsInvestment Amount (Billion Yuan)Proportion (Billion Yuan)
Investigation and assessment on soil pollution; law and regulation makingScientific researches and technical services28.7628.76 (A)
Purchase of equipment solely for environmental protection, e.g., rapid monitoring equipment for contaminated land, etc.Special-purpose equipment manufacturing26.9226.92 (A)
Architectural engineering; installation and debuggingConstruction582.3450.00 (B) + 50.00 (C) + 482.34 (D)
Purchase of general equipment, including pile-turning machine and sieving-crushing bucket etc.General equipment manufacturing252.35150.00 (B) + 50.00 (C) + 52.35 (D)
Purchase of seeds and afforestation, etc.Products and services of agriculture, forestry, animal husbandry and fishery225.73120.00 (B) + 78.26 (C) + 27.47 (D)
Development of environmental information management platformsInformation dissemination, software and IT services0.790.79 (A)
Scientific experimental research; engineering exploration, design and management servicesScientific research and technical services23.7316.03 (B) + 7.70 (D)
Note: A, B, C, and D represent the four aspects in Table 1.
Table 4. The economic impacts of the Soil Plan on gross domestic product (GDP) by sectors (units: billion yuan).
SectorsTotal ImpactsDirect ImpactsIndirect ImpactsProportion (%)
Construction350.36203.56146.8012.90
Agriculture/forestry/animal husbandry/fishery168.390.00168.396.20
Transportation & warehousing152.100.00152.105.60
Wholesale & retail138.520.00138.525.10
Special-purpose equipment manufacturing 171.11107.8763.246.30
Finance124.940.00124.944.60
Oil and natural gas mining114.070.00114.074.20
Black metal smelting & rolling processing103.210.00103.213.80
Non-metal mineral product93.700.0093.703.45
Comprehensive technical service84.2018.7865.423.10
Others 1215.4127.901187.5144.75
Total 2716.00358.112357.89100.00
Table 5. The Soil Plan’s impacts on employment by sectors (units: ×104 jobs).
SectorsTotal Impacts Direct ImpactsIndirect ImpactsProportion (%)
Construction4640623.0
Wholesale and retail2702713.7
Transportation and warehousing174138.4
Special-purpose equipment manufacturing10735.1
Accommodation and catering9094.6
Non-metal mineral product7073.6
Residential services and other services6063.0
Metal products5142.6
Textile/clothing/shoes/hat making4042.2
Agriculture/forestry/animal husbandry/fishery4042.1
Others 63105431.7
Total19862137100

