Article

Severe Drought in Finland: Modeling Effects on Water Resources and Assessing Climate Change Impacts

1
Finnish Environment Institute, Latokartanonkaari 11, FI-00790 Helsinki, Finland
2
Department of Built Environment, Aalto University, 02015 Espoo, Finland
3
Department of Mechanical Engineering, Aalto University, 02015 Espoo, Finland
*
Author to whom correspondence should be addressed.
Sustainability 2019, 11(8), 2450; https://0-doi-org.brum.beds.ac.uk/10.3390/su11082450
Submission received: 4 March 2019 / Revised: 15 April 2019 / Accepted: 23 April 2019 / Published: 25 April 2019

Abstract

:
Severe droughts cause substantial damage to different socio-economic sectors, and even Finland, which has abundant water resources, is not immune to their impacts. To assess the implications of a severe drought in Finland, we carried out a national scale drought impact analysis. Firstly, we simulated water levels and discharges during the severe drought of 1939–1942 (the reference drought) in present-day Finland with a hydrological model. Secondly, we estimated how climate change would alter droughts. Thirdly, we assessed the impact of drought on key water use sectors, with a focus on hydropower and water supply. The results indicate that the long-lasting reference drought caused the discharges to decrease at most by 80% compared to the average annual minimum discharges. The water levels generally fell to the lowest levels in the largest lakes in Central and South-Eastern Finland. Climate change scenarios project on average a small decrease in the lowest water levels during droughts. Severe drought would have a significant impact on water-related sectors, reducing water supply and hydropower production. In this way drought is a risk multiplier for the water–energy–food security nexus. We suggest that the resilience to droughts could be improved with region-specific drought management plans and by including droughts in existing regional preparedness exercises.

1. Introduction

Drought is one of the most costly natural hazards, causing diverse and cascading impacts on different economic sectors [1]. Europe has been hit by several large droughts during the last hundred years [2,3], with the average cost of drought in EU countries estimated to have been 6.2 billion euros per year in 1990–2006 [4]. Drought costs are, however, difficult to assess comprehensively due to their complex nature, and particularly the fact that indirect costs are seldom properly captured [5]. The lack of data and multitude of methods used in cost assessment make it difficult to compare the results and to estimate the cost and benefit of action against droughts [5]. Studies of drought severity and impact have used a variety of methods, including the use of different drought indices [6,7], and the estimation of the economic impacts of recent droughts [4,8]. The sectors affected directly by drought include energy (particularly hydropower), transportation (water transport affected by low water levels), agriculture (crop yields and livestock), forestry, buildings (e.g., the subsidence of clay soils and the consequent damage to buildings), water supply, industry, tourism, and recreation [8,9].
Water security in Finland is regarded as being at a very high level due to favorable natural conditions, including abundant water resources, as well as good governance and long-term water conservation efforts [10]. Water security can be defined in many ways [11]. We use the definition by UN Water, which states that “water security is the capacity of a population to safeguard sustainable access to adequate quantities of acceptable quality water for sustaining livelihoods, human well-being, and socio-economic development, for ensuring protection against water-borne pollution and water-related disasters, and for preserving ecosystems in a climate of peace and political stability” [12].
Droughts in Finland are infrequent, and rainless periods are relatively short. Severe drought would impact different parts of Finland differently, as water resources and water use are not equally distributed. The northern and eastern parts are more water-rich than the coastal areas that have a denser population and more intensive water use. Therefore some areas are potentially more vulnerable to droughts, and severe drought could cause serious damage and problems to several sectors [8]. While drought would directly impact water security, its negative effects on hydropower and agriculture mean that it also has the potential to affect both energy security and food security [13].
Despite this, no comprehensive, national or even regional scale analysis on the impacts that a severe drought would have on Finland has been carried out. The economic impact of drought on the whole of Finland has been estimated only for the drought of 2002–2003, which was estimated to have cost 102 million euros in direct damage [8]. The largest damage was caused to hydropower, building foundations, agriculture, and water supply for industry. Although severe and intense, the 2002–2003 drought was not particularly long-lasting and occurred mainly during wintertime, which limited the effects on agriculture. After the drought of 2002–2003, it was suggested that one way to prepare for future droughts could be to simulate the impact on water resources of last century’s most severe drought, which occurred in 1939–1942 [8], but until now this evaluation has not been carried out. During the drought of 1939–1942, the precipitation was well below average for three and a half years and the observed water levels in major lakes and rivers were at record lows.
Legislation sets the foundation for future drought preparedness and management as well as related responsibilities. Climate change adaptation aspects are already included in Finnish and EU law, including the Finnish Water Act (587/2011) and Water Services Act (119/2001), as well as the EU Floods Directive (2007/60/EC). However, neither Finnish nor EU legislation requires specific drought management plans. In Finland, only the Water Act includes actual provisions on drought preparation and management. According to the Water Act, drought justifies the review of water permits and the restriction of water abstraction to avoid significant harm or damage (Ch. 3, Sec. 21; Ch. 4, Sec. 10). The Water Act also mandates a state authority to prepare a report on the measures needed to minimize the harmful impact of droughts (Ch. 18, Sec. 3), and thus directs the authority toward drought management planning. At the European level, the Common Implementation Strategy of the Water Framework Directive (2000/60/EC) [14] guides the Member States to consider drought preparation in the context of river basin management planning, which can be seen as a wide enough spatial scale for drought risk management.
Climate change has increased the interest in drought and its possible impact. The hydrological regimes in Finland will be affected by climate change, as changes are expected particularly in seasonal variability due to warmer winters [15]. Precipitation is expected to increase and the length of dry periods to decrease in winter, while changes in summer dry periods are more uncertain [16,17]. While meteorological drought periods are estimated to remain relatively unchanged in length due to climate change [18], climate change can still cause hydrological drought to become more severe in some regions. Warmer temperatures increase evaporation and cause earlier and smaller spring floods, which result in lower discharges during late summer and early autumn [19]. To date, there have been few strong observed changes in drought trends in the Nordic countries [20,21]. Climate change projections made with large-scale models predict decreases in drought severity for either the entire Finland [22] or Northern Finland, with no significant changes in Southern Finland [23].
The aim of this study was to develop and test a methodology for a national-scale drought analysis in Finland, and in this way to improve the understanding of droughts and their impacts on key water-related sectors. This paper was written as part of the same research project as the paper by Ahopelto et al. [24], which estimates water availability and water stress in Finland during a severe drought. Ahopelto et al. [24] used monthly discharges (without climate change) as input for their water stress analysis, whereas this study estimated the daily discharges and water levels during a severe drought and the consequent impacts on water resources, water supply and hydropower production in Finland, while taking into consideration spatial variance within the country. In addition, the impact of climate change on droughts was estimated. Based on these results, we discuss the ways that long-term drought should be taken into account in a water-rich country like Finland.

2. Materials and Methods

2.1. Finland’s Water Resources and Climate
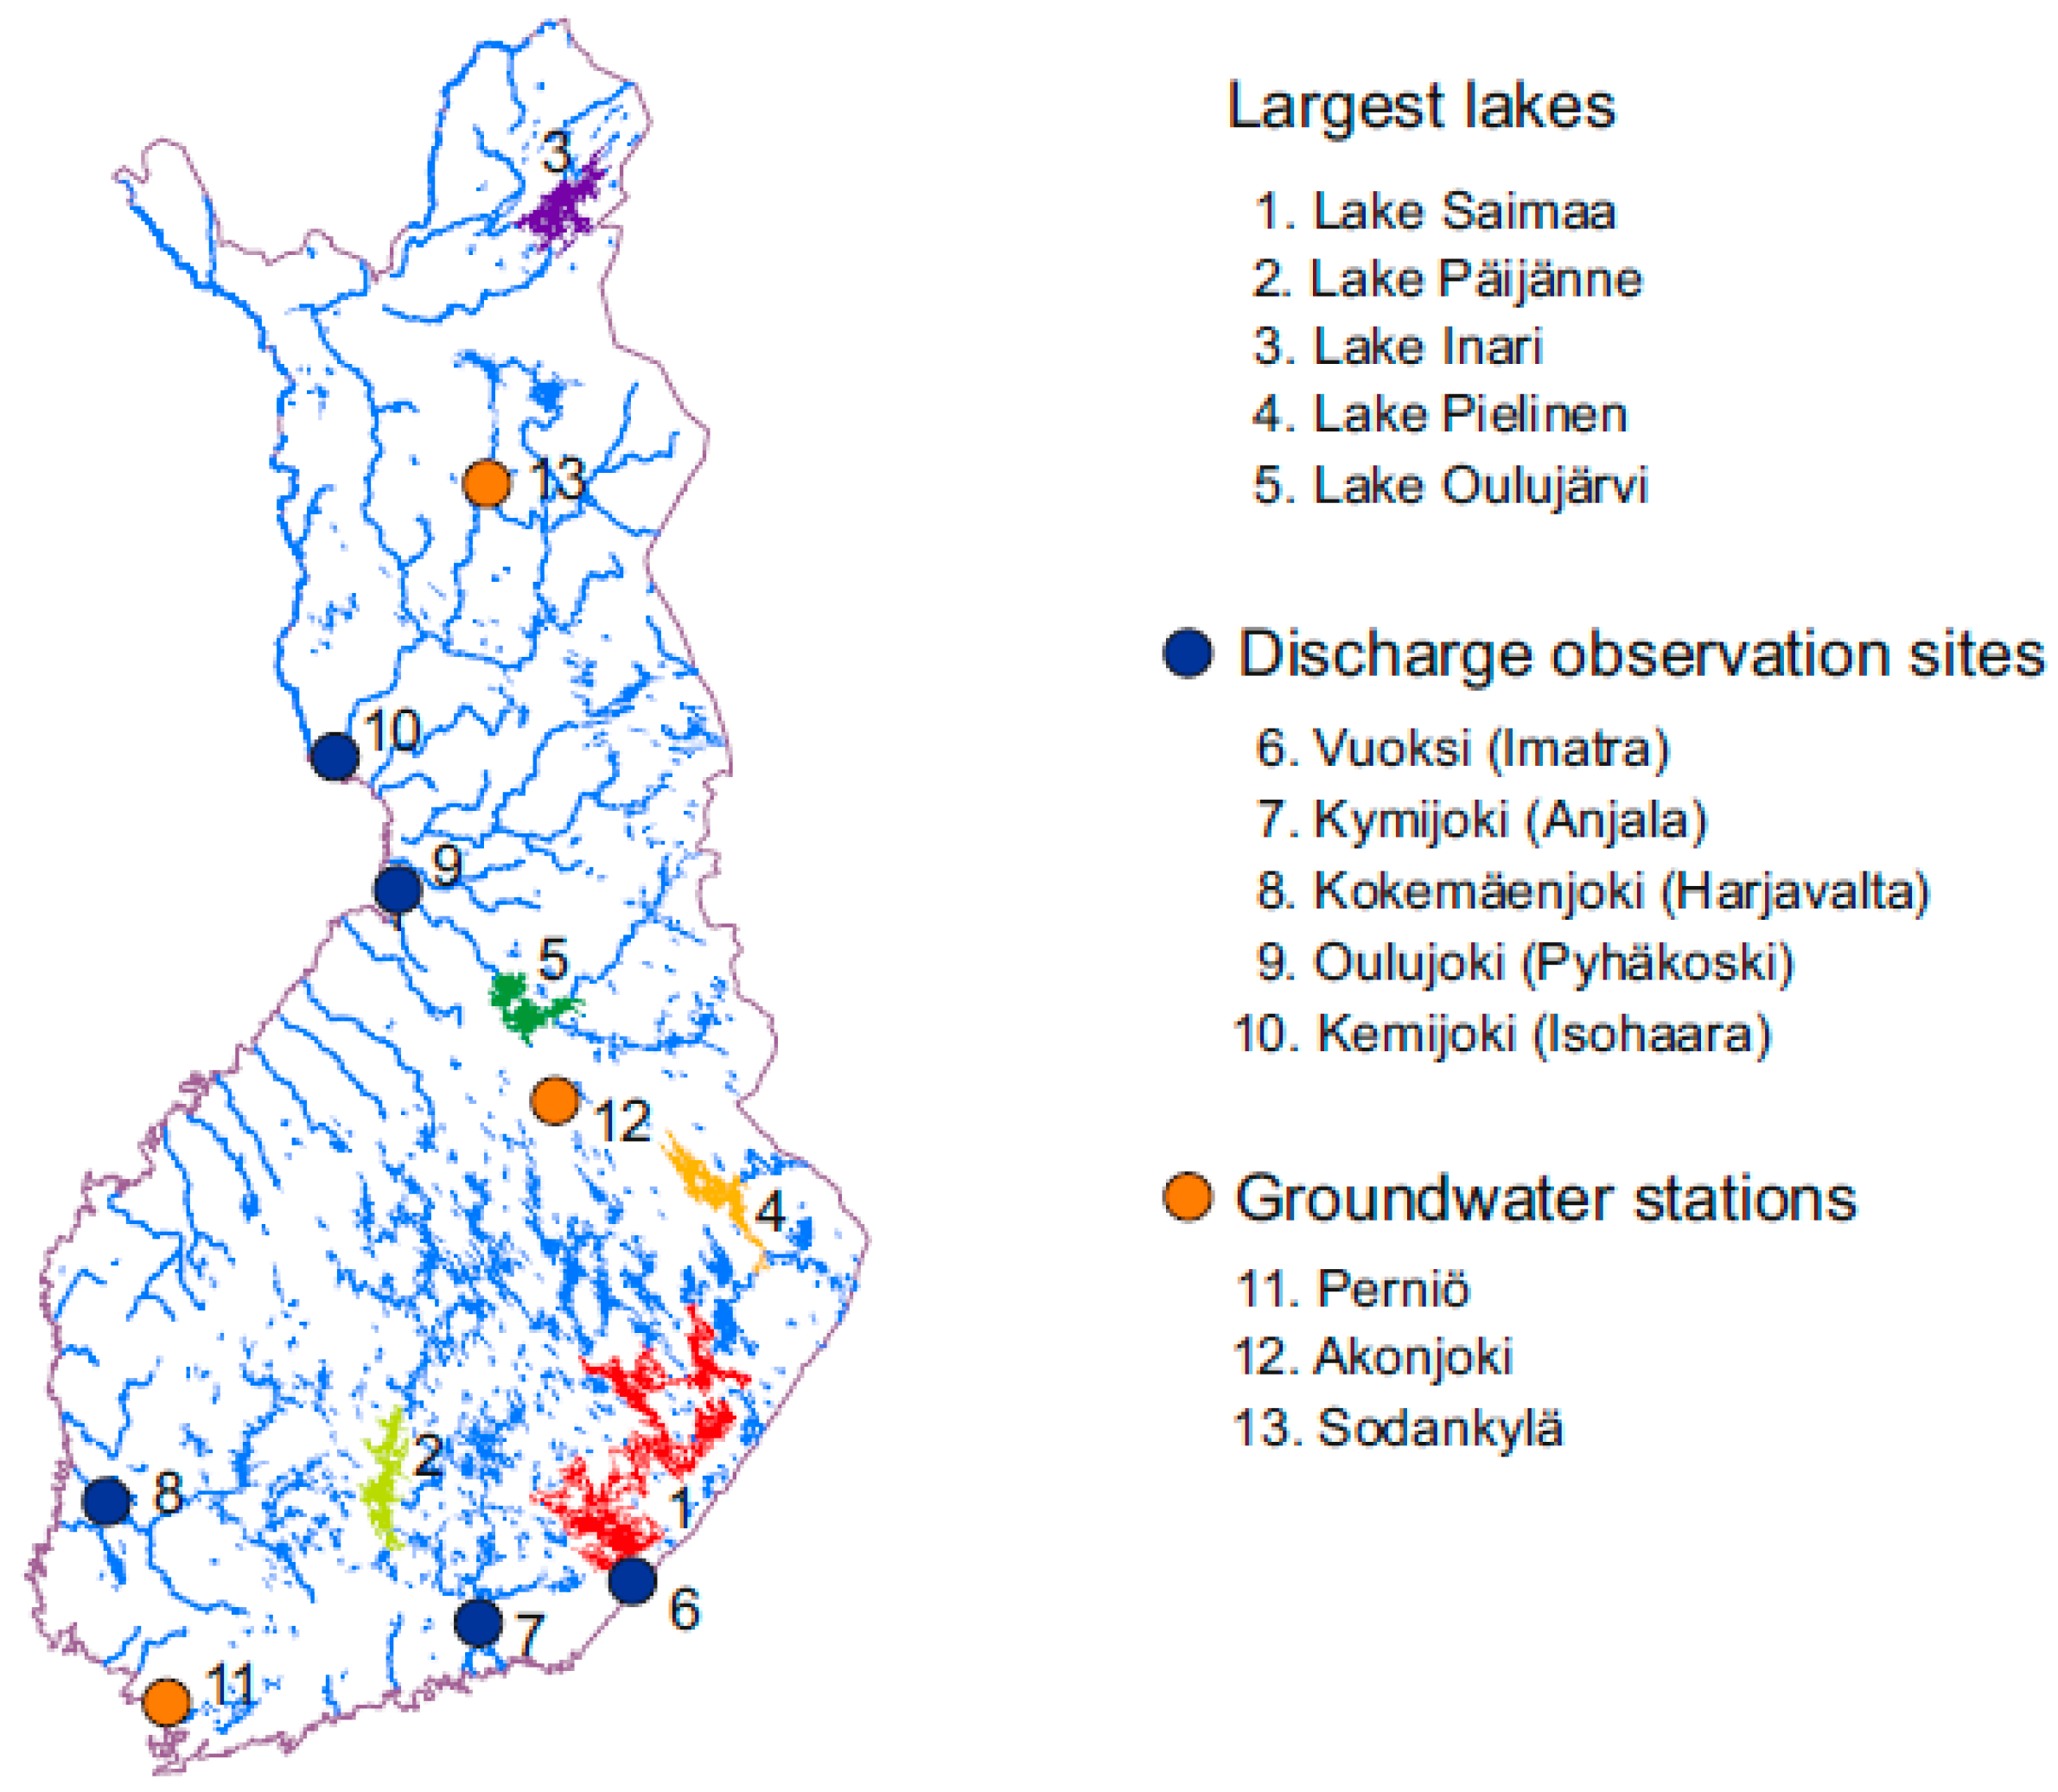
Finland’s water resources amount to approximately 20,000 m3 per inhabitant, making Finland the second most ‘water-rich’ country in the EU [25]. On average, only 3.5% of the renewable water resources are abstracted, but variation between regions and seasons is high [26,27]. Water resources are also important, as water-intensive industries, such as the paper and pulp industry, are rather extensively practiced in Finland. Approximately 10–20% of electricity is produced by hydropower [28], which is also important in balancing energy production [29].
The Finnish climate is cold with no dry season [30], moderate precipitation amounts, and moderate evaporation. The observed average annual precipitation sum for 1981–2010 varied from 450 mm in Northern Lapland to around 750 mm in Southern and Eastern Finland [31]. The normally prevailing westerly winds bring moist air to Finland and long-term meteorological droughts are rare [18]. Periods of no or very little precipitation are relatively short. The maximum length of a period with less than 10 mm precipitation with a return period of 20 years is 50–65 days, and is slightly longer in winter than in summer [17].
Climate and hydrology in Finland are characterized by seasonal variation, with snow accumulation in winter and snowmelt during spring. A high percentage of the land area is forests (75%), with agricultural land accounting for 8%. Finland can be divided into three main hydrological regions: the lake district in the east and center, small coastal rivers in the south and west, and the northern area with large rivers. The lake district in particular includes many lakes (Finland has a total of 187,887 lakes), which decreases flow variability. The northern area has large rivers and a short summer with relatively small evapotranspiration amounts and therefore has a relatively small drought risk. The coastal area of Finland has fewer lakes, smaller rivers and more variable discharges, and groundwater recharge is somewhat hindered in areas with thick clay soils partially or totally covering aquifers. At the same time, water use is intensive due to the larger population and active industrial and agricultural activities.
Finnish watersheds generally have two periods of low discharge: late winter or early spring before the beginning of runoff from snowmelt, and late summer, when evapotranspiration, which in summer is greater than precipitation, has decreased the runoff. In Southern Finland, the annual lowest discharge most commonly occurs during summer, while in Northern Finland the winter discharges are the lowest [32].

2.2. Study Area

The study area includes the whole of Finland. Transboundary watersheds in Russia, Sweden, and Norway were also simulated when they affected discharges and water levels in Finland, but results beyond the borders of Finland are not presented. Figure 1 shows the major rivers and lakes in Finland. The five largest lakes in Finland, namely Lake Saimaa (greater Saimaa), Lake Inari, Lake Päijänne, Lake Pielinen, and Lake Oulujärvi are shown with different colors in Figure 1. In addition, the locations of the discharge observation sites in the largest rivers in Finland used for comparison with 1939–1942 (Section 3.1) are shown (Figure 1).
The groundwater level was modeled for 18 groundwater stations where good quality water level data was available, and the groundwater model functioned relatively well. Three of these stations were selected for closer study, namely Perniö (South-Western Finland), Akonjoki (Central Finland) and Sodankylä (Northern Finland) (Figure 1). These were selected to represent different parts of the country and different types of groundwater areas to produce an overview of the impact of drought on groundwater tables in smaller aquifers where the hydrological cycle is shorter. Akonjoki is situated in a small moraine formation with finer and mixed grain soil, and Sodankylä is located in a small glaciofluvial formation of coarse-grained soil. Both the Akonjoki and Sodankylä stations provide an outlook on groundwater availability in areas with scarce groundwater reservoirs. Many private wells in rural areas are situated in these types of conditions. Perniö station is located in a smaller esker with coarse and mixed gravel and with better groundwater recharge and reservoir conditions that represent the conditions in areas where many smaller water companies extract water.

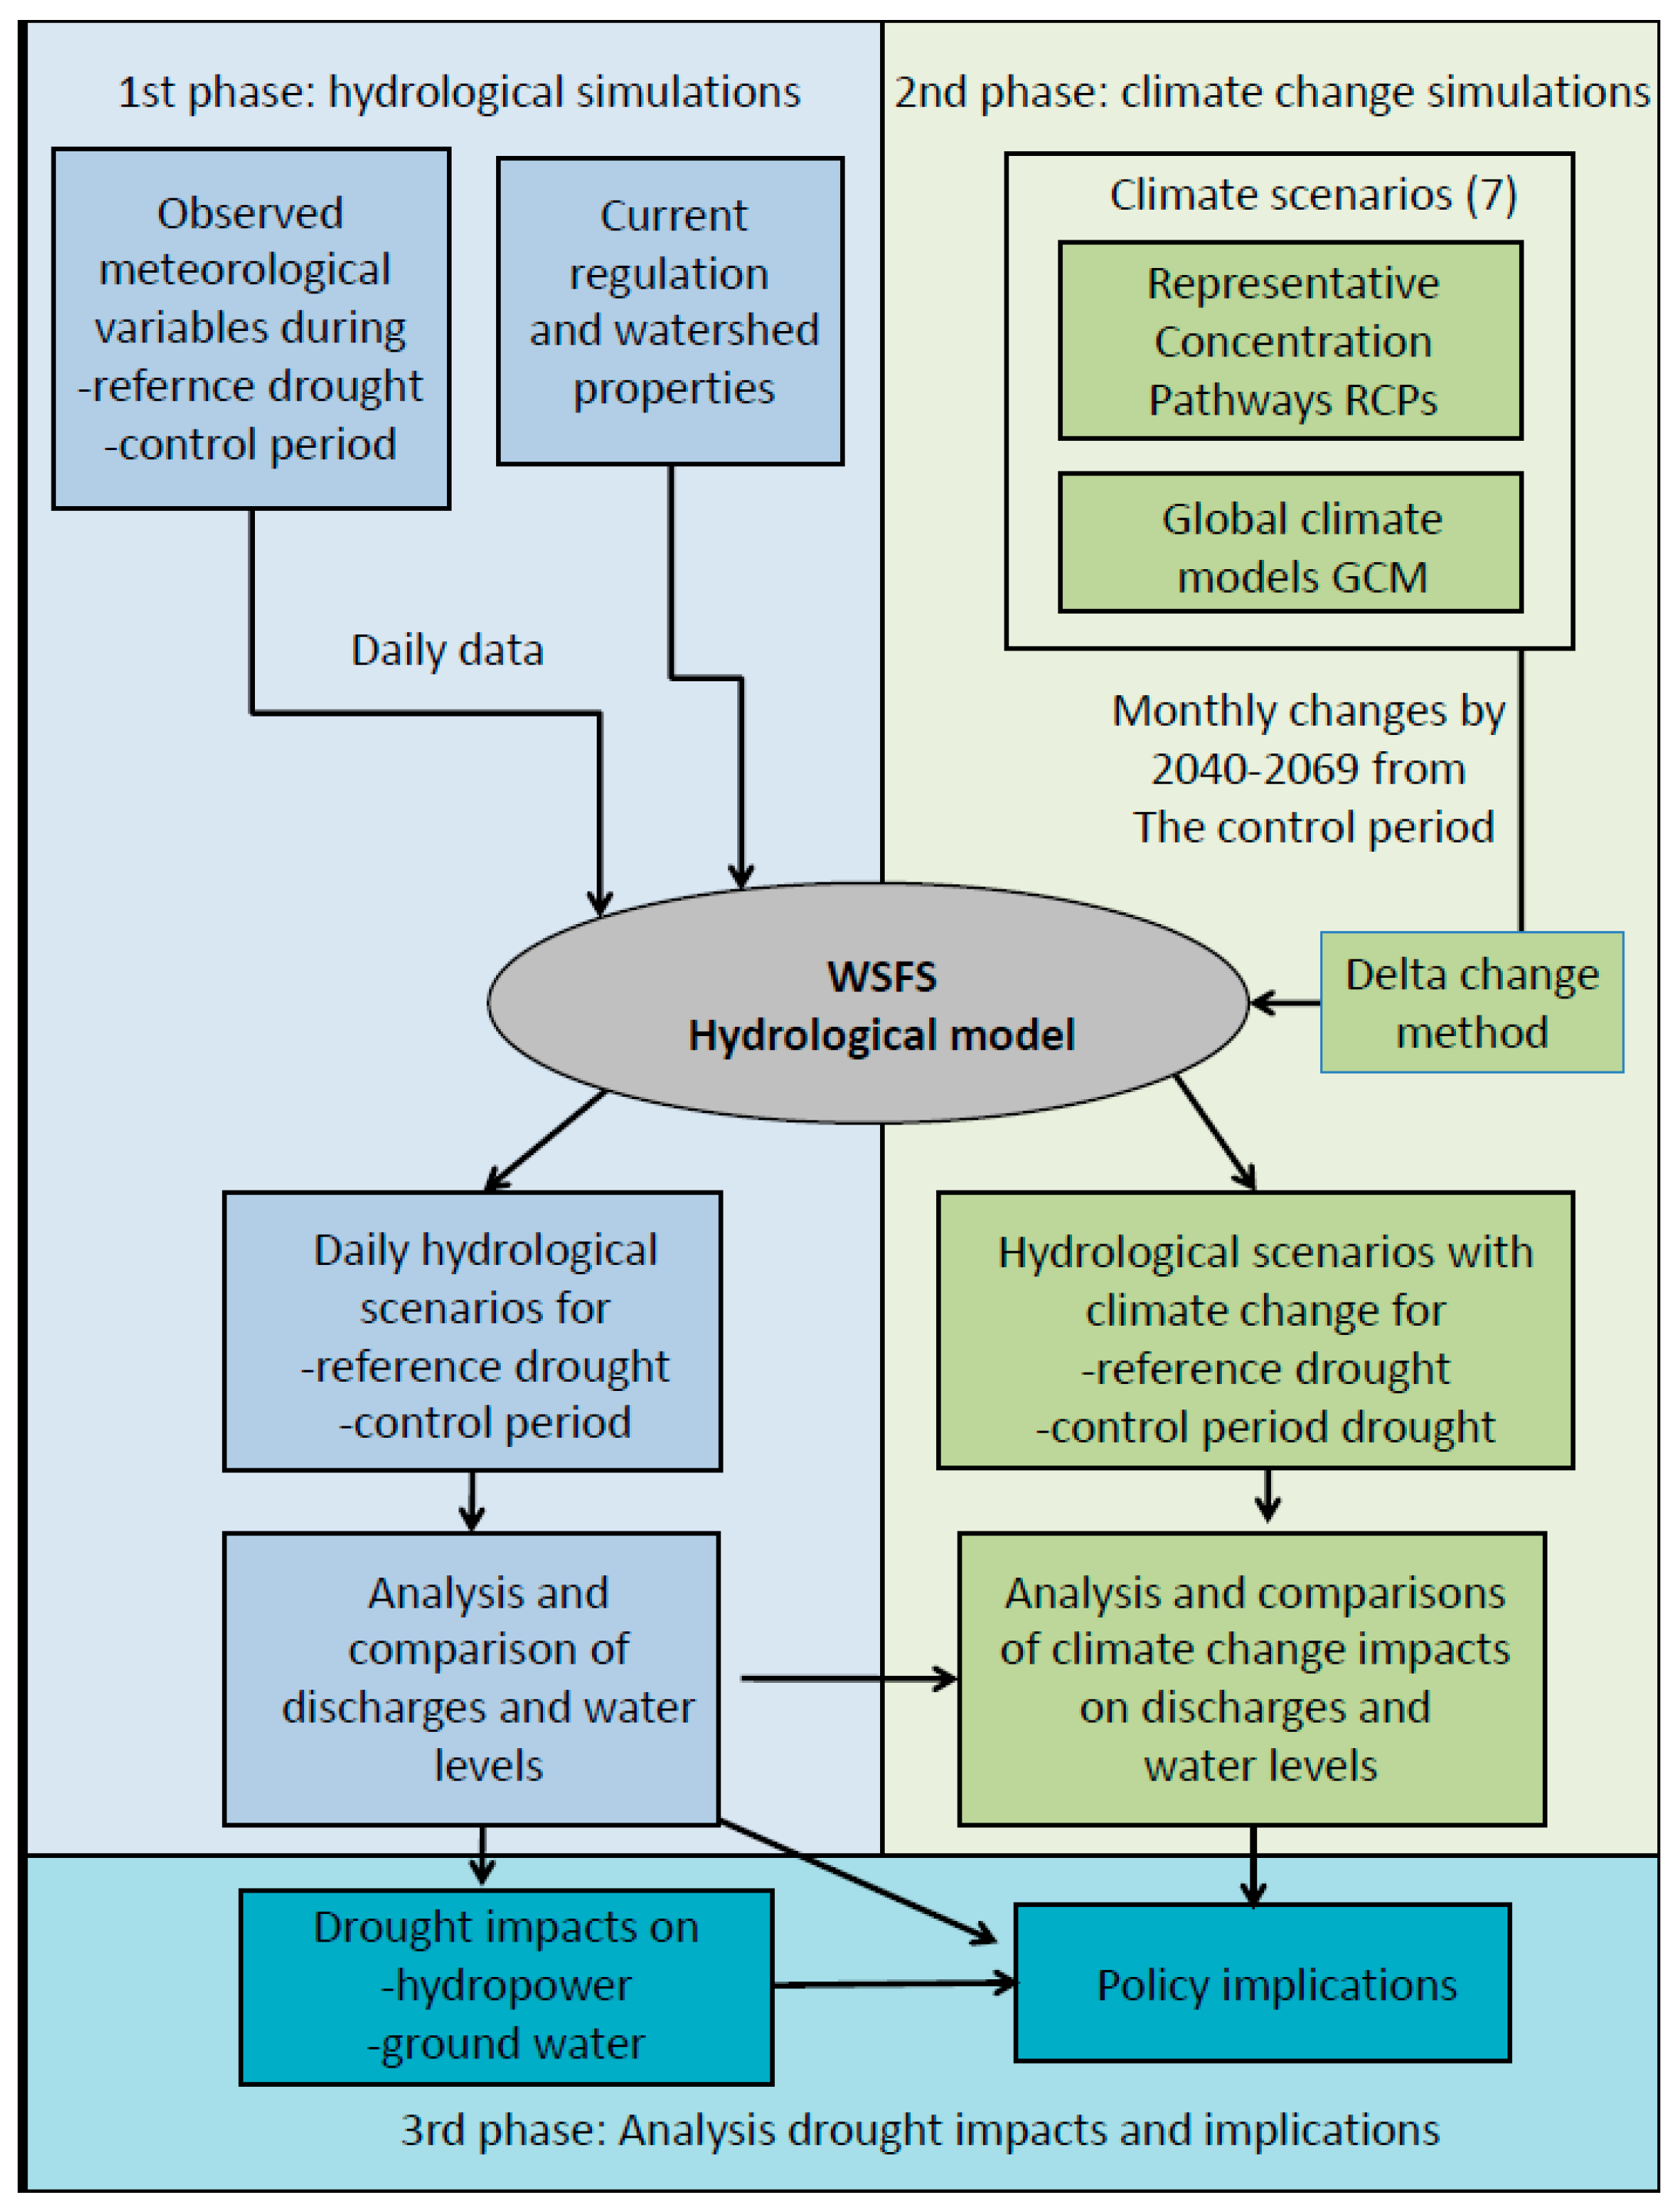
2.3. Study Methodology

The drought impact analysis used in this study included three main phases. The study methodology can be seen in Figure 2. The first study phase included the hydrological modeling of the water levels and discharges during the reference drought in 1939–1942 (Section 2.6) and the control period 1981–2100, using the observed meteorological input variables (Section 2.4) and the hydrological Watershed Simulation and Forecasting System (WSFS) model (Section 2.5). The second phase includes an estimation of the impact of climate change on drought during the reference drought and during the control period using the delta change approach and seven climate scenarios (Section 2.7). In the third phase, the impact of drought on hydropower and the water supply from groundwater were analyzed (Section 2.8) and the policy implications discussed.
To simulate the impact of a severe drought on water resources, the worst drought in recent history (since reliable observation has been available) as the reference. This drought occurred in 1939–1942 (Section 2.5). This drought was selected because it was severe and long-lasting in most of Finland, and its impacts have not been previously estimated. For most of Finland it was the worst drought for which meteorological observations are available. A real drought event is more realistic and easier to justify for stakeholders than an artificial drought generated using a hydrological model.

2.4. Observations and Materials Used

Observations of the daily precipitation, temperature, relative humidity and wind speed that were used as input into the hydrological model were obtained from the records of the Finnish Meteorological Institute (FMI). The meteorological observations from 1938–1942 were used to simulate the reference drought from the period 1939–1942 and meteorological observations from the period 1980–2010 for the simulation of the control period 1981–2010.
For the simulation of the reference drought of 1939–1942, we used data from 35 precipitation stations (four of these did not contain all years), 32 temperature stations, 33 cloudiness observations, six stations for relative humidity, and six for windspeed. Observations were available only for Finland, and therefore the simulation of cross-boundary watersheds was more uncertain. For the simulation of the control period 1981–2010, we used data from approximately 240 temperature measurement stations, 470 precipitation measurement stations, 140 cloudiness observations, 180 wind speed observations and 220 relative humidity observations from the FMI. However, the observation network varied during this period and different numbers of stations were used during different years (the most recent number was from the year 2000). Additionally, observations from approximately 11 temperature and 16 precipitation observation stations in Norway, Sweden, and Russia were used. As can be seen from the number of observation stations, the observation network was considerably sparser in 1939–1942 than 1981–2010.
All precipitation observations contain gauging errors and the catch error for snow are especially significant and need to be corrected [33]. The observations for 1981–2010 were corrected with aerodynamic, evaporation, and wetting corrections based on air temperature and wind speed observations [34]. However, in 1939–1942 the precipitation measurement devices differed from the current devices used, with a Wild wind shield in use in the 1930s and 1940s. The Wild windshield had poor aerodynamic properties and therefore the catch error for snow was large [35]. For 1939–1942 the observed precipitation was corrected using a simpler method than that used for 1981–2010, since the aerodynamic, evaporation, and wetting correction factors were not available for the Wild windshield, and since there were too few wind observations to be used for the correction. For the 1939–1942 period, constant corrections for snow and rain were used. The estimates for these corrections for the Wild type wind shield were based on the literature, and the factors were 1.43 for snow and 1.05 for rain [35].
In addition to meteorological observations, water level and discharge observations were used to evaluate the results for 1939–1942. Since we used present-day land use and lake regulation practices in the hydrological model simulations, the daily simulated results for the 1939–1942 weather may differ from those observed in 1939–1942. However, over a period of one year or longer the impact of regulation decreases (since water is mainly stored seasonally and inter-annual storage is small) and the average observed discharges can be compared with the corresponding simulated discharges (Section 3.1).

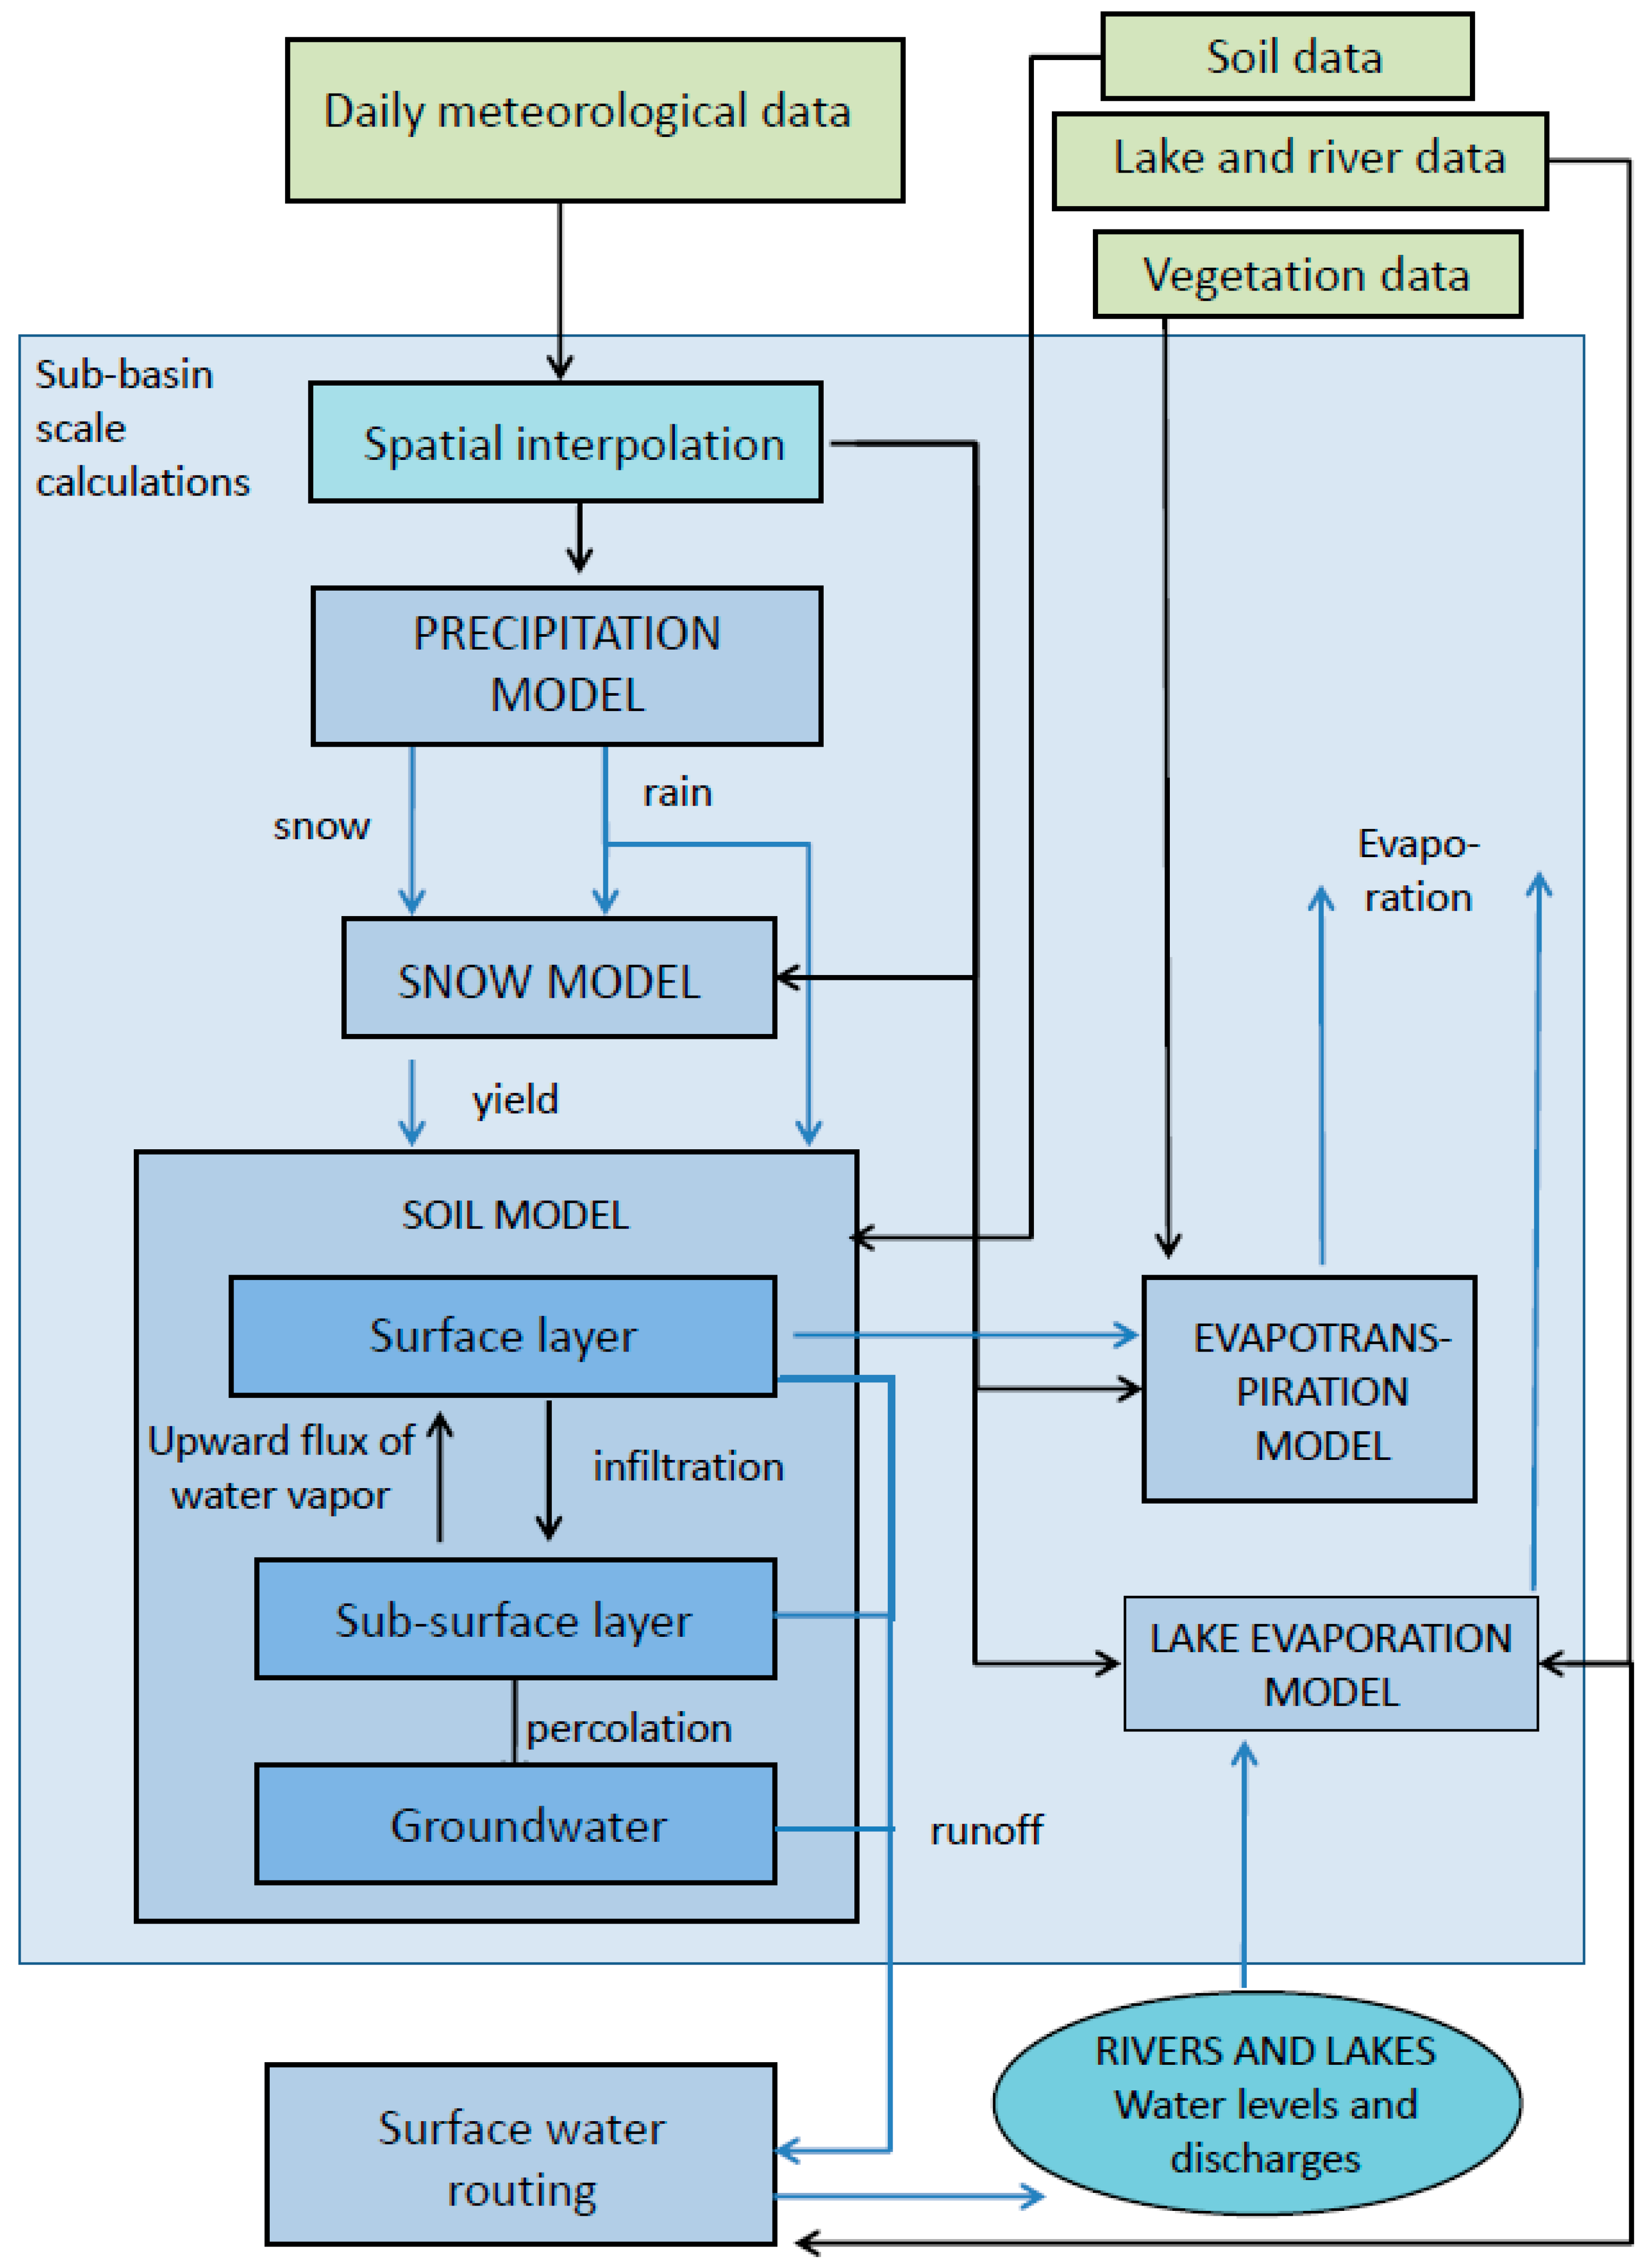
2.5. First Analysis Phase: Hydrological Model

In the first phase of the study, hydrological modeling of the reference drought and the control period (used for comparison) was carried out using the Finnish Environment Institute’s Watershed Simulation and Forecasting System (WSFS) hydrological model [36,37]. The same model was also used to estimate the changes projected by climate scenarios (Section 2.6). WSFS is used as the national hydrological forecasting and flood warning system in Finland, and also for regulation planning and research purposes, such as climate change impact assessment [15,38,39]. The rainfall–runoff model in the WSFS is based on the HBV model developed by the Swedish Meteorological and Hydrological Institute (SMHI) [40].
The input data for the model were the observed daily temperature, precipitation, wind speed, humidity, air pressure and cloudiness (Section 2.4). From the point measurements of the observation stations, an areal value for each sub-basin was calculated based on the three closest stations with observations for each day. These areal values were then used in the water-balance simulations for each sub-basin. The outputs from the WSFS model included the daily snow amount, soil evaporation, and runoff for each sub-basin, the discharge for sub-basin outflows and water levels, lake evaporation, and outflows and inflows for each modeled lake.
The water-balance simulations in the WSFS hydrological model were conducted at the sub-basin scale, with over 6000 sub-basins of varying size (approximately 20–500 km2) [36]. From each sub-basin the water was then routed to the following sub-basin based on the river and lake network. Present day lake regulation rules and water structures were used. The WSFS includes all lakes in Finland with an area over 1 km2 (approximately 2600 lakes).
For the hydrological simulations, a new and more physically-based version of the WSFS hydrological model was applied (Figure 3). This version includes an energy-balance-based snow model, a rainfall–runoff model with a two-layer soil moisture model and lower groundwater storage and evapotranspiration and lake evaporation models. Other sub-models in the WSFS include a precipitation model and models for lake and river routing (Figure 3).
The snow model is based on the energy balance of the snowpack (RTOT, Equation (1)), which determines the snowmelt. It has been described in detail by Vehviläinen [37].
RTOT = RSN + RLN + RLAT + RSEN + RP + RG − CO
where
  • RSN = net shortwave radiation
  • RLN = net longwave radiation
  • RLAT = latent heat flux
  • RSEN = sensible heat flux
  • RP = heat content of liquid precipitation
  • RG = heat exchange of the soil surface
  • CO = heat deficit of the snowpack (cold content)
In the evapotranspiration model, the evapotranspiration of a reference crop is calculated based on the Penman–Monteith formula for each land use class [41,42]. The total evaporation of a sub-basin is calculated as a weighted average of the evaporation of different land use classes in the sub-basin.
The soil moisture model that has been described in more detail by Jakkila et al. [43] was applied. The soil moisture model is divided into two layers, a surface layer and a sub-surface layer. These layers produce runoff to the rivers and lakes, and the sub-surface layer produces percolation to groundwater storage. The soil properties used by the soil moisture model include soil porosity, field capacity, wilting point, and hydraulic conductivity [43].
These more physically-based sub-models improve the reliability of the model, especially during drought (when evapotranspiration is more important than in normal situations), as well as during climate change simulations. When using the Penman–Monteith formula, changes in potential evaporation depend not only on changes in temperature and precipitation, as was the case in previous studies [39], but also on changes in wind speed, relative humidity, and radiation or cloudiness. Simple estimation methods for potential evaporation can overestimate the increase in evapotranspiration due to climate change [44], while more physically-based methods offer more reliable results.
Groundwater was modeled for the whole of Finland using the simple groundwater model of the WSFS, which calculates groundwater storage. For groundwater stations, the groundwater levels are simulated based on the effective porosity calibrated against observed groundwater levels [45].
The WSFS model parameters were calibrated against observations of the snow water equivalent, the extent of the snow-covered area, snow depth, lake water level, and discharge. The period used for model parameter calibration was 1980–2016. The automatic calibration procedure used a modification of the direct search Hooke–Jeeves optimization algorithm [46] to find an optimal set of parameters. The same model parameters were used in all the simulations.

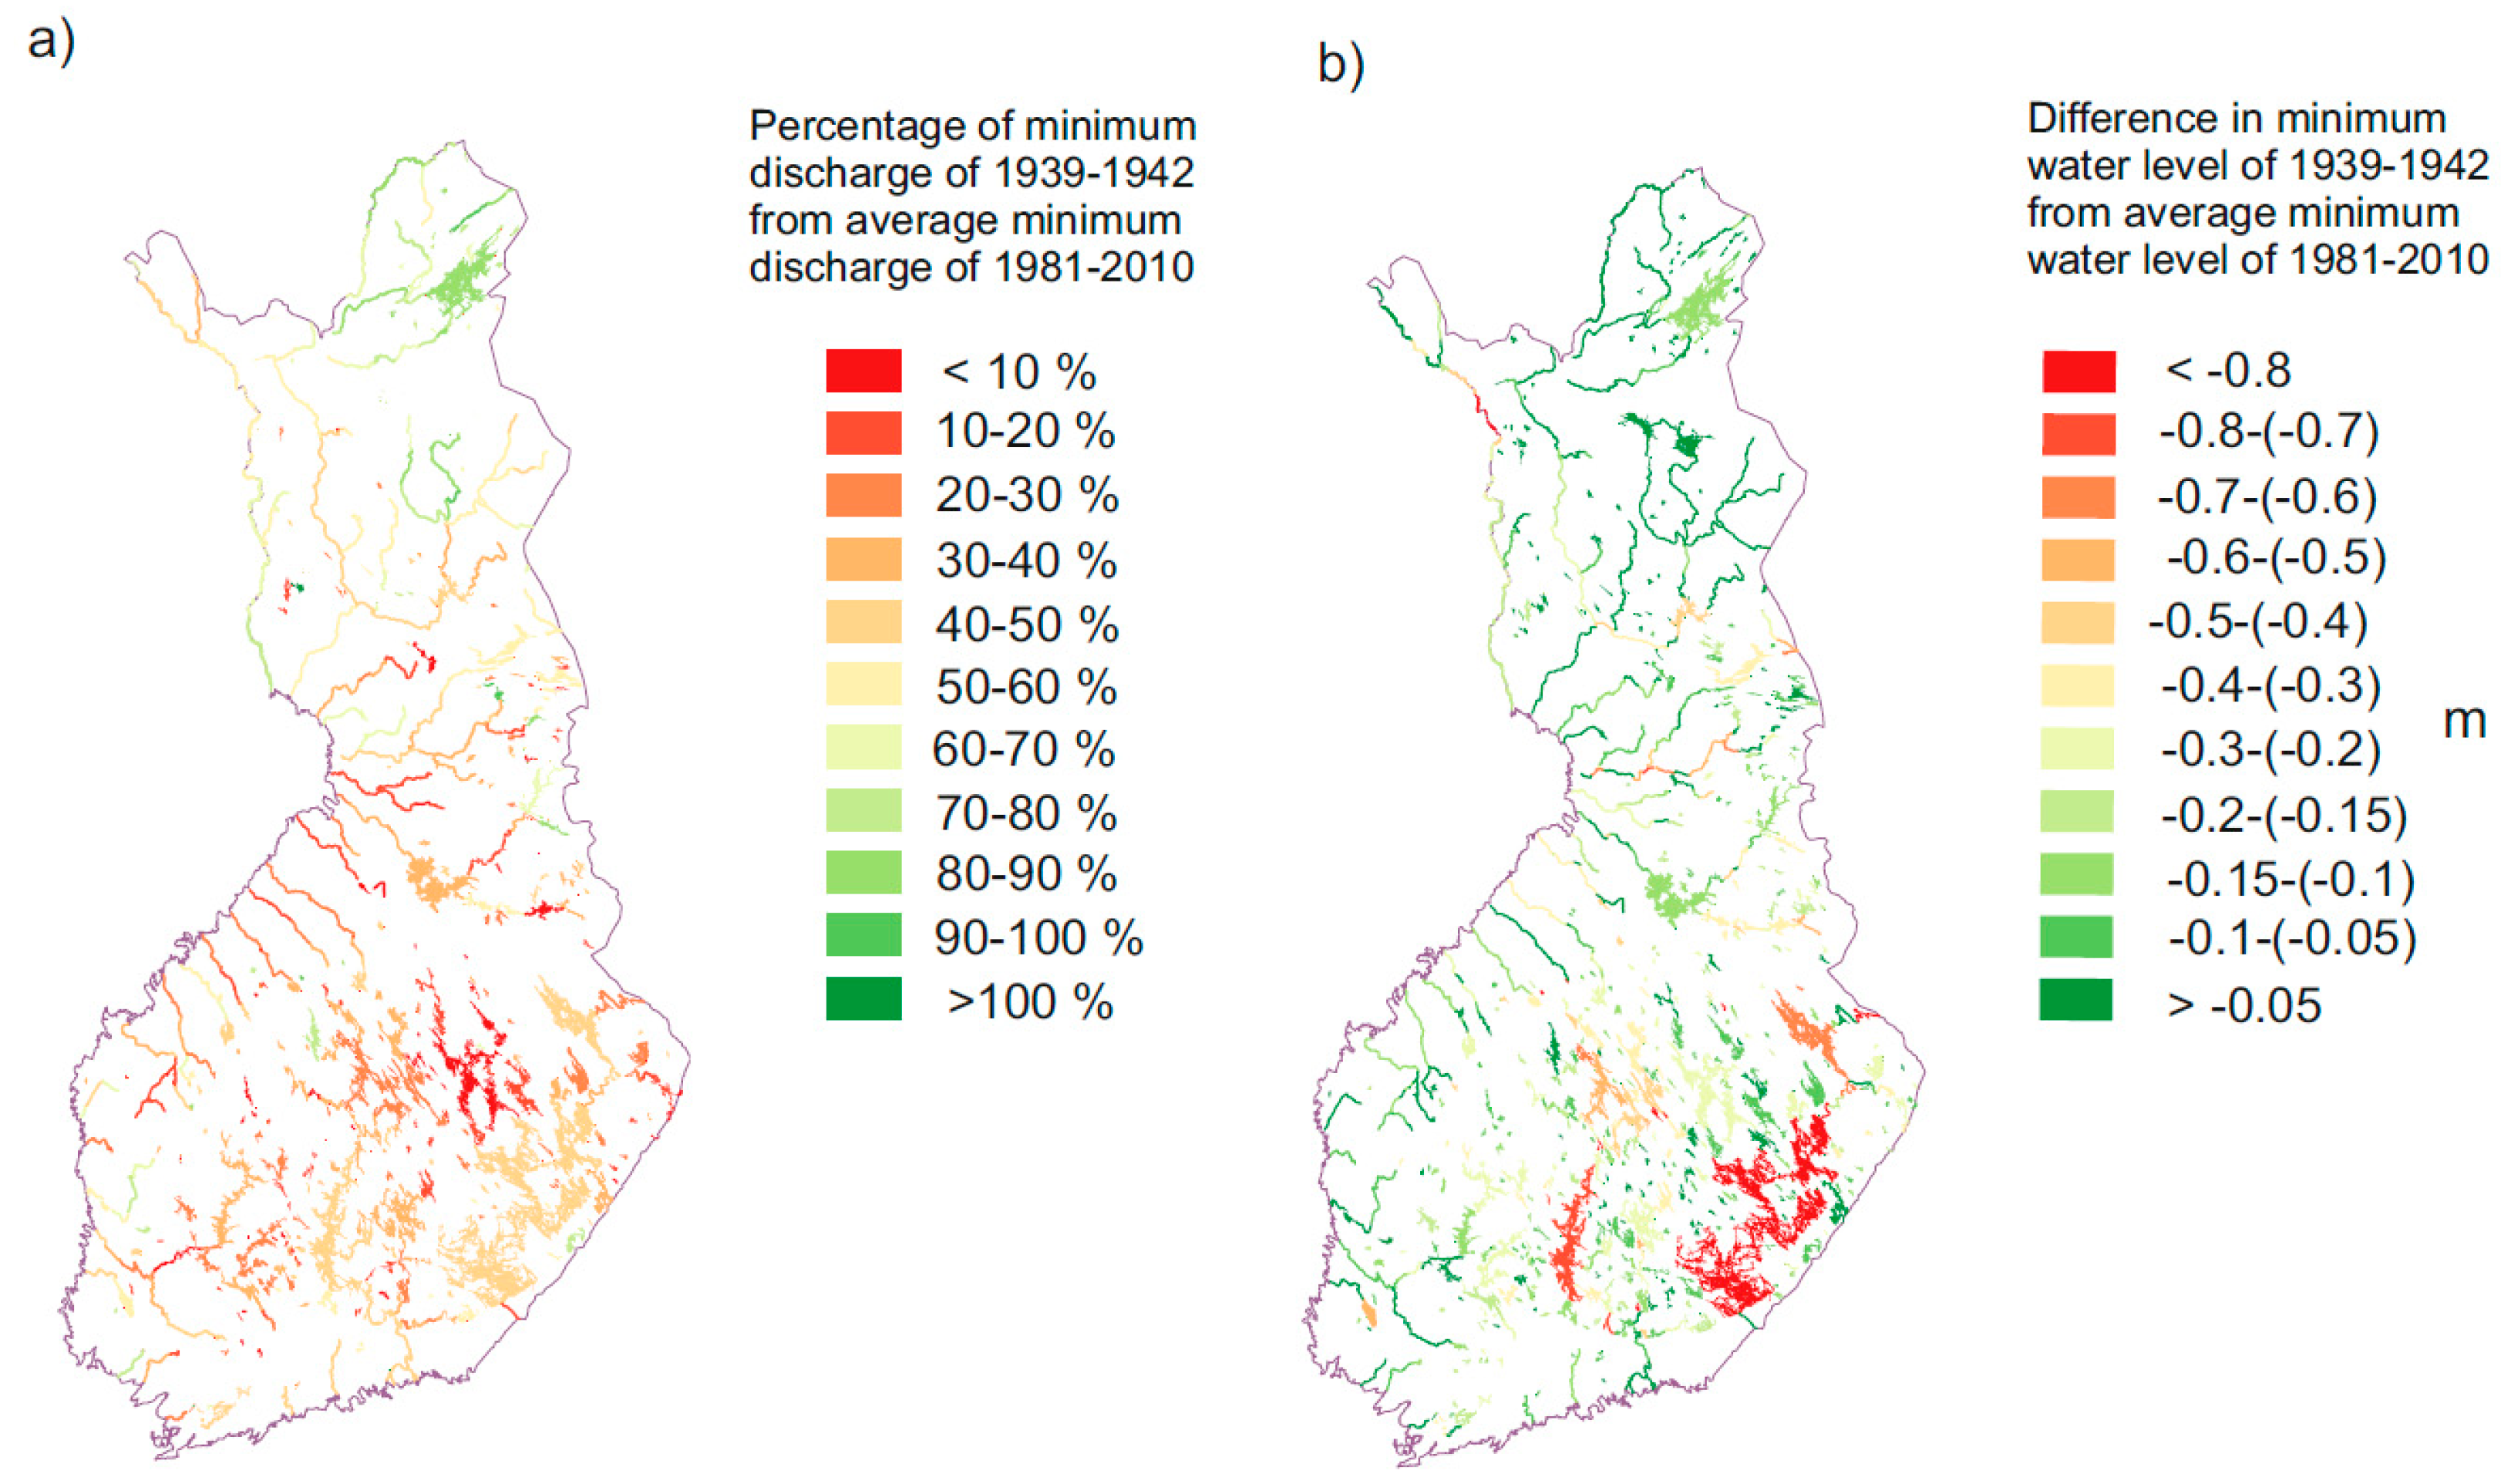
2.6. The Drought of 1939–1942 as a Reference Drought

The reference drought of 1939–1942 was used to estimate the drought impact. The observed uncorrected annual precipitation sum was the lowest recorded in 1941 (precipitation observations start from 1844 and the observation network became comprehensive in the 1910s). The precipitation level in 1941 for Finland was on average 394 mm, which is 40% lower than average of 1981–2010 and corresponds to a return period of approximately 100–150 years [47,48]. In addition, 1939 and 1940 were among the twenty driest years of the 20th century. Tree ring data (dendrochronology) [49,50] and estimates of inflows [51] show that 1939–1941 was a dry period in the entire Nordic region. The first half of 1942 was also drier than average, while during the second half precipitation was above average. The years 1940–1942 were colder than average and during the winters of 1940–1941 and 1941–1942 the amount of snow was large. In South-Eastern Finland, tree ring data from the 9th century onwards indicate that the early summer periods of 1940 and 1942 were among the ten driest in the data and clearly the driest in the 20th century [50].
The area influenced by this drought covered most of Finland; only Northern Finland had precipitation levels close to average. The observed water levels and discharges were in many locations the lowest recorded. Kuusisto [48] estimated that in 1941 the average discharge from the rivers in the Finnish territory to the sea or neighboring countries was the lowest of the 20th century, at approximately half of the average value. In Lake Saimaa, where there have been water level observations from 1847 onwards, the lowest observed water level was in 1942, and the second lowest in 1941. The return period of the water levels and discharges during the drought was different in different parts of the country, in the most severe locations in Central Finland the estimated return period was greater than 150 years [47].
The drought in 1939–1942 had a large impact on food production. The hay harvest was only half the normal size and the cereal harvest was only two thirds of the usual size [47]. However, the impact of the drought is difficult to distinguish from the impact of the Second World War, which hindered adaptation, took resources (e.g., manpower and horses from agriculture) and reduced the possibility to import materials such as fertilizers.

2.7. Climate Scenarios

The second phase of the analysis looked at how climate change would alter the simulated minimum discharges and water levels during the control period and during a severe drought with different climate scenarios. Climate change will alter the hydrological regime in Finland and also the seasonal distribution of water. The implications of climate change for droughts and low water levels in the period 2040–2069 were assessed using the delta change method [52] and seven climate scenarios (Table 1). In the delta change method, monthly changes in precipitation, wind speed, relative humidity and solar radiation are multiplied by observed variables from the control period or the reference drought period (see Equation (2), which is similar to the equation for calculating precipitation). To obtain the temperature, the temperature change was added to the observed temperature, and a seasonal temperature-dependent component was also included to account for different changes in different parts of the temperature distribution (Equation (3)) [53].
Pmod = Pobs * ΔP
Tmod = Tobs + ΔT = Tobs + sm(asTobs + bs)
where
  • Pmod/Tmod = the modified daily precipitation/air temperature
  • Pobs/Tobs = the observed daily precipitation/air temperature
  • ΔP/ΔT = the precipitation/temperature change
  • sm = the monthly scaling factor
  • as, bs = the coefficients of the seasonal linear transfer functions
The climate scenarios used were based on the Global Climate Models (GCM) used in the IPCC Fifth Assessment Report [54], which used the representative concentration pathways (RCPs) for scenarios of future greenhouse gas concentrations [55]. Three RCPs, namely 2.6, 4.5, and 8.5 were selected for use. The scenarios included an average scenario, calculated as the average in the 2.5 degree (lat/long) grid over Finland used by FMI, and based on the results of 28 GCMs for the three RCPs [16]. Additional results from four individual GCMs for RCP 4.5 were selected from an ensemble of 28 climate scenarios to represent the extremes of changes. These scenarios represent warm and wet, warm and dry, cold and wet, and cold and dry conditions for RCP 4.5, where greenhouse gas concentrations by the end of the century are moderate (Table 1). From the gridded values of the GCMs the changes were interpolated for each sub-basin based on the four closest grid points.

2.8. Analysis of Drought Impact on Key Water-Use Sectors

The third phase of the analysis aimed at understanding the potential societal and economic impact of drought, focusing on water supply and hydropower as key water-related sectors. A brief analysis to assess the impact of drought on hydropower and water supply at the national scale was carried out. The economic impact on other key water-related sectors (e.g., agriculture, forestry, navigation, recreation), as well as the potentially substantial environmental and societal impact are beyond the scope of this analysis and were therefore not assessed (but will be briefly discussed).
Water supply is considered a critical infrastructure, as both societal well-being and resilience is fundamentally built on its reliability. Groundwater is essential for water supply in many parts of Finland. Of the municipal water supply, 63% is dependent on groundwater, in addition Finland has approximately 600,000 private wells [56]. Water supply companies using surface water are usually less prone to drought since they usually use water from large waterbodies. Industry would also experience some difficulties with water supply during a drought, although most of the water-intensive industries (i.e., the paper and pulp industry) have been built close to large lakes and rivers with ample supply. Mines (39 operating mines in Finland in 2016) are located next to the ore deposits, which can be next to head water and smaller water bodies. Water demand and availability during the same reference drought is assessed in more detail by Ahopelto et al. [24].
The impact of drought on discharges and hydropower production was simulated with the WSFS hydrological model using current hydropower capacity and daily discharges simulated for the location of the 57 largest hydropower plants in Finland (all plants with a capacity of 10 MW or more). The simulated discharges, capacities and maximum outflow capacities were used to estimate weekly average hydropower production during the reference drought using the weather in the period 1939–1942. The same results have been analyzed by [13] in regard to the impact on energy sector power adequacy during the peak demand period (i.e., a cold period with high demand for electricity) in January.

3. Results

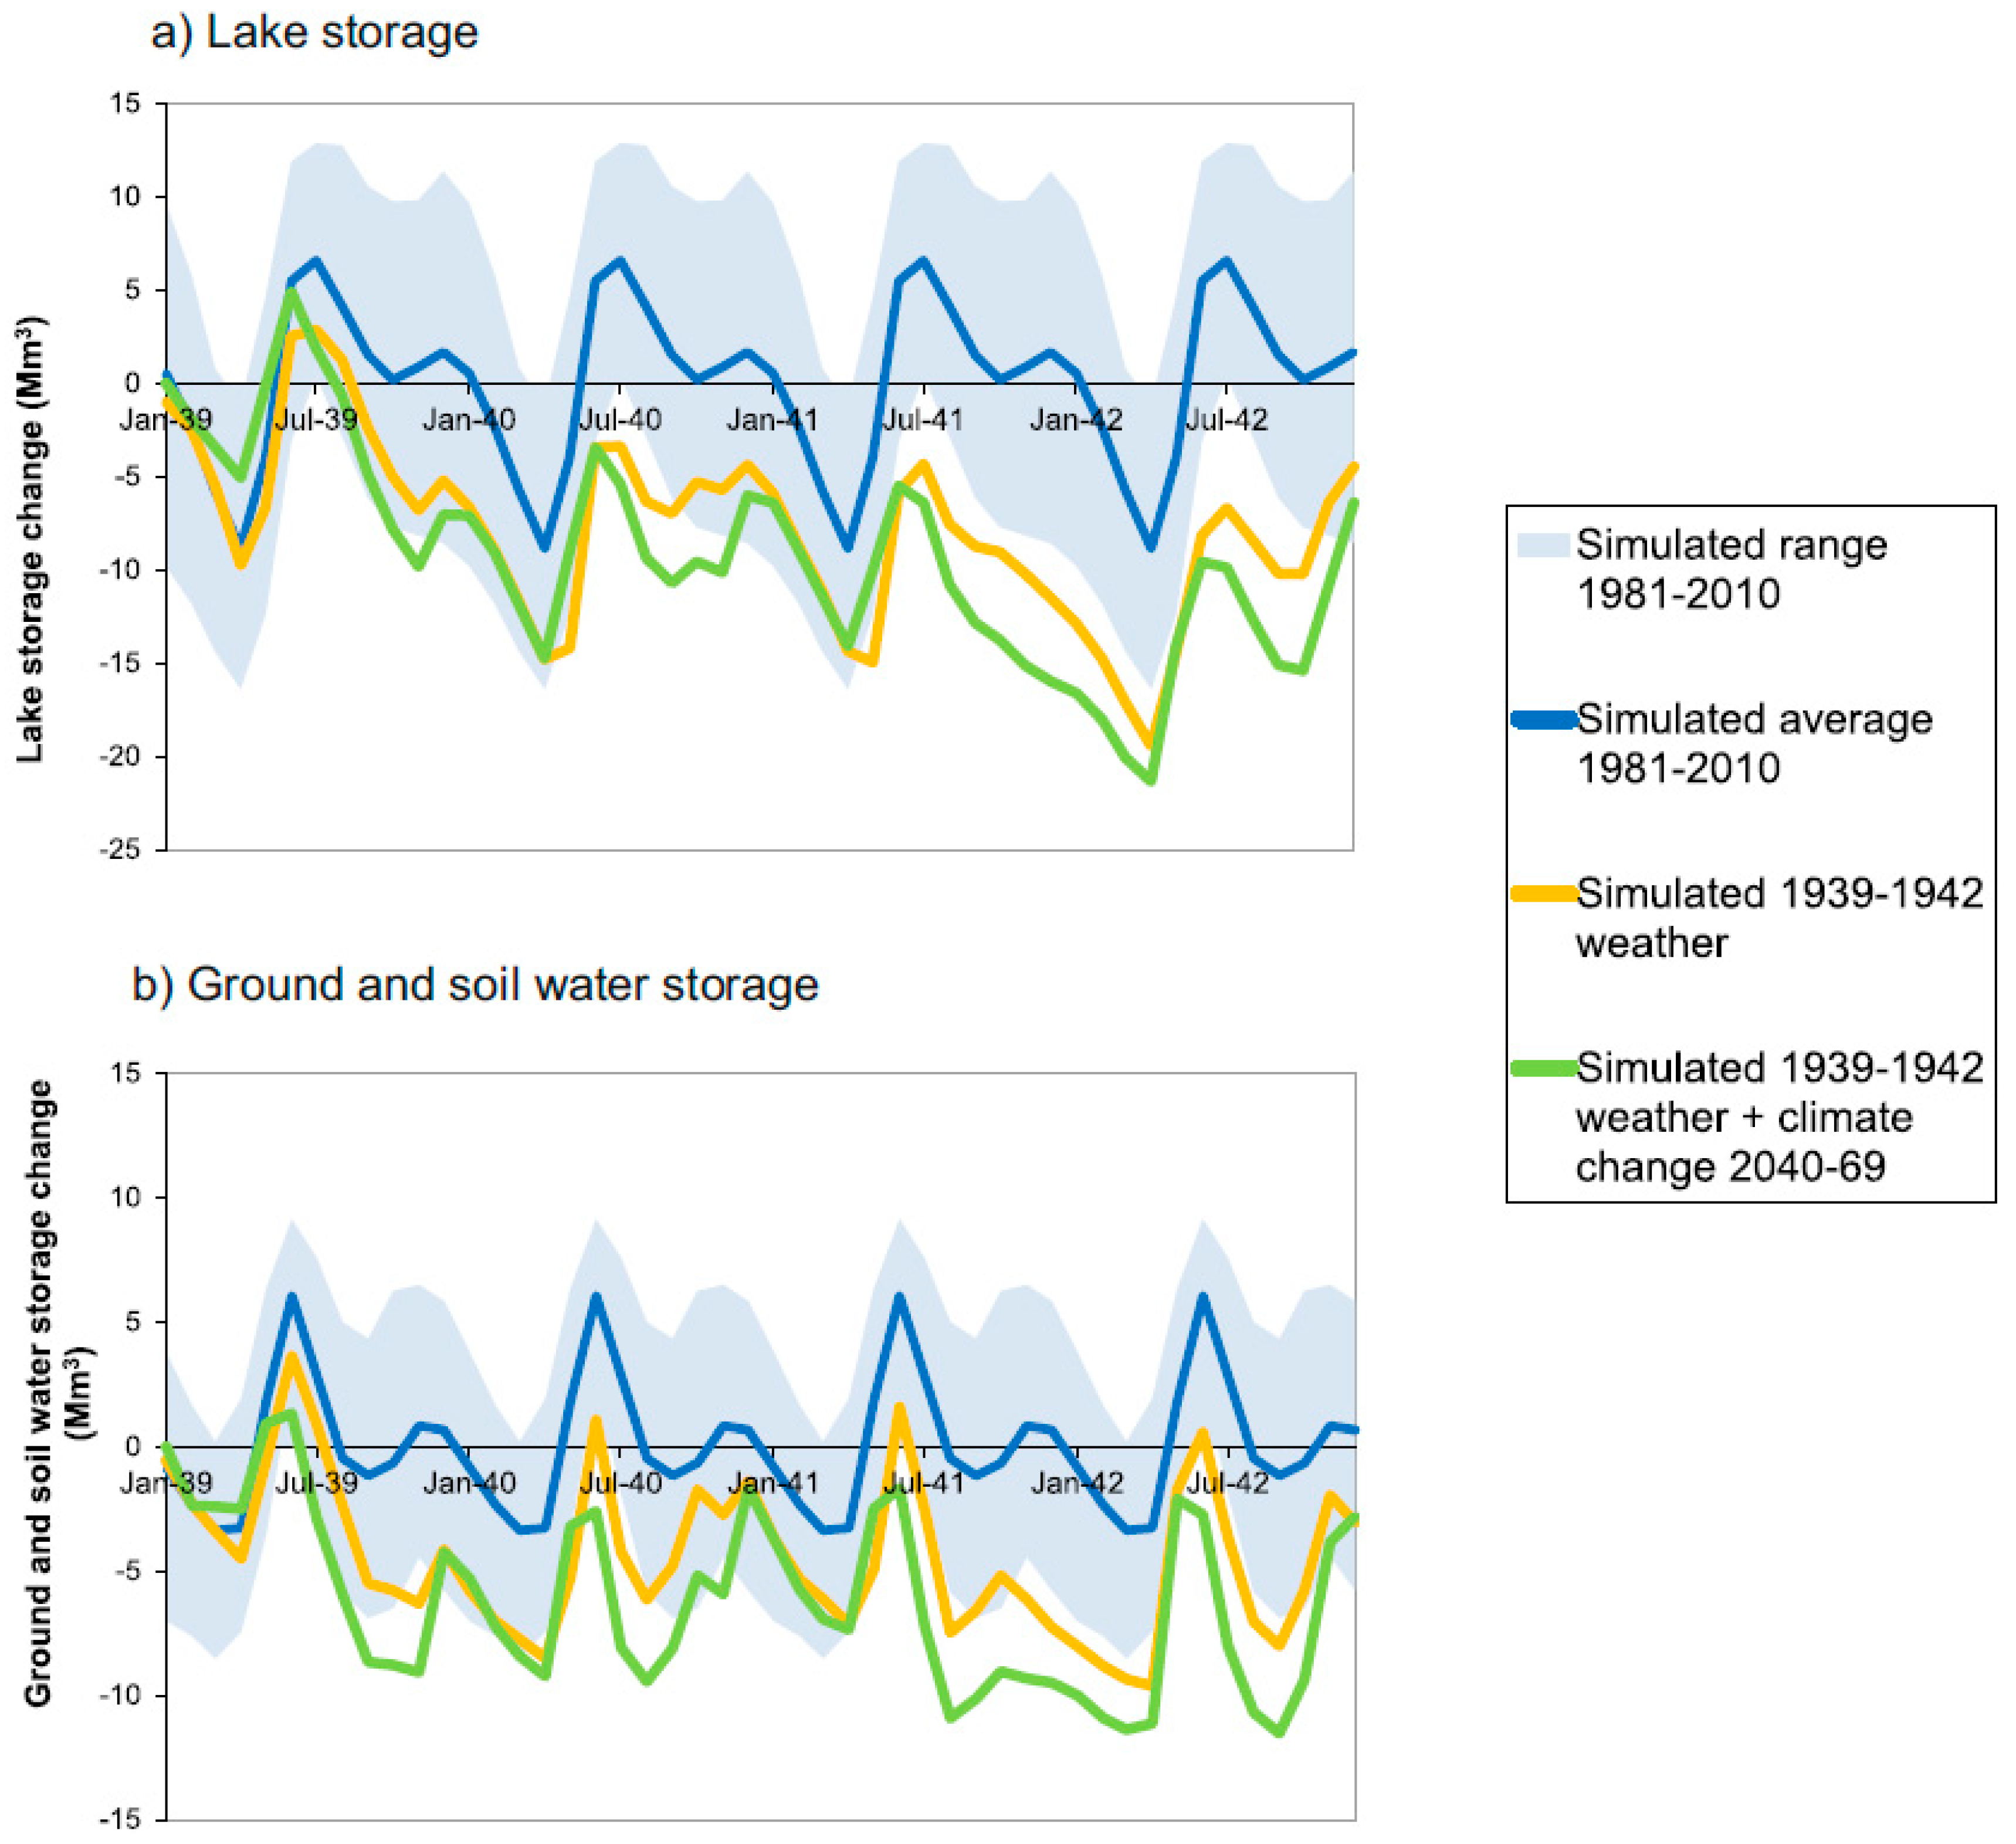
3.1. Hydrological Results: Impact on Surface Water and Groundwater

3.1.1. Surface Water

Comparisons of the observed discharges of 1939–1942 and the simulated discharges for the reference drought of 1939–1942 were carried out in five large rivers for which observations were available (Table 2, for locations see Figure 1). All these watersheds have undergone land use changes and changes in the regulation of lakes since the 1940s, and the daily observations were therefore not comparable to the simulated values. The regulation of previously natural state lakes has begun in several places, and in Lapland new reservoirs have been built. The comparison of long-term averages showed that the difference between the simulated and observed values varied from –8 to +10% (Table 2). Taking into consideration the changes in watershed land use since the 1940s and the uncertainties in the simulated discharge, the results can be considered to be in relatively good agreement with the observations. The uncertainties included possible errors in the observation of discharge and meteorological variables (including considerably sparser observation networks especially influencing uncertainties in estimating the areal precipitation, and older types of precipitation gauges), and limitations in the hydrological model simulation. These uncertainties had no effect on the achievement of the study’s objectives, because our purpose was not to exactly replicate the drought in 1939–1942, but to assess the impact of a similar reference drought in present-day and future conditions for current water resources.
A comparison of the simulated discharges and water levels using the weather from the reference drought period and current regulations and watershed arrangements and the simulated values for the period 1981–2010 are shown in Figure 4. The minimum discharges during the modeled drought were smallest in South-Eastern, Western, and Central Finland (Figure 4a) when compared to the average annual minimum discharge of the control period. In these areas, the minimum discharges were only 20–50% of the average annual minimum values, which are extremely low discharges for Finland. In Northern Lapland, the discharges were close to the average minimum values, and the drought was not particularly severe. Thus, the severity and the return period of the simulated drought depended on the location.
The timing of the lowest water levels differed in different locations. In the largest lakes (with an area approximately above 100 km2), the lowest water levels occurred only during the last year of the reference drought (corresponding to 1942), while in the small and medium-sized lakes the lowest water levels were in most cases at the end of the summer in the second or third year. In the largest lakes, the inflow remained low for an extended period, and even occasional periods with greater precipitation were not enough to significantly increase the inflow, while the smaller lakes responded much faster to precipitation in the smaller catchment areas. In many of the strongly regulated lakes, the lowest water levels usually occur during the winter and are more strongly affected by regulation rules used than by drought.
The water levels fell to the lowest, compared to the average annual low water levels, in the largest lakes with limited regulation. The lowest water levels were 50–90 cm below the average low water levels and occurred in Lake Saimaa (including lakes in the same lake complex with almost the same water level) in South-Eastern Finland, Lake Pielinen in Eastern Finland and Lake Päijänne in South-Central Finland (Figure 4b, for locations see Figure 1). In most of Finland, the water level difference compared to the average annual lowest water level was modest at only 10–30 cm, since many lakes have a natural lower water level bound below which the outflow becomes very small. In Lakes Saimaa, Päijänne, and Pielinen the outflow remains relatively large even with low water levels, and the length of the drought meant the water levels had time to fall very low. These lakes are all regulated, but the possibilities to decrease discharge are limited. For example, in Lake Saimaa (South-Eastern Finland) the outflow must be at least 300 m3/s or related to the natural rating curve as stipulated by the agreement with Russia, where the Vuoksi river (outflow river of Lake Saimaa) flows [57]. On some other large lakes, such as Oulujärvi, the water level remained near normal levels due to more efficient regulation possibilities, but the outflow was 50–70% smaller than the average annual minimum values.

3.1.2. Groundwater

Groundwater tables were simulated for three selected groundwater stations in different parts of Finland (Figure 5). The groundwater tables also decreased to very low levels during the reference drought period. The lowest water levels occurred mostly during the two last years of the reference drought period, but in small groundwater formations the water tables already dropped to very low levels during the autumn of the first year of drought. The minimum levels for many stations were lower than during the shorter drought period of 2002–2003, but the differences were relatively small. The simulated drought period affected the station situated in Central Finland (Figure 5b) more than that in South-Western Finland. This result implies that Central Finland may be especially vulnerable to severe drought periods than earlier studies [56,58] have predicted. This phenomenon was also seen during the drought of 2018, when the all-time lowest groundwater table levels were measured in Central Finland in small and shallow aquifers [59].

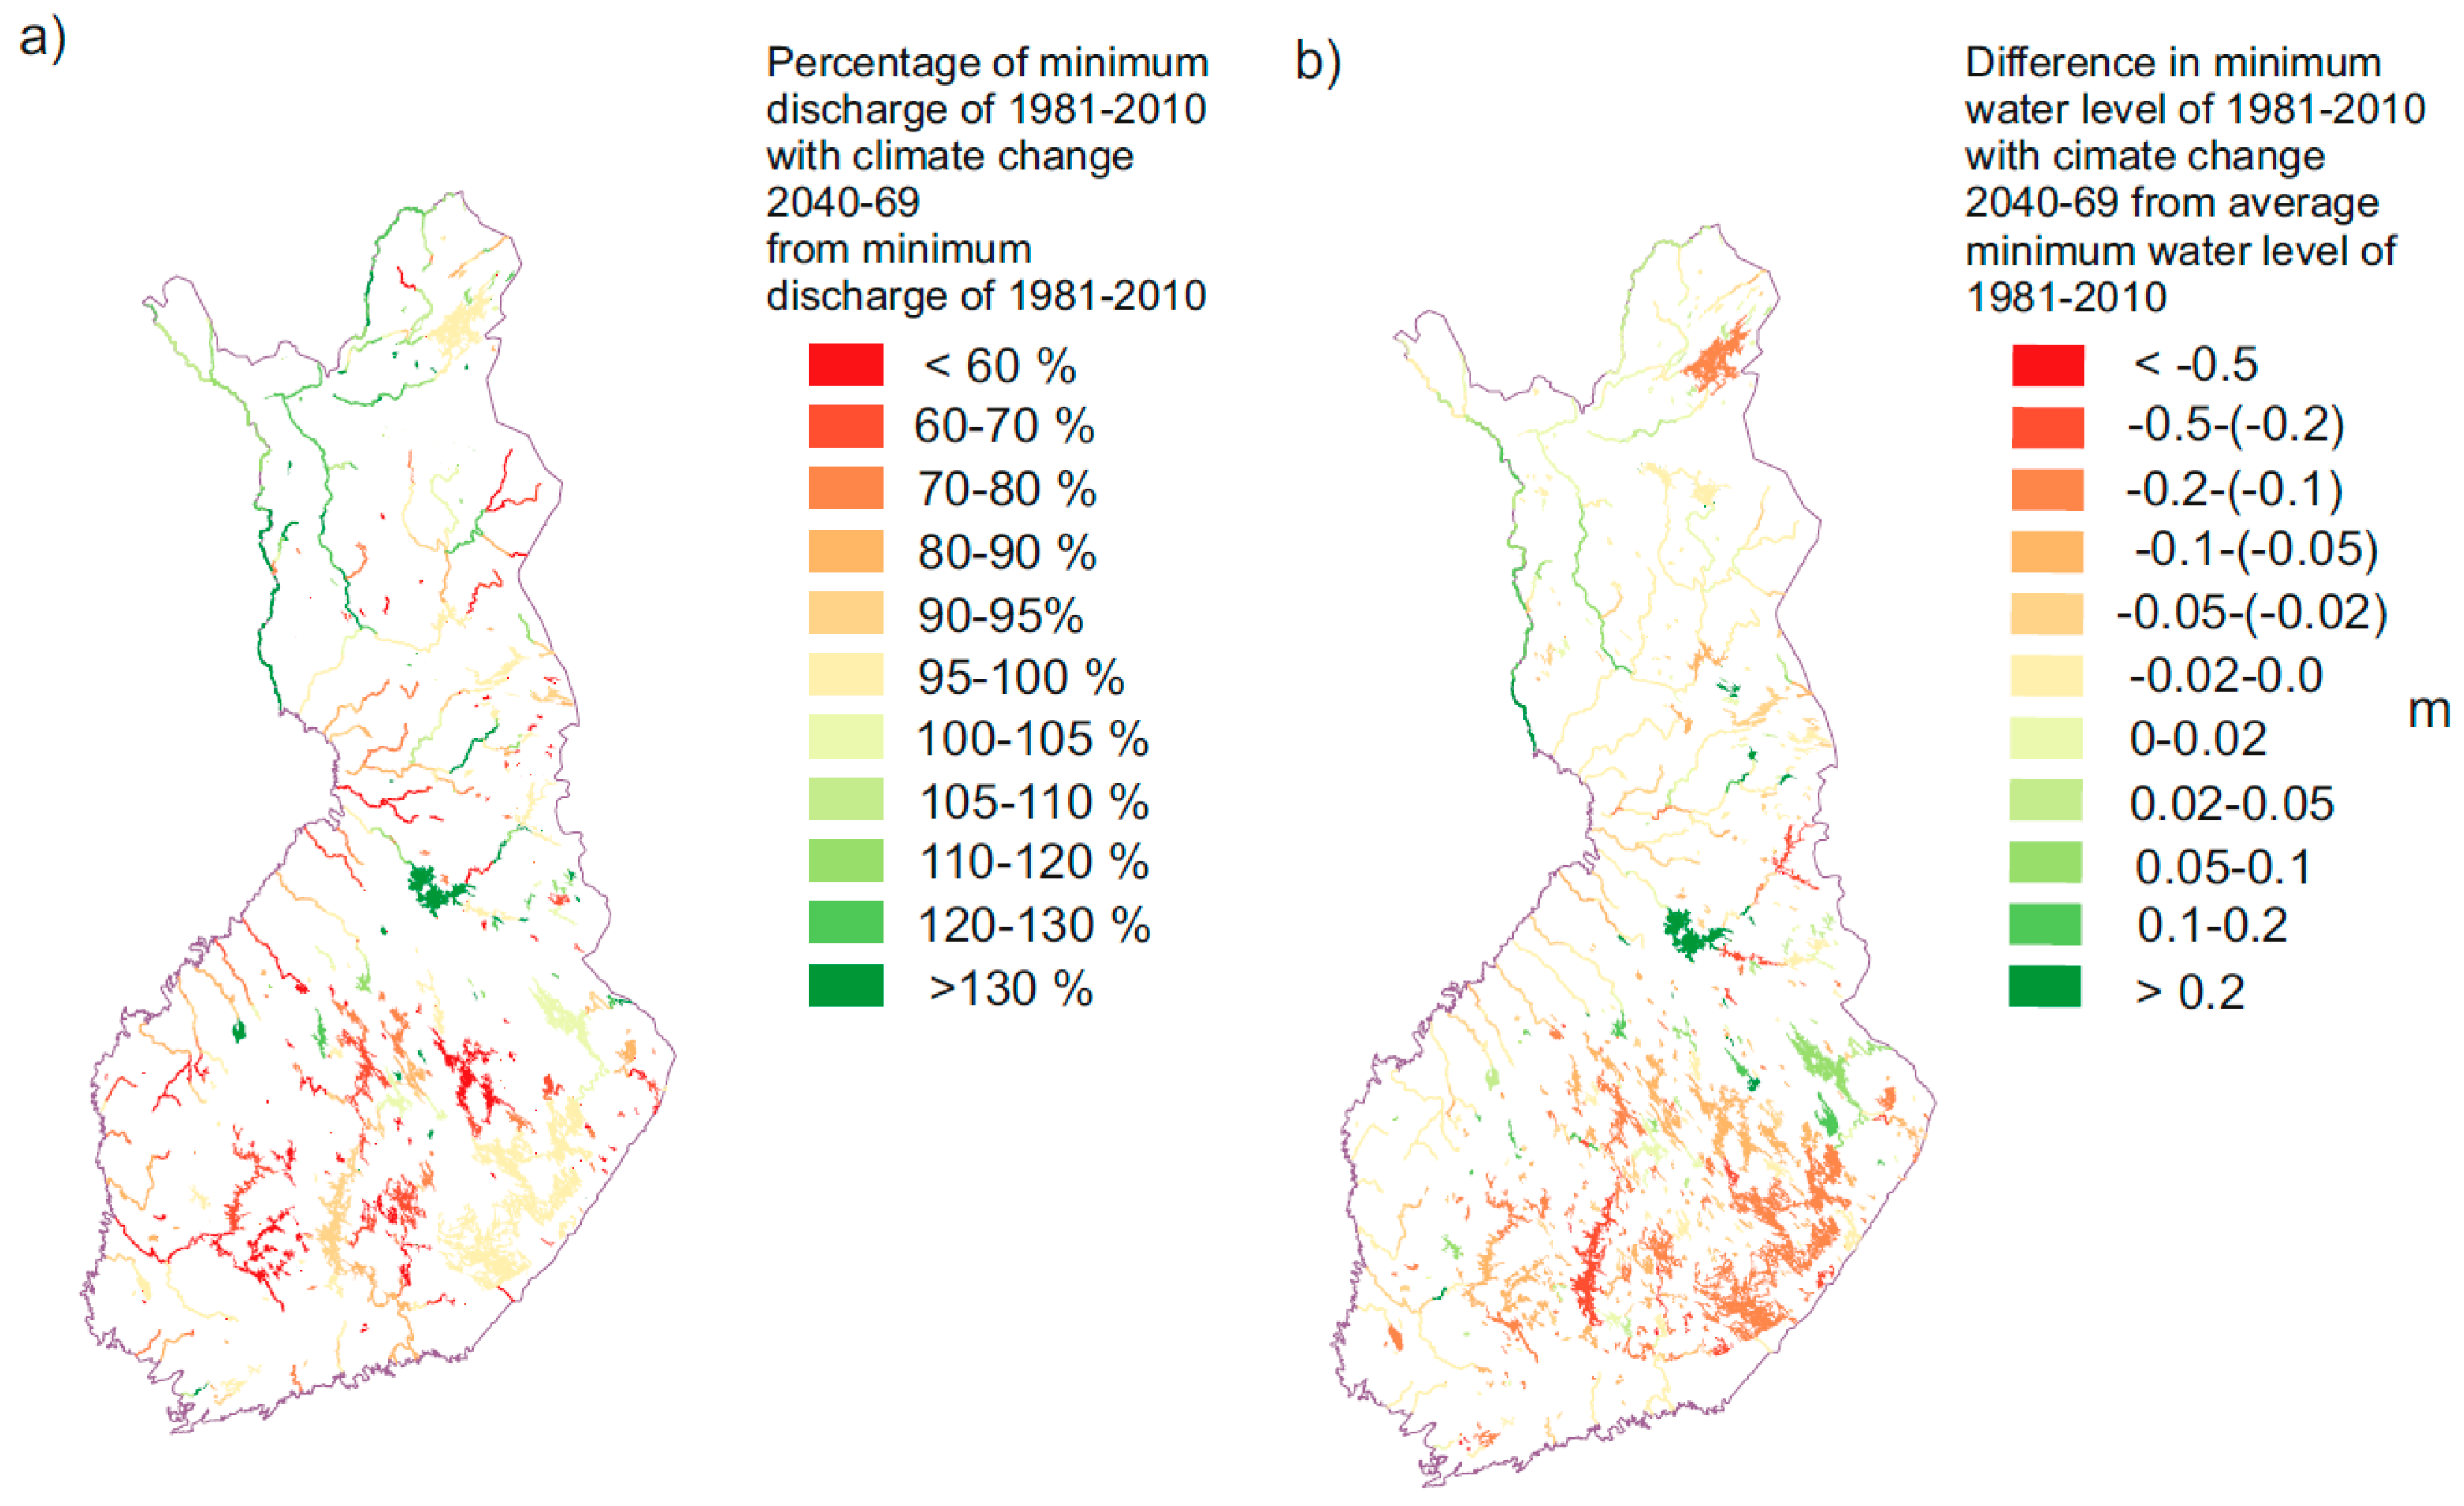
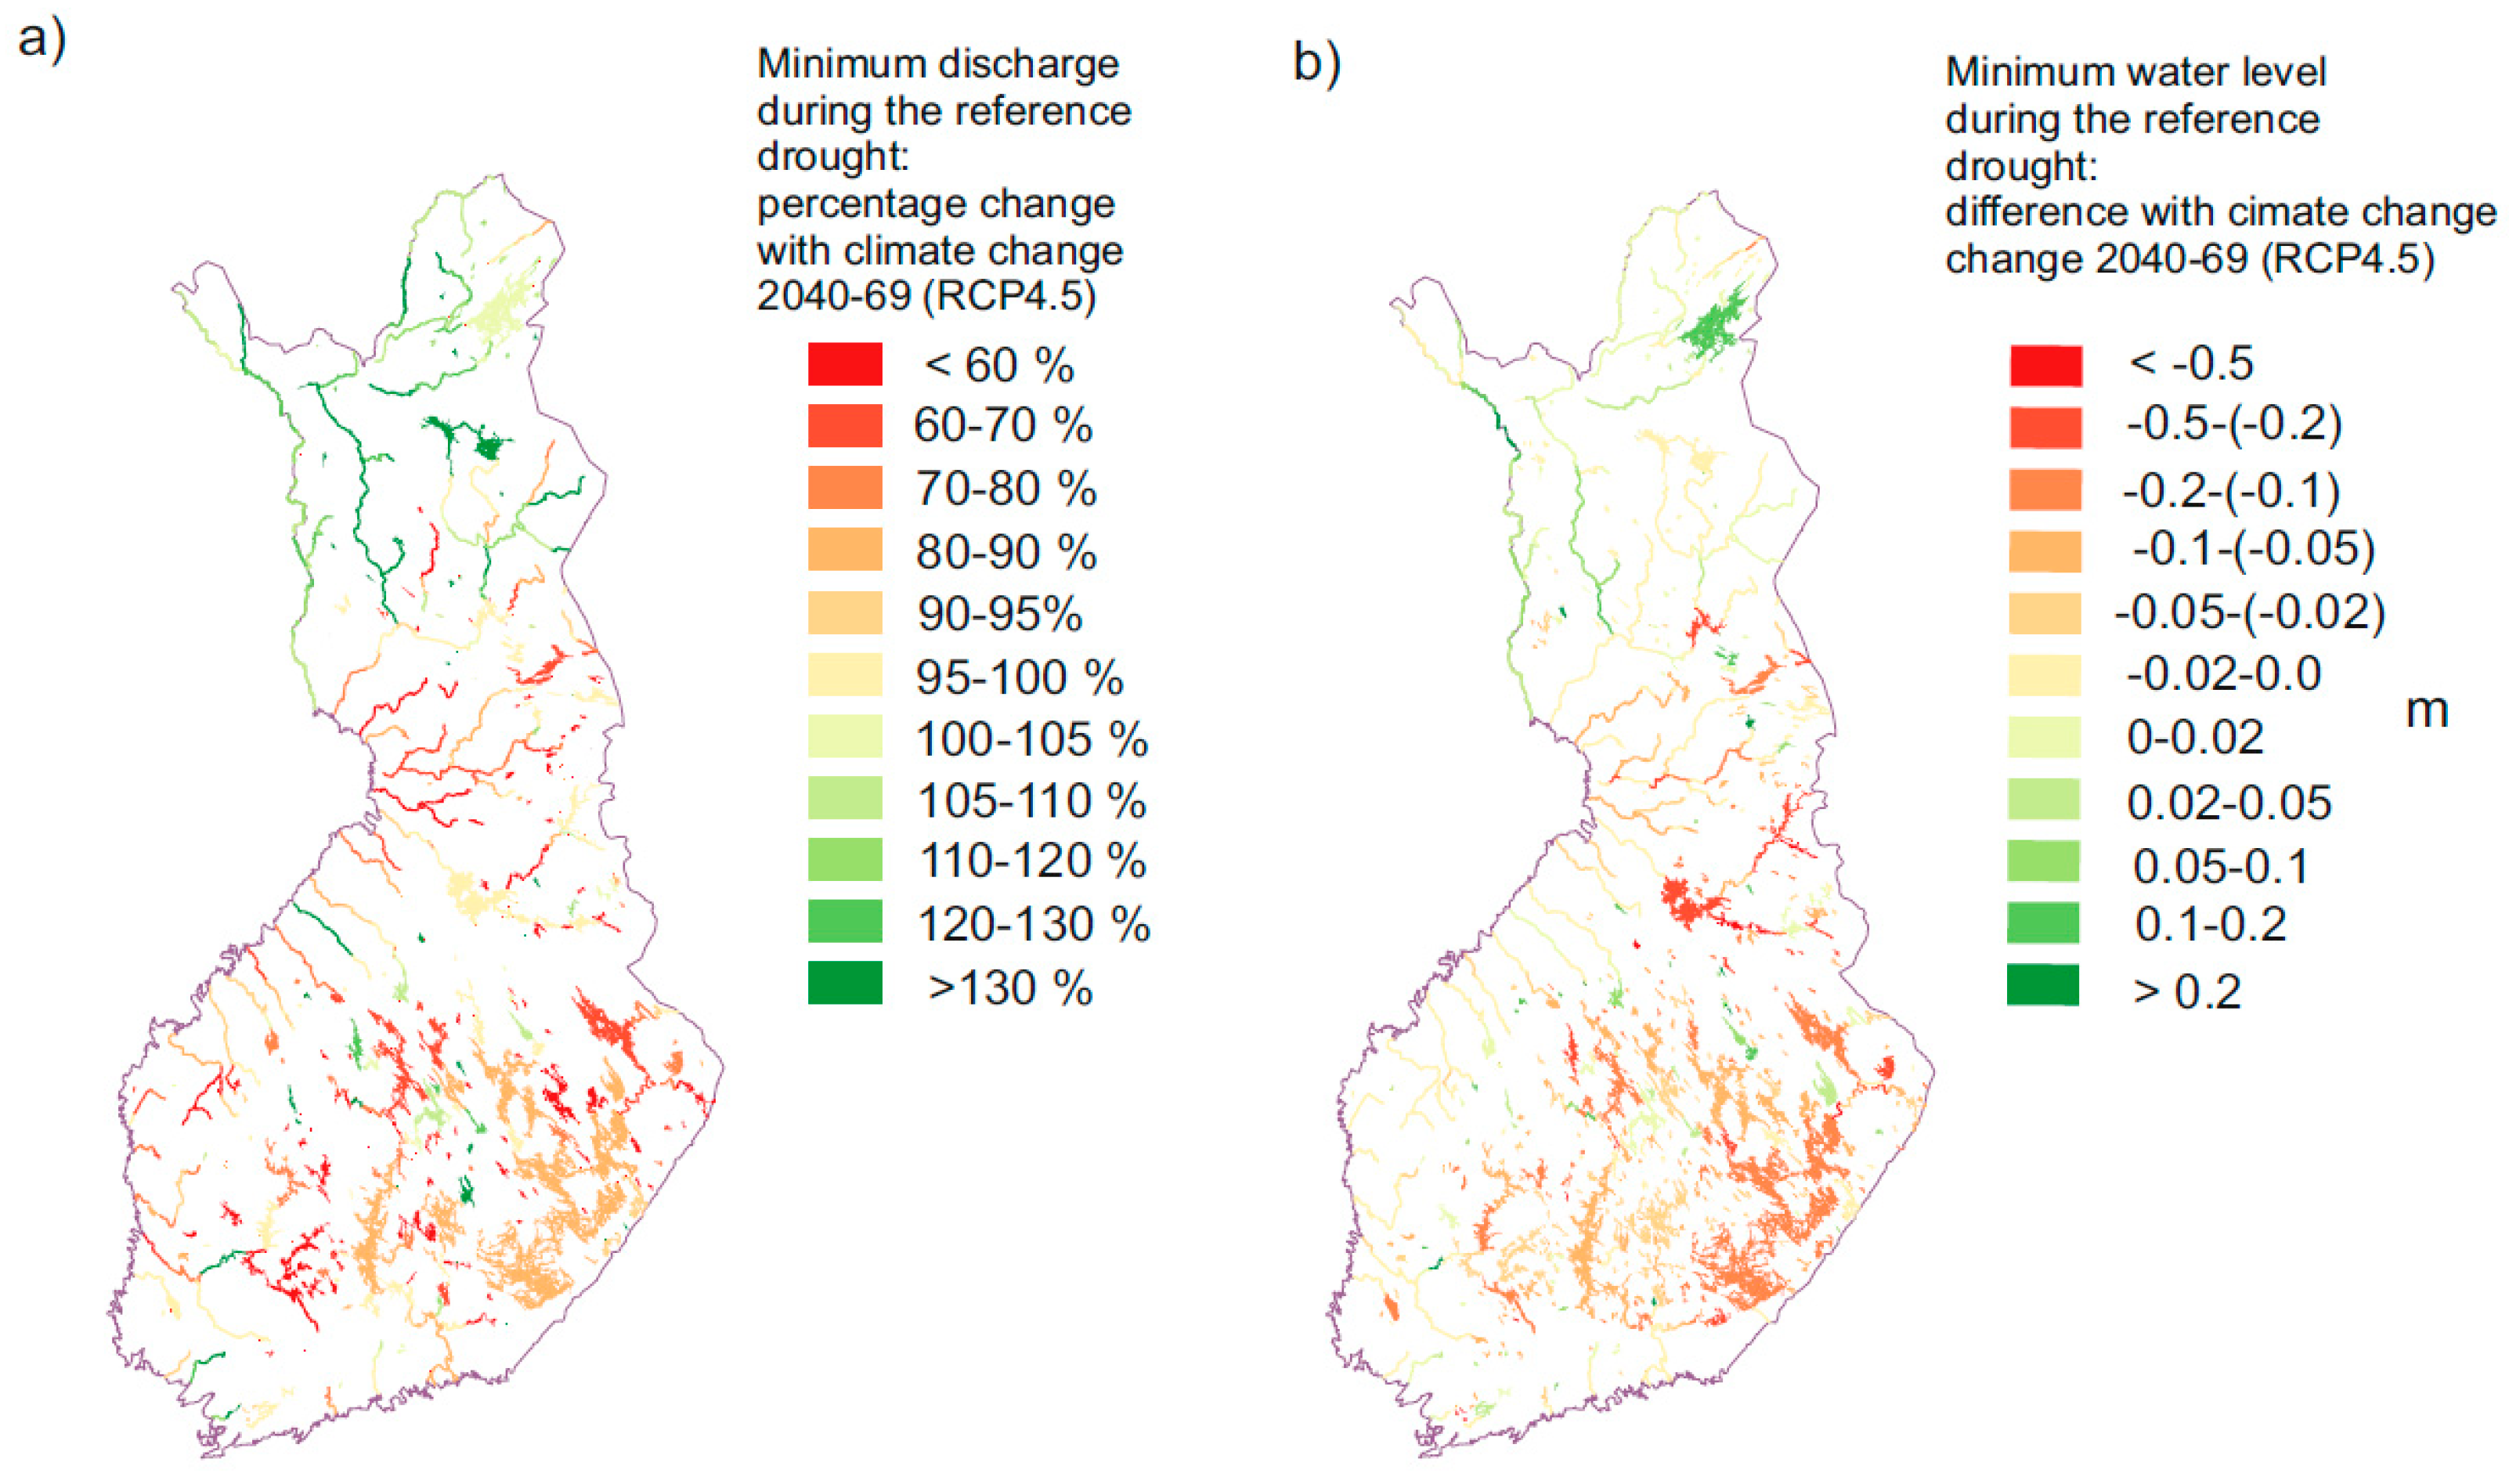
3.2. Climate Change Impact on Discharge and Water Levels

In Finland, climate change is predicted to increase the average precipitation, leading to mostly larger average discharges [16,39]. Generally, the increase in average discharge will be larger in Northern Finland, where the increase in precipitation was also larger and the lake percentage was smaller. Besides the precipitation, the evapotranspiration will also increase, and therefore the increase in discharge will be smaller than the increase in precipitation [15,39]. Lake evaporation in particular, which is not limited by the availability of water, will increase with rising temperatures.
The climate change impacts were first assessed for a more common drought event, namely the minimum discharges and water levels for the control period 1981–2010 modified with climate scenarios for 2040–2069. The return period of the minimum discharges and water levels of the control period was approximately 20–40 years. The results show that climate change affects the minimum discharges differently than the average discharges. The minimum monthly average discharges (Table 3) and minimum daily discharges (Figure 6) in 2040–2069 mainly decreased compared to the control period. The average discharges increased (Table 3), except in the driest climate scenarios. The decrease in minimum discharges was due to the changes in the timing of the discharges. With warmer temperatures there will be less snow accumulation during winter and earlier spring floods caused by snowmelt. During summer, evaporation combined with evapotranspiration is generally higher than precipitation and the discharge and storage commonly decrease. This was also the case for the future scenarios, since the projected increase in precipitation was smaller in summer than during winter, and the evaporation increased with warmer temperatures. With an earlier spring and longer summer, as well as a longer growth period and more evapotranspiration, the minimum discharge during late summer and early autumn (typically August or September) will be lower in 2040–2069 than during the control period. In Southern and Central Finland, all the modeled climate scenarios projected decreases in the minimum discharges, while in Northern Finland five scenarios projected decreases, but one scenario, with the largest precipitation increase, projected a notable increase.
The minimum discharges during the reference drought also mainly decreased with the climate scenarios for 2040–2069 (Table 3, Figure 7a). On average in Southern and Central Finland, the projected range of decreases in the minimum discharge was between 8 and 16%, while in Northern Finland the changes range from a 3% increase to a 17% decrease (Table 3). For different rivers and lake outlets, the decreases were mostly between 5 and 40% with the average RCP 4.5 scenario (Figure 7a). In addition, the water levels mainly decreased, with modest 5–20 cm decreases on most lakes and rivers (Figure 7b). In places where climate change increased the discharge and water levels, the timing of the minimum discharge and water level was mostly during winter, due to either the northerly location or lake regulation. The increase is caused by the increased melting of snow during winter due to increased temperatures.
The range of changes under the different climate scenarios remains large, which demonstrates the large uncertainties involved in future climate change (Table 3). The differences between the scenarios, and especially between the different RCPs, will become even larger by the end of the century. For Southern and Central Finland, however, the climate signal is robust, producing decreases in all the simulated scenarios.
Figure 8 shows the modeled development of the total lake storage (for lakes over 1 km2) and soil and groundwater storage for Finland during the reference drought (conditions of 1939–1942) compared to the period 1981–2010. For one and a half years, the storage levels of the reference drought were lower than the minimum values for the summer of the third year of drought in 1981–2010 (corresponding summer 1941). Climate change (the average RCP 4.5 scenario) will further decrease the storage levels during the latter part of the reference drought.

3.3. Impact of Severe Drought on Selected Water-Related Sectors

3.3.1. Hydropower

The reference drought period would result in a severe decrease in hydropower generation of approximately 42% in Finland. The average discharges and annual hydropower production during normal years and during the analyzed drought period are presented in Table 4. Jääskeläinen et al. [13] carried out an analysis of the impact of severe drought on energy security in Finland under different scenarios, and concluded that a severe drought affecting only Finland would not cause large problems for power adequacy during the peak demand period in January. However, if the drought were large-scale and simultaneously affected Norway and Sweden, as was the case in 1939–1942 and 2002–2003 [8], the impact on Finnish energy security could be much larger due to the decreased availability of electricity imports.
A severe drought will have several noteworthy socio-economic impacts on the energy sector. First, a drought will evidently decrease the production volumes of hydropower plants, as depicted in Table 4. Due to the inelastic nature of electricity demand in the Nordic countries, a reduction in the supply of low marginal priced power production will increase the average electricity wholesale price. The spot price has the potential to increase nearly a hundredfold compared to the current price level before the price cap, as the system approaches generation inadequacy. Moreover, the abundant and flexible hydropower capacity in the Nordic countries decreases electricity price volatility, as hydropower is well suited for balancing the market. Therefore, a drought would most likely increase consumer electricity prices and result in economic losses for industry and households [60]. Estimations of the value of the lost load in the case of generation inadequacy range between 5000–20,000 euros per MWh, i.e., much higher than the price cap in the wholesale market [61].
With regard to the supply-side, the issue is more ambiguous. Power producers typically set their supply bids according to the short-term marginal costs of production in a liberalized energy market such as that in the Nordic countries. However, the marginal costs of hydropower production are practically non-existent, and hydropower can be easily stored in many cases. Hydro reservoirs are especially significant in Norway and Sweden, with storage capacities of approximately 85 TWh and 34 TWh, respectively [62]. Hydropower producers hence aim to maximize the value of their hydro reservoirs by selling the electricity when it yields the highest revenues. Despite losing up to half of the production volume during a severe drought compared to a good hydrological year, the revenue might not decrease. Summer 2018 was a good example of electricity prices soaring in the Nordic countries during a dry summer, and the average spot prices almost doubled compared to the previous years. It should be noted, however, that in addition to the drought, there were also other factors affecting the price, such as the high emissions allowance prices. Nevertheless, as droughts that are much less severe than our reference drought already increase the electricity wholesale price significantly, a prolonged severe drought could have far more drastic implications. The economic implications for a hydropower plant owner are very case specific and are affected by issues such as whether the plant is run-of-river or dammed, and how the drought affects the discharges in the river in question. Overall, the majority of the cost of the drought would hence likely fall on energy consumers, rather than on hydropower generators.

3.3.2. Groundwater and Water Supply

Declining groundwater tables cause problems during droughts for many municipalities and households that are dependent on groundwater. Water availability issues affect private shallow dug wells and water supply plants using small glaciofluvial formations first, but prolonged severe drought would also decrease water tables below normal levels in larger aquifers and drilled wells using water from the bedrock.
We can use information from recent, less severe droughts to help estimate the possible impact of drought on the water supply. During the drought of 2018, some water supply companies set voluntary water use limitations, and some private wells were reported to have dried up in the most-affected areas. During the drought of 2002–2003 the situation was more severe, and approximately 15% of water supply companies had problems with water availability. In some areas, groundwater tables were up to five meters below the long-term annual average. The situation was especially alarming in North Karelia and in the western parts of Finland, and the estimated direct costs caused by the drought for water supply were approximately 5–10 million euro [8,63]
Since our reference drought period was significantly longer than the drought in 2002–2003, it would likely cause more problems, and greater damage and economic losses. More water transfers would be needed, and water availability even in large groundwater formations would decline. At the same time, however, Finnish society has taken some practical steps since 2002–2003 to increase drought resilience. Urbanization and larger agricultural units have decreased the number of households and livestock not connected to a municipal water supply, and connections between separate municipal supply systems have been added. Both of these measures enhance the possibilities for more coordinated adaptation measures. However, an important measure that should be implemented to save water in most of Finland’s pipelines is renewing aged pipelines as leakage rates grow. Overall, large water supply companies are typically well-prepared for different disturbances and have both preparedness plans and climate change adaptation plans [63]. Despite this, Finland also has many small water supply companies with very limited resources for preparedness, adaptation and even maintenance, making them particularly prone to the impact of drought [64]. Small water supply companies that rely on groundwater have relatively short observation records, and are not prepared for a severe drought similar to our reference drought.
Ahopelto et al. [24] assessed water availability during a severe drought using the Water Depletion Index (WDI), concluding that water stress would be particularly likely in South-Western Finland. This is an area with few lakes and small catchments, but a relatively dense population and large withdrawals due to industry and agriculture. Some individual catchment areas in Southern and Western Finland would also be likely to suffer from water stress during such a drought [24]. These are the areas in which more studies and adaptation are needed.
Water quality would also be likely to suffer as a result of the drought. The most common quality problems are caused by decreased oxygen content, which leads to a reducing environment and the dissolution of iron and manganese into groundwater. The drought could impact groundwater flows and change water flow directions, as a result, for example, pollutants in contaminated land areas may start flowing towards to water intake areas [63]. In rural areas, approximately 10,000 households and 1400 farms suffered from both quantity and quality problems during the drought of 2002–2003 [65].

3.3.3. Other Impacts of a Severe Drought

Besides the impact on water supply and hydropower, a severe drought would also have many other impacts on society and the economy, as well as on nature. Such impacts are, however, difficult to assess and their detailed analysis is thus beyond the scope of this paper. In the following, we therefore merely discuss some general examples of the impact of a severe drought on other water-related sectors.
Navigation in inland waters and the recreational use of lakes and rivers would most likely be significantly affected during a severe drought; particularly large lakes where water levels fall the most. This would cause damage to logistics and tourism especially. The potential degradation of water quality would further hinder recreational use and water supply. Toxic blue-green algae blooms are common in Finland, and they could become more frequent during dry summers, especially if the temperatures are also high (as is often case in summer if a high pressure area is located over Finland). The oxygen content of water would also be likely to diminish, potentially causing fish deaths. The summer of 2018 saw uncommonly large algal blooms and the death of some fish and mussels [66]. Other environmental impacts could also be significant.
Agriculture and forestry would potentially suffer significant drought damage due to the varied impact of limited water availability. Recent droughts provide some guidance on possible impacts. For example, the drought of 2018 caused a large impact on agriculture, with 14–57% lower yields for most cereals [67]. Forestry is an important sector in Finland and would suffer from an increased number of wildfires, forest pest insects, and diseases. Suffering caused to saplings and decreased tree growth has an economic impact [68]. These complex impacts on agriculture and forestry merit their own in-depth studies.

4. Discussion

4.1. Methodological and Climate Change-Related Findings

We analyzed the impact of drought in Finland using a past, real drought period as a reference drought. The main advantage of this approach is that it is relatively easy to model and it can also be perceived as a more realistic option by stakeholders than an artificially simulated drought. However, there are also disadvantages of using an observed drought, related mainly to the fact that the modeled drought is not of similar severity throughout the country. The simulated reference drought of 1939–1942, for example, was not severe in Northern Finland. However, in this case this did not cause a large problem, as Northern Finland is not particularly vulnerable to droughts. Every drought period is different, and the period of 1939–1942 is only one example of a drought event. Modeling several different types of drought could provide insights to different types of responses and the climate change impact of different droughts in different regions.
In terms of climate change analysis, comparing our results with previous studies carried out with continental scale models [22,23,69] shows both similarities and differences. Our studies showed a decrease in minimum discharges by 2040–2069, for all the climate scenarios in Southern and Central Finland and most of the scenarios in Northern Finland. According to Forzieri et al. [22] the drought risk will decrease in the whole of Finland, while our results show an increase at least in Southern and Central Finland. The study by Roudier et al. [23], in turn, showed a decrease in drought frequency in Northern Finland and mainly no change in Southern Finland. The study by Lehner et al. [69] indicated that 100-year-droughts have become less frequent in most of Northern Europe, but some areas in Finland show more frequent droughts. The different findings of these studies can be explained by the different climate scenarios and the different assessment and modeling methods used, as well as differences in the variables in question (deficit volume, minimum discharge, daily/monthly values). Large scale models often do not include all the available local information used in national scale models, such as lake regulation schemes or lake evaporation. For example, Forzieri et al. [22] indicated that snow amounts will increase due to increased precipitation, while our results as well as those from several other studies [39,70,71,72] predict decreased snow amounts and an earlier spring due to warmer temperatures in many parts of the Nordic countries. Smaller snow amounts and earlier spring floods have also been observed in recent years [21,73,74]. Earlier and smaller spring snowmelt volumes affect the minimum discharges substantially, especially in the more southern parts of the Nordic region.
It is also important to note that the climate of Finland has already changed from our reference drought period. The reference period 1939–1942 was colder and snowier than the last 30 years, as the climate of Finland has already become warmer due to climate change. The estimated increase from the 1940s to 2010s was over one degree Celsius [75], and winters as cold and snowy as those in the 1940s have thus become rarer. For this reason, the simulation using weather from 1939–1942, but adding the climate scenarios of 2010–2039 (from 1981–2010), were actually closer to today’s climate.
We estimated the impact of climate change using data from only one severe drought event for the years 1981–2010 using the delta change method. However, it would also be important to know how the likelihood of severe droughts will change due to climate change. According to the delta change method, average monthly changes are used to modify the reference period climate, and possible changes in variability between years is not included. These changes in variability are of course very relevant to changes in the likelihood of severe droughts. However, the evaluation of changes in the likelihood of severe drought is not simple, as the processes leading to prolonged periods with little precipitation are complicated and not well represented by current climate models [76,77]. Changes in dry spells have been evaluated [17], but these studies concentrate on time periods considerably shorter than those that are critical in large watersheds. Changes in average droughts and the timing of minimum discharge can provide some ideas for change in a severe drought, but extremes may change differently than averages. The changes in extremes should be taken into account in future studies on the impacts of climate change on severe droughts in Finland.
Modeling water resources during a drought, as was carried out in this study, involves several uncertainties. The meteorological observations during the modeled drought are sparse and the hydrological model structure and parameterization cause uncertainty. Evapotranspiration and snow models in WSFS are still under development. In addition, assessing the possible impact of drought contains many uncertainties. Drought also has several direct and indirect societal and environmental impacts that are difficult to evaluate, and more studies are therefore needed to fully understand the diversity of impacts that drought has on different sectors.

4.2. Policy Implications

Our analysis examined the impact that severe drought could have on Finland’s water resources and, consequently, on key water-related sectors. While our analysis focused on hydropower and (ground) water supply, Ahopelto et al. [24] studied other water-related sectors, such water availability for industry. While Finland, in general, has natural resilience towards drought thanks to its abundant water resources, a severe drought similar to our reference drought would have significant impacts on energy production (particularly if the drought also affected Sweden and Norway) [13], as well as on food security.
Despite this, the current water management strategies in Finland focus on floods, with very limited consideration of drought. The National Climate Change Adaptation Plan for Finland [78] also includes only few remarks on droughts, while the European Union has carried out a more comprehensive review related to European drought policies [79]. Knowledge of droughts and their consequences is a prerequisite of establishing appropriate drought management plans [19], and preparing in advance is the best way to mitigate the impact of drought. This study together with the results of Ahopelto et al. [24] provide information on the most vulnerable areas, impacts on different sectors, and future changes necessary for planning more detailed studies and adaptation measures. Ways to prepare and adapt to droughts include institutional development, livelihood and economic diversification, insurance and other market tools, monitoring and data collection, as well as early warning and alert systems [5]. The good news is that many such measures seem compatible with general climate change adaptation and preparedness measures, providing potential for synergies. At the same time, due to its specific nature, drought also requires some specific measures and ways of working, and these could and should be looked at in more detail together with the key actors.
One practical way forward would be to include drought in selected regional preparedness exercises, which are regularly organized in different parts of Finland, in order to enhance cooperation and increase knowledge related to different risks and threats [80,81]. The first such exercise focusing on droughts is to be held in South-Western Finland in April 2019, and it aims to highlight vulnerabilities related to drought, thus improving the preparedness and resilience of society. Other concrete measures include drought management plans, e.g., included in the River Basin Management Plans (RBMP), for the areas most vulnerable to drought. In the first and second round of RBMPs, Finland did not prepare any drought management plans. In their recommendations for the second RBMPs, the EU Commission urged Finland to reconsider preparing drought management plans on the grounds of the prevalence of local and sub-basin drought spells [82]. These plans should include estimations of the costs of drought, the impact of climate change and adaptation possibilities.
Drought should be taken into account when water, food and energy security are assessed. There are practical ways to improve drought resilience in key water-related sectors. In the energy sector this could mean, for example, maintaining and creating viable alternatives to hydropower. Establishing more connections between different power grids is another way to cope with the possible reduced availability of hydropower generation. In the water supply sector, resilience could be improved by building more connection pipelines between water supply utilities and having more alternative aquifers for water supply [63]. In areas where groundwater reservoirs are naturally scarce, looking into alternative methods, such as the artificial recharge of groundwater or the use of surface water as backup water should be assessed [56]. The condition of water supply pipelines should be improved, and the leakage percentage should be reduced. At the individual household level, shallow wells can be deepened or replaced by drilled wells. It would also be valuable to study Finnish and EU law from the viewpoint of drought preparation and management in more detail.

5. Conclusions

Our results showed that a severe drought would have a significant impact on water resources and cause damage to the water supply in Finland. Drought would also have negative implications for hydropower production and agriculture, which emphasises the importance of looking at drought not only as a risk to water security, but also to energy security and food security. As such, drought can be seen as one risk multiplier for the emerging water–energy–food security nexus approach (e.g., [83,84,85])
Water resources and water withdrawals are not equally distributed throughout the entire country, making some regions much more prone to seasonal drought risks [24]. However, the national averages used in most water availability studies hide this spatial and temporal variability, and local scale assessments with local knowledge are therefore needed to complement this overall picture. The simulated discharges during the reference drought were the smallest in Southern and Central Finland. For the water levels, the impact of a drought would be most severe in Central and South-Eastern Finland, with the lowest water levels in the largest lakes with no regulation or only limited regulation possibilities. In addition, the impact on navigation, recreational use and tourism would be considerable.
We also analyzed how climate change would affect droughts and minimum discharges in Finland. Climate change is projected to increase precipitation in Finland, but according to our results, the minimum discharges still decreased, especially in Southern and Central Finland. Due to an increase in temperature and longer summers, the likelihood of a drought during summer and early autumn will, according to our results, increase, but this depends on the climate scenario, weather patterns and changes in evapotranspiration. According to the current climate model results, severe drought will still remain a rare occurrence in Finland, but in the areas already most vulnerable to droughts, climate change may worsen the situation.
Finland is a highly developed society with a long traditions of water resource management and preparedness. However, drought resilience could be further improved with actions at different scales. On a practical level, more water transmission connections can be built, and possibilities for alternative water sources developed for both water supply and agriculture. At the policy level, regional drought management plans should be prepared. To ensure policy coherence and the wise allocation of resources, such plans should link to existing policies, including the EU’s River Basin Management Plans and Finland’s advanced flood management and climate change adaptation plans. For the same reason, the drought management plans should focus only on the regions that are most prone to drought. These regions should also be the focus areas for regional drought-related preparedness exercises. In terms of increased information and knowledge, the risk of drought can be decreased by estimating the impact of drought in advance to identify the most critical sectors and areas, and then to prepare the necessary, cost-effective adaptive actions. Overall, our study showed that drought can negatively affect water security, as well as the related fields of energy security and food security, even in a water-abundant country such as Finland.

Author Contributions

Conceptualization: N.V., L.A. and. M.M., Methodology: N.V. and L.A., Hydrological modeling: N.V., Analysis of results: N.V., L.A., M.M., R.B., M.O., J.J. and M.K., Writing–Original draft preparation: N.V. and L.A., Writing—specific sections: All, Writing—review and editing: All.

Funding

This study was funded by the Strategic Research Council (SRC) of Finland through its Winland project (No. 303629 + 303623).

Acknowledgments

We thank our colleagues in Winland as well as at the Finnish Environment Institute SYKE and Aalto University for their support. We also thank Tapani Rousi for making the maps in this paper and Juho Jakkila, Miia Kumpumäki, Vesa Kolhinen, and Bertel Vehviläinen for their help with the WSFS model and its description.

Conflicts of Interest

The authors declare no conflict of interest.

References

  1. Naumann, G.; Spinoni, J.; Vogt, J.V.; Barbosa, P. Assessment of drought damages and their uncertainties in Europe. Environ. Res. Lett. 2015, 10, 124013. [Google Scholar] [CrossRef]
  2. Spinoni, J.; Naumann, G.; Vogt, J.V.; Barbosa, P. The biggest drought events in Europe from 1950 to 2012. J. Hydrol. Reg. Stud. 2015, 3, 509–524. [Google Scholar] [CrossRef]
  3. Sheffield, J.; Wood, E.F. Drought: Past Problems and Future Scenario; Earthscan: London, UK; Washington, DC, USA, 2011; p. 233. [Google Scholar]
  4. DG Environment—European Commission, Water Scarcity and Droughts; Second Interim Report; European Commission: 2007. Available online: http://ec.europa.eu/environment/water/quantity/pdf/comm_droughts/2nd_int_report.pdf (accessed on 14 April 2019).
  5. Gerber, N.; Mirzabaev, A.; WMO; GWP. Benefits of Action and Costs of Inaction: Drought Mitigation and Preparedness—A Literature Review; WMO and GWP: Geneva, Switzerland; Stockholm, Sweden, 2017; p. 24. [Google Scholar]
  6. Mohammad, A.H.; Jung, H.C.; Odeh, T.; Bhuiyan, C.; Hussein, H. Understanding the impact of droughts in the Yarmouk basin, Jordan: Monitoring droughts through meteorological and hydrological drought indices. Arab. J. Geosci. 2018, 11, 103. [Google Scholar] [CrossRef]
  7. Morid, S.; Smakhtin, V.; Moghaddasi, M. Comparison of seven meteorological indices for drought monitoring in Iran. Int. J. Climatol. 2006, 26, 971–985. [Google Scholar] [CrossRef]
  8. Silander, J.; Järvinen, E.A. Vuosien 2002–2003 Poikkeuksellisen Kuivuuden Vaikutukset [Effects of Severe Drought of 2002/2003]; Finnish Environment 731; Finnish Environment Institute: Helsinki, Finland, 2004; p. 79. [Google Scholar]
  9. Knutson, C.; Hayes, M.; Phillips, T. How to Reduce Drought Risk; Western Drought Coordination Council: Lincoln, NE, USA, 1998; p. 43. [Google Scholar]
  10. Sojamo, S.; Ahopelto, L.; Marttunen, M.; Belinskij, A.; Veijalainen, N.; Keskinen, M. Vesiturvallisuus—Mikä sen merkitys on Suomelle? Vesitalous. 2017. Available online: http://winlandtutkimus.fi/wp-content/uploads/2016/09/Sojamo-et-al.-2017_vesiturvallisuus-.pdf (accessed on 4 April 2019).
  11. Cook, C.; Bakker, K. Water security: Debating an emerging paradigm. Glob. Environ. Chang. 2012, 22, 94–102. [Google Scholar] [CrossRef]
  12. UN-Water. Water Security and the Global Water Agenda: A Un-Water Analytical Brief; United Nations University—Institute for Water, Environment and Health: Tokyo, Japan, 2013. [Google Scholar]
  13. Jääskeläinen, J.; Veijalainen, N.; Syri, S.; Marttunen, M.; Zakeri, B. Energy security impacts of a severe drought on the future finnish energy system. J. Environ. Manag. 2018, 217, 542–554. [Google Scholar] [CrossRef]
  14. European Commission. Common Implementation Strategy for the Water Framework Directive (2000/60/ec), Guidance Document No. 24: River Basin Management in a Changing Climate; European Commission: Brussels, Belgium, 2009. [Google Scholar]
  15. Veijalainen, N.; Korhonen, J.; Vehviläinen, B.; Koivusalo, H. Modelling and statistical analysis of catchment water balance and discharge in finland in 1951–2099 using transient climate scenarios. J. Water Clim. Chang. 2012, 3, 55–78. [Google Scholar] [CrossRef]
  16. Ruosteenoja, K.; Jylhä, K.; Kämäräinen, M. Climate projections for finland under the rcp forcing scenarios. Geophysica 2016, 51, 17–50. [Google Scholar]
  17. Jylhä, K.; Ruosteenoja, K.; Räisänen, J.; Venäläinen, A.; Tuomenvirta, H.; Ruokolainen, L.; Saku, S.; Seitola, T. Arvioita Suomen Muuttuvasta Ilmastosta Sopeutumistutkimuksia Varten; ACCLIM-Hankkeen Raportti; Ilmatieteen laitos: Helsinki, Finland, 2009; pp. 1–102. [Google Scholar]
  18. Hohenthal, J. Meteorologisen Kuivuuden Esiintyminen Pohjois-Euroopassa. Master’s thesis, University of Turku, Turku, Finland, 2009. [Google Scholar]
  19. Wong, W.K.; Beldring, S.; Engen-Skaugen, T.; Haddeland, I.; Hisdal, H. Climate change effects on spatiotemporal patterns of hydroclimatological summer droughts in norway. J. Hydrometeorol. 2011, 12, 1205–1220. [Google Scholar] [CrossRef]
  20. Stahl, K.; Hisdal, H.; Hannaford, J.; Tallaksen, L.; Van Lanen, H.; Sauquet, E.; Demuth, S.; Fendekova, M.; Jordar, J. Streamflow trends in europe: Evidence from a dataset of near-natural catchments. Hydrol. Earth Syst. Sci. 2010, 14, 2367–2382. [Google Scholar] [CrossRef]
  21. Wilson, D.; Hisdal, H.; Lawrence, D. Has streamflow changed in the nordic countries?—Recent trends and comparisons to hydrological projections. J. Hydrol. 2010, 394, 334–346. [Google Scholar] [CrossRef]
  22. Forzieri, G.; Feyen, L.; Rojas, R.; Flörke, M.; Wimmer, F.; Bianchi, A. Ensemble projections of future streamflow droughts in europe. Hydrol. Earth Syst. Sci. 2014, 18, 85–108. [Google Scholar] [CrossRef]
  23. Roudier, P.; Andersson, J.C.M.; Donnelly, C.; Feyen, L.; Greuell, W.; Ludwig, F. Projections of future floods and hydrological droughts in europe under a +2 °C global warming. Clim. Chang. 2016, 135, 341–355. [Google Scholar] [CrossRef]
  24. Ahopelto, L.; Veijalainen, N.; Guillaume, J.H.A.; Keskinen, M.; Marttunen, M.; Varis, O. Can there be water scarcity with abundance of water? Analyzing water stress during a severe drought in finland. Sustainability 2019, 11, 1548. [Google Scholar] [CrossRef]
  25. Eurostat. Water Statistics. Available online: https://ec.europa.eu/eurostat/statistics-explained/index.php/Water_statistics#Water_as_a_resource (accessed on 15 January 2019).
  26. Kossida, M.; Kakava, A.; Tekidou, A.; Iglesias, A.; Mimikou, M. Vulnerability to Water Scarcity and Drought in Europe; 3/2012; ETC/ICM: Prague, Czech Republic, 2012; p. 102. [Google Scholar]
  27. Salminen, J.M.; Veiste, P.J.; Koskiaho, J.T.; Tikkanen, S. Improving data quality, applicability and transparency of national water accounts—A case study for finland. Water Resour. Econ. 2018, 24, 25–39. [Google Scholar] [CrossRef]
  28. Energiateollisuus. Vesivoima. Available online: Https://energia.Fi/perustietoa_energia-alasta/energiantuotanto/sahkontuotanto/vesivoima (accessed on 27 February 2019).
  29. Jääskeläinen, J.J.; Höysniemi, S.; Syri, S.; Tynkkynen, V.-P. Finland’s dependence on russian energy—Mutually beneficial trade relations or an energy security threat? Sustainability 2018, 10, 3445. [Google Scholar] [CrossRef]
  30. Peel, M.C.; Finlayson, B.L.; Mcmahon, T.A. Updated world map of the Köppen-Geiger climate classification. Hydrol. Earth Syst. Sci. Discuss. 2007, 4, 439–473. [Google Scholar] [CrossRef]
  31. Pirinen, P.; Simola, H.; Aalto, J.; Kaukoranta, J.P.; Karlsson, P.; Ruuhela, R. Tilastoja Suomen Ilmastosta 1981–2010 (Climatological Statistics of Finland 1981–2010); Ilmtieteen laitos: Helsinki, Finland, 2012; Volume 2012. [Google Scholar]
  32. Korhonen, J. Suomen Vesistöjen Virtaaman ja Vedenkorkeuden Vaihtelut; Suomen ympäristökeskus: Helsinki, Finland, 2007; p. 120. [Google Scholar]
  33. Førland, E.J.; Allerup, P.; Dahlström, B.; Elomaa, E.; Jónsson, T.; Madsen, H.; Perälä, J.; Rissanen, P.; Vedin, H.; Vejen, F. Manual for Operational Correction of Nordic Precipitation Data.; Met.no: Oslo, Norway, 1996; p. 65. [Google Scholar]
  34. Taskinen, A.; Söderholm, K. Operational correction of daily precipitation measurements in Finland. Boreal Environ. Res. 2016, 21, 1–24. [Google Scholar]
  35. Ylhäisi, J. Sademääräsimulaatiot Ensembles-Hankkeen Alueellisissa Ilmastomalleissa. Master’s Thesis, University of Helsinki, Helsinki, Finland, 2009. [Google Scholar]
  36. Vehviläinen, B.; Huttunen, M.; Huttunen, I. Hydrological forecasting and real time monitoring in Finland: The watershed simulation and forecasting system (WSFS). In Proceedings of the International Conference on Innovation, Advances and Implementation of Flood Forecasting Technology, Tromsø, Norway, 17–19 October 2005. [Google Scholar]
  37. Vehviläinen, B. Snow Cover Models in Operational Watershed Forecasting; National board of WATERS and the Environment, Finland: Helsinki, Finland, 1992; p. 112. [Google Scholar]
  38. Vehviläinen, B.; Huttunen, M. Climate change and water resources in Finland. Boreal Environ. Res. 1997, 2, 3–18. [Google Scholar]
  39. Veijalainen, N. Estimation of Climate Change Impacts on Hydrology and Floods in Finland. Ph.D. Thesis, Aalto University, Helsinki, Finland, 2012. [Google Scholar]
  40. Bergström, S. Development and Application of a Conceptual Runoff Model for Scandinavian Catchments; SMHI: Norrköping, Sweden, 1976; p. 134. [Google Scholar]
  41. Shuttleworth, W.J. Evaporation. Chapter 4. In Handbook of Hydrology; Maidment, D.R., Ed.; McGraw-Hill: New York, NY, USA, 1992; pp. 1–53. [Google Scholar]
  42. Huttunen, M.; Joukainen, S.; Vehviläinen, B. Vesistömallien Kehittäminen Vuoden 1999 Tutkimusohjelman Loppuraportti; Finnish Environment Institute: Helsinki, Finland, 2001. [Google Scholar]
  43. Jakkila, J.; Vento, T.; Rousi, T.; Vehviläinen, B. Smos soil moisture data validation in the Aurajoki watershed, finland. Hydrol. Res. 2014, 45, 684–702. [Google Scholar] [CrossRef]
  44. Sheffield, J.; Wood, E.F.; Roderick, M.L. Little change in global drought over the past 60 years. Nature 2012, 491, 435–438. [Google Scholar] [CrossRef]
  45. Mäkinen, R.; Orvomaa, M.; Veijalainen, N.; Huttunen, I. The climate change and groundwater regimes in Finland. In Proceedings of the 11th International Specialized Conference on Watershed & River Basin Management, Budapest, Hungary, 4–5 September 2008. [Google Scholar]
  46. Hooke, R.; Jeeves, T.A. Direct search solution of numerical and statistical problems. J. ACM 1961, 8, 212–229. [Google Scholar] [CrossRef]
  47. Kuusisto, E. Drought has also troubled Finland. In Water Cycle-Hydrological Service in Finland 1908–2008; Kuusisto, E., Ed.; Finnish Environment Institute: Hämeenlinna, Finland, 2008. [Google Scholar]
  48. Kuusisto, E. Droughts in Finland—Past, present and future. In Proceedings of the Hydrology Days 2004, Fort Collins, CO, USA, 10–12 March 2004. [Google Scholar]
  49. Seftigen, K.; Linderholm, H.W.; Drobyshev, I.; Niklasson, M. Reconstructed drought variability in southeastern Sweden since the 1650s. Int. J. Climatol. 2013, 33, 2449–2458. [Google Scholar] [CrossRef]
  50. Helama, S.; Lindholm, M. Droughts and rainfall in south-eastern Finland since ad 874, inferred from scots pine ring-widths. Boreal Environ. Res. 2003, 8, 171–183. [Google Scholar]
  51. Bye, T.; Bruvoll, A.; Anne, F.R. The Importance of Volatility in Inflow in a Deregulated Hydrodominated Power Market; Statistics Norway: Kongsvinger, Norway, 2006; p. 32. [Google Scholar]
  52. Arnell, N.W. The effect of climate change on hydrological regimes in europe: A continental perspective. Glob. Environ. Chang. 1999, 9, 5–23. [Google Scholar] [CrossRef]
  53. Andréasson, J.; Bergström, S.; Carlsson, B.; Graham, L.P.; Lindström, G. Hydrological Change—Climate Change Impact Simulations for Sweden. Ambio 2004, 33, 228–234. [Google Scholar] [CrossRef] [PubMed]
  54. IPCC. Climate Change 2013: The Physical Science Basis. Contribution of Working Group I to the Fifth Assessment Report of the Intergovernmental Panel on Climate Change; IPCC: Cambridge, UK; New York, NY, USA, 2013; p. 1535. [Google Scholar]
  55. Moss, R.H.; Nakicenovic, N.; O’Neill, B.C. Towards New Scenarios for Analysis of Emissions, Climate Change, Impacts, and Response Strategie; IPCC: Geneva, Switzerland, 2009. [Google Scholar]
  56. Hatva, T.; Lapinlampi, T.; Vienonen, S. Kaivon Paikka. Selvitykset ja Tutkimukset Kiinteistön Kaivon Paikan Määrittämiseksi; Suomen Ympäristökeskus: Helsinki, Finand, 2008. [Google Scholar]
  57. Agreement between the Republic of Finland and the Union of Soviet Socialist Republics Concerning the Regulations Governing Lake Saimaa and the Vuoksi River (Signed 26 October 1989, Entered into Force 9 October 1991) 1663 unts 325. 1991. Available online: https://treaties.un.org/doc/publication/unts/volume%201663/v1663.pdf (accessed on 24 January 2019).
  58. Veijalainen, N.; Jakkila, J.; Nurmi, T.; Vehviläinen, B.; Marttunen, M.; Aaltonen, J. Suomen Vesivarat ja Ilmastonmuutos—Vaikutukset ja Muutoksiin Sopeutuminen. Wateradapt-Projektin Loppuraportti; Finnish Environment Institute: Helsinki, Finland, 2012; p. 138. [Google Scholar]
  59. Hydrologinen Kuukausitilasto—Kartat, Kuvaajat ja Taulukot Vuodelle 2018. Available online: http://wwwi3.ymparisto.fi/i3/paasivu/FIN/2018/etusivu/etusivu.htm (accessed on 28 February 2019).
  60. Bye, T.; Bruvoll, A.; Aune, F.R. Inflow shortages in deregulated power markets—Reasons for concern? Energy Econ. 2008, 30, 1693–1711. [Google Scholar] [CrossRef]
  61. Forsman, J.; Vilén, K.; Patronen, J.; Revuelta, J.; Cobo, I. Selvitystyö Tarvittavasta Tehoreservin Määrästä Ajanjaksolle 2017–2022; Pöyry Management Consulting Oy: Vantaa, Finland, 2016; p. 41. [Google Scholar]
  62. NordREG. Nordic Market Report 2011: Development in the Nordic Electricity Market; NordREG: Copenhagen, Denmark, 2011; p. 62. [Google Scholar]
  63. Vienonen, S.; Rintala, J.; Orvomaa, M.; Santala, E.; Maunula, M. Ilmastonmuutoksen Vaikutukset ja Sopeutumistarpeet Vesihuollossa; Suomen Ympäristökeskus: Helsinki, Finland, 2012. [Google Scholar]
  64. ROTI. Rakennetun omaisuuden tila 2017; RIL: Helsinki, Finland, 2017; Available online: https://www.ril.fi/media/2017/2017-vaikuttaminen/roti-2017/taustat/roti-2017_painettu-raportti.pdf (accessed on 11 February 2019).
  65. Arosilta, A.; Liponkoski, M. Kuntien ja vesihuoltolaitosten toiminta liite 9/1 poikkeuksellisen kuivuuden 2002–2003 aikana—Kyselyn tulokset. In Vuosien 2002–2003 Poikkeuksellisen Kuivuuden Vaikutukset; Silander, J., Järvinen, E.A., Eds.; Finnish Environment Institute: Helsinki, Finland, 2004. [Google Scholar]
  66. SYKE. Valtakunnallinen Leväyhteenveto 2018: Helteinen Kesä toi Merialueille Poikkeuksellisen Runsaita Sinileväkukintoja, Järvillä Sinileväkausi Aikaistui. Available online: https://www.ymparisto.fi/fi-FI/Vesi/Valtakunnallinen_levayhteenveto_2018_Hel%2847750%29 (accessed on 20 February 2019).
  67. LUKE. Crop Production Statistics. Available online: https://stat.luke.fi/en/crop-production-statistics (accessed on 20 February 2019).
  68. Metla. Metsien Alttius Bioottisille Tuhoille ja Kuivuudelle. Available online: http://www.Metla.Fi/life/climforisk/webtool/#/fi/susceptibility (accessed on 3 September 2018).
  69. Lehner, B.; Döll, P.; Alcamo, J.; Henrichs, T.; Kaspar, F. Estimating the impact of global change on flood and drought risks in europe: A continental, integrated analysis. Clim. Chang. 2006, 75, 273–299. [Google Scholar] [CrossRef]
  70. Madsen, H.; Lawrence, D.; Lang, M.; Martinkova, M.; Kjeldsen, T.R. Review of trend analysis and climate change projections of extreme precipitation and floods in europe. J. Hydrol. 2014, 519, 3634–3650. [Google Scholar] [CrossRef]
  71. Bergström, S.; Andréasson, J.; Veijalainen, N.; Vehviläinen, B.; Einarsson, B.; Jónsson, S.; Kurpniece, L.; Kriauciuniene, J.; Meilutyte-Barauskiene, D.; Beldring, S.; et al. Modelling climate change impacts on the hydropower system. In Climate Change and Energy Systems: Impacts, Risks and Adaptation in the Nordic and Baltic Countries; Thorsteinsson, T., Björnsson, H., Eds.; Nordic Council of Ministers: Copenhagen, Denmark, 2012; Volume 502, pp. 113–146. [Google Scholar]
  72. Lawrence, D.; Hisdal, H. Hydrological Projections for Flooding in Norway under a Future Climate; Norwegian Water Resources and Energy Directorate: Oslo, Norway, 2011; p. 47. [Google Scholar]
  73. Korhonen, J. Long-Term Changes and Variability of the Winter and Spring Season Hydrological Regime in Finland. Ph.D. Thesis, University of Helsinki, Helsinki, Finland, 2019. [Google Scholar]
  74. Luomaranta, A.; Aalto, J.; Jylhä, K. Snow cover trends in finland over 1961–2014 based on gridded snow depth observations. Int. J. Climatol. 2019. [Google Scholar] [CrossRef]
  75. Mikkonen, S.; Laine, M.; Mäkelä, H.M.; Gregow, H.; Tuomenvirta, H.; Lahtinen, M.; Laaksonen, A. Trends in the average temperature in finland, 1847–2013. Stoch. Environ. Res. Risk Assess. 2015, 29, 1521–1529. [Google Scholar] [CrossRef]
  76. Ault, T.R.; Cole, J.E.; Overpeck, J.T.; Pederson, G.T.; Meko, D.M. Assessing the risk of persistent drought using climate model simulations and paleoclimate data. J. Clim. 2014, 27, 7529–7549. [Google Scholar] [CrossRef]
  77. Moon, H.; Gudmundsson, L.; Seneviratne, S.I. Drought persistence errors in global climate models. J. Geophys. Res. Atmos. 2018, 123, 3483–3496. [Google Scholar] [CrossRef] [PubMed]
  78. Metsätalousministeriö, M.-J. Kansallinen Ilmastonmuutokseen Sopeutumissuunnitelma 2022; Maa-ja Metsätalousministeriö: Helsinki, Finland, 2014. [Google Scholar]
  79. European Commission. Communication from the Commission to the European Parliament, the Council, the European Economic and Social Committee and the Committee of the Regions: Report on the Review of the European Water Scarcity and Droughts Policy; European Commission: Brussels, Belgium, 2012. [Google Scholar]
  80. Ahola, K. Valmiusharjoituksen Onnistumiseen Vaikuttavat Tekijät Osallistujien Näkökulmasta. Master’s thesis, Maanpuolustuskorkeakoulu, Helsinki, Finland, 2014; 58 p. Available online: https://www.doria.fi/bitstream/handle/10024/102381/SM%20858.pdf?sequence=2 (accessed on 4 April 2019).
  81. Pesonen, P. Maakuntauudistus—Toimijoiden Välisen Varautumisyhteistyön Tukeminen Alueellisen Yhteisen Varautumisen Tietotarpeiden Selvittämisellä. Master’s thesis, Aalto University, Espoo, Finland, 2017. [Google Scholar]
  82. European Commission. Report from the Commission to the European Parliament and to the Council on the Implementation of the Water Framework Directive (2000/60/ec) and Floods Directive (2007/60/ec). Commission Staff Working Document-Second River Basins Management Plans—Member State: Finland. 2019. Available online: https://eur-lex.europa.eu/legal-content/EN/TXT/PDF/?uri=SWD:2019:46:FIN&qid=1551205988853&from=EN (accessed on 24 January 2019).
  83. Hoff, H. Understanding the Nexus, Background Paper for the Bonn 2011 Conference: The Water, Energy and Food Security Nexus; Stockholm Environment Institute: Bonn, Germany, 2011. [Google Scholar]
  84. Bazilian, M.; Rogner, H.; Howells, M.; Hermann, S.; Arent, D.; Gielen, D.; Steduto, P.; Mueller, A.; Komor, P.; Tol, R.S.J.; et al. Considering the energy, water and food nexus: Towards an integrated modelling approach. Energy Policy 2011, 39, 7896–7906. [Google Scholar] [CrossRef]
  85. Keskinen, M.; Guillaume, J.H.A.; Kattelus, M.; Porkka, M.; Räsänen, T.A.; Varis, O. The water-energy-food nexus and the transboundary context: Insights from large asian rivers. Water 2016, 8, 193. [Google Scholar] [CrossRef]
Figure 1. The major lakes and rivers in Finland. The location of the five largest lakes, the discharge observation sites used for comparison in this study, and the three groundwater stations analyzed are shown on the map.
Sustainability 11 02450 g001
Figure 2. Flow chart of the study methodology used. WSFS: Watershed Simulation and Forecasting System.
Sustainability 11 02450 g002
Figure 3. Schematic representation of the hydrological WSFS model.
Sustainability 11 02450 g003
Figure 4. Minimum (a) discharge (%) and (b) water level (m) in Finland under the reference drought conditions compared to the average annual minimum of the control period 1981–2010.
Sustainability 11 02450 g004
Figure 5. Simulated groundwater tables for 1981–2010 and during the reference drought with weather conditions from 1941 and 1942 at selected groundwater stations: (a) Perniö (South-Western Finland), (b) Akonjoki (Central Finland), (c) Sodankylä (Northern Finland).
Sustainability 11 02450 g005
Figure 6. Climate change impact on droughts during the control period (1981–2010). Changes in minimum (a) discharges, and (b) water levels when climate change scenarios for 2040–2069 (average representative concentration pathways (RCP) 4.5 scenario) are compared to the period 1981–2010.
Sustainability 11 02450 g006
Figure 7. Climate change impacts on the reference drought period conditions. Changes in minimum (a) discharges, and (b) water levels when the climate change signal for 2040–2069 (average RCP 4.5 scenario) was added to the weather during the reference drought.
Sustainability 11 02450 g007
Figure 8. Modeled (a) lake storage and (b) ground and soil water storage for the average and normal range of changes in 1981–2010 and changes during the reference drought. Lake storage includes all of the largest lakes in Finland with a surface area of over 1 km2.
Sustainability 11 02450 g008
Table 1. Climate scenarios used in the study.
AbbreviationRCPGCMT Change 2040–2069P Change 2040–2069
Average RCP2.62.6average of 28 GCMs1.9 °C5.8%
Average RCP4.54.5average of 28 GCMs2.5 °C7.4%
Average RCP8.58.5average of 28 GCMs3.4 °C10.6%
Warm and wet 14.5MIROC-ESM-CHEM4.1 °C14.2%
Warm and dry 14.5HadGEM2-CC2.9 °C7.0%
Cold and wet 14.5CESM1-BGC2.1 °C7.4%
Cold and dry 14.5CESM1-BGC1.5 °C0.8%
1 Selected from an ensemble of 28 scenarios.
Table 2. Comparison of the simulated discharge for the reference drought and the observed average discharge in 1939–1942 in the five largest rivers in Finland (for locations see Figure 1).
River, Observation PointObserved Discharge (m3/s)Simulated Discharge (m3/s)Difference (%)
Kemijoki (Isohaara)4044132.2
Oulujoki (Pyhäkoski)151141−6.6
Kokemäenjoki (Harjavalta)1071113.7
Kymijoki (Anjala)13615010
Vuoksi (Imatra)361331−8.3
Table 3. Average annual and minimum monthly discharge in the control period and with different climate scenarios in 2040–2069 and during the reference drought.
Time PeriodAverage Annual Discharge (m3/s) Change of Average Annual Discharge (%)Minimum Monthly Discharge (m3/s)Change of Minimum Monthly Discharge (%)
Southern and Central Finland *
Control period1981–20101810 592
Climate scenarios for the period 2040–2069 with control periodAverage RCP2.6 18200.3491−17
Average RCP4.518301.4487−18
Average RCP8.518703.2476−20
Warm and wet19809.5465−21
Warm and dry1800−0.5449−24
Cold and wet18200.4489−17
Cold and dry1690−6.7462−22
Reference drought1939–1942946 533
Climate scenarios for the period 2040–2069 with reference droughtAverage RCP2.6 9641.9491−7.8
Average RCP4.59803.6487−8.6
Average RCP8.510106.9476−11
Warm and wet111017465−13
Warm and dry941−0.5449−16
Cold and wet923−2.4489−8.2
Cold and dry895−5.4462−13
Northern Finland *
Control period1981–20101810 592
Climate scenarios for the period 2040–2069 with the control periodAverage RCP2.6 22704.88030.5
Average RCP4.522906.0775−3.0
Average RCP8.5239010688−14
Warm and wet23709.7726−9.2
Warm and dry22102.3676−15
Cold and wet2380108415.2
Cold and dry2000−7.5628−21
Reference drought1939–19421510 815
Climate scenarios for the period 2040–2069 with the reference droughtAverage RCP2.6 15905.0803−1.4
Average RCP4.516006.1775−4.8
Average RCP8.5168011688−16
Warm and wet168011726−11
Warm and dry1510−0.2676−17
Cold and wet1700128413.2
Cold and dry1380−8.5628−23
* Southern and Central Finland approximately south of the city of Oulu (latitude 65 °N), Northern Finland north of Oulu (including River Oulujoki).
Table 4. Simulated hydropower production in Finland for the control period 1981–2001 and for the reference drought and climate change impact for 2040–2069 (with the average RCP 4.5 scenario).
PeriodAverage Discharge (m3/s) of Major Hydropower Plants 1,2Annual Production (TW) of Major Hydropower Plants 1
Simulated control period 1981–201020212.0
Simulated reference drought—third year (1941 weather)1126.8
Simulated reference drought—fourth year (1942 weather)1066.5
Climate change 2040–206921712.9
Simulated climate change with control period21712.9
Simulated reference drought—third year (1941 weather)1136.8
Simulated reference drought—fourth year (1942 weather)1076.6
1. All hydropower plants in Finland with a capacity over 10 MW, ~92% of total capacity. 2 Without spillage.

