Experimental Research on Heat Transfer and Strength Analysis of Backfill with Ice Grains in Deep Mines


1
Energy School, Xi’an University of Science and Technology, Xi’an 710054, China
2
Key Laboratory of Western Mines and Hazards Prevention, Ministry of Education of China, Xi’an 710054, China
*
Authors to whom correspondence should be addressed.
Sustainability 2019, 11(9), 2486; https://0-doi-org.brum.beds.ac.uk/10.3390/su11092486
Submission received: 17 April 2019
/
Accepted: 24 April 2019
/
Published: 28 April 2019
(This article belongs to the Section Energy Sustainability)
Abstract
:In deep mines, two urgent problems are a high temperature thermal environment and solid waste. Filling the goaf with slurry mixed with ice grains is an effective way to solve these two problems simultaneously. The thermal property and mechanical property of the ice-added backfill have a great influence on the cooling effect in the deep mine. In this study, an experimental facility for measuring the temperature distribution of ice-added backfill slurry was established, and the temperature of backfill slurry with different proportions was measured. Then, the thermal properties of temperature distribution and cooling capacity and the mechanical property of uniaxial compressive strength of the backfill specimens were analyzed, and the results indicated the following: firstly, the cooling capacity of ice-added backfill specimens is negatively related with the slurry concentration C and is positively related with the ice-water ratio Ω; secondly, the strength of backfill specimens is affected by the slurry concentration C and ice-water ratio Ω by a contrary law compared to the cooling capacity; thirdly, ice-added backfill slurry with an ice-water ratio Ω of 1:1 has the best mechanical property after solidification. The effects of the slurry concentration and ice-water ratio on the thermal and mechanical properties were analyzed, and the results indicated that the optimum proportion of ice-added backfill slurry is a slurry concentration of 74% and an ice-water ratio of 1:1 in the present research range. This study is significant for the deep mine cooling method with ice-added backfill.
1. Introduction
Mineral resources are one of the important material bases for social development and progress, and with economic development, shallow mineral resources are being gradually exhausted at present. There are many deep mines in major mining countries worldwide such as South Africa, Canada, Poland, etc., and deep mining is the future [1,2]. It is predicted that in the future China’s mineral resource exploitation will be concentrated in deep mines above 1000 m, and deep mining will become the norm [3]. With the increasing depth of mining, the higher the origin rock temperature, the higher the underground temperature [4,5]. Since the 1970s, the number of mines threatened by heat hazard has been growing, which has become a widespread problem in mines [6]. China’s Technical Specification for Ventilation System of Metallic and Non-Metallic Underground Mine requires that the underground operation site’s air temperature should not exceed 28 °C [7]. The heat hazard of the high temperature mines mainly includes two aspects: one is the harm to the physical health of the miner; the other is the impact on the safety production of the mine. The thermal hazard will make the miners suffer from heat stroke and heat cramp [8,9]. Working for a long time will also make the workers feel uncomfortable, irritated, and suffer eczema and other diseases that will seriously affect the safety production efficiency of the mine [10]. Subsidence can also threaten workers’ lives, although the probability of this happening is very small [11,12,13]. In addition, the waste stone and tailings produced by mining also cause serious environmental pollution problems [14,15,16].
At present, there are two common ways to deal with the problem of thermal hazard caused by high ground temperature, namely, artificial refrigeration and non-artificial refrigeration [17]. The common non-artificial refrigeration cooling methods include ventilation cooling, heat insulation and individual protection [18,19]; the common artificial refrigeration methods are ice cooling, water cooling and cold-heat-electricity cogeneration [20]. However, the non-artificial refrigeration cooling methods are not suitable to be applied to the cooling of deep mines due to their limited cooling capacity [21]. Artificial refrigeration cooling requires large energy consumption in its application, which will bring greater economic pressure to the mine [22]. For the treatment of the mine environment, the method of paste filling mining can be used to prevent collapse and remove the solid waste from mines, which can effectively ensure the safety of mine production [23,24].
New technology, combined with filling mining and mine thermal damage control, is very significant for green, safe and efficient mining. Ghoreishi-Madiseh S.A. et al. [25] confirmed the feasibility of applying the novel idea of harvesting geothermal energy from underground mine stopes, indicating that it could create “sustainable mining communities” that can produce inexpensive, clean and renewable energy not only during the mining operation, but also long after mine depletion. Liu Lang [26] et al. proposed the academic concept of “function backfill”, and the three concepts of “cold load/storage function backfill”, “heat storage and release function backfill” and “cavity-building function backfill” are defined. Wang Mei [27,28] et al. proposed a method to cool the stope by filling cold load and storage (CLS) phase change material in backfill slurry. This cooling method has the advantages of reducing the investment and operation cost of the mine cooling system, reducing the corresponding management workload and reducing the probability of fire occurrence. At the same time, thermocouples are often used to measure the temperature field in concrete installations [29,30]. In order to study the distribution characteristics of the internal temperature field of backfill specimens at different ratios, a plurality of temperature measuring points was set in the test mold, the temperature change of backfill specimens in the test mold was monitored and recorded in real time by using the temperature-measuring instrument in this paper, and the law of temperature variation was analyzed to study the cold release and cooling ability of different backfill slurry proportions. At the same time, the uniaxial compressive strength of backfill bodies for different slurry proportions was tested in order to analyze the mechanical properties of ice-added backfill bodies.
2. Experimental Proportioning
In view of the ice-added backfill mining method proposed in this paper, a performance test scheme of ice-added backfill bodies based on backfill mining was designed. The raw materials used in the test comprised tailings, silicate cement, ice grains and water. The physical parameters of various materials are shown in Table 1. Copper mine tailings were used as the backfill aggregate, Portland Cement P.O42.5 was used as the binder, tap water was added for preparing the backfill slurry, and some of the water was replaced by ice grains. The size of the ice grains was about 3–5 mm.
Slurry concentration C and ice-water ratio Ω are the main parameters affecting the mass of ice in slurry, and they can be calculated by the following equations:
where mt is the mass of tailings, kg; mc is the mass of cement, kg; mi is the mass of ice grains, kg; and mw is the mass of water, kg.
In order to analyze the effect of the slurry concentration and ice-water ratio on the internal temperature and strength of the backfill body, slurry concentrations of 74%, and 76% [31], ice-water ratios of 0, 1:1, 6:5, 7:5, and 8:5, and a cement-sand ratio of 1:4 are adopted in the experiment. The compositions of slurry for various proportions are shown in Table 2 and Table 3.
3. Experimental Test
Before the backfill slurry was prepared, the mass of various raw materials required for the preparation of slurry at a certain concentration and a certain ice-water ratio was determined according to the method of theoretical calculation and was weighed using an electronic scale with an accuracy of 0.1 g. In the process of preparing the slurry, the pre-weighed tailings and cement were added to the container and stirred to make the mixture evenly distributed, then water was added slowly in proportion, and stirring was continued in the process of adding water. Finally, ice grains were added and stirred evenly to finish the preparation of slurry. The prepared slurry was immediately poured into the cube test module for temperature measurement, and the experiment was conducted in an environment with a basically constant temperature. The experimental process and experimental testing device are shown in Figure 1 and Figure 2, respectively.
In order to ascertain the temperature change in the backfill specimens, a large size cube module with a side length of 150 mm was used. A K-type thermocouple with an accuracy of 0.38 °C was used to measure temperature, 19 temperature measuring points were set inside the backfill specimens and the thermocouples were arranged and fixed in advance, the layout of measuring points is shown in Figure 3, and a temperature measuring point was set in the indoor environment to record the ambient temperature in real time. The PXI (a PC-based measurement and automation platform released by National Instruments) temperature measurement system was used for monitoring and measuring the temperature and for recording the experimental data.
4. Experimental Results and Analysis
The temperature distribution, cooling capacity and uniaxial compressive strength of ice-added backfill specimens were analyzed at different ice-water ratios and different slurry concentrations, respectively.
4.1. Effect of Ice-Water Ratio on the Properties of the Backfill Body
4.1.1. Temperature Distribution
(1) Temperature distribution characteristics of a single specimen
Taking the backfill specimen at a slurry concentration of 74% and ice-water ratio of 6:5 as an example, the temperature field distribution in the cube module was analyzed, and the ambient temperature was controlled at 22 °C.
The curves of temperature changes with time at different temperature measuring points on two horizontal planes are shown in Figure 4. It can be seen that a large number of ice grains will melt and absorb heat, resulting in a lower temperature inside the test module at the early stage of the experiment. In addition, because the heat release rate of the cement hydration reaction is fast, and the difference between initial slurry temperature and ambient temperature is large at the early stage, the heat transfer effect is obvious and the temperature variation inside the backfill slurry is significantly great at this stage. The temperature variation of each measuring point decreases gradually as the experiment goes on, and finally tends to level off. The temperatures of different measuring points at the same time are compared, and it can be seen that the farther away from the central point, the higher the temperature will be on the same horizontal surface.
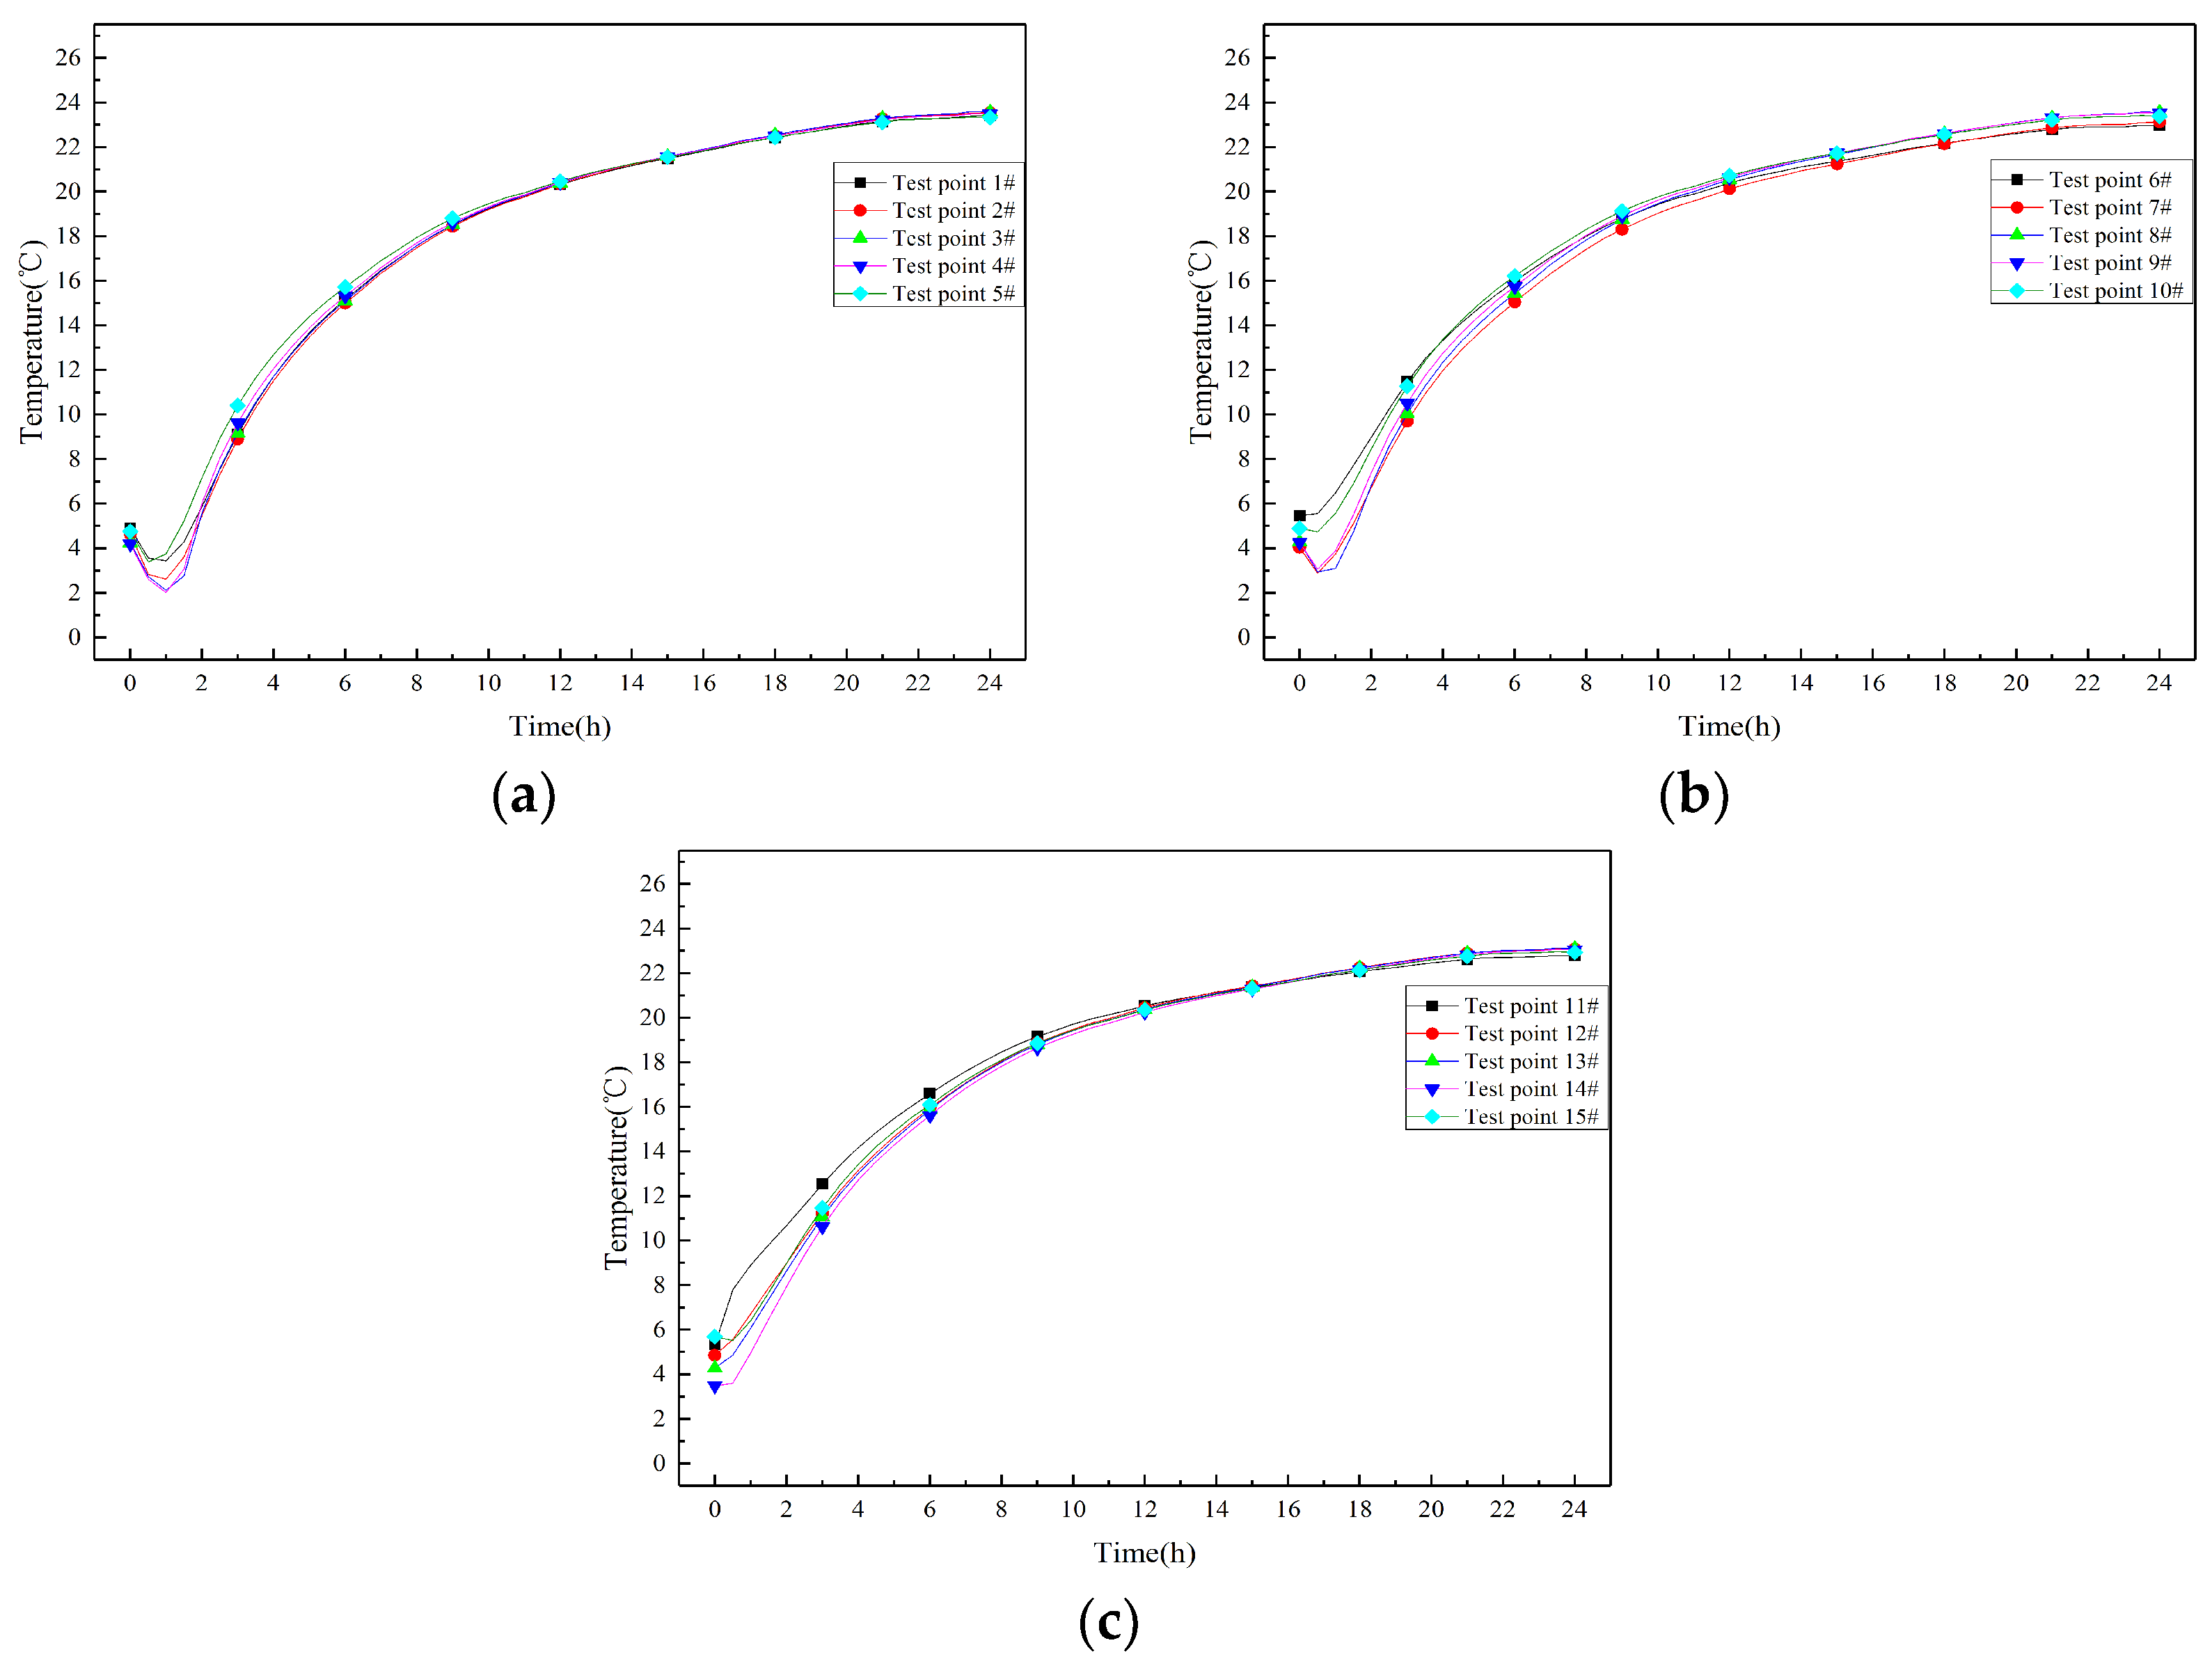
The curves of temperature changes with time at different temperature points on three vertical lines are shown in Figure 5. The temperatures at the same time of different temperature measuring points on any one vertical line are analyzed, and the distribution characteristics of low temperatures near the center are presented. Compared with the temperature distribution on horizontal planes, the temperature change rate is also greater at the initial stage and decreases gradually as the experiment goes on. At the beginning of the experiment, the temperature of each measuring point undergoes a pattern of decreasing and then increasing. Since the temperatures of tailings, cement and water are close to ambient temperature in the experiment, the temperature will be slightly decreased after adding ice grains to form backfill slurry. The temperature starts to rise under the effect of cement hydration heat release and heat transfer between the mold and external environment after the ice grains are melted. At the end stage of the experiment, the temperature of each temperature measuring point will be higher than the ambient temperature, because the hydration reaction inside the backfill slurry is still ongoing in this period, and the heat storage inside the test mold is higher than the heat exchange between the mold and external environment. To sum up, the distribution of temperature field in the inner cube test module has the characteristics of low central temperature and high surrounding temperature, because the temperature change rate is fast at the early stages of the experiment and gradually decreases after 3 h.
(2) Comparison of temperature characteristics for specimens at different ice-water ratios
Under the conditions of 74% slurry concentration and different ice-water ratios, the change in average temperature with time for backfill specimens is analyzed. The changes in average temperature with time are shown in Figure 6, and it is shown that the overall variation law of average temperature is similar to that of the temperature of each measuring point in backfill specimens with time. It also shows that the temperature change rate is faster at the early stage and decreases gradually towards the end stage. The ice-water ratio has a certain effect on average temperature: when the ice-water ratio increases from 1:1 to 8:5, the average temperature decreases successively. At the same slurry concentration, the greater the ice-water ratio, the greater the mass of ice contained in backfill slurry, and the lower the corresponding average temperature. For an ice-water ratio of 0, the temperature increases firstly with time and then decreases slightly. The reason for this change is mainly because of the rate of cement hydration reaction [32,33].
4.1.2. Cooling Capacity
The purpose of ice-added backfill is to realize mining and deep mine cooling at the same time. The cooling capacity of ice-added backfill mainly includes two aspects: one is latent heat absorbed by the melting of ice grains, the other is sensible heat absorbed by water temperature rise after the ice grains melt into water.
The latent heat of melting ice grains is expressed as Q1, and the sensible heat of water temperature is expressed as Q2. They can be calculated as follows:
where q is the melting heat of ice grains, q = 3.35 × 10⁵ J/kg; CW is the heat capacity of water, CW = 4.2 × 10³ J/(kg·°C) Tinit is the average temperature of multiple temperature measurement points in the backfill specimen at 0 h, in °C; and Tend is the average temperature of multiple temperature measurement points in the backfill specimen at 24 h, in °C.
The total heat absorbed by the ice-added backfill body is expressed as Q. Considering the difference of mass in the slurry preparation, the heat absorbed by the unit mass slurry is defined as the cooling capacity, and can be calculated as follows:
where φ is the cooling capacity; and Q = Q1 + Q2.
Figure 7 shows the cooling capacity of backfill specimens. For ice-free backfill slurry, the temperature continues to rise due to the cement hydration heat release, so the cooling capacity is a negative value. The ice-free backfill body does not have the cooling capacity defined in this paper. It can be seen that the cooling capacity of ice-added backfill is far greater than the heat generated by the cement hydration reaction at the same time. For ice-added backfill specimens, the cooling capacity increases as the ice–water ratio increases successively from 1:1 to 8:5. The cooling capacity at an ice–water ratio of 8:5 is 14.5% higher than that at a ratio of 1:1 for the backfill specimens at a slurry concentration of 74%.
4.1.3. Compressive Strength Analysis
At present, the most basic requirement of mine backfill technology is to meet the intensity requirement of mine backfill. [34,35,36] In the tailings backfill technology, uniaxial compressive strength at 28 days is required to be greater than 1 MPa, so the ice-added backfill bodies must also meet the requirements of the uniaxial compressive strength test [37,38,39,40]. In the test, standard cylindrical specimens with a diameter of 50 mm were made using backfill slurry of different proportions. After 14 days of constant temperature and humidity curing, the uniaxial compressive strength of backfill specimens corresponding to each proportion was measured. As can be seen in Figure 8, when the slurry concentration is 74% and 76% respectively, the uniaxial compressive strength decreases gradually as the ice-water ratio increases from 1:1 to 8:5. When cement solidifies, there will still be some ice grains that are not completely melted, which will form a small cavity inside the backfill body. This affects the pores inside the backfill body and thus affects the compressive strength of the backfill body. However, the minimum value is still higher than 1 MPa, which meets the basic mechanical performance requirements of mine backfill technology. At the same time, the analysis of the obtained data shows that the changes in uniaxial compressive strength of backfill under different proportions are various. The uniaxial compressive strength values of ice-free backfill were used as contrast values. The uniaxial compressive strength values of backfill at ice-water ratios of 1:1, 6:5 and 7:5 are higher than that of ice-free backfill at a slurry concentration of 74%. The melting time of ice grains is uncertain after the ice grains are added to the backfill slurry. According to the analysis of uniaxial compressive strength, the mass of ice grains will affect the mechanical properties of the ice-added backfill body, although the uniaxial compressive strength of the ice-added backfill specimens decreases with the increasing ice-water ratio. The uniaxial compressive strength values of backfill specimens at ice-water ratios of 1:1 and 6:5 are greater than those of ice-free backfill, and the backfill body at an ice-water ratio of 1:1 has the maximum uniaxial compressive strength.
4.2. Effect of Slurry Concentration on the Properties of Backfill Body
In order to analyze the effect of slurry concentration on the performance of the ice-added backfill body, the backfill body specimens at different slurry concentrations for the same ice–water ratio were selected.
4.2.1. Temperature Distribution
Under the conditions of ice-water ratios of 0, 1:1, 6:5, 7:5 and 8:5, the variation of average temperature inside the backfill body at different slurry concentrations is compared in Figure 9. Compared with the ice-added backfill specimens, the average temperatures of ice-free backfill bodies at two concentrations are relatively close. This is because the initial temperature of the ice-free backfill body is higher, the temperature difference between the early and the end stage of experiment is small, and the heat conduction and heat convection between backfill specimens and external environment through the wall of cube test module are not obvious. At the two different slurry concentrations of ice-free backfill bodies, the average temperature decreases at the end stage of the experiment. According to the characteristics of hydration reaction rate of cement in different periods, hydration reaction gradually weakens at the end stage, so the average temperature decreases. For ice-added backfill bodies, when the ice-water ratio is the same, the higher the slurry concentration, the higher the average temperature. From the change of average temperatures with time, the average temperatures are different for backfill bodies at different concentrations, the temperature of the backfill body at a slurry concentration of 74% is slightly lower than that at a slurry concentration of 76%, which is due to the fact that the backfill body at a slurry concentration of 74% contains more ice grains and has more cooling capacity at the initial stage. At the same time, it was found that the variation of temperature rise rate with time is different for backfill bodies at different concentrations. This is because the heat release rate of the cement hydration reaction is affected by both time and temperature: different temperatures of backfill bodies at the same time leads to different heat release rates, and then the subsequent temperature rise is different [41].
4.2.2. Cooling Capacity
At the same ice-water ratio, the cooling capacity of backfill specimens at different slurry concentrations is shown in Figure 7. It can be seen that for the same ice-water ratio, the greater the slurry concentration, the smaller the cooling capacity. The reason for this is that the greater the slurry concentration, the more the mass of tailings and cement in the backfill slurry, and the less the mass of ice grains added, therefore, the latent heat absorbed by ice grains and the sensible heat absorbed by water will be less. For the ice-added backfill specimens at different ice-water ratios, the increased degree of each group’s backfill specimen cooling capacity is different. When the ice-water ratio is 8:5, the cooling capacity of the backfill specimen at a slurry concentration of 74% is 16.1% more than that of the backfill specimen at a slurry concentration of 76%. When the ice-water ratio is 7:5, the cooling capacity of the backfill specimen at a slurry concentration of 74% is 7.3% more than that of the backfill specimen at a slurry concentration of 76%. The cooling capacity of backfill specimens at a slurry concentration of 74% is on average 10.8% more than that of backfill specimens at a slurry concentration of 76% for the all ice-added backfill specimens.
4.2.3. Compressive Strength Analysis
As can be seen in Figure 8, the higher the slurry concentration, the higher the uniaxial compressive strength. A higher slurry concentration contains a larger mass of tailings and cement, especially the latter. Because the cement in backfill slurry mainly plays a role of consolidation and solidification, the mass of cement added directly affects the strength of the backfill body [42]. That is to say, the consolidation and solidification effect is more obvious at higher slurry concentrations. For the ice-added backfill specimens at different ice-water ratios, the increased degrees of each group’s backfill specimens’ uniaxial compressive strength are different. When the ice-water ratio is 8:5, the uniaxial compressive strength of the backfill body at a slurry concentration of 76% is 18.3% more than that of the backfill specimen at a slurry concentration of 74%. When the ice-water ratio is 7:5, the uniaxial compressive strength of the backfill body at a slurry concentration of 76% is 5.8% more than that of the backfill specimen at a slurry concentration of 74%. For the all ice-added backfill specimens, the uniaxial compressive strength of backfill specimens at a slurry concentration of 76% is on average 9.4% more than that of backfill specimens at a slurry concentration of 74%.
4.3. Error Analysis
In the measurement and data analysis of temperature, errors are inevitable. Errors mainly involve random errors and systematic errors in measurement, as well as the introduction of indirect measurement data error transfer in data analysis. Direct measurement error mainly includes random error, systematic error and gross error. For direct measurement error, the root mean square error is used, as shown in Equation (7):
where σ is the root mean square error; n is the number of measurements; is the average value of the measured data.
As shown in Table 4, the environmental temperatures from five parallel experiments were taken as an example to calculate the φ.
Indirect measurement error is mainly the error existing in the calculation of cooling capacity. The maximum absolute error of indirect measurement parameters can be calculated according to Equation (8):
where is the error transfer coefficient; is the absolute error of direct measurement; is the absolute error of indirect measurement.
According to Equations (3)–(6), the error transfer coefficients for cooling capacity are calculated as:
The temperature of the backfill specimen at a slurry concentration of 74% and an ice–water ratio of 1:1 was analyzed. In this case, is (23.552 ± 0.38) °C, and is (3.892 ± 0.38) °C. It has been calculated that the maximum relative error is 1.28%.
5. Conclusions
In this paper, an experimental facility for measuring the temperature distribution of ice-added backfill slurry is established, and the temperatures of backfill slurry with different proportions were measured. Based on the analysis of the temperature distribution, cooling capacity and uniaxial compressive strength of backfill specimens, the following conclusions can be drawn:
- (1)
- Based on the temperature distribution in the horizontal plane and vertical line for the ice-added backfill specimens, it is evident that the temperature increases gradually from the center to the periphery for the overall temperature distribution of the backfill body. The temperature change rate at each measurement point of the backfill body is relatively large in the initial stage, and the temperature change rate gradually decreases as the experiment progresses. The variation of average temperature with time has the same rule for all backfill specimens.
- (2)
- At the same slurry concentration, the greater the ice-water ratio, the greater the cooling capacity and the smaller the uniaxial compressive strength. The uniaxial compressive strength of the ice-free backfill body is less than that of many ice-added backfill bodies at different ice-water ratios, and the uniaxial compressive strength is greatest when the ice-water ratio is 1:1. At the same ice-water ratio, the slurry concentration is positively correlated with the average temperature and uniaxial compressive strength, and negatively correlated with the cooling capacity. For the all ice-added backfill specimens, the cooling capacity of backfill specimens at a slurry concentration of 74% is on average 10.8% more than that of backfill specimens at a slurry concentration of 76%. The uniaxial compressive strength of backfill specimens at a slurry concentration of 76% is on average 9.4% more than that of backfill specimens at a slurry concentration of 74%.
- (3)
- At the same slurry concentration, the mechanical properties of backfill bodies at ice-water ratios of 1:1 and 6:5 are better than those without ice grains, yet the greater the ice-water ratio, the better the cooling capacity. On the contrary, the higher the slurry concentration, the worse the cooling capacity. The effect of the slurry concentration and ice-water ratio on cooling capacity and mechanical properties was considered: for an ice-water ratio of 1:1, the cooling capacity of the backfill body at a slurry concentration of 74% is 11.3% higher than that of the backfill body at a slurry concentration of 76%. For a slurry concentration of 74%, the cooling capacity of the backfill body at an ice-water ratio of 6:5 is only 1.4% higher than that of the backfill body at an ice–water ratio of 1:1, however, the required ice grain mass increases by 8.9%. Therefore, it can be judged that an ice-water ratio of 1:1 and a slurry concentration of 74% is the optimal proportion in this study.
Author Contributions
Conceptualization, M.W. and L.L.; methodology, X.Z.; data curation, Y.J.; writing—original draft preparation, X.Z. and Y.J.; writing—review and editing, M.W. and Y.J.; supervision, L.L.
Funding
The authors are grateful for the support provided by Natural Science Basic Research Plan in Shaanxi Province of China (Nos.2018JQ5183, 2018JM5161), Scientific Research Program Funded by Shaanxi Provincial Education Department of China (Nos.18JK0523, No.18JK0527) National Science Foundation of China (Nos. 51674188, 51504182, 51874229), the Shaanxi Innovative Talents Cultivate Program-New-star Plan of Science and Technology of China (No.2018kjxx-083), the China Postdoctoral Science Foundation (No.2015M582685) and PHD research startup foundation of Xi’an University of Science and Technology (No.2018QDJ046).
Acknowledgments
The authors are grateful for the support provided by Energy School, Xi’an University of Science and Technology, and Key Laboratory of Western Mines and Hazards Prevention, Ministry of Education of China.
Conflicts of Interest
The authors declare no conflict of interest concerning the publication of this paper.
References
- Pathegama, G.R.; Zhao, J.; Ju, M.H.; Radhika, V.S.D.S.; Tharaka, D.R.; Adheesha, K.M.S.B. Opportunities and challenges in deep mining: A brief review. Engineering 2017, 4, 546–551. [Google Scholar]
- Yao, J.R.; Gong, F.Q. Dynamic problems in deep exploitation of hard rock metal mines. Chin. J. Nonferrous Met. 2011, 21, 2551–2563. [Google Scholar]
- Li, X.B.; Zhou, J.; Wang, S.F.; Liu, B. Review and practice of deep mining for solid mineral resources. Chin. J. Nonferrous Met. 2017, 27, 1236–1262. [Google Scholar]
- He, M.C. Application of HEMS cooling technology in deep mine heat hazard control. Min. Sci. Technol. 2009, 19, 269–275. [Google Scholar] [CrossRef]
- He, M.C.; Xu, M. Research and development of HEMS cooling system and heat-harm control in deep mine. Chin. J. Rock Mech. Eng. 2008, 27, 1353–1361. [Google Scholar]
- Yang, X.J.; Han, Q.Y.; Pang, J.W.; Shi, X.W.; Hou, D.G.; Liu, C. Progress of heat-hazard treatment in deep mines. Min. Sci. Technol. 2011, 21, 295–299. [Google Scholar]
- State Administration of Work Safety. Ventilation Technical Standards for Metal and Nonmetal Underground Mines, Ventilation System. Available online: http://www.chinasafety.gov.cn/fw/flfgbz/bz/bzwb/index_11.shtml (accessed on 28 April 2019).
- Su, Z.G.; Jiang, Z.G.; Sun, Z.Q. Study on the heat hazard of deep exploitation in high temperature mines and its evaluation index. Procedia Earth Planet. Sci. 2009, 1, 414–419. [Google Scholar] [CrossRef]
- Zhao, Y.J.; Zhang, Z.H.; Ji, C.F.; Liu, L.; Zhang, B.; Huan, C. Characterization of particulate matter from heating and cooling several edible oils. Build. Environ. 2019, 152, 204–213. [Google Scholar] [CrossRef]
- Nie, X.X.; Wei, X.B.; Li, X.C.; Lu, C.W. Heat treatment and ventilation optimization in a deep mine. Adv. Civ. Eng. 2018, 2018, 1529490. [Google Scholar] [CrossRef]
- Jin, H.; Nie, W.; Zhang, Y.S.; Wang, H.K.; Zhang, H.; Bao, Q.; Yan, J. Development of environmental friendly dust suppressant based on the modification of soybean protein isolate. Processes 2019, 7, 165. [Google Scholar] [CrossRef]
- Liu, Q.; Nie, W.; Hua, Y.; Peng, H.T.; Liu, C.Q.; Wei, C.H. Research on tunnel ventilation systems: Dust diffusion and pollution behaviour by air curtains based on CFD technology and field measurement. Build. Environ. 2019, 147, 444–460. [Google Scholar] [CrossRef]
- Cai, P.; Nie, W.; Chen, D.W.; Yang, S.B.; Liu, Z.Q. Effect of air flow rate on pollutant dispersion pattern of coal dust particles at fully mechanized mining face based on numerical simulation. Fuel 2019, 239, 623–635. [Google Scholar] [CrossRef]
- Song, C.W.; Yu, G.M.; Xuan, B.F. A huge source of pollution hazard—Disaster and cure of tailings pond. In Proceedings of the 2011 International Conference on Electronics, Communications and Control (ICECC), Ningbo, China, 9–11 September 2011; pp. 3486–3489. [Google Scholar]
- Zhang, J.X.; Zhang, Q.; Sun, Q.; Gao, R.; Germain, D.; Abro, S. Surface subsidence control theory and application to backfill coal mining technology. Environ. Earth Sci. 2015, 74, 1439–1448. [Google Scholar] [CrossRef]
- Jin, H.; Nie, W.; Zhang, H.H.; Liu, Y.H.; Bao, Q.; Wang, H.K.; Huang, D.M. Preparation and characterization of a novel environmentally friendly coal dust suppressant. J. Appl. Polym. Sci. 2019, 136, 47354. [Google Scholar] [CrossRef]
- Song, D.P.; Zhou, X.H.; Li, J.Y.; Bai, G. Liquid carbon dioxide phase change refrigeration and cooling technology of high temperature mine. Coal Sci. Technol. 2017, 45, 82–87. [Google Scholar]
- Chai, H.L.; Wang, J.X.; Wang, J.G.; Bao, L.L. The heat source analysis and the research and development on air-cooling in deep mines. Met. Mine 2014, 5, 151–154. [Google Scholar]
- Zhao, Y.J.; Li, R.Y.; Ji, C.F.; Huan, C.; Zhang, B.; Liu, L. Parametric study and design of an earth air heat exchanger using model experiment for memorial heating and cooling. Appl. Therm. Eng. 2019, 148, 838–845. [Google Scholar] [CrossRef]
- Huang, S.Y.; Zhao, X.Y.; Li, G.; Zhou, W.; Liang, X. Analysis on the model of artificial refrigeration cooling system in deep metal mines. Met. Mine 2018, 5, 165–171. [Google Scholar]
- Wu, L.L.; Luo, X.R.; Li, L. The situation and development of high temperature coal mine air-conditioning technology. Refrig. Air Cond. 2012, 26, 97–100+106. [Google Scholar]
- Wu, L. Study on heat-harm control for circular economy and sustainable development in green mining. Contam. Control. Air Cond. Technol. 2018, 1, 29–32. [Google Scholar]
- Wu, A.X.; Wang, Y.; Wang, H.J. Status and prospects of the paste backfill technology. Ment. Mine 2016, 7, 1–9. [Google Scholar]
- Yang, S.L.; Bai, Y.G.; Li, J. Comprehensive analysis on present status of mine backfill mining and prospects. Coal Eng. 2013, 45, 4–6+10. [Google Scholar]
- Ghoreishi-Madiseh, S.A.; Hassani, F.; Abbasy, F. Numerical and experimental study of geothermal heat extraction from backfilled mine stopes. Appl. Therm. Eng. 2015, 90, 1119–1130. [Google Scholar] [CrossRef]
- Liu, L.; Xin, J.; Zhang, B.; Zhang, X.Y.; Wang, M.; Qiu, H.F.; Chen, L. Basic theories and applied exploration of functional backfill in mines. J. China Coal Soc. 2018, 43, 1811–1820. [Google Scholar]
- Wang, M.; Liu, L.; Chen, L.; Zhang, X.Y.; Zhang, B.; Ji, C.F. Cold load and storage functional backfill for cooling deep mine. Adv. Civ. Eng. 2018, 2018, 5435214. [Google Scholar] [CrossRef]
- Wang, M.; Liu, L.; Zhang, X.Y.; Chen, L.; Wang, S.Q.; Jia, Y.H. Experimental and numerical investigations of heat transfer and phase change characteristic of cemented paste backfill with PCM. Appl. Therm. Eng. 2019, 150, 121–131. [Google Scholar] [CrossRef]
- Huang, Y.H.; Liu, G.X.; Huang, S.P.; Rao, R.; Hu, C.F. Experimental and finite element investigations on the temperature field of a massive bridge pier caused by the hydration heat of concrete. Constr. Build. Mater. 2018, 192, 240–252. [Google Scholar] [CrossRef]
- Sallal, R.A.; Nildem, T.; Mustafa, Ö. Experimental analysis of temperature gradients in concrete box-girders. Constr. Build. Mater. 2016, 106, 523–532. [Google Scholar]
- Mamadou, F.; Mukesh, P. Coupled effects of sulphate and temperature on the strength development of cemented tailings backfills: Portland cement-paste backfill. Cem. Concr. Compos. 2010, 10, 819–828. [Google Scholar]
- Liu, L.; Zhu, C.; Qi, C.C.; Zhang, B.; Song, K. A microstructural hydration model for cemented paste backfill considering internal sulfate attacks. Constr. Build. Mater. 2019, 211, 99–108. [Google Scholar] [CrossRef]
- Liu, L.; Yang, P.; Qi, C.C.; Zhang, B.; Guo, L.J.; Song, K. An experimental study on the early-age hydration kinetics of cemented paste backfill. Constr. Build. Mater. 2019, 212, 283–294. [Google Scholar] [CrossRef]
- Shan, P.F.; Lai, X.P. Numerical simulation of the fluid-solid coupling process during the failure of a fractured coal-rock mass based on the regional geostress characteristics. Transp. Porous Media 2018, 124, 1061–1079. [Google Scholar] [CrossRef]
- Liu, Z.Q.; Nie, W.; Peng, H.T.; Yang, S.B.; Chen, D.W.; Liu, Q. The effects of the spraying pressure and nozzle orifice diameter on the atomizing rules and dust suppression performances of an external spraying system in a fully-mechanized excavation face. Powder Technol. 2019, 350, 62–80. [Google Scholar] [CrossRef]
- Wang, H.; Nie, W.; Cheng, W.M.; Liu, Q.; Jin, H. Effects of air volume ratio parameters on air curtain dust suppression in a rock tunnel’s fully-mechanized working face. Adv. Powder Technol. 2018, 29, 230–244. [Google Scholar] [CrossRef]
- Ercikdi, B.; Baki, H.; İzki, M. Effect of desliming of sulphide-rich mill tailings on the long-term strength of cemented paste backfill. J. Environ. Manag. 2013, 115, 5–13. [Google Scholar] [CrossRef] [PubMed]
- Yang, S.B.; Nie, W.; Lv, S.S.; Liu, Z.Q.; Peng, H.T.; Ma, X.; Cai, P.; Xu, C.W. Effects of spraying pressure and installation angle of nozzles on atomization characteristics of external spraying system at a fully-mechanized mining face. Powder Technol. 2019, 343, 754–764. [Google Scholar] [CrossRef]
- Peng, H.T.; Nie, W.; Cai, P.; Liu, Q.; Liu, Z.Q.; Yang, S.B. Development of a novel wind-assisted centralized spraying dedusting device for dust suppression in a fully mechanized mining face. Environ. Sci. Pollut. Res. 2019, 26, 3292–3307. [Google Scholar] [CrossRef] [PubMed]
- Bao, Q.; Nie, W.; Liu, C.Q.; Liu, Y.H.; Zhang, H.H.; Wang, H.K.; Jin, H. Preparation and characterization of a binary-graft-based, water-absorbing dust suppressant for coal transportation. J. Appl. Polym. Sci. 2019, 136, 47065. [Google Scholar] [CrossRef]
- Qi, C.C.; Liu, L.; He, J.; Chen, Q.; Yu, L.J.; Liu, P. Understanding cement hydration of cemented paste backfill: DFT study of water adsorption on tricalcium Silicate (111) Surface. Minerals 2019, 9, 202. [Google Scholar] [CrossRef]
- He, Q.Y.; Li, Y.C. Mechanical Properties of Basalt Specimens Under Combined Compression and Shear Loading at Low Strain Rates. Rock Mech. Rock Eng. 2019, 1–12. [Google Scholar] [CrossRef]
Figure 1.
Flow diagram of the experiment.

Figure 2.
Experimental testing device.

Figure 3.
Temperature measurement point layout.

Figure 4.
The temperature curve on the horizontal surface. (a) y = 150 mm, (b) y = 0 mm.

Figure 5.
The temperature curve on the vertical line. (a) x = 75 mm, z = 75 mm, (b) x = 0 mm, z = 75 mm, (c) x = 150 mm, z = 0 mm.
Figure 5.
The temperature curve on the vertical line. (a) x = 75 mm, z = 75 mm, (b) x = 0 mm, z = 75 mm, (c) x = 150 mm, z = 0 mm.

Figure 6.
Average temperature change curves at a slurry concentration of 74%.

Figure 7.
Comparison of cooling capacity.

Figure 8.
The variation of uniaxial compressive strength with the ice–water ratio.

Figure 9.
Comparison of average temperature change curves at different slurry concentrations. (a) Ω = 0, (b) Ω = 1:1, (c) Ω = 6:5, (d) Ω = 7:5, (e) Ω = 8:5. Ω = ice-water ratio.
Figure 9.
Comparison of average temperature change curves at different slurry concentrations. (a) Ω = 0, (b) Ω = 1:1, (c) Ω = 6:5, (d) Ω = 7:5, (e) Ω = 8:5. Ω = ice-water ratio.


Table 1.
Material specification.
| Materials | Density/(kg/m³) | Specific Heat/(J/kg·°C) | Thermal Conductivity/(W/m·K) |
|---|---|---|---|
| Water | 1000 | 4200 | 0.5638 |
| Ice grains | 917 | 2100 | 2.2 |
| Tailings | 1566 | 1090 | 3.2 |
| Cement | 2800 | 840 | 0.6 |
Table 2.
The composition of slurry at different ice-water ratios at a slurry concentration of 74%.
| Ice-Water Ratio | Total Mass of Backfill Slurry/kg | Mass of Tailings/kg | Mass of Cement/kg | Mass of Ice and Water/kg | Mass of Ice Grains/kg | Mass of Water/kg | |
|---|---|---|---|---|---|---|---|
| specimen 1 | 8:5 | 6.220 | 3.945 | 0.658 | 1.617 | 0.995 | 0.622 |
| specimen 2 | 7:5 | 6.227 | 3.950 | 0.658 | 1.619 | 0.944 | 0.675 |
| specimen 3 | 6:5 | 6.235 | 3.955 | 0.659 | 1.621 | 0.884 | 0.737 |
| specimen 4 | 1:1 | 6.244 | 3.961 | 0.660 | 1.623 | 0.812 | 0.812 |
| specimen 5 | 0 | 6.351 | 4.028 | 0.671 | 1.651 | 0 | 1.651 |
Table 3.
The composition of slurry at different ice-water ratios at a slurry concentration of 76%.
| Ice-Water Ratio | Total Mass of Backfill Slurry/kg | Mass of Tailings/kg | Mass of Cement/kg | Mass of Ice and Water/kg | Mass of Ice Grains/kg | Mass of Water/kg | |
|---|---|---|---|---|---|---|---|
| specimen 6 | 8:5 | 6.305 | 4.107 | 0.685 | 1.513 | 0.931 | 0.582 |
| specimen 7 | 7:5 | 6.311 | 4.111 | 0.685 | 1.515 | 0.884 | 0.631 |
| specimen 8 | 6:5 | 6.319 | 4.116 | 0.686 | 1.516 | 0.827 | 0.689 |
| specimen 9 | 1:1 | 6.328 | 4.122 | 0.687 | 1.519 | 0.759 | 0.759 |
| specimen 10 | 0 | 6.428 | 4.188 | 0.698 | 1.543 | 0 | 1.543 |
Table 4.
Root mean square error calculation.
| Number | x1 | x2 | x3 | x4 | x5 | |
|---|---|---|---|---|---|---|
| Ambient Temperature/°C | 23.023 | 22.998 | 23.006 | 22.997 | 22.974 | 22.999 |
| The value of | 0.016 | |||||
© 2019 by the authors. Licensee MDPI, Basel, Switzerland. This article is an open access article distributed under the terms and conditions of the Creative Commons Attribution (CC BY) license (http://creativecommons.org/licenses/by/4.0/).
Share and Cite
MDPI and ACS Style
Zhang, X.; Jia, Y.; Wang, M.; Liu, L. Experimental Research on Heat Transfer and Strength Analysis of Backfill with Ice Grains in Deep Mines. Sustainability 2019, 11, 2486. https://0-doi-org.brum.beds.ac.uk/10.3390/su11092486
AMA Style
Zhang X, Jia Y, Wang M, Liu L. Experimental Research on Heat Transfer and Strength Analysis of Backfill with Ice Grains in Deep Mines. Sustainability. 2019; 11(9):2486. https://0-doi-org.brum.beds.ac.uk/10.3390/su11092486
Chicago/Turabian StyleZhang, Xiaoyan, Yuhang Jia, Mei Wang, and Lang Liu. 2019. "Experimental Research on Heat Transfer and Strength Analysis of Backfill with Ice Grains in Deep Mines" Sustainability 11, no. 9: 2486. https://0-doi-org.brum.beds.ac.uk/10.3390/su11092486
Note that from the first issue of 2016, this journal uses article numbers instead of page numbers. See further details here.