Electricity Consumption Changes across China’s Provinces Using A Spatial Shift-Share Decomposition Model


1
Institute of Geographic Sciences and Natural Resource Research, Chinese Academy of Sciences, Beijing 100101, China
2
Key Laboratory of Regional Sustainable Development Modeling, Chinese Academy of Sciences, Beijing 100101, China
3
College of Resources and Environment, University of Chinese Academy of Sciences, Beijing 100049, China
*
Author to whom correspondence should be addressed.
Sustainability 2019, 11(9), 2494; https://0-doi-org.brum.beds.ac.uk/10.3390/su11092494
Submission received: 27 March 2019
/
Revised: 16 April 2019
/
Accepted: 26 April 2019
/
Published: 28 April 2019
(This article belongs to the Section Energy Sustainability)
Abstract
:China’s growing electricity consumption has become an important factor to improving socio-economic development, as well as aggravating environmental degradation. Based on the provincial level data in China for the entire period and every five years during 2000–2015, this paper used a spatial shift-share analysis (SSS) to detect the driving factors of electricity consumption changes in China, mainly focusing on the spatial spillover effects of electricity consumption which have been ignored by previous literature. Results show that economic growth and industry structure change have increased China’s electricity consumption by 8919 and 746 billion kWh, respectively, while the electricity efficiency improvement has reduced China’s electricity consumption by 5337 billion kWh for the entire period. Among the total decrease in China’s electricity consumption caused by electricity efficiency improvement, about 20% is caused by spatial spillover effects, which cannot be ignored. Moreover, there are great differences in electricity consumption changes’ components across China’s provinces. The results provide a quantitative and better understanding of the determinants of China’s electricity consumption changes, and practical implications for differentiated electricity consumption regulation policies and regional energy cooperation strategies for China, as well as for other similar countries.
1. Introduction
Energy consumption control is one of the major measures to achieve sustainable socio- economic development in China, which is the largest energy consumer and electricity producer in the world [1,2,3,4,5,6,7]. As a typical kind of secondary energy, electricity ranks second in the share of China’s final energy consumption and closely relates to China’s economic growth [8,9,10,11]. Compared with other energy resources, such as raw coal and crude oil, electricity is relatively clean, with fewer pollutant emissions and high efficiency. Thus, China is striving to pursue electrification and enhance the share of electricity in final energy consumption. With the rapid development of China’s economy, electricity consumption is also growing rapidly from 1361 billion kWh (kilowatt-hour) in 2000 to 5689 billion kWh in 2015. However, more than 70% of China’s electricity generation is also mainly from coal. Therefore, faced with the pressure of environmental pollution, resources limitation and economic development requirements, it is crucial for Chinese energy policy-makers to analyze the changes and the corresponding driving factors of electricity consumption. This analysis can be obtained by using one of the decomposition techniques which divide electricity consumption change into its components.
The most popular techniques for decomposing indicator changes at the sector level are index decomposition analysis (IDA) and structural decomposition analysis (SDA). Both methods have been widely applied to detect the influence of economic growth, sectoral shifts, and technology changes on a variety of socio-economic and environmental indicators [12,13]. IDA uses only sector level data to decompose the changes in indicators while SDA uses the input–output model and data. However, the most popular technique for decomposing indicator changes across space is shift-share analysis (SSA), which can also examine the effects of industry shifts due to growth (or decline) and some sort of difference in industry shares [14]. The traditional form of SSA was proposed by Jones [15] and Creamer [16] and then developed by Dunn [17] and other scholars in alternative versions [18]. Though the main purpose of SSA is to quantify the geographical changes in regional socio-economic and environmental indicators, the traditional analysis assumes that the changes in a given period of the study area have nothing to do with the changes in other regions. Therefore, Nazara and Hewings [19] considered the spatial interaction among regions in SSA. They firstly introduced a spatial shift-share analysis (SSS). However, they did not give the methods to construct the spatial weights matrix. Following Nazara and Hewings’ idea, Zaccomer [20] developed SSS into a complete model. Subsequently, Espa et al. [21] suggested a spatial shift-share decomposition of regional business changes at the plant level in Italy. Grossi and Mussini [22] recently applied SSS to explore the changes in regional electricity consumption across Italy over the period 2000–2013. This approach may help us to understand the geography of electricity consumption change with respect to both the spatial and sectoral influence. It may reduce the risk of misleading results [14,22].
Up to now, a number of studies have focused on the changes and the corresponding driving factors of electricity consumption in China. He et al. [23] used the DMSP/OLS (Defense Meteorological Satellite Program/Operational Line-scan System) stable nighttime light time series data to explain the spatiotemporal dynamic changes of electricity consumption in China during 1995–2008. Pan and Li [24] constructed a power consumption estimation model based on DMSP/OLS night-light data, MODIS/NDVI (moderate-resolution imaging spectroradiometer/ normalized difference vegetation index) products, basic geographic information data and socioeconomic statistics to quantitatively estimate the spatiotemporal change in electricity consumption in China during 2000–2012. Lin [25] used electricity demand function to obtain the conclusion that the changes of GDP (gross domestic product), energy price and industrial structure are the important determinants of China’s electricity demand during 1996–2001. Many scholars have focused on the influence of economic growth on electricity consumption in China [8,26,27,28]. Wang et al. [29] employed the principal component analysis to eliminate the multicollinearity among the affecting factors which does not meet the criteria of the ordinary least square (OLS) regression model, and then investigated the influence of GDP (gross domestic product), population, the product of primary industry, second industry, and tertiary industry on electricity consumption in China. Fang et al. [30] used a multi-period ST-LMDI (spatial-temporal logarithmic mean divisia index) model which is an IDA method to decompose the changes in China’s electricity consumption during 1995–2016 and analyzed the influence mechanism. Zhang et al. [31] used an LMDI (logarithmic mean divisia index) model which is an IDA method to explore the factors influencing the electricity consumption in China at both national and sectoral levels during 1990–2016. Such studies have provided useful help to understand the changes in China’s electricity consumption. However, the existing literature does not clarify the regional differences in China’s electricity consumption changes and the impact of the spatial interaction between neighboring regions on the electricity consumption changes. This paper aims to fill the above gaps.
To the best of our knowledge, this is the first paper applying a spatial shift-share analysis (SSS) to decompose China’s electricity consumption changes, in order to distinguish between two different spatial effects such as regional competitive effect and neighborhood influence. From this way, we can reasonably assume that China’s electricity consumption change in one region is influenced by that of its neighbors due to the existence of different types of spatial spillovers. We explain this kind of phenomenon and mechanism qualitatively and quantitatively in this paper. It is very important for regional energy cooperation for China, as well as for other similar countries. Furthermore, this paper aims to provide integrated analysis and a quantitative and better understanding of the determinants of China’s electricity consumption changes during 2000–2015. It is beneficial to propose some practical implications for achieving China’s energy conservation, energy efficiency improvement, and sustainable development.
2. Materials and Methods
2.1. Methodology
The traditional shift-share decomposition analysis (SSA) can decompose the electricity consumption of a region into three components [17,32]. The first one is the constant share component (CS). It indicates the electricity consumption that would be observed in the terminal period if the electricity intensity was not changed during the study period. The second one is the industry-mix component (IM). It measures the effect of changes in the industry structure during the study period. The last one is the efficiency change component (EC). It measures the effect of changes in the electricity intensities of various sectors during the study period. The equation is as follows [21,22]:
where Er,t+1 and Or,t+1 are the electricity consumption and the output of economic activity in region r in the terminal period t + 1, respectively. Oi,r,t+1 is the output of the ith industrial sector in region r in the terminal period t + 1. er,t is the electricity intensity in region r in the initial period t. ei,r,t and ei,r,t+1 are the electricity intensities of the ith industrial sector in region r in the initial period t and the terminal period t + 1, respectively. m is the number of the industrial sectors of economic activity. The first, second and third term on the right side of Equation (1) are CSr,t→t+1, IMr,t→t+1 and ECr,t→t+1, respectively. That is to say, CSr,t→t+1 = er,tOr,t+1, IMr,t→t+1 = Σ[(ei,r,t − er,t)Oi,r,t+1] and ECr,t→t+1 = Σ[(ei,r,t+1 − ei,r,t)Oi,r,t+1].
As every region may be affected by the positive or negative impact of neighboring regions [33], the traditional shift-share decomposition analysis (SSA) can be extended to a spatial shift-share decomposition model (SSS), which considers the electricity efficiency of neighboring regions [19,21,22]. The calculation procedures are as follows:
First, the Moran’s index is used to test the existence of spatial autocorrelation for the major indicators, such as electricity consumption Er, electricity intensity er, changes of electricity intensity cr = er,t+1 − er,t, the industry-mix component IMr, and the efficiency change component ECr. If there is significant spatial autocorrelation among different regions, it indicates that changes in electricity consumption and electricity intensity may be affected by that of the neighboring areas and it is necessary to use SSS instead of SSA to improve the accuracy. The Moran’s index is obtained as follows [21,34,35]:
where I is the Global Moran’s index of the whole country. xr is the variable observed in region r, which can be Er, er, cr, IMr or ECr. is the average value of the variable. k is the number of regions. wrs is the spatial weight measuring the link between region r and region s. It is the rs-th element of row-standardized binary weight matrix W. W is constructed by first assigning to each generic element wrs value one if regions r and s are neighbors, and 0 otherwise. Then, dividing by the sum of the elements of the corresponding row, so that the weights add up to one for each region [21]. I varies from −1 to 1. If it is close to zero, it indicates that the research variable is randomly distributed. Otherwise, it indicates a positive or negative spatial autocorrelation. In general, we also need to calculate some test statistics such as the variance and then the p-value to judge more accurately whether there is a significant spatial autocorrelation among different regions. If the p-value is lower than 0.1, 0.05 or 0.01, it indicates a spatial autocorrelation of a significance at 10%, 5%, and 1% level, respectively. In our study, we calculated Moran’s index across Chinese 30 provinces every year by GeoDa 1.12, which is a spatial data analysis software tool and can be freely obtained on the website http://geodacenter.github.io/. We used 999 permutations to test the Moran’s index, and then the software can export the variance and the p-value automatically.
Second, some additional notations were introduced to detect neighborhood effects. Let ěi,r present the electricity intensity in sector i in neighboring regions. It is calculated by the following formula [21,22]:
where Ei,s and Oi,s are the electricity consumption and the output of economic activity in sector i in region s, respectively. wrs is the spatial weight which is the same as that in Equation (2). Subsequently, the following three notations were defined: ci,r = ei,r,t+1 − ei,r,t is the electricity intensity change in sector i in region r; ci,n = ei,n,t+1 − ei,n,t is the electricity intensity change in sector i at the national level; či,r = ěi,r,t+1 − ěi,r,t is the electricity intensity change in sector i in the neighboring regions.
Finally, the decomposition in Equation (1) was reformulated as follows [21,22]:
where ΔEr = Er,t+1 − Er,t is the change in electricity consumption in region r. It can be decomposed into five components. The first term on the right side of Equation (4) is the output change component (OC) in region r from the initial period t to the terminal period t + 1, i.e., OCr,t→t+1 = er,t(Or,t+1 − Or,t). It indicates the change in electricity consumption that would be observed if the electricity intensity was not changed from t to t + 1. The second term is the industry-mix component (IM) in region r from t to t + 1, which is the same as that in Equation (1). The third term is the national efficiency change component (NEC) in region r from t to t + 1, i.e., NECr,t→t+1 = Σ(ci,nOi,r,t+1). It measures the change in regional electricity consumption by assuming that the change in electricity intensity in each sector is the same as the electricity intensity change in that sector at the national level. The fourth term is the neighboring-nation efficiency change component (NNEC) in region r from t to t + 1, i.e., NNECr,t→t+1 = Σ[(či,r-ci,n)Oi,r,t+1)]. A positive (negative) value of NNEC indicates a neighborhood disadvantage (advantage) in electricity efficiency, causing an increase (a decrease) in regional electricity consumption from t to t + 1. The fifth term is the region-neighbor efficiency change component (RNEC) in region r from t to t + 1, i.e., RNECr,t→t+1 = Σ[(ci,r-či,r)Oi,r,t+1)]. A positive (negative) value of RNEC indicates a disadvantage (an advantage) in electricity efficiency for region r compared to neighboring regions, causing an increase (a decrease) in regional electricity consumption from t to t + 1. The last three items add up to the efficiency change component (EC) in region r from t to t + 1, i.e., ECr,t→t+1 = NECr,t→t+1 + NNECr,t→t+1 + RNECr,t→t+1.
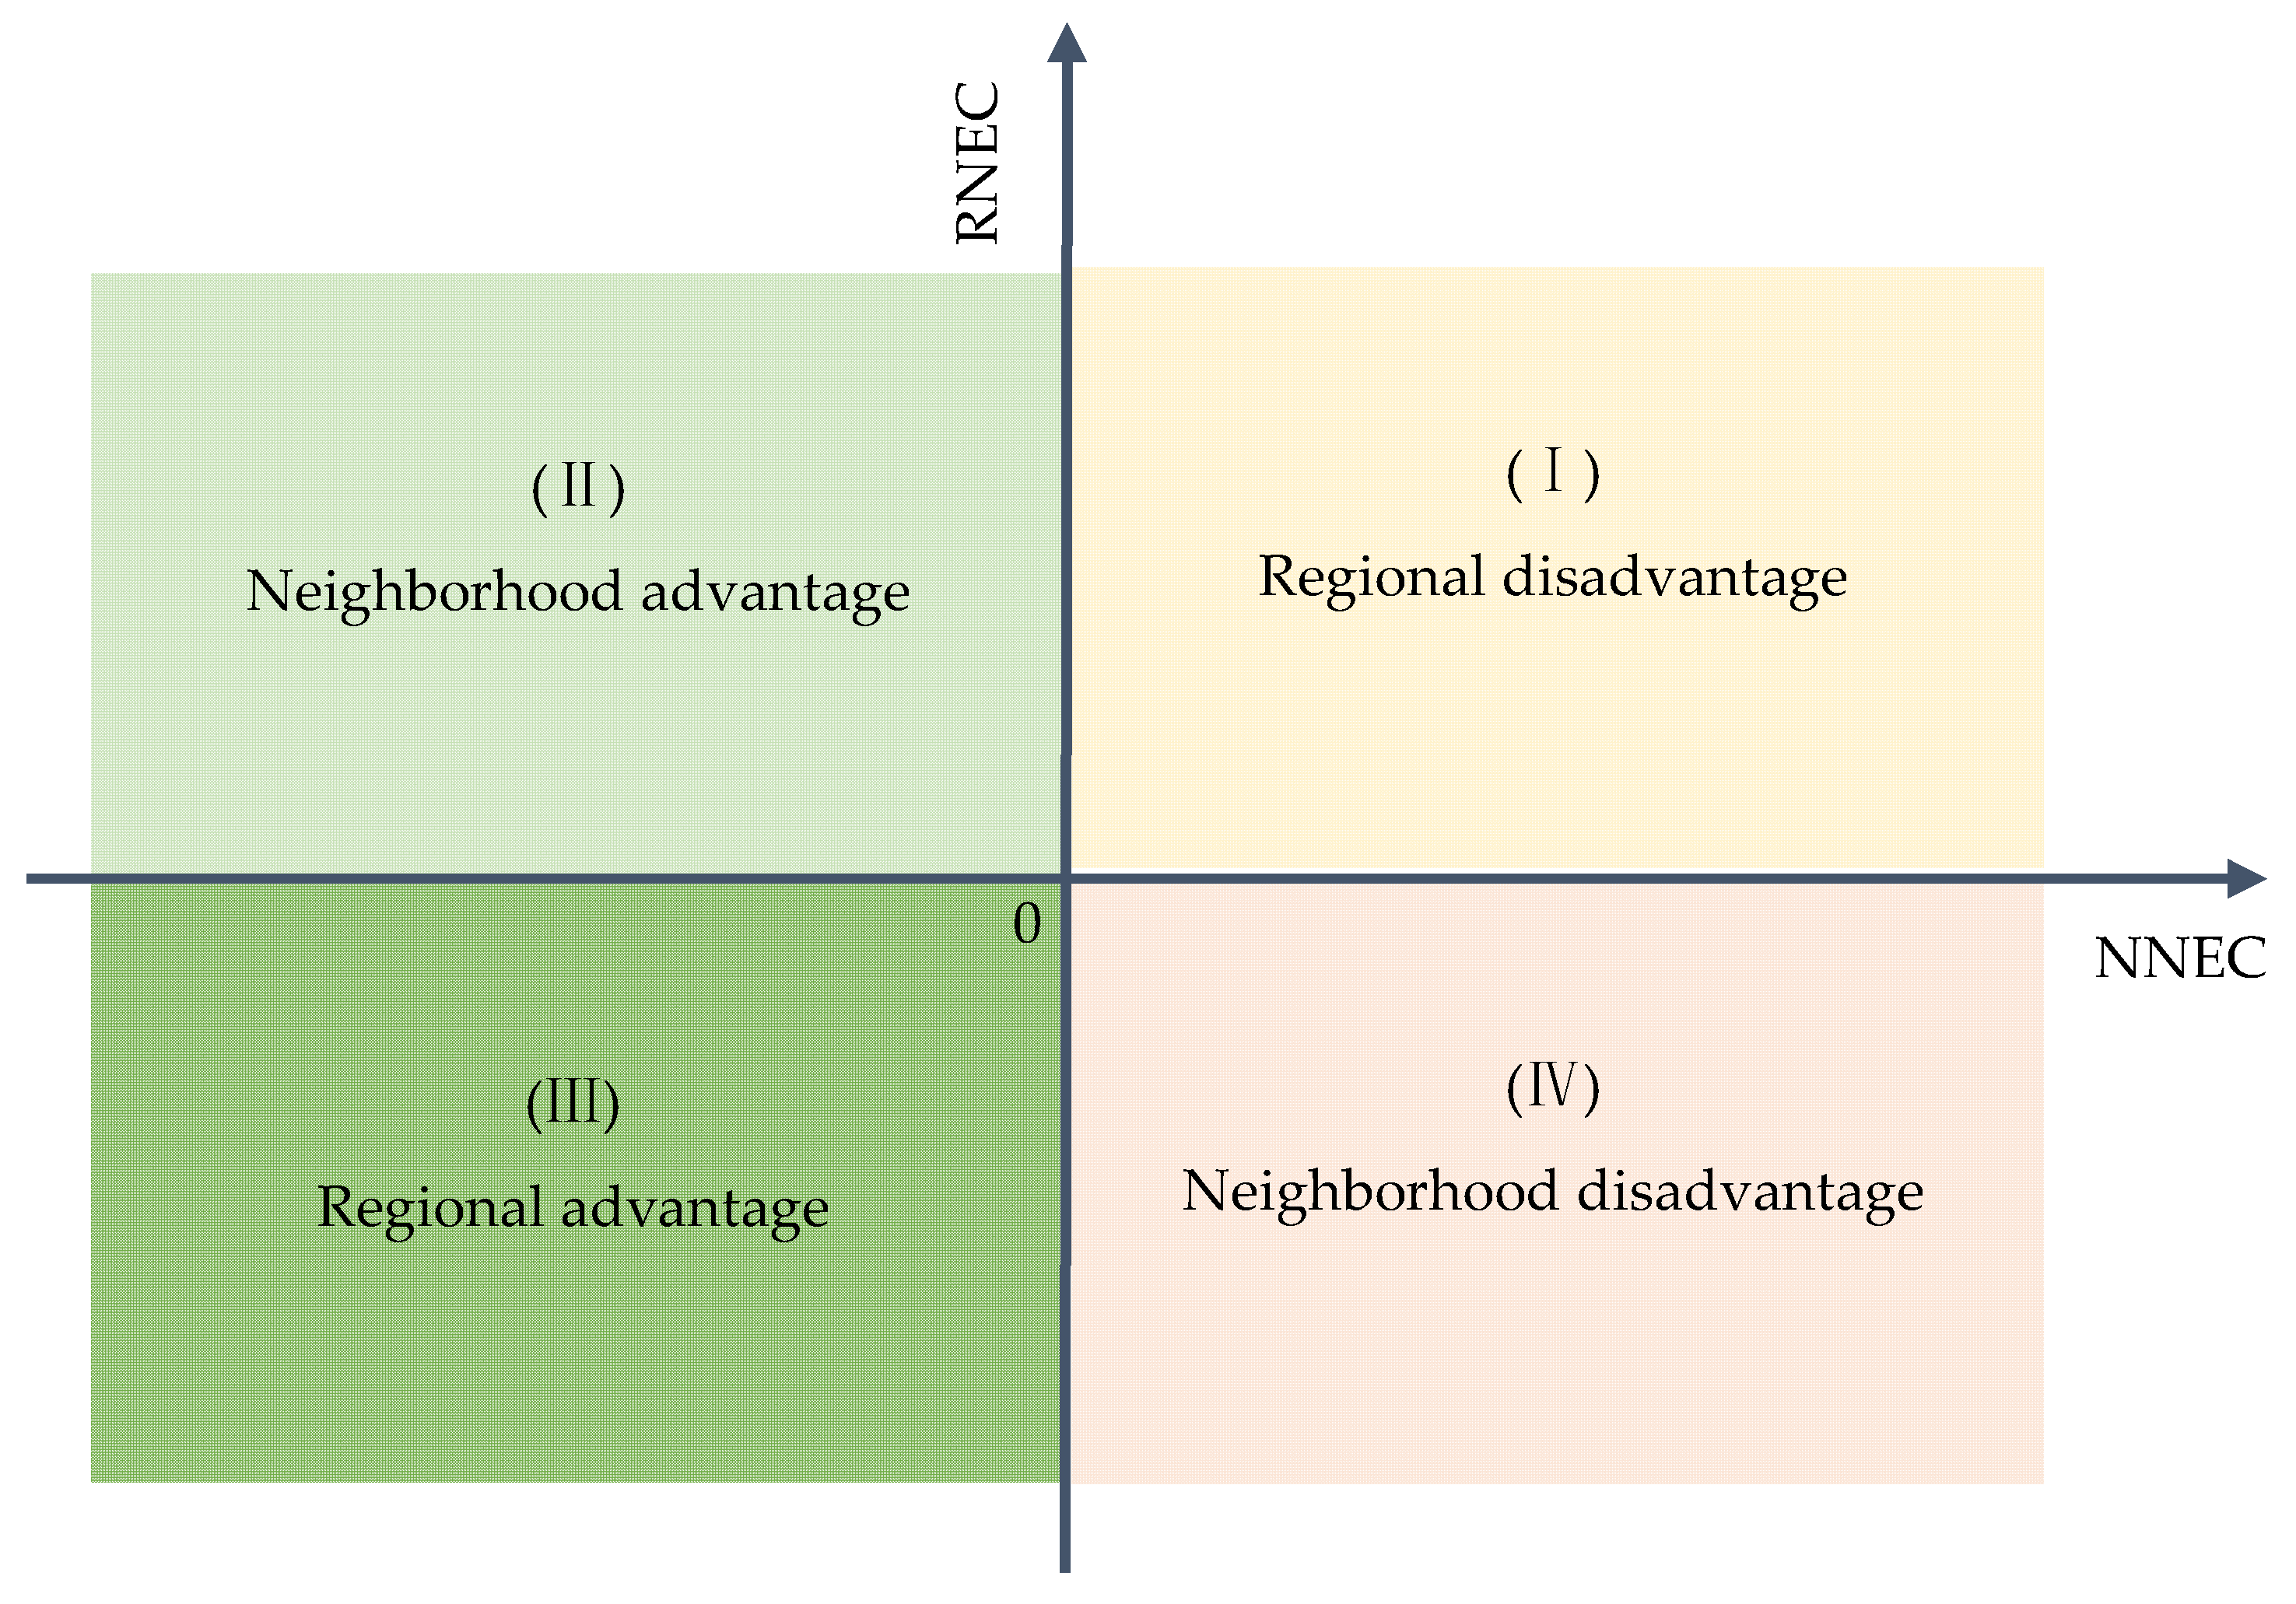
According to the positive and negative values of NNEC and RNEC, the combined effect of electricity efficiency change can be divided into four different situations (Figure 1). (I) shows both positive NNEC and RNEC. It indicates a regional disadvantage for region r as the electricity efficiency improvement of region r is lower than that of its neighboring regions, and that of the neighboring regions is lower than the nation. (II) shows negative NNEC and positive RNEC. It indicates a neighborhood advantage for region r as the electricity efficiency improvement of region r is lower than that of its neighboring regions, but that of the neighboring regions is better than the nation. (III) shows both negative NNEC and RNEC. It indicates a regional advantage for region r as the electricity efficiency improvement of region r is higher than that of its neighboring regions, and that of the neighboring regions is higher than the nation. (IV) shows positive NNEC and negative RNEC. It indicates a neighborhood disadvantage for region r as the electricity efficiency improvement of region r is higher than that of its neighboring regions but that of the neighboring regions is lower than the nation.
2.2. Data Sources
Due to the lack of data, this paper selected the annual data of 30 provincial regions in China (excluding Tibet, Hong Kong, Macao, and Taiwan) during 2000–2015 as the research sample. The basic variables include the electricity consumption (which is named E in the equations and has a unit of billion kWh) and the output of economic activity (which is named O in the equations and has a unit of billion yuan). The output of economic activity is indicated by gross domestic product (GDP) or the added values of different industrial sectors. The data for the electricity consumption of each province in China were originally obtained from China Energy Statistical Yearbook [36] in various years. The data for the gross domestic product (GDP) of each province in China were originally obtained from China Statistical Yearbook [37] in various years. The data for the electricity consumption and added values by industrial sectors of each province in China were originally obtained from the statistical yearbooks of various provinces in various years. However, other variables were calculated based on the two kinds of basic variables. For instance, the electricity intensity (which is named e in the equations) is E/O, and its unit is kWh/yuan.
For the sake of briefness, the industrial sectors in all provincial regions are divided into the following broad categories: agriculture, forestry, animal husbandry and fishery, industry, construction, wholesale and retail trades, hotels and catering services, transport, storage, and post, others. Besides, 30 provincial regions in China are usually divided into four economic regions: the eastern area includes Beijing, Tianjin, Hebei, Shandong, Jiangsu, Zhejiang, Shanghai, Fujian, Guangdong and Hainan, the central area includes Shanxi, Henan, Hubei, Hunan, Anhui and Jiangxi, the western area includes Chongqing, Sichuan, Guangxi, Guizhou, Yunnan, Shaanxi, Gansu, Inner Mongolia, Qinghai, Ningxia and Xinjiang, the northeast area includes Heilongjiang, Jilin and Liaoning.
3. Results
3.1. The Results of Moran’s Test
We calculated the Global Moran’s indexes of the indicators including Er, er, cr, IMr and ECr in various periods, as well as the variances and the p-values. Results show that most p-values for Er and IMr are larger than 10%, indicating no spatial dependence for these two indicators. However, all the p-values for er are lower than 5% (Table 1). It indicates that the hypothesis of no spatial dependence of er is rejected, and spatial autocorrelation of China’s electricity intensity is expected in this case. In Table 1, we can also see that the p-value of cr in 2010–2015 is 0.155, which is larger than 10%. The p-value of ECr in 2010–2015 is 0.069, which is larger than 5%. However, the p-values for cr in other periods are all lower than 10%, and the p-values for ECr in other periods are all lower than 5%. It indicates that, though the spatial autocorrelations of cr and ECr have decreased during 2010–2015, spatial autocorrelation of cr and ECr is still expected during the entire period. That is to say, China’s electricity intensity and its changes have significant spatial spillover effects on the whole, or China’s electricity intensity change in one region is influenced by that of its neighbors. Therefore, it is necessary to use a spatial shift-share analysis (SSS) because spatial spillover effects of electricity intensity may impact the changes in electricity consumption.
3.2. The Spatiotemporal Variation of the OC Component
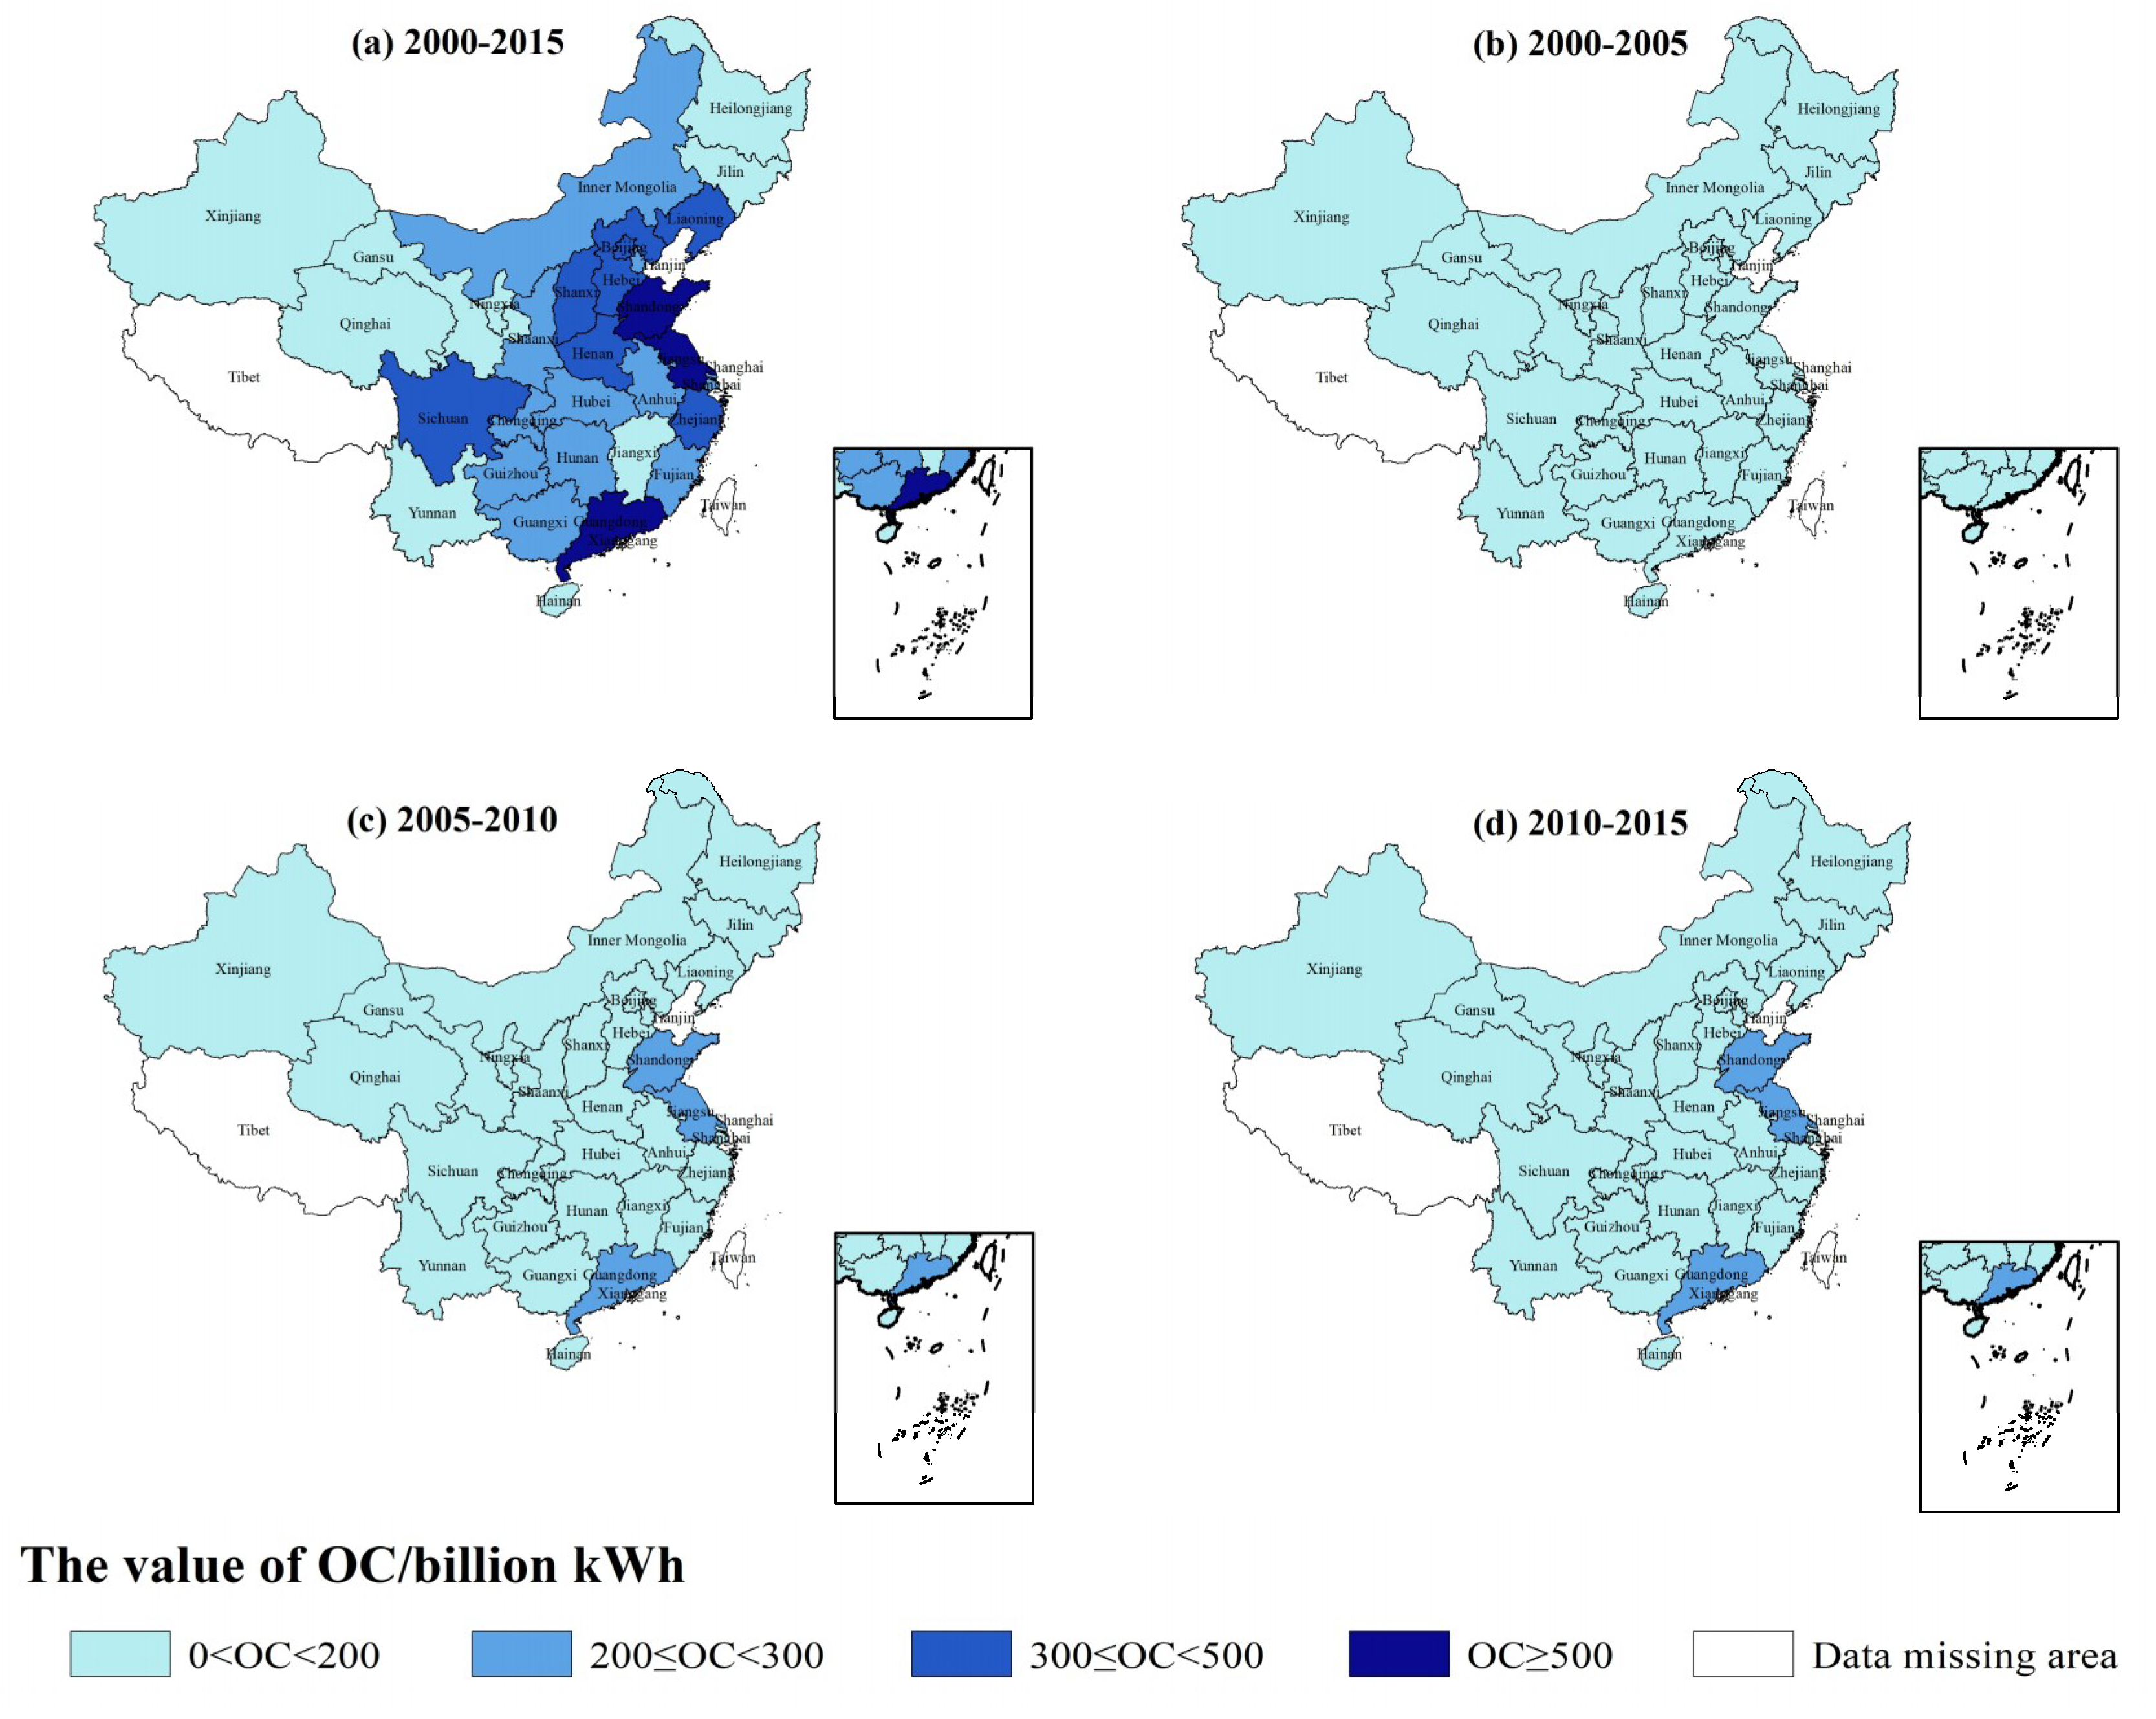
Based on the values of OCr,t→t+1 calculated by Equation (4), we can figure out the spatiotemporal variation of the output change component (OC) in electricity consumption across China’s provinces for the entire period and every five years during 2000–2015. As shown in Figure 2, the values of OC in electricity consumption for Chinese 30 provinces are all positive in various periods. It indicates that the increase in GDP in every province has a significant positive effect on the increase in electricity consumption. Specifically, the value of OC during 2000–2015 in Chinese 30 provinces adds up to 8919 billion kWh, which is twice as China’s electricity consumption growth (4329 billion kWh) during the entire period. Thus, economic growth is a major driving force for China’s electricity consumption growth.
Next in order of importance is the value of OC in electricity consumption for the entire period, which shows great differences across China’s provinces (Figure 2a). It is the largest in Guangdong province (872 billion kWh) and the smallest in Hainan province (24 billion kWh). On the whole, it is relatively large in provinces which have large economic aggregate and rapid economic growth, as well as a large population. It is larger than 500 billion kWh in some provinces such as Guangdong, Jiangsu, and Shandong in the eastern coastal areas of China. However, due to small economic aggregate and population, it is smaller than 200 billion kWh in some provinces such as Qinghai, Xinjiang, Ningxia and Gansu in Northwest China, provinces such as Yunnan and Hainan in the West and South China, provinces such as Heilongjiang and Jilin in Northeast China, and provinces such as Jiangxi in East China.
Finally, the values of OC in electricity consumption for every five years show relatively small differences across China’s provinces (Figure 2b–d). Most of them are smaller than 200 billion kWh. Only the values of OC in provinces such as Guangdong, Jiangsu, and Shandong during 2005–2010 and 2010–2015 are larger than 200 billion kWh but smaller than 300 billion kWh. The values of OC in Hainan province are 3, 11 and 13 billion kWh during 2000–2005, 2005–2010 and 2010–2015, respectively. They are always the smallest among China’s provinces. The values of OC in Guangdong province are 175 and 283 billion kWh during 2000–2005 and 2005–2010, respectively. They are the largest among China’s provinces during the corresponding period. However, during 2010–2015, the value of OC in Jiangsu province (268 billion kWh) exceeds that of Guangdong province (236 billion kWh) and becomes the largest.
3.3. The Spatiotemporal Variation of the IM Component
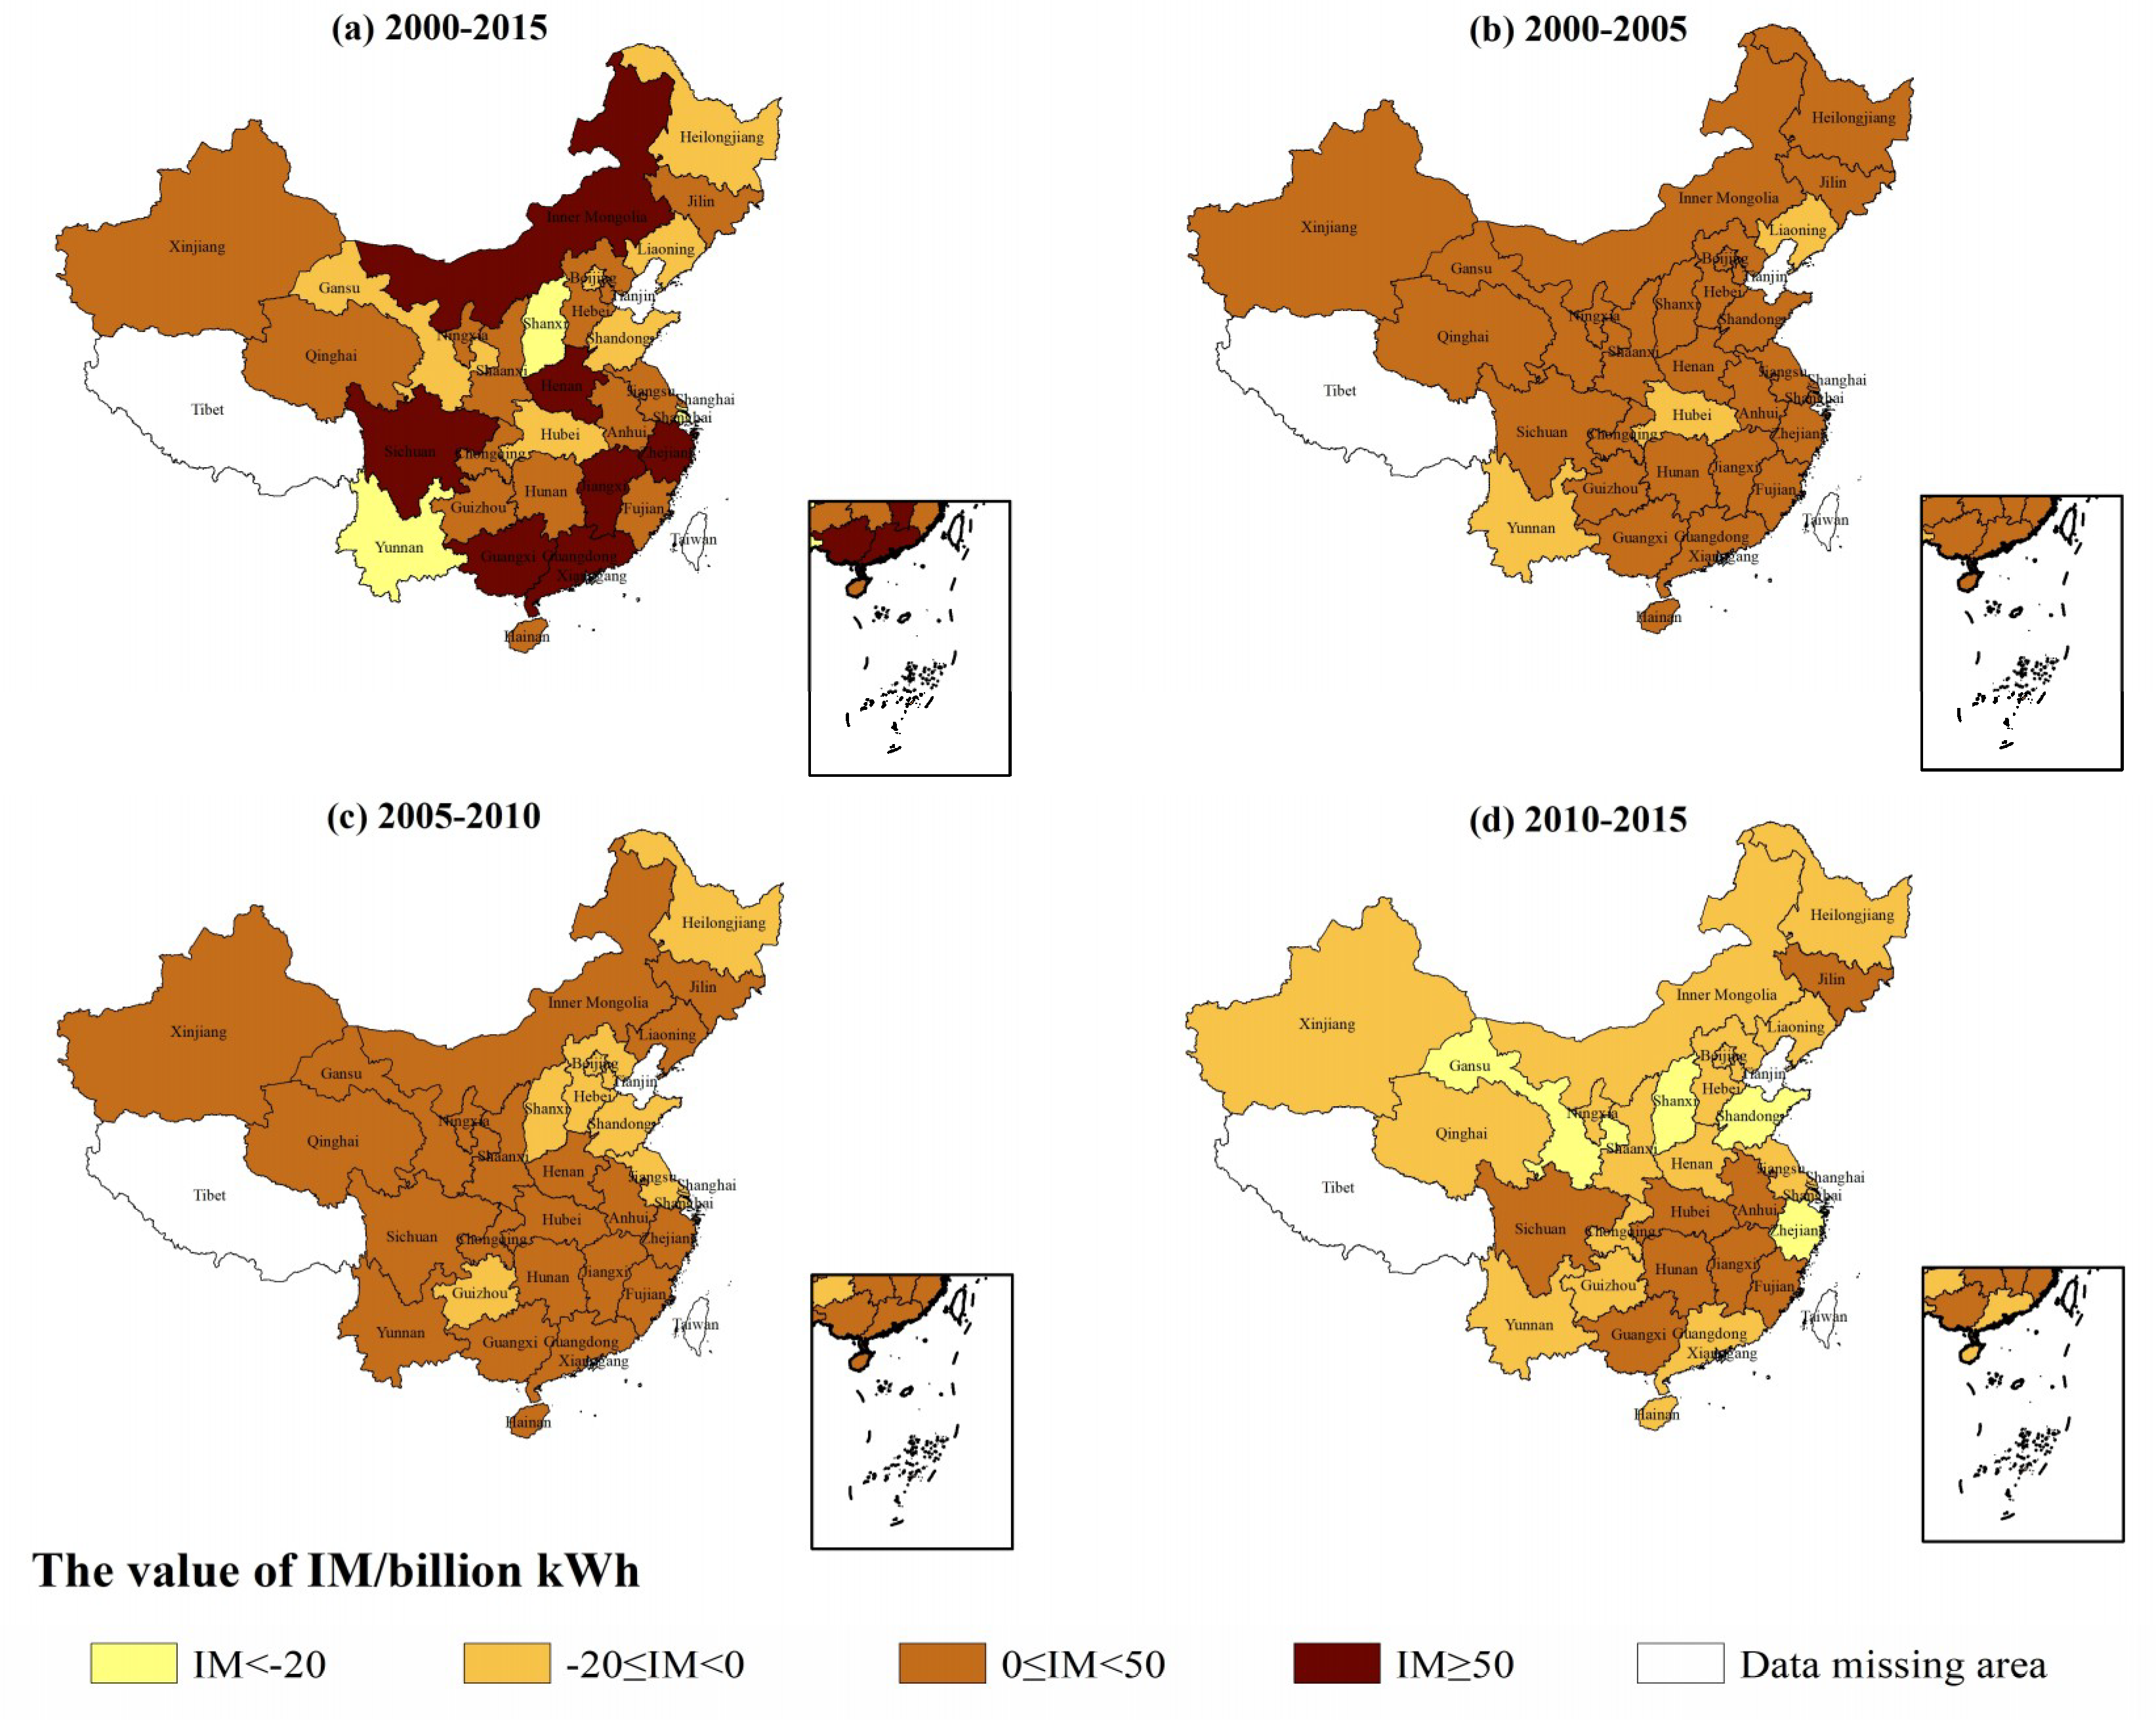
Based on the values of IMr,t→t+1 calculated by Equation (4), we can figure out the spatiotemporal variation of the industry-mix component (IM) in electricity consumption across China’s provinces for the entire period and every five years during 2000–2015. As shown in Figure 3, the values of IM in electricity consumption for Chinese 30 provinces are positive or negative in various periods. Moreover, most of them are larger than −20 billion kWh but smaller than 50 billion kWh. The absolute values of them are much smaller than that of OC. It indicates that industry structure adjustment has relatively little effect on China’s electricity consumption change. Specifically, the value of IM during 2000–2015 in Chinese 30 provinces adds up to 746 billion kWh, which is only 8.37% of OC and 17.24% of China’s electricity consumption growth during the entire period. Thus, industry structure change has a positive effect on China’s electricity consumption growth on the whole. It really accords with the fact. During the study period, especially before 2010, most Chinese provinces are in the stage of rapid industrialization and electrification. Some developed provinces in the eastern coastal areas of China carry out the strategy of heavy industrialization. Therefore, the proportion of the added value of the high-power-consumption industries to GDP remains high in China. Though most provinces attempt to optimize the industrial structure to save resources and energy, industry structure adjustment still leads to an increase in electricity consumption.
Next in order of importance is the value of IM in electricity consumption for the entire period, which also shows great differences across China’s provinces (Figure 3a). It is the largest in Guangdong province (150 billion kWh) and the smallest in Shanxi province (−41 billion kWh). On the whole, there are complex situations for the geographical distribution of IM during the entire period. The first category includes Beijing and Shanghai. They have stepped into the late industrialization. High-power-consumption industries have been upgraded or transferred outside, and the service industry has become the main body. Therefore, the values of IM are negative. The second category includes Yunnan and Gansu. They are in the middle stage of industrialization. However, the development orientation for eco-environmental protection has restricted the development of High-power-consumption industries. The tertiary industries such as tourism and other service sectors grow faster. Therefore, industry structure change has a negative effect on their electricity consumption growth. The third category includes Shanxi, Liaoning, Heilongjiang, Shandong, and Hubei. They are all important heavy industrial bases after the founding of the People’s Republic of China. Since 2000, the transformation and upgrading of traditional industries have made them consume fewer resources and energy. Therefore, the values of IM are also negative. The fourth category includes Tianjin, Guangdong, Zhejiang, and Jiangsu. Though they have stepped into the transitional stage from mid-industrialization to late industrialization, they are key developed regions to carry out the strategy of heavy industrialization in China. Reindustrialization has made them consume more resources and energy. Therefore, industry structure change has a positive effect on their electricity consumption growth. The fifth category includes other provinces. They are all in the middle stage of industrialization. Under this kind of the main trend, the values of IM are all positive during the entire period though they attempt to implement the industrial transformation.
Finally, the values of IM in electricity consumption for every five years show relatively small differences across China’s provinces (Figure 3b–d). However, since 2010, as the Chinese government has paid more and more attention to the Green Development Strategy, most Chinese provinces have emphasized the industrial transformation and upgrading. Thus, their values of IM shift from positive to negative (Figure 3b–d). During 2000–2005 and 2005–2010, most of them are positive and smaller than 50 billion kWh. However, during 2010–2015, only eight provinces remain positive, and all the values of IM decrease below 10 billion kWh. For those provinces with negative IM values, there is also a decreasing trend. For instance, the value of IM in Guangdong province is −12 billion kWh during 2010–2015. However, it is 35 billion kWh during 2000–2005 (the largest among China’s provinces in this period) and 7 billion kWh during 2005–2010. The value of IM in Shandong province decreases from 21 billion kWh during 2000–2005 to −14 and −32 billion kWh during 2005–2010 and 2010–2015, respectively. It is the smallest among China’s provinces in this period.
3.4. The Spatiotemporal Variation of the EC Component
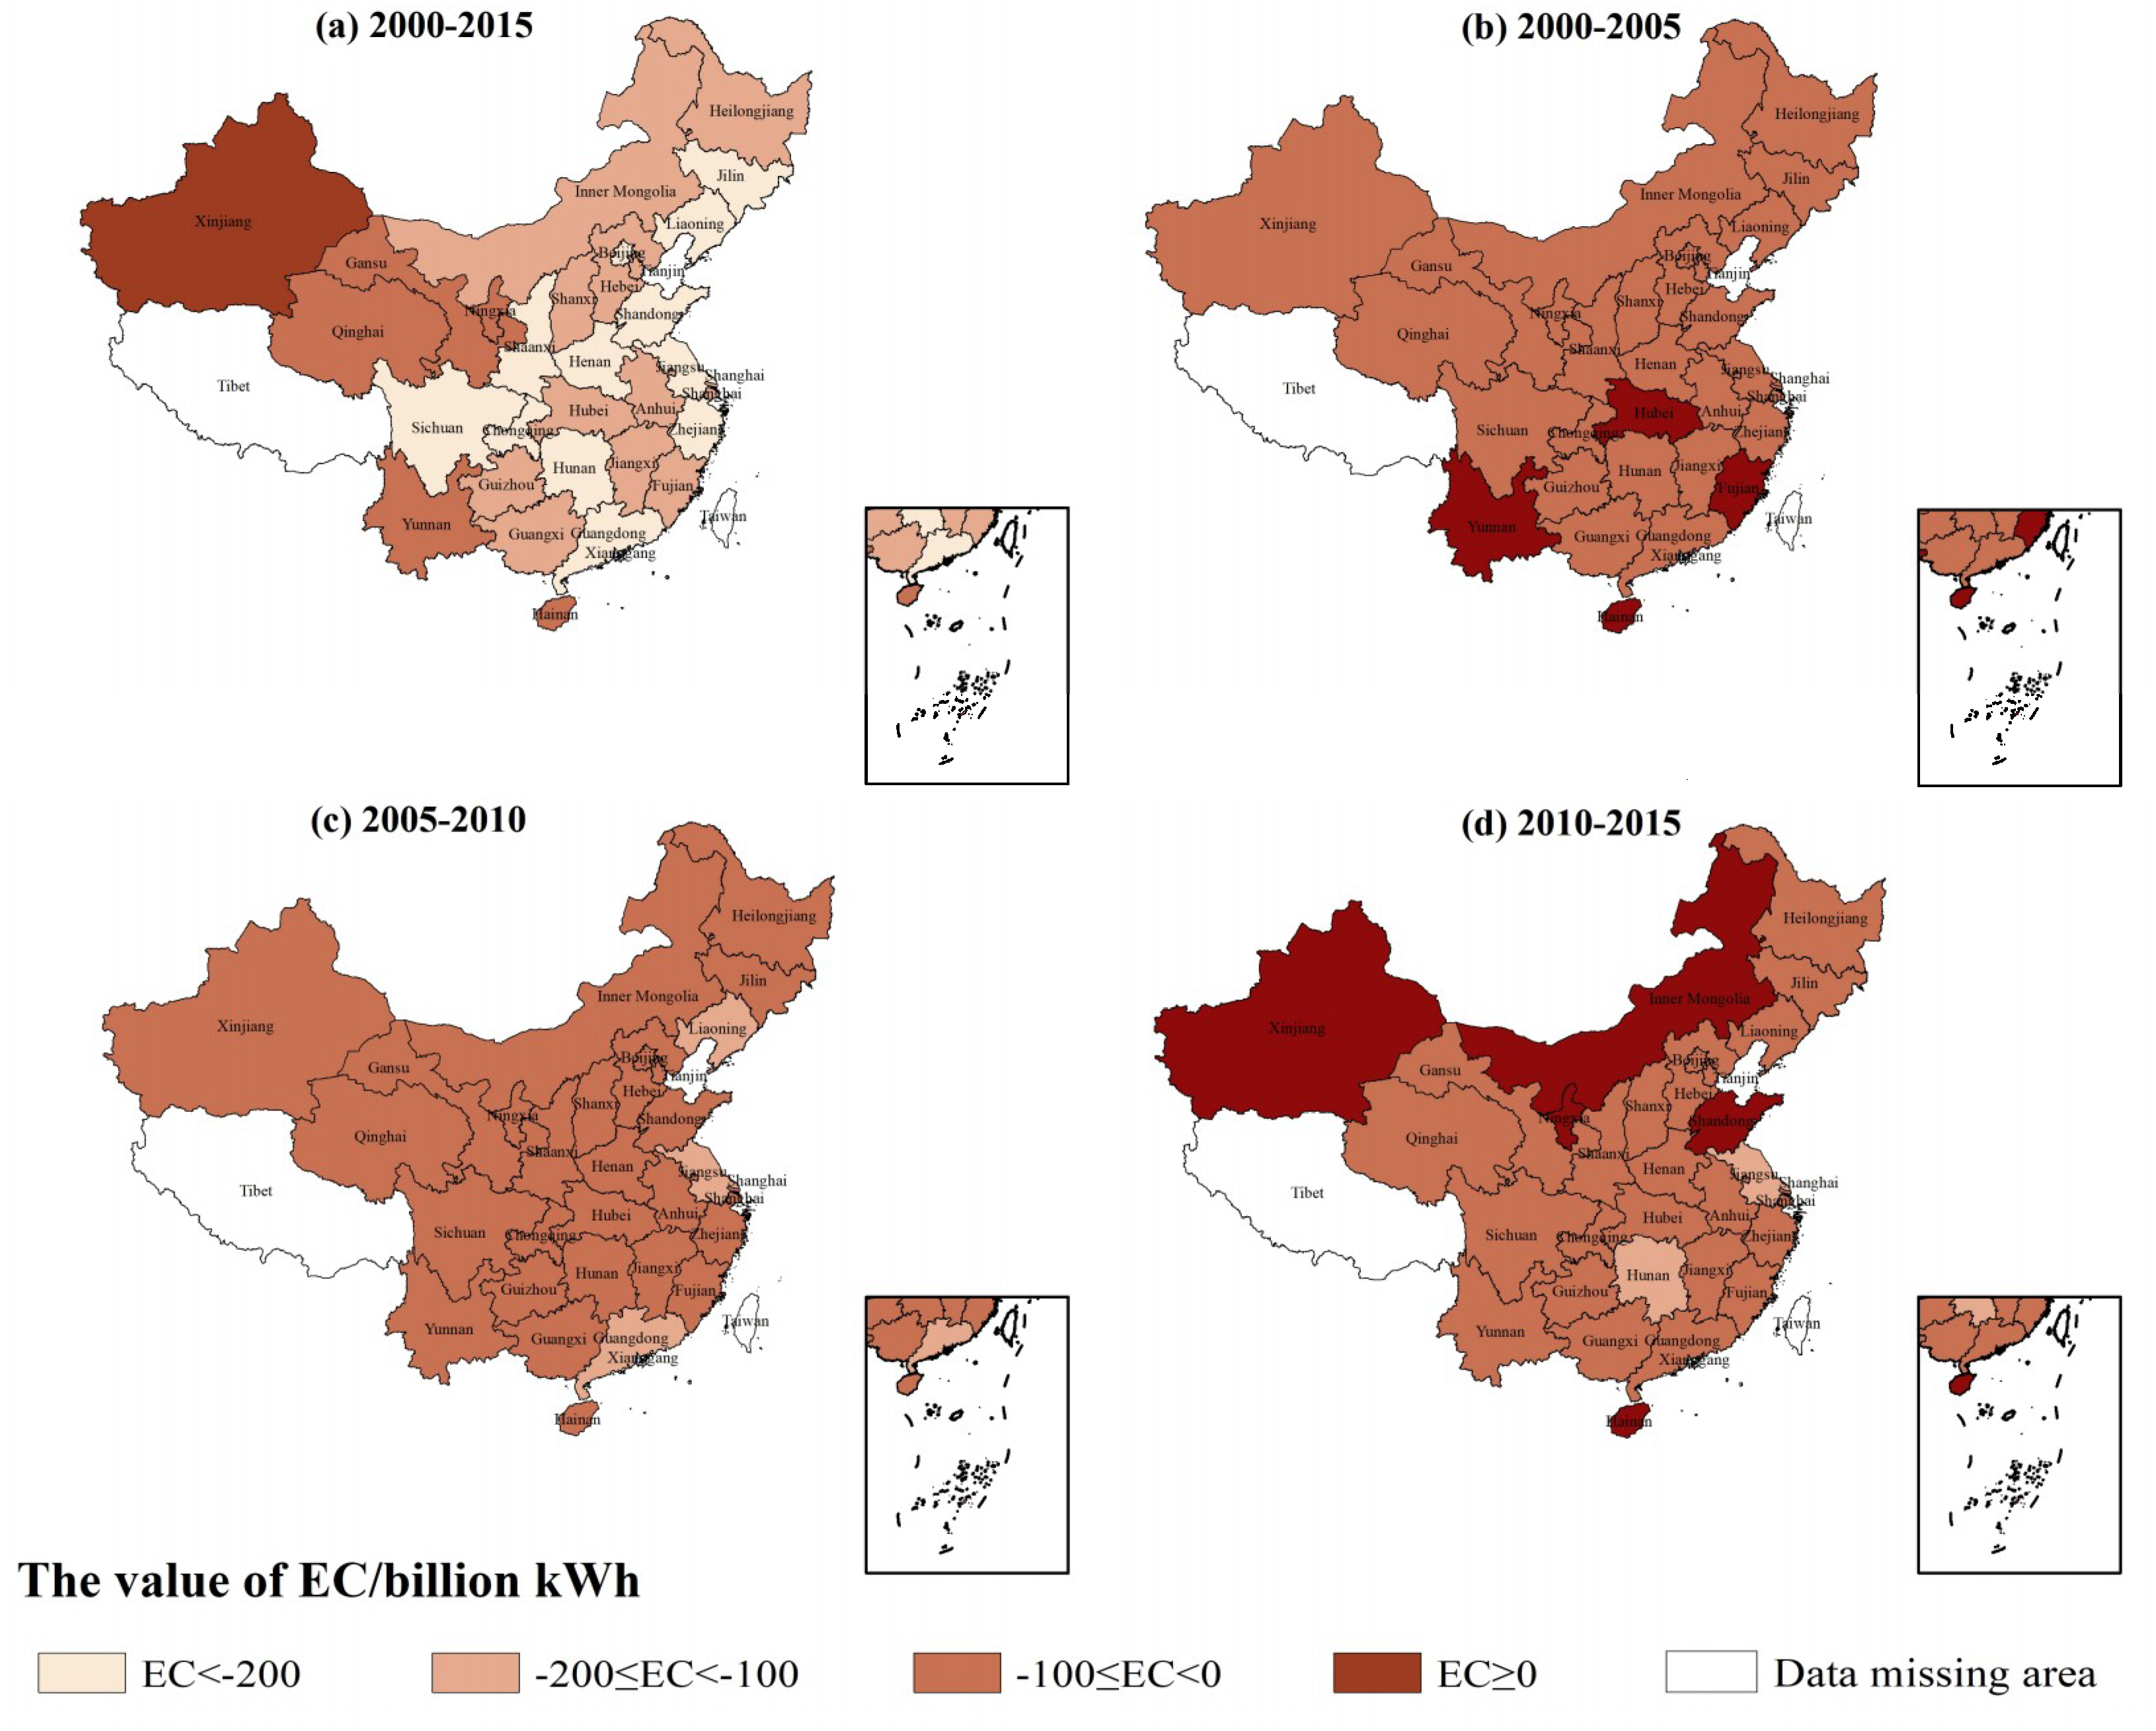
Based on the values of ECr,t→t+1 calculated by Equation (4), we can figure out the spatiotemporal variation of the efficiency change component (EC) in electricity consumption across China’s provinces for the entire period and every five years during 2000–2015. As shown in Figure 4, the values of EC in electricity consumption for 30 Chinese provinces are almost always negative in various periods. It indicates that efficiency changes in most provinces have significant negative effects on electricity consumption growth. Specifically, the value of EC in Chinese 30 provinces during 2000–2015 adds up to −5337 billion kWh. It means that the decrease in electricity intensity or improvement of electricity efficiency has reduced China’s electricity consumption by 5337 billion kWh. Compared with the values of OC and IM in this period, electricity efficiency improvement is a major driving force for China’s electricity consumption decrease.
Next in order of importance is the value of EC in electricity consumption for the entire period, which also shows great differences across China’s provinces (Figure 4a). It is positive only in Xinjiang autonomous region, which means that electricity intensities across China’s provinces all decrease except for Xinjiang. On the whole, there are obvious differences between the eastern, central and western area of China. As the economic development level and the scientific and technological level are relatively high in most provinces in the eastern coastal areas of China, their electricity efficiencies increase fast. Thus, the values of EC are lower than −200 billion kWh. However, the values of EC in most provinces in the central region of China are larger than −200 billion kWh but smaller than −100 billion kWh. While in some provinces in the western region of China, such as Xinjiang, Yunnan, Qinghai, Ningxia and Gansu, the values of EC are larger than −100 billion kWh.
Finally, the values of EC in electricity consumption for every five years show relatively small differences across China’s provinces (Figure 4b–d). Most of them are below zero but larger than −100 billion kWh. During 2000–2005, the values of EC only in four provinces such as Hubei, Yunnan, Fujian, and Hainan are not within the scope. However, they are all above zero but smaller than 9 billion kWh. During 2005–2010, the values of EC only in three provinces such as Guangdong, Jiangsu and Liaoning are not within the scope. However, they are all a little smaller than −100 billion kWh. During 2010–2015, the values of EC only in two provinces such as Jiangsu and Hunan are a little smaller than −100 billion kWh, and those of five provinces such as Xinjiang (114 billion kWh), Inner Mongolia (36 billion kWh), Shandong (14 billion kWh), Ningxia (2 billion kWh) and Hainan (1 billion kWh) are above zero. Among them, due to abundant resource endowment and national policy support, Xinjiang and Inner Mongolia have vigorously developed energy and heavy chemical industries in recent years. Therefore, their electricity efficiencies have not been enhanced but decreased the fastest.
3.5. The NNEC and RNEC Components across China’s Provinces
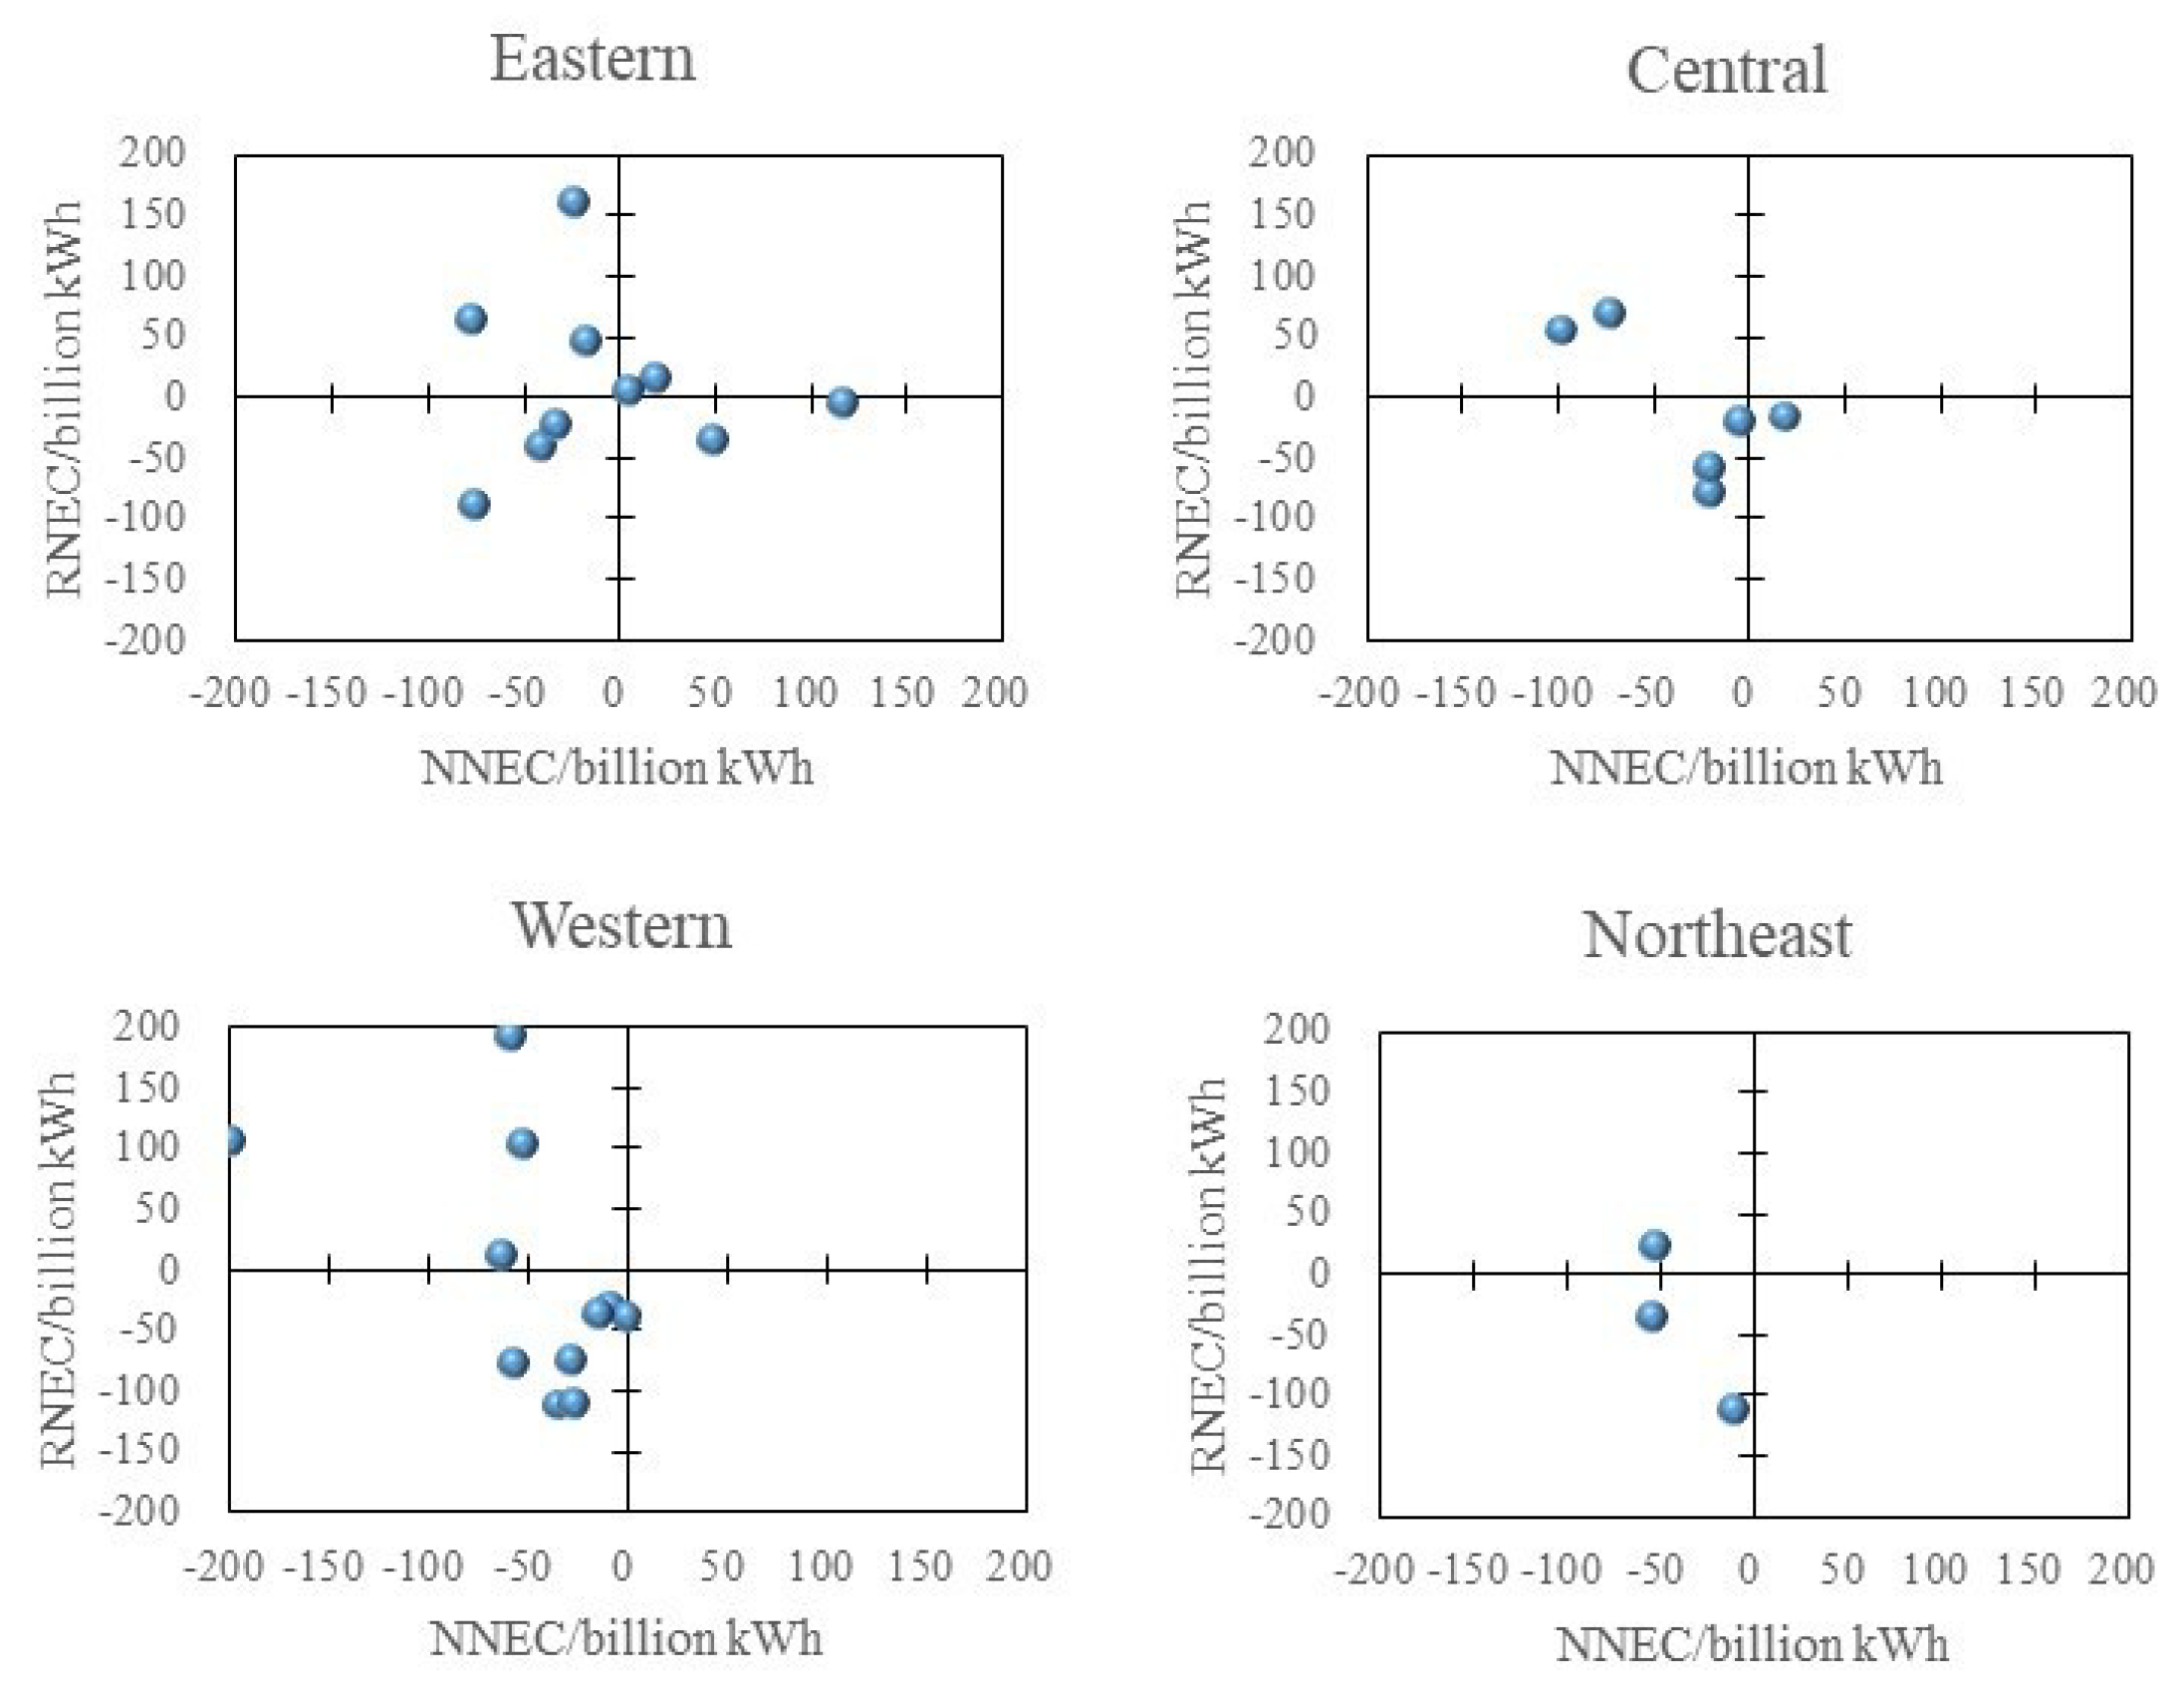
As electricity efficiency improvement is the determinant to decrease China’s electricity consumption, the efficiency change component (EC) is further decomposed into the national efficiency change component (NEC), the neighboring-nation efficiency change component (NNEC), and the region-neighbor efficiency change component (RNEC). According to the method shown in Figure 1 and based on the values of NNECr,t→t+1 and RNECr,t→t+1 calculated by Equation (4), we can figure out the combined effects of NNEC and RNEC for each province of China. As there are obvious differences in the efficiency change component (EC) between the eastern, central and western area of China during 2000–2015 (Figure 4a), we figure out the spatiotemporal variation of NNEC and RNEC in electricity consumption in China’s four economic regions for the entire period (Figure 5) and every five years (Figure 6a–c).
During 2000–2015, the value of NEC, NNEC, and RNEC in Chinese 30 provinces adds up to −4256, −951 and −130 billion kWh, respectively. They are 80%, 18% and 2% of the total EC. That is to say, among the total decrease in China’s electricity consumption caused by electricity efficiency improvement for the entire period, about 20% is caused by spatial spillover effect, which is usually ignored by the existing literature. From geographical spatial differentiation (Figure 5), the points of NNEC and RNEC in the eastern area of China are scattered in four quadrants. Moreover, from the plus-minus and the absolute values of the horizontal and longitudinal coordinates, we can easily see that the sums of NNEC and RNEC in six out of ten provinces are positive. It means that neighboring regions have a positive impact on the electricity consumption growth in these provinces. However, most of the central, western and northeast areas of China are in the second and third quarters. It means that most provinces have a neighborhood or regional advantage in electricity efficiency. Moreover, the sums of NNEC and RNEC in seventeen out of twenty provinces are negative. It means that the increase in electricity efficiency in neighboring areas may have a positive impact on the electricity consumption decrease in these provinces from 2000 to 2015.
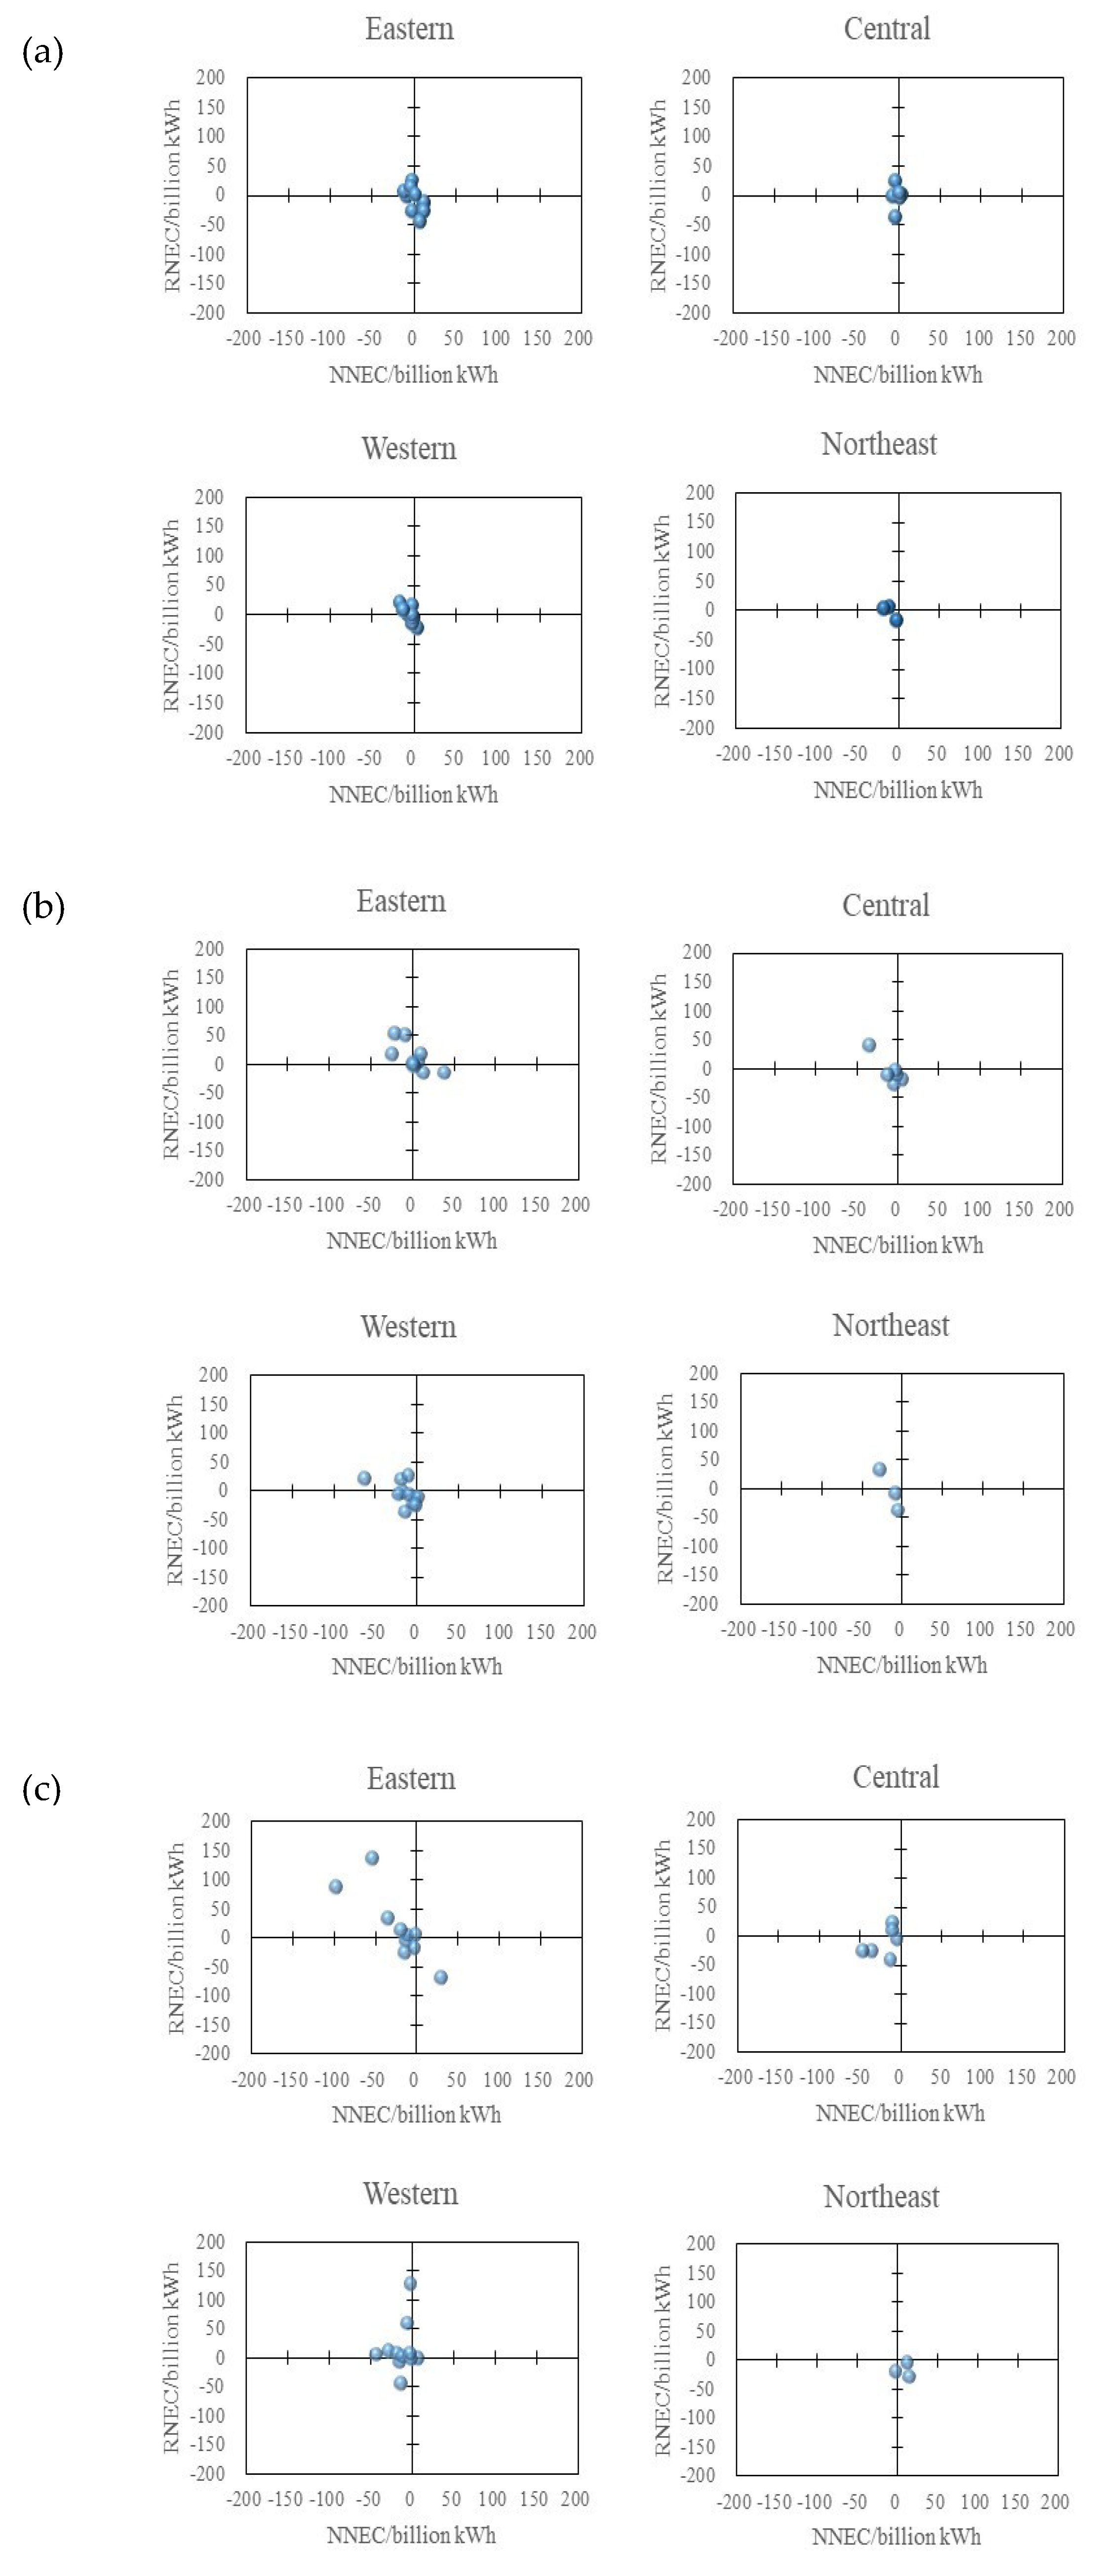
During 2000–2005, the value of NEC, NNEC, and RNEC in Chinese 30 provinces adds up to −305, −76 and −120 billion kWh, respectively. They are 61%, 15% and 24% of the total EC. The points of NNEC and RNEC in the eastern, central, western and northeast areas of China are all scattered in four quadrants (Figure 6a). However, the sums of NNEC and RNEC in eight out of 30 provinces are positive. It means that the increase in electricity efficiency in neighboring areas also has a positive impact on the electricity consumption decrease in most provinces for this period.
During 2005–2010, the value of NEC, NNEC, and RNEC in Chinese 30 provinces adds up to −1307, −251 and 19 billion kWh, respectively. They are 85%, 16% and −1% of the total EC. As shown in Figure 6b, the points of NNEC and RNEC in the eastern area are scattered in the first, second and fourth quarters. It means that no province has a regional advantage in electricity efficiency in the eastern area. However, in the central, western and northeast areas of China, almost all the points are in the second and third quarters. It means that these provinces have a neighborhood or regional advantage in electricity efficiency. On the whole, the sums of NNEC and RNEC in ten out of 30 provinces are positive for this period.
During 2010–2015, the value of NEC, NNEC, and RNEC in Chinese 30 provinces adds up to −836, −463 and 230 billion kWh, respectively. They are 78%, 43% and −21% of the total EC. As shown in Figure 6c, in the eastern, central and western areas of China, almost all the points are in the second and third quarters. It means that these provinces have a neighborhood or regional advantage in electricity efficiency. However, in the northeast areas of China, the points tend to distribute in the fourth quarter. It suggests a neighborhood disadvantage in electricity efficiency. On the whole, the sums of NNEC and RNEC in eight out of 30 provinces are positive for this period.
4. Conclusions and Policy Implications
This paper used a spatial shift-share decomposition model to quantify the impact of various components of electricity consumption changes across 30 Chinese provinces from 2000 to 2015. It clarified the regional differences in China’s electricity consumption changes and the impact of the spatial spillover effects. Some important conclusions and policy implications for China were obtained as follows:
(1) During 2000–2015, China’s electricity consumption has increased by 4328 billion kWh in total. Among them, economic growth, industry structure adjustment, and electricity efficiency improvement have caused a change by 8919, 746 and −5337 billion kWh, respectively. It indicates that economic growth and electricity efficiency improvement are two major driving forces for China’s electricity consumption change while industry structure adjustment has relatively little effect. Therefore, to control electricity consumption growth, China should properly adjust the speed of economic development and pay more attention to the quality of economic development [38]. Moreover, relying on scientific and technological progress, the perfection of the management system and market mechanism, China should continue to vigorously improve the electricity efficiency. Last but not least, China should tap the potential of industrial restructuring and build a more energy-efficient economic system.
(2) Among the total decrease in China’s electricity consumption caused by electricity efficiency improvement during 2000–2015, the national efficiency change component (NEC), the neighboring-nation efficiency change component (NNEC), and the region-neighbor efficiency change component (RNEC) are −4256, −951 and −130 billion kWh, respectively. That is to say, about 20% is caused by spatial spillover effects. In other words, the improvement of electricity efficiency in neighboring provinces may reduce electricity consumption in most Chinese provinces, and they have caused a decrease in electricity consumption by 1081 billion kWh in total. Therefore, to control electricity consumption, each province should pay more attention to the potential influence of its neighboring provinces. Furthermore, China should strengthen unified energy and electric power management system among different provinces [11,30].
(3) There are complex situations for the geographical distribution of the electricity consumption changes’ components across China’s provinces for the entire period and every five years during 2000–2015. They are mainly influenced by the economic aggregate, economic growth rate, economic structure, and development stage of industrialization. On the whole, there are obvious differences between the eastern, central, western and northeast area of China, especially for the efficiency change component (EC). Most of the central, western and northeast provinces have a neighborhood or regional advantage in electricity efficiency, which benefits from the spatial spillover effects of the eastern area of China. Therefore, each province should formulate differentiated electricity consumption regulation policies and regional development strategies according to its own situation. For most developed provinces in the eastern area of China, they should make full use of the first mover advantages to greatly improve the electricity efficiency by technological and institutional innovation, as well as industrial structure optimization and upgrading. For most undeveloped and developing provinces in the central, western and northeast area of China, they should make the best of the advantages of backwardness and learn from the advanced and aborted experiences of the developed provinces. Thus, China may finally obtain a decoupling relationship between electricity consumption and economic growth [26,27,28].
It should be pointed out that, though we have quantitatively detected the positive/negative effects of the influencing factors of China’s electricity consumption changes and put forward some policy implications based on the quantitative results, we cannot reveal the essential reason behind it at present. Therefore, the policy implications put forward in this paper are strategical and not in-depth enough. In the future, we should explain how and why the influencing factors work in detail and find the potential problems of each policy which has been put forward in this paper.
Author Contributions
Conceptualization, C.B.; data curation, R.L.; formal analysis, C.B.; funding acquisition, C.B.; investigation, R.L.; methodology, R.L.; resources, C.B.; supervision, C.B.; validation, R.L.; writing—original draft preparation, C.B.; writing—review and editing, C.B.
Funding
This research was funded by National Natural Science Foundation of China (grant number: 41571156), the Strategic Priority Research Program of Chinese Academy of Sciences (grant number: XDA20040401), and the Major Projects of the National Natural Science Foundation of China (grant number: 41590844).
Conflicts of Interest
The authors declare no conflict of interest.
References
- Bao, C.; Fang, C. Geographical and environmental perspectives for the sustainable development of renewable energy in urbanizing China. Renew. Sustain. Energ. Rev. 2013, 27, 464–474. [Google Scholar] [CrossRef]
- Zhao, Y.B.; Wang, S.J. The relationship between urbanization, economic growth and energy consumption in China: An econometric perspective analysis. Sustainability 2015, 7, 5609–5627. [Google Scholar] [CrossRef]
- Yang, S.; Shi, L. Prediction of long-term energy consumption trends under the New National Urbanization Plan in China. J. Clean. Prod. 2017, 166, 1144–1153. [Google Scholar] [CrossRef]
- Dong, F.; Yu, B.; Zhang, J. What contributes to regional disparities of energy consumption in China? Evidence from quantile regression-shapley decomposition approach. Sustainability 2018, 10, 1806. [Google Scholar] [CrossRef]
- Liu, X.; Zhou, D.; Zhou, P.; Wang, Q. Factors driving energy consumption in China: A joint decomposition approach. J. Clean. Prod. 2018, 172, 724–734. [Google Scholar] [CrossRef]
- Zhao, Y.B.; Liu, X.F.; Wang, S.J.; Ge, Y.J. Energy relations between China and the countries along the Belt and Road: An analysis of the distribution of energy resources and interdependence relationships. Renew. Sustain. Energ. Rev. 2019, 107, 133–144. [Google Scholar] [CrossRef]
- Bao, C.; Wang, H. Trans-provincial convergence of per capita energy consumption in urban China, 1990-2015. Sustainability 2019, 11, 1431. [Google Scholar] [CrossRef]
- Zhang, C.; Zhou, K.; Yang, S.; Shao, Z. On electricity consumption and economic growth in China. Renew. Sust. Energ. Rev. 2017, 76, 353–368. [Google Scholar] [CrossRef]
- Ding, S.; Hipel, K.W.; Dang, Y. Forecasting China’s electricity consumption using a new grey prediction model. Energy 2018, 149, 314–328. [Google Scholar] [CrossRef]
- Zhao, W.; Cao, Y.; Miao, B.; Wang, K.; Wei, Y.M. Impacts of shifting China’s final energy consumption to electricity on CO2 emission reduction. Energ. Econ. 2018, 71, 359–369. [Google Scholar] [CrossRef]
- He, Y.; Guang, F.; Wang, M. The efficiency of electricity-use of China and its influencing factors. Energy 2018, 163, 258–269. [Google Scholar] [CrossRef]
- Hoekstra, R.; van der Bergh, J.C.J.M. Comparing structural and index decomposition analysis. Energ. Econ. 2003, 25, 39–64. [Google Scholar] [CrossRef]
- Ang, B.W.; Su, B.; Wang, H. A spatial–temporal decomposition approach to performance assessment in energy and emissions. Energ. Econ. 2016, 60, 112–121. [Google Scholar] [CrossRef]
- Zaccomer, G.P.; Mason, P. A new spatial shift-share decomposition for the regional growth analysis: A local study of the employment based on Italian Business Statistical Register. Stat. Methods Appl. 2011, 20, 329–356. [Google Scholar] [CrossRef]
- Jones, J.H. A memorandum of the location of industry. In Report of The Royal Commission on the Distribution of Industrial Population (Barlow Report), Appendix II; HMSO: London, UK, 1940; pp. 249–280. [Google Scholar]
- Creamer, D. Shift of Manufacturing Industries, in Industrial Location and National Resources; Government Printing Office: Washington, DC, USA, 1942.
- Dunn, E.S. A statistical and analytical technique for regional analysis. Pap. Proc. Reg. Sci. Assoc. 1960, 6, 97–112. [Google Scholar] [CrossRef]
- Esteban, J.M. Regional convergence in Europe and the industry mix: a shift-share analysis. Reg. Sci. Urban Econ. 2000, 30, 353–364. [Google Scholar] [CrossRef] [Green Version]
- Nazara, S.; Hewings, G.J.D. Spatial structure and taxonomy of decomposition in shift-share analysis. Growth Chang. 2004, 35, 476–490. [Google Scholar] [CrossRef]
- Zaccomer, G.P. Shift-share analysis with spatial structure: an application to Italian industrial districts. Trans. Stud. Rev. 2006, 13, 213–227. [Google Scholar] [CrossRef]
- Espa, G.; Filipponi, D.; Giuliani, D.; Piacentino, D. Decomposing regional business change at plant level in Italy: A novel spatial shift-share approach. Pap. Reg. Sci. 2014, 93, 114–135. [Google Scholar] [CrossRef]
- Grossi, L.; Mussini, M.A. Spatial shift-share decomposition of electricity consumption changes across Italian regions. Energ. Policy 2018, 113, 278–293. [Google Scholar] [CrossRef]
- He, C.; Ma, Q.; Li, T.; Yang, Y.; Liu, Z. Spatiotemporal dynamics of electric power consumption in Chinese Mainland from 1995 to 2008 modeled using DMSP/OLS stable nighttime lights data. J. Geogr. Sci. 2012, 22, 125–136. [Google Scholar] [CrossRef]
- Pan, J.; Li, J. Estimate and spatio-temporal dynamic of electricity consumption in China based on DMSP/OLS images. Geogr. Res. 2016, 35, 627–638. (In Chinese) [Google Scholar]
- Lin, B. Electricity consumption and Chinese economic growth: The study based on production function. Manag. World 2003, 11, 18–27. (In Chinese) [Google Scholar]
- Shiu, A.; Lam, P. Electricity consumption and economic growth in China. Energ. Policy 2004, 32, 47–54. [Google Scholar] [CrossRef]
- Yuan, J.; Zhao, C.; Yu, S.; Hu, Z. Electricity consumption and economic growth in China: Cointegration and co-feature analysis. Energ. Econ. 2007, 29, 1179–1191. [Google Scholar] [CrossRef]
- Lin, B.; Liu, C. Why is electricity consumption inconsistent with economic growth in China? Energ. Policy 2016, 88, 310–316. [Google Scholar] [CrossRef]
- Wang, Y.; Zhang, J.; Guo, H. Decomposition of electricity consumption in China by primary component analysis. Clean Techn. Environ. Policy 2016, 18, 2533–2540. [Google Scholar] [CrossRef]
- Fang, D.; Hao, P.; Hao, J. Study of the influence mechanism of China’s electricity consumption based on multi-period ST-LMDI model. Energy 2019, 170, 730–743. [Google Scholar] [CrossRef]
- Zhang, C.; Su, B.; Zhou, K.; Yang, S. Analysis of electricity consumption in China (1990-2016) using index decomposition and decoupling approach. J. Clean. Prod. 2019, 209, 224–235. [Google Scholar] [CrossRef]
- Polenske, K.R.; Lin, X. Conserving energy to reduce carbon dioxide emissions in China. Struct. Chang. Econ. Dyn. 1993, 4, 249–265. [Google Scholar] [CrossRef]
- Isard, W. Methods of Regional Analysis: An Introduction to regional Science; MIT Press: Cambridge, MA, USA, 1960. [Google Scholar]
- Moran, P.A.P. Notes on continuous stochastic phenomena. Biometrika 1950, 37, 17–23. [Google Scholar] [CrossRef]
- Bao, C.; Chen, X. Spatial econometric analysis on influencing factors of water consumption efficiency in urbanizing China. J. Geogr. Sci. 2017, 27, 1450–1462. [Google Scholar] [CrossRef]
- NBSC (National Bureau of Statistics of China). China Energy Statistical Yearbook; China Statistics Press: Beijing, China, 2001–2016. (In Chinese)
- NBSC (National Bureau of Statistics of China). China Statistical Yearbook; China Statistics Press: Beijing, China, 2001–2016. (In Chinese)
- Bao, C.; Zou, J. Exploring the coupling and decoupling relationships between urbanization quality and water resources constraint intensity: Spatiotemporal analysis for Northwest China. Sustainability 2017, 9, 1960. [Google Scholar] [CrossRef]
Figure 1.
Indication of the combined effect of NNEC and RNEC for a region.

Figure 2.
Spatiotemporal variation of output change component (OC) in electricity consumption across China’s provinces.
Figure 2.
Spatiotemporal variation of output change component (OC) in electricity consumption across China’s provinces.

Figure 3.
Spatiotemporal variation of IM in electricity consumption across China’s provinces.

Figure 4.
Spatiotemporal variation of efficiency change component (EC) in electricity consumption across China’s provinces.
Figure 4.
Spatiotemporal variation of efficiency change component (EC) in electricity consumption across China’s provinces.

Figure 5.
Spatiotemporal variation of NNEC and RNEC in electricity consumption in China’s four economic regions during 2000–2015.
Figure 5.
Spatiotemporal variation of NNEC and RNEC in electricity consumption in China’s four economic regions during 2000–2015.

Figure 6.
Spatiotemporal variation of NNEC and RNEC in electricity consumption in China’s four economic regions. (a) 2000–2005; (b) 2005–2010; (c) 2010–2015.
Figure 6.
Spatiotemporal variation of NNEC and RNEC in electricity consumption in China’s four economic regions. (a) 2000–2005; (b) 2005–2010; (c) 2010–2015.


Table 1.
Moran’s test for spatial autocorrelation under randomization assumption.
| Indicator | Time | 2000 | 2005 | 2010 | 2015 |
| er | Moran’s I | 0.287 | 0.209 | 0.198 | 0.252 |
| Variance | 0.011 | 0.010 | 0.011 | 0.011 | |
| p-value | 0.003 | 0.016 | 0.024 | 0.007 | |
| Indicator | Time | 2000–2015 | 2000–2005 | 2005–2010 | 2010–2015 |
| cr | Moran’s I | 0.111 | 0.119 | 0.150 | −0.109 |
| Variance | 0.013 | 0.014 | 0.009 | 0.008 | |
| p-value | 0.096 | 0.099 | 0.034 | 0.155 | |
| Indicator | Time | 2000–2015 | 2000–2005 | 2005–2010 | 2010–2015 |
| ECr | Moran’s I | −0.231 | −0.234 | −0.243 | 0.130 |
| Variance | 0.013 | 0.015 | 0.014 | 0.014 | |
| p-value | 0.026 | 0.028 | 0.026 | 0.069 |
Notes. GeoDa 1.12 has been used to calculate the test statistics, p-values lower than 0.1, 0.05 and 0.01 indicate a spatial autocorrelation of a significance at 10%, 5%, and 1% level, respectively.
© 2019 by the authors. Licensee MDPI, Basel, Switzerland. This article is an open access article distributed under the terms and conditions of the Creative Commons Attribution (CC BY) license (http://creativecommons.org/licenses/by/4.0/).
Share and Cite
MDPI and ACS Style
Bao, C.; Liu, R. Electricity Consumption Changes across China’s Provinces Using A Spatial Shift-Share Decomposition Model. Sustainability 2019, 11, 2494. https://0-doi-org.brum.beds.ac.uk/10.3390/su11092494
AMA Style
Bao C, Liu R. Electricity Consumption Changes across China’s Provinces Using A Spatial Shift-Share Decomposition Model. Sustainability. 2019; 11(9):2494. https://0-doi-org.brum.beds.ac.uk/10.3390/su11092494
Chicago/Turabian StyleBao, Chao, and Ruowen Liu. 2019. "Electricity Consumption Changes across China’s Provinces Using A Spatial Shift-Share Decomposition Model" Sustainability 11, no. 9: 2494. https://0-doi-org.brum.beds.ac.uk/10.3390/su11092494
Note that from the first issue of 2016, this journal uses article numbers instead of page numbers. See further details here.