Article

Effects of Saline and Deficit Irrigation on Soil-Plant Water Status and Potato Crop Yield under the Semiarid Climate of Tunisia

1
Department of Plant Biotechnology, Higher Institute of Biotechnology of Beja, Avenue Habib Bourguiba, B.P: 382, Béja 9000, Tunisia
2
Department of Agriculture, Food and Environment (DAFE), University of Pisa, Via del Borghetto 80, 56124 Pisa, Italy
3
Olive Institute, Unit of Sousse, Ibn Khaldoun 14, Sousse 4061, Tunisia
4
Department of Rural Engineering, High Agronomic Institute of Chott Mériem, Université de Sousse, BP 47, Chott Mériem Sousse 4042, Tunisia
5
Department Agriculture, Food and Forest Sciences, Università degli Studi di Palermo, Viale delle Scienze 12, Ed.4, 90128 Palermo, Italy
*
Author to whom correspondence should be addressed.
Sustainability 2019, 11(9), 2706; https://0-doi-org.brum.beds.ac.uk/10.3390/su11092706
Submission received: 7 April 2019 / Revised: 6 May 2019 / Accepted: 8 May 2019 / Published: 13 May 2019
(This article belongs to the Special Issue Sustainable Crop Production Systems)

Abstract

:
Water supplies have been decreasing in several semi-arid regions, and it is therefore necessary to adopt irrigation strategies aimed at maximizing water use efficiency. In this paper, the effects of saline and deficit irrigation on water use efficiency and on potato crop response, based on observations of soil and plant water status, were investigated. Experiments were carried out in Central Tunisia, by monitoring potato crop growth during two seasons in four distinct treatments (T1–T4), represented by two different irrigation doses and two water qualities. For irrigation scheduling purposes, thresholds of soil matric potential, soil water content and Crop Water Stress Index (CWSI) were identified with the aim to quantify the effects of water and/or salinity stress on the achievable yield. Experiments allowed verifying that crop yield is strongly affected by the seasonal amount and quality of applied water. Despite differences of crop yield between treatments T2, T3 and T4 not being statistically significant (P < 0.05), crop yield varied between 26.3 t/ha (T3 in 2015) to 16.3 t/ha (T4 in 2015). However, crop yield decline of 17.0 t/ha and 12.0 t/ha per each 100 mm decrease of applied water were observed under the application of water electrical conductivity of 1.6 dS/m and 4.1 dS/m respectively. On the other hand, an increase of 1.0 dS/m in water electrical conductivity caused a yield decline rate of about 10%. The results achieved showed that under the semi-arid climate of Tunisia, potato crop irrigation should be scheduled to avoid water deficit; however, the possibility to reduce water supply can be envisaged when water availability is limited, but with the awareness to accept the shortage of production. Finally, when saline water is the only source available to the farm, it is necessary to avoid the reduction of irrigation doses, to prevent excessive salt accumulation in the root zone with unavoidable effects on crop yield.

1. Introduction

In arid and semiarid regions, up to 70–80% of the total water resources are used for agriculture [1]. According to the climate change scenarios for the Mediterranean region, annual precipitation and the number of rainy days are expected to decrease so that the problem will be accentuated in the near future [2,3,4]. In Tunisia, the potato represents the second main crop, with a total surface of about 7% of irrigated lands and a production of 360,000 tons per year [5]. In the country, potatoes are usually grown in early season, from November to April to promote export towards northern European countries [6], or in the spring seasons, approximately from January to June. Under the semi-arid climate of Central Tunisia, winter and early spring rainfall usually provide part of the water needed to satisfy crop transpiration requirements. However, since the beginning of April, air temperature tends to increase and the amount of rainfall decreases. This is the period when plants achieve their full development stage, have the highest demand for water and are very sensitive to water deficit [7]. Therefore, potato crops have to be adequately irrigated to avoid the reduction of tuber growth or possible tuber malformation, with unavoidable effects on the marketable production [8]. Moreover, in regions where water is limited, farmers are obliged to use saline or treated wastewaters and/or to reduce the seasonal water amount [1,9,10]. When coping with water and saline stress, irrigation scheduling should account for the dependency of crop yield from water quality and quantity, in order to minimize water losses and to optimize irrigation water use efficiency (WUE) as well as to limit the salt build-up in the root zone [11].
In order to increase WUE it is necessary, on the one hand, to dispose of well-designed water distribution systems allowing to achieve high distribution uniformity [12,13,14] and, on the other, to adopt irrigation water saving strategies, like regulated deficit irrigation (RDI) or partial root drying (PRD). Application of such strategies requires the precise control of irrigation timing and applied water depth, which can be done by monitoring indicators of soil and plant water status. These investigations usually allow increasing the knowledge of the examined crop system, as well as identifying irrigation scheduling parameters aimed to avoid severe stress conditions that could determine significant loss of production [15,16]. However, under the semi-arid conditions of Tunisia, such strategies have not been widely experimented yet, so that any information is available in this direction.
Under subsurface drip irrigation (SDI) the monitoring of crop water status should be preferred, because of the quite high spatial variability of soil water contents and the consequent non-uniform root distribution [10]. Crop water stress index (CWSI), accounting for the differences between canopy and air temperatures (Tc–Ta) at a fixed air vapor pressure deficit (VPD), was found to be a promising indicator to quantify crop water stress [17,18,19]. However, the computation of CWSI requires the knowledge of two baselines: the first (lower limit) is obtained on a well-watered crop in the absence of stress, whereas the second (upper limit) is obtained under the maximum stress, corresponding to a non-transpiring crop [20]. The lower baseline decreases at increasing VPD, whereas the upper baseline is almost constant. At lower VPDs in fact, the rate of transpiration decreases, as the magnitude of the leaf cooling. Experiments carried out by Idso [20] on a number of crops and locations showed that the lower baseline is linearly correlated to VPD.
The objective of the paper was to evaluate thresholds of soil and plant water status for irrigation scheduling of a potato crop irrigated with two water qualities provided by different natural sources. The interaction between water use and crop yield was also investigated to assess the irrigation performance and the ability to quantify crop water-salinity stress on the achievable crop yield.

2. Materials and Methods

2.1. Site Description, Experimental Design and Irrigation Management

Experiments were carried out in 2014 and 2015 at the High Agronomic Institute of Chott Mariem, Sousse, Tunisia (longitude 10.5632° W; latitude 35.9191° N, altitude 19 m a.s.l.). The area is characterized by a semi-arid climate, with hot and dry summers and mild-rainy winters, and with average annual precipitation of about 230 mm and evapotranspiration slightly higher than 1300 mm [21].
The experimental field, 50.0 m length and 15.0 m wide, was divided in four equal 25 m long and 7.5 m large plots (treatments T1, T2, T3 and T4). In 2014, potato (Solanum Tuberosum L., cv. Safran) tuber seeds were planted on January 15, whereas in 2015 they were planted on 22 January, at a distance of 0.40 m along the row and 0.80 m between the rows. Irrigation water was provided by means of drip laterals buried at 0.20 m depth in order to maximize root water uptake [2]. Co-extruded emitters, spaced 0.40 m discharged 3.5 l·h−1 at the nominal pressure of 100 kPa. All treatments followed the same management with the exception of water quality and irrigation doses. Two different water qualities were used for irrigation: the first, diverted by the pipe network fed by the Nebhana water reservoir was characterized by electrical conductivity, ECw, of about 1.6 dS m−1 and used for treatments T1 and T2, whereas the second, with ECw of about 4.1 dS m−1, was pumped from a well nearby the experimental area and used to irrigate treatments T3 and T4.
Regarding irrigation doses, treatments T1 and T3 received irrigation volumes corresponding to about the maximum crop evapotranspiration between consecutive watering (full irrigation, FI), whereas treatments T2 and T4 received approximately the half of irrigation volumes provided in T1 and T3 (deficit irrigation, DI). A weather station located about 300 m apart from the experimental field allowed the collection of standard agro-meteorological data (air temperature, relative air humidity, global solar radiation, wind speed at 2.0 m height and rainfall). These variables were used to estimate reference evapotranspiration, ET0, according to the FAO-56 Penman Monteith equation [22].
After calculating daily values of ET0, the dual crop coefficient approach proposed by Allen et al. [23] was applied to compute the daily maximum soil evaporation, Emax, and crop transpiration, Tmax. Based on the field observation, the lengths of crop development stages for potato crop were adapted from those proposed in Table 11 of FAO-56 manual for semiarid regions, whereas the values for single crop coefficient (Kc) and basal crop coefficient (Kcb) where assumed equal to those published in Tables 12 and 17 of the same manual [22]. On the other hand, evaporation coefficient (Ke) was estimated as differences between values of single crop coefficient, Kc, and basal crop coefficient, Kcb [23,24,25].

2.2. Soil Water Status, Soil Matric Potential and Electrical Conductivity

Spatial and temporal variability of soil water content around single emitters were monitored in 2014 with a Trime Time Domain Reflectometer, (IMKO TDR Micromodultechnik GmbH). Three 80 cm long access tubes were installed at distances of 5 cm, 15 cm and 40 cm from the emitter and perpendicularly to the plant row. The probe, after calibration, allowed measuring volumetric soil water contents every 10 cm depth, with a precision of ±0.03 cm3 cm−3 [26,27]. Soil matric potentials in the root zone, h, was indirectly estimated from soil water contents, based on the soil water retention curve (SWRC) previously determined [22]. Soil water contents at field capacity, θfc, and at wilting point, θwp, were estimated as corresponding to soil matric potentials equal to −33 kPa and −1500 kPa.
Soil electrical conductivity in treatments T3 and T4 was determined on saturated extract (ECe) approximately every 20–25 days on soil samples collected at distances of about 0 and 25 cm from the emitter and at three different depths (0–20 cm, 20–40 cm and 40–60 cm), by following the methodology suggested by the US Salinity Laboratory Staff [28]. Being that the method was destructive, the measurements were carried out around different emitters.

2.3. Root Length and Crop Yield and Water Use Efficiency

During both growth seasons, temporal patterns of the root system measured on three different plants were collected from random locations of each treatment, on different days after planting (DAP 24, 78 and 109 in 2014 and DAP 29, 83 and 113 in 2015). After cleaning the roots with water, the maximum rooting depth, the maximum root radius and the depth of maximum density were measured with a tape. At the end of each season, crop yield was determined in each treatment by weighting the total mass (balance precision of 0.01 g) produced by nine plants chosen at the beginning, center and end of the central row. The corresponding average and standard deviation were then evaluated and compared. The performance of water application was evaluated based on the water use efficiency (WUE), evaluated as ratio between crop yield and the total volume applied (P + I), and irrigation water use efficiency (IWUE), obtained by dividing crop yield by the applied seasonal water.

2.4. Water Status Using Thermal Indicators

In 2015, the thermal crop response to soil water deficit and salinity stress was monitored based on thermal infrared images acquired with a Wahl Heat Spy HSI3000 thermal camera (Palmer Wahl Instruments Inc., Asheville, NC, USA), characterized by a spatial resolution of 0.4 × 0.4 mm at distance of 0.3 m and temperature accuracy, under the examined conditions, ranging between ±2 °C.
Seven acquisitions of leaf temperature were carried out in each treatment, the first of which was 15 days after plant emergence and the last seven days before harvesting. Two measurements were acquired during the initiation phase, three at the full development stage and two before harvesting.
In each treatment, only during clear days, thermal images were acquired at midday in the same plant in which TDR probes were installed. The camera was fixed at 1.8 m in height, with the axes directed along the vertical direction. The images acquired, characterized by a bi-modal distribution of retrieved temperatures, were then processed in order to separate soil from vegetation.
For each crop development stage, a threshold value was chosen to categorize the only region related to vegetation in which analyzing the variability of leaf temperature and computing the corresponding weighted-average; for the latter, the number of pixels characterizing each temperature was assumed as weight. The procedure proposed by Idso et al. [29] finally allowed assessing the dependency between upper and lower baselines and vapor pressure deficit, VPD, used to determine the crop water stress index (CWSI).

2.5. Statistical Analysis

Comparison among the treatments examined was carried out by means of analysis of variance (ANOVA) carried out by using the IBM SPSS Statistics software (release 20 for Windows). Mean values were compared according to the Student t-test and a level of significance (p) equal to 0.05.

3. Results

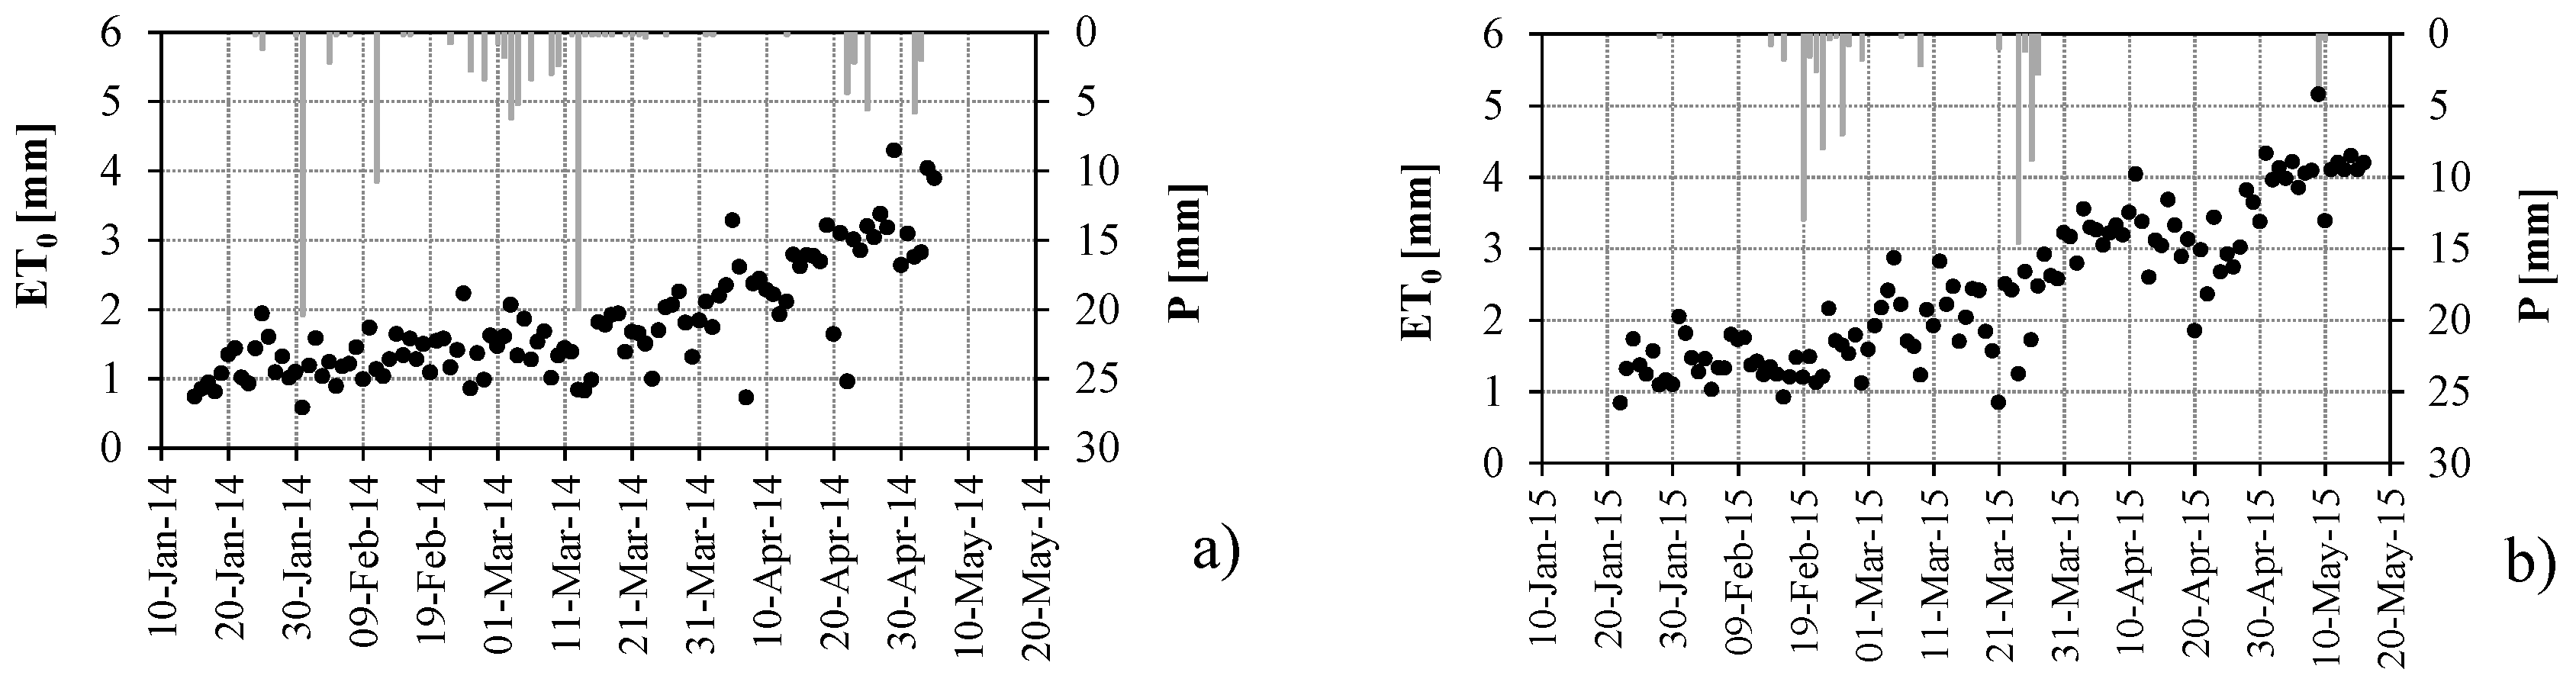
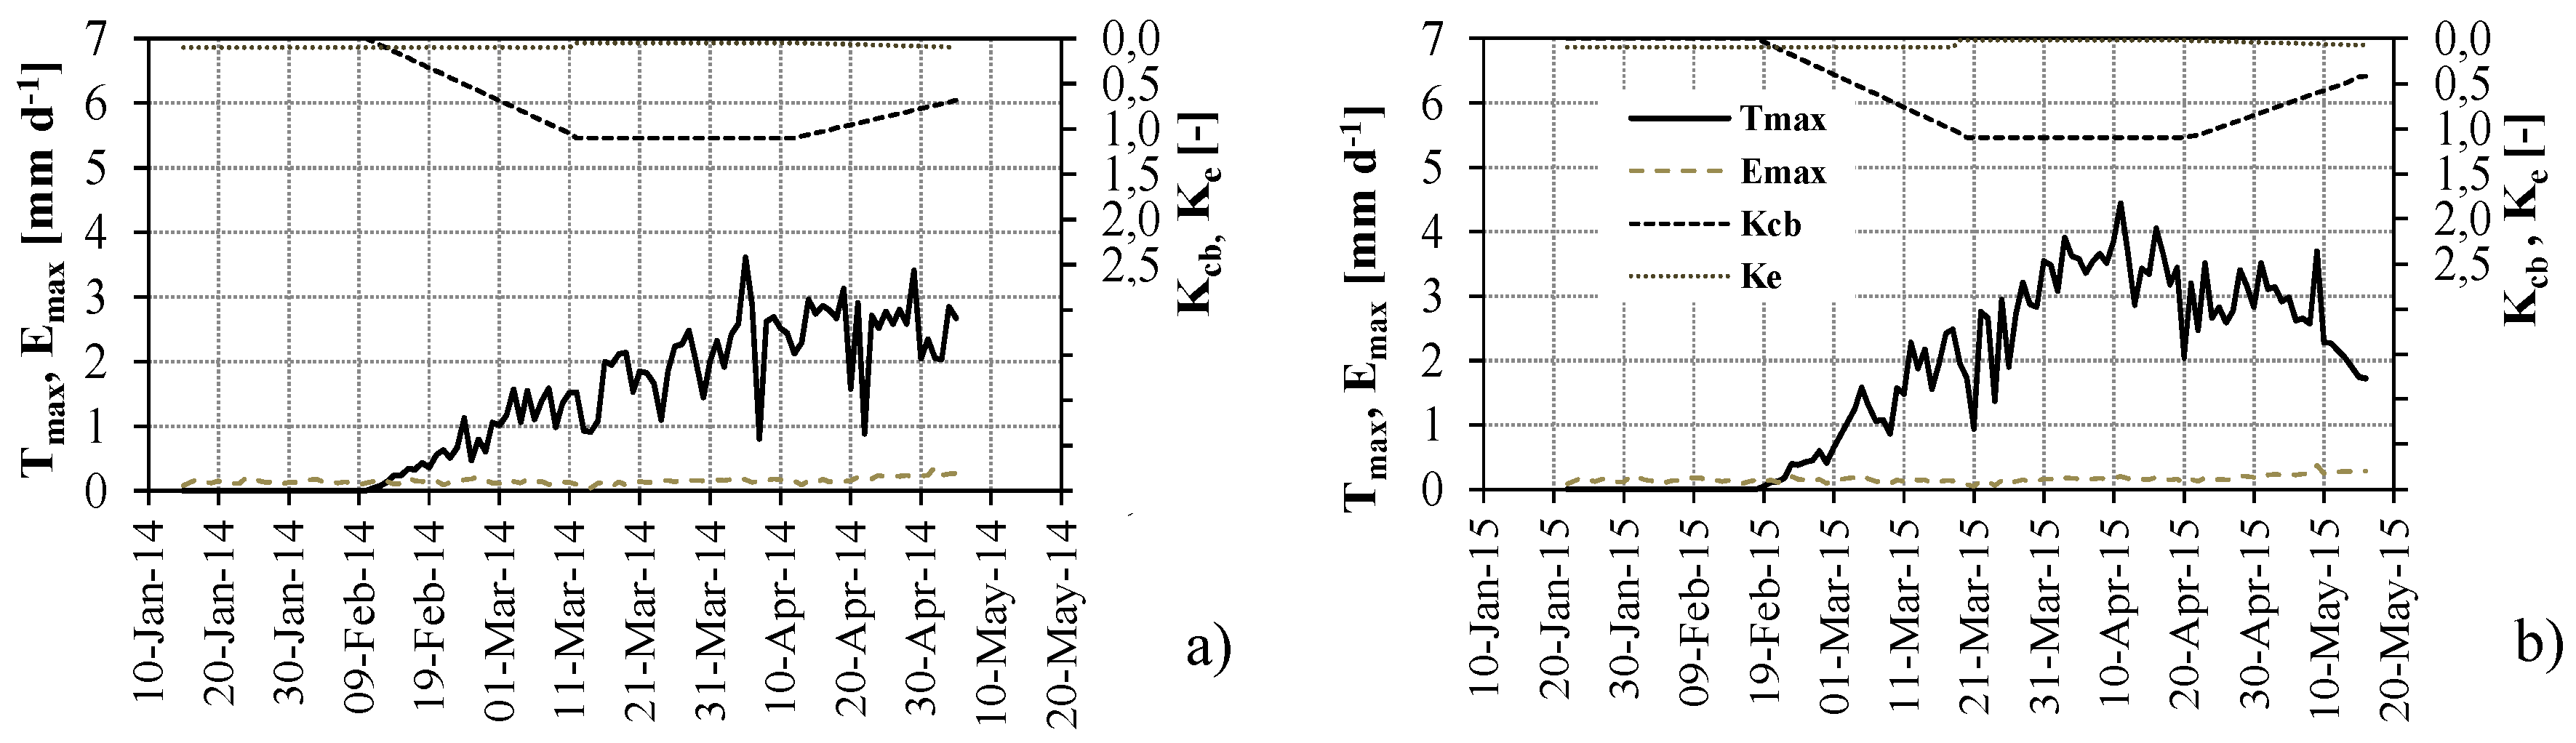
3.1. Agro-Climatic Characterization of the Study Area

Figure 1 shows the temporal trends of daily reference evapotranspiration, ET0 and precipitation, P, registered during the growth seasons 2014 and 2015, whereas Figure 2 shows the dynamic of daily maximum crop transpiration, Tmax, and soil evaporation, Emax, as well as the basal crop coefficient, Kcb, and the evaporation coefficient, Ke, for the examined growth seasons.
In both years the length of the growth season was similar, lasting 110 days in 2014 (from 15 January to 6 May) and 115 days in 2015 (from 21 January–May 16). Plant emergence was registered four weeks after sowing, the full development stage started on 11 March in 2014 and 21 March in 2015 for a total of 31 days, and finally harvesting occurred after 110 days from the planting date in 2014 and 115 in 2015.

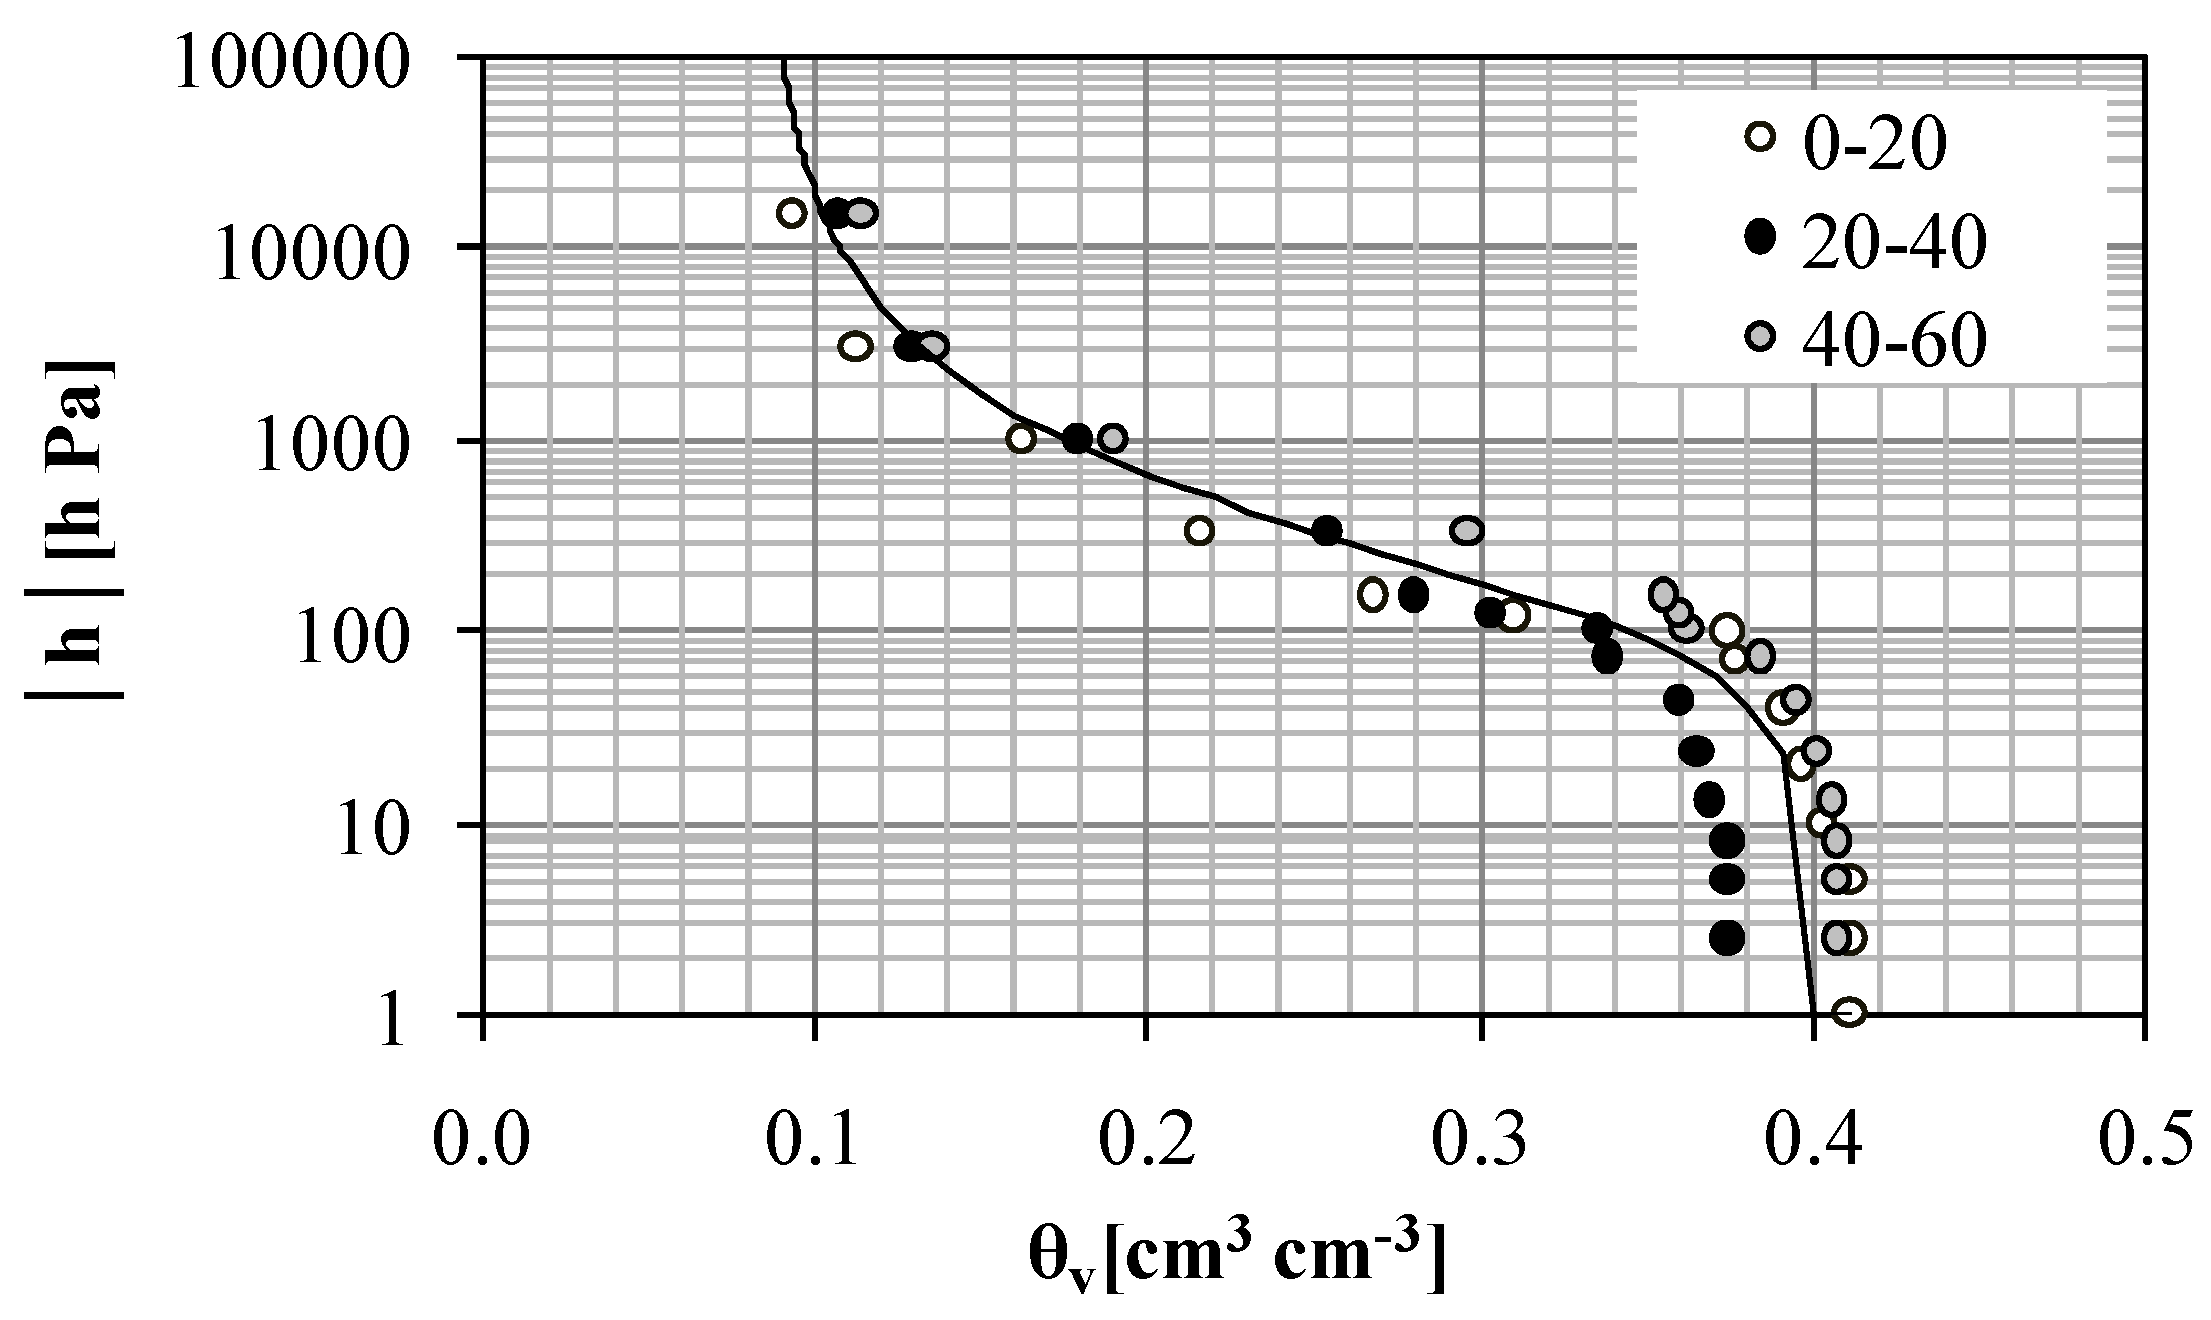
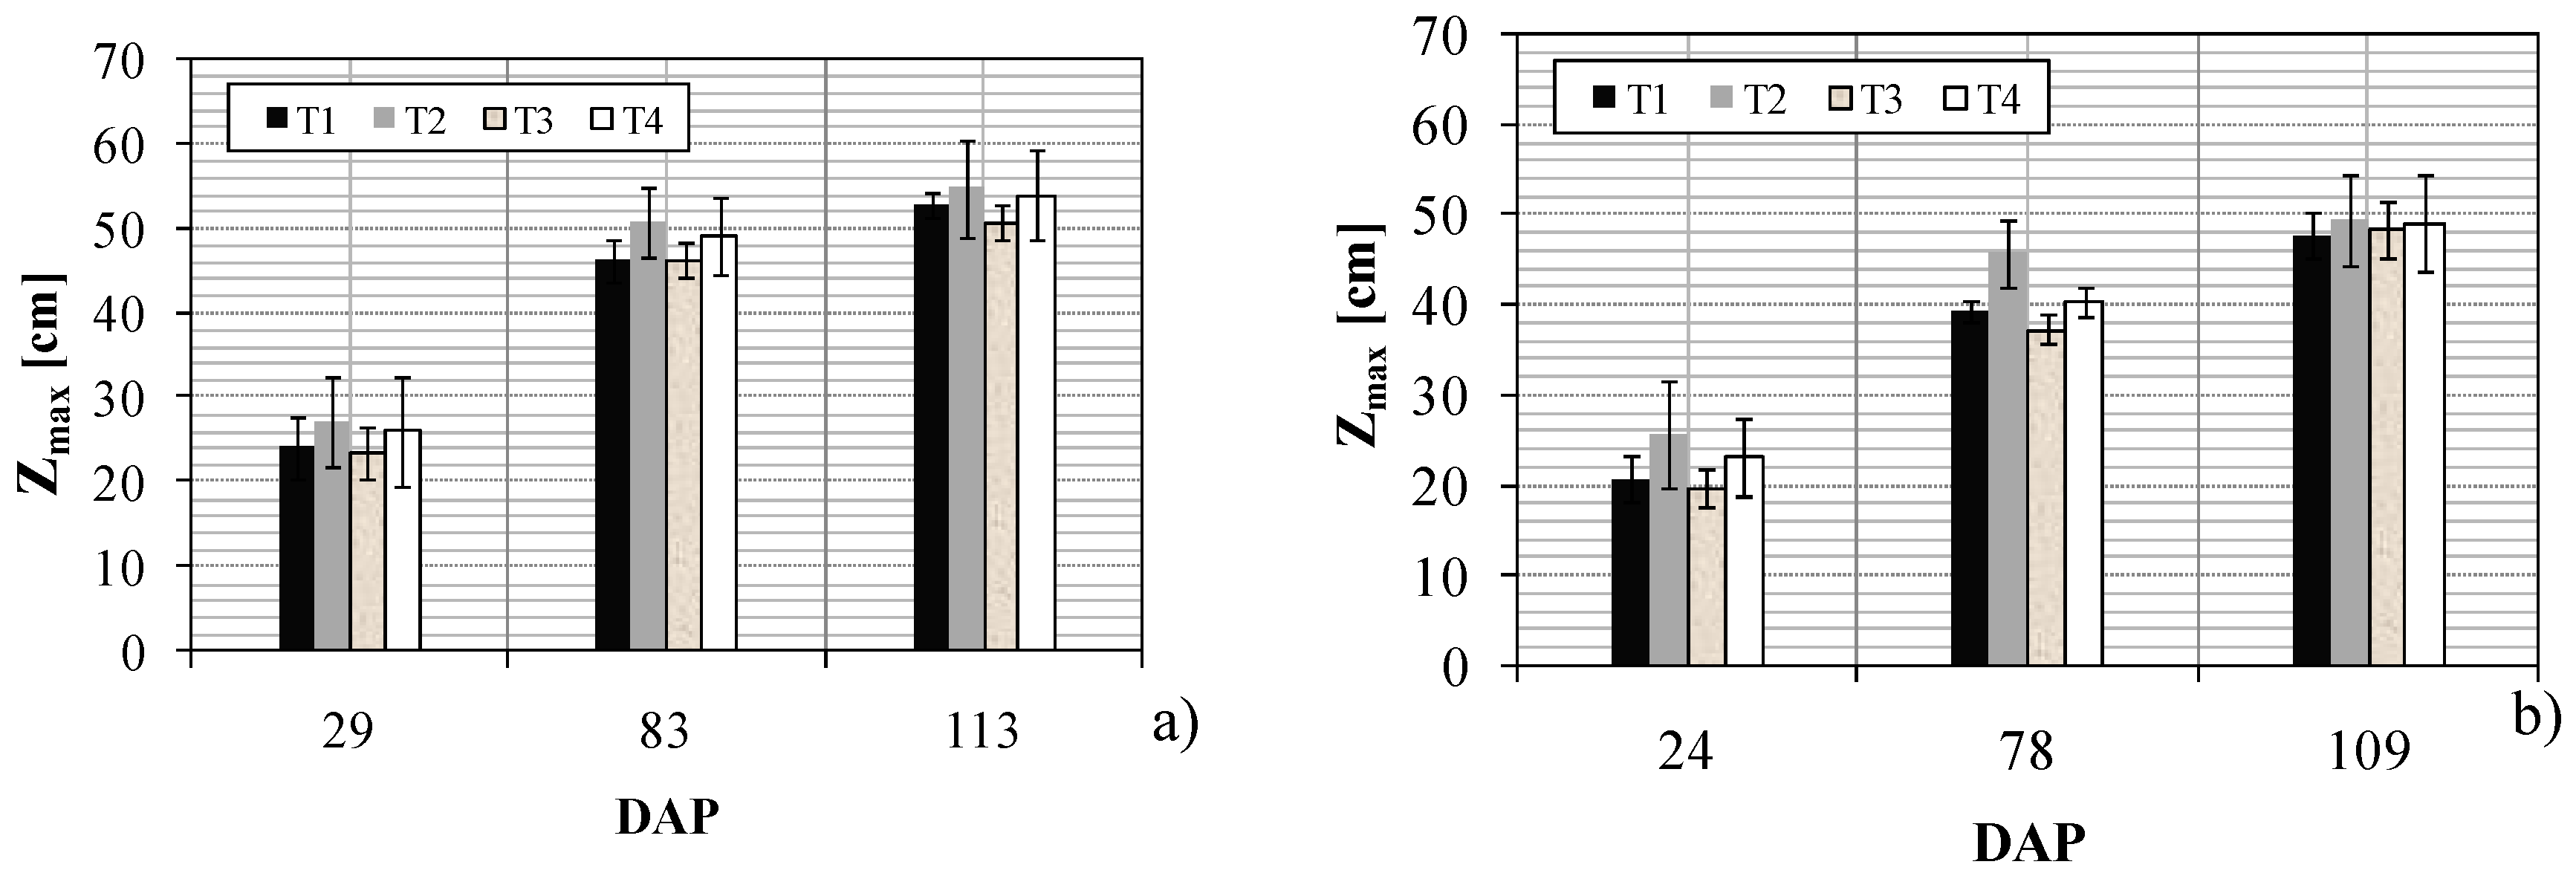
3.2. Physical Characterization of Soil and Root System

Table 1 summarizes the percentages of clay, silt and sand in the three layers (0–20 cm, 20–40 cm and 40–60 cm) of the investigated soil profile, as well as the soil bulk density and the van Genuchten parameters of the soil water retention curve. Certain homogeneity of soil particles along the soil profile can be observed with percentages of clay, silt and sand equal to 17.6, 14.7 and 67.7 respectively. According to the United States Department of Agriculture (USDA) textural classification system, the samples fall in the class of sandy loam soils. Figure 3 shows the values of matric potential, h, versus the volumetric soil water contents in the layers 0–20, 20–40 and 40–60 cm. The very little differences between the data at the different soil layers allowed the consideration of a single SWRC for the whole soil profile. Experimental values were then fitted by the van Genuchten model [30], whose parameters were estimated with the non-linear fitting software SWRC-Fit [31].
Figure 4 shows the maximum rooting depths measured for treatments T1, T2, T3 and T4 in 2014 and 2015 and at three different dates corresponding to different development stages (vegetative growth, full development stage and harvesting).

3.3. Soil and Crop Water Status Monitoring to Define Thresholds for Irrigation Scheduling

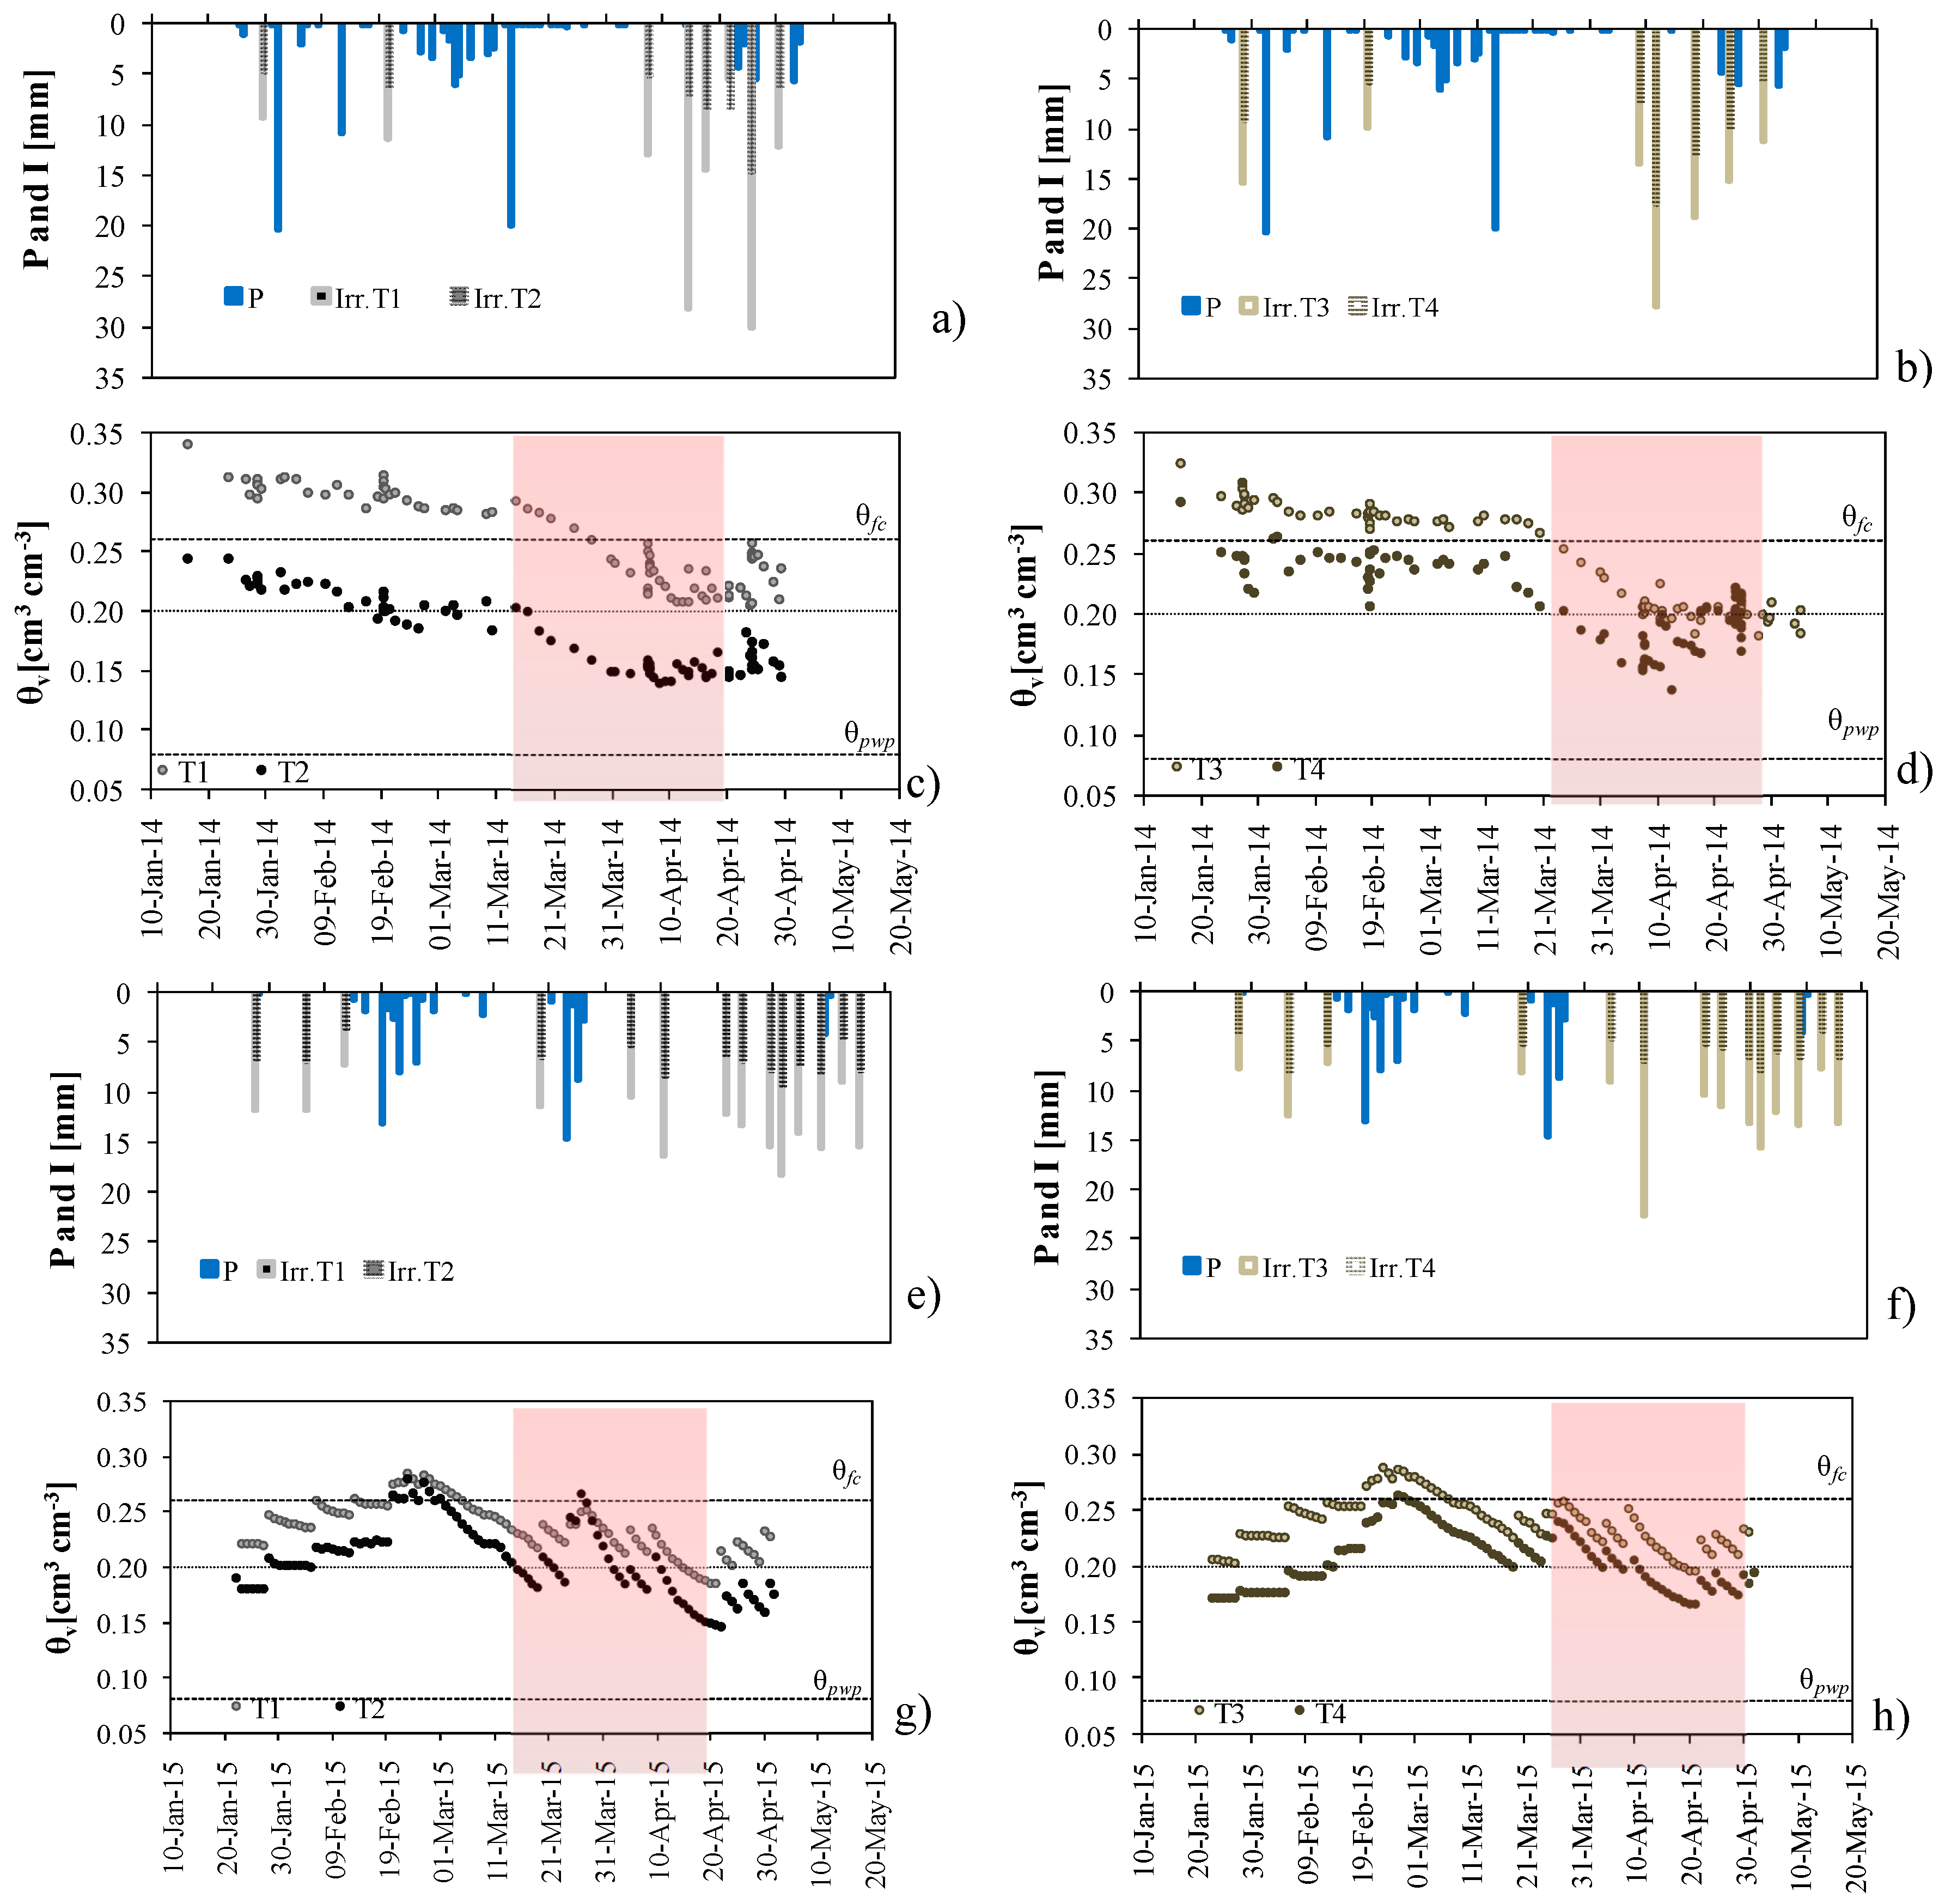
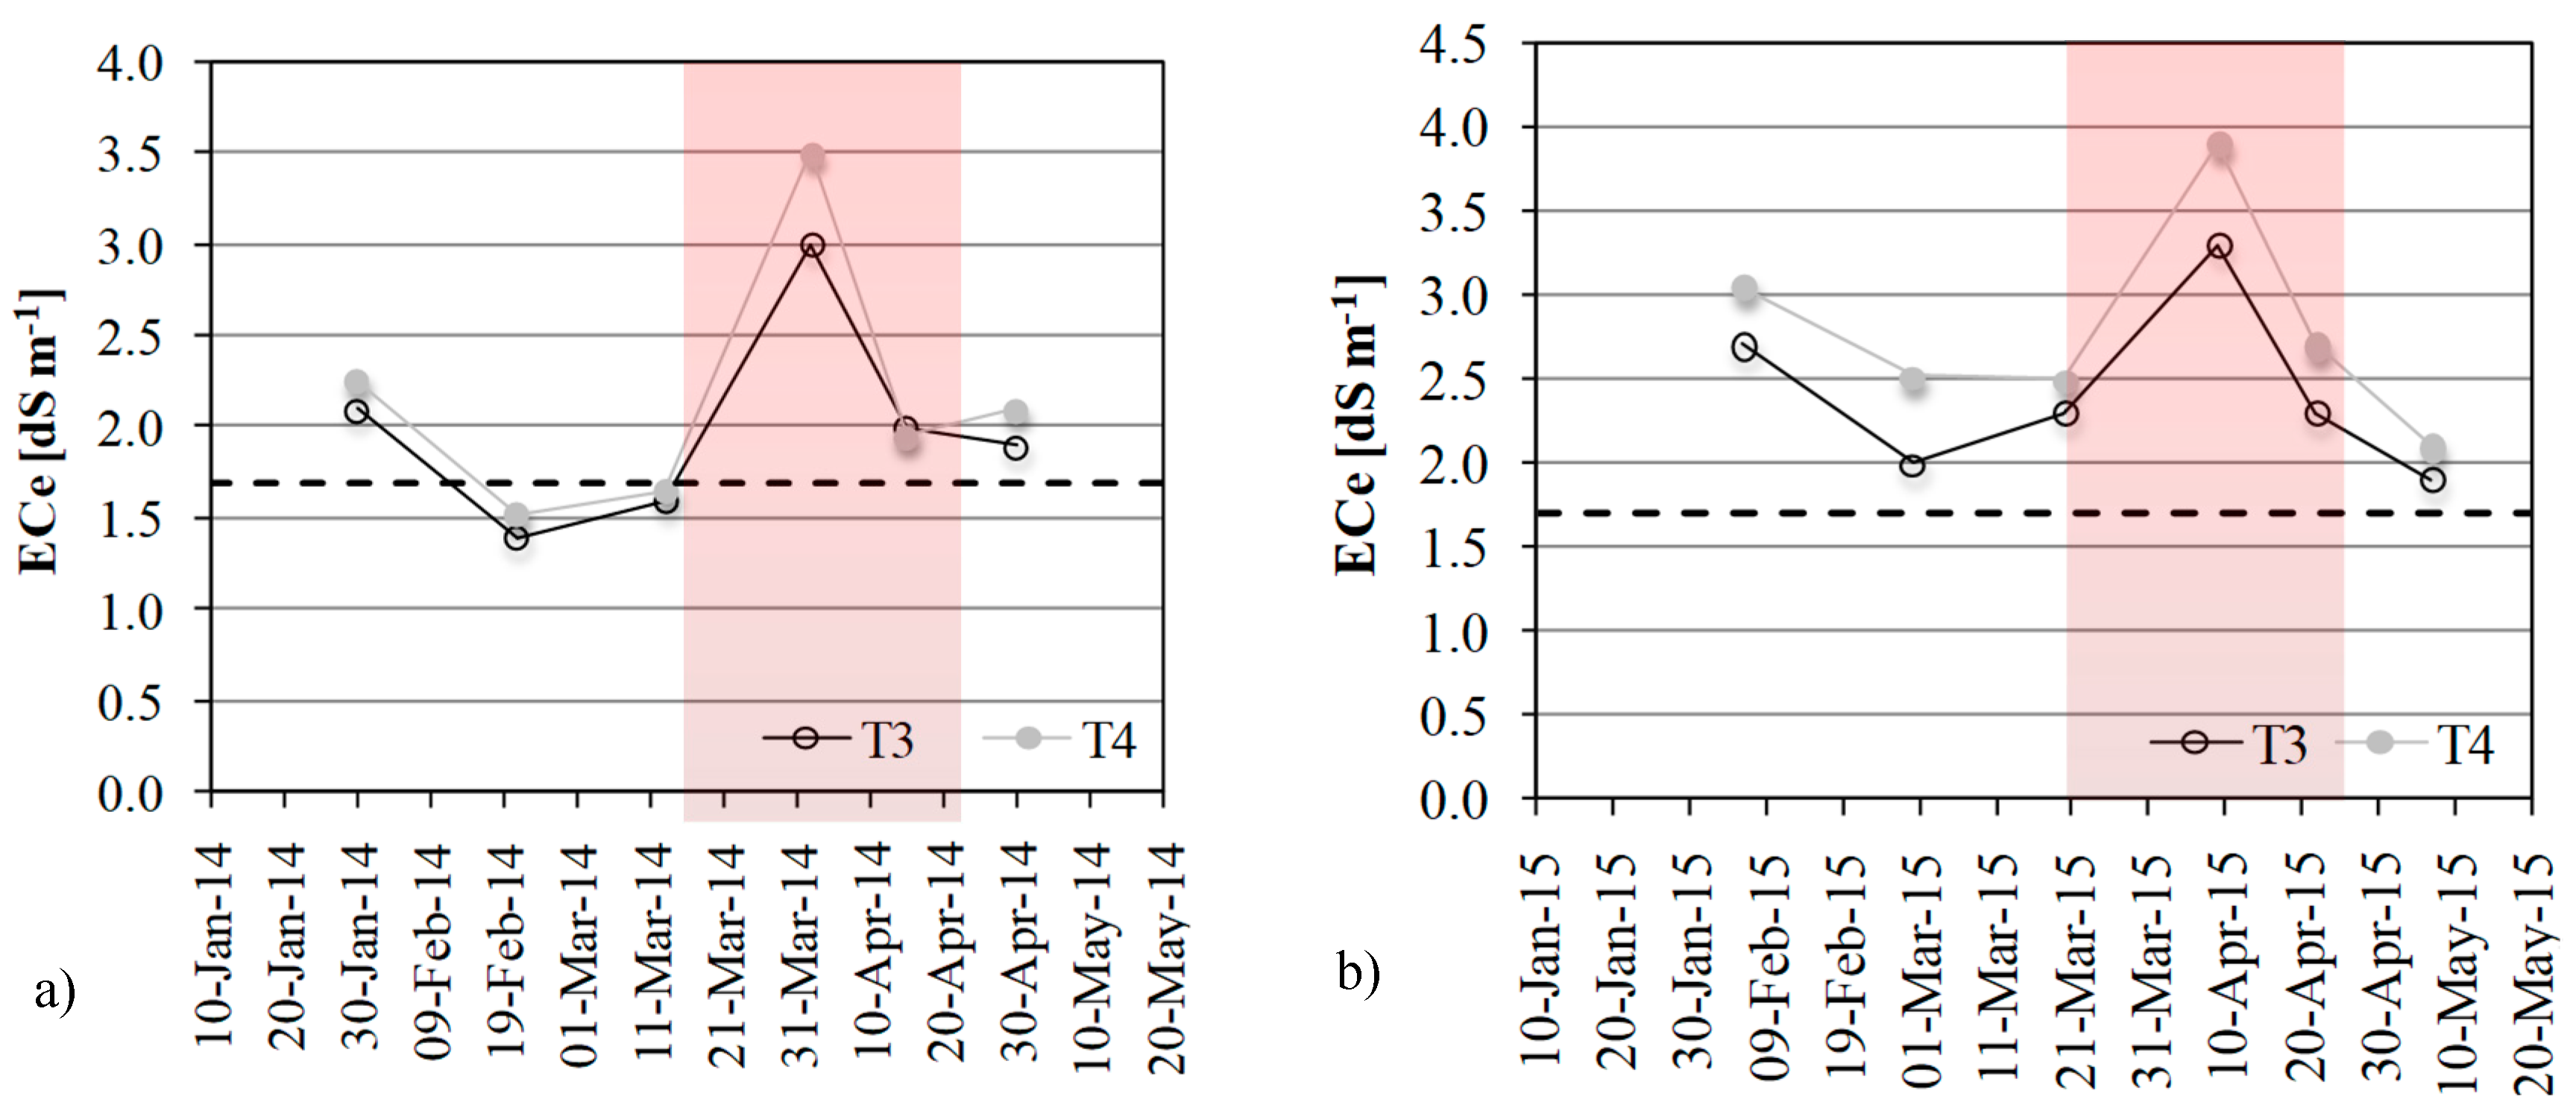
3.3.1. Soil Water Status and Soil Electrical Conductivity

Figure 5a,b shows the temporal patterns of rainfall and irrigation registered in 2014 in treatments T1–T2 and T3–T4 respectively, whereas Figure 5c,d indicates the patterns of average soil water content during the season. The period of full development stage, as well as soil water contents at field capacity, θfc, and at permanent wilting point, θwp, are also indicated.
Similar graphs are presented for the season 2015 (Figure 5e,h). As expected, when comparing treatments receiving different irrigation depths but similar water quality (T1–T2, T3–T4), soil water content in the root zone resulted higher in treatments T1 and T3 than in T2 and T4 respectively, as a consequence of the greater irrigation volumes and the limited variability of soil hydraulic characteristics (Table 2).
Figure 6a,b shows the values of average soil electrical conductivity of the saturated extract measured at different dates on growth seasons 2014 and 2015, as well as the threshold of ECe = 1.7 dS m−1, as proposed by Maas and Hoffman [32], according to which reductions of crop yield due to the soil salinity are generally observed.

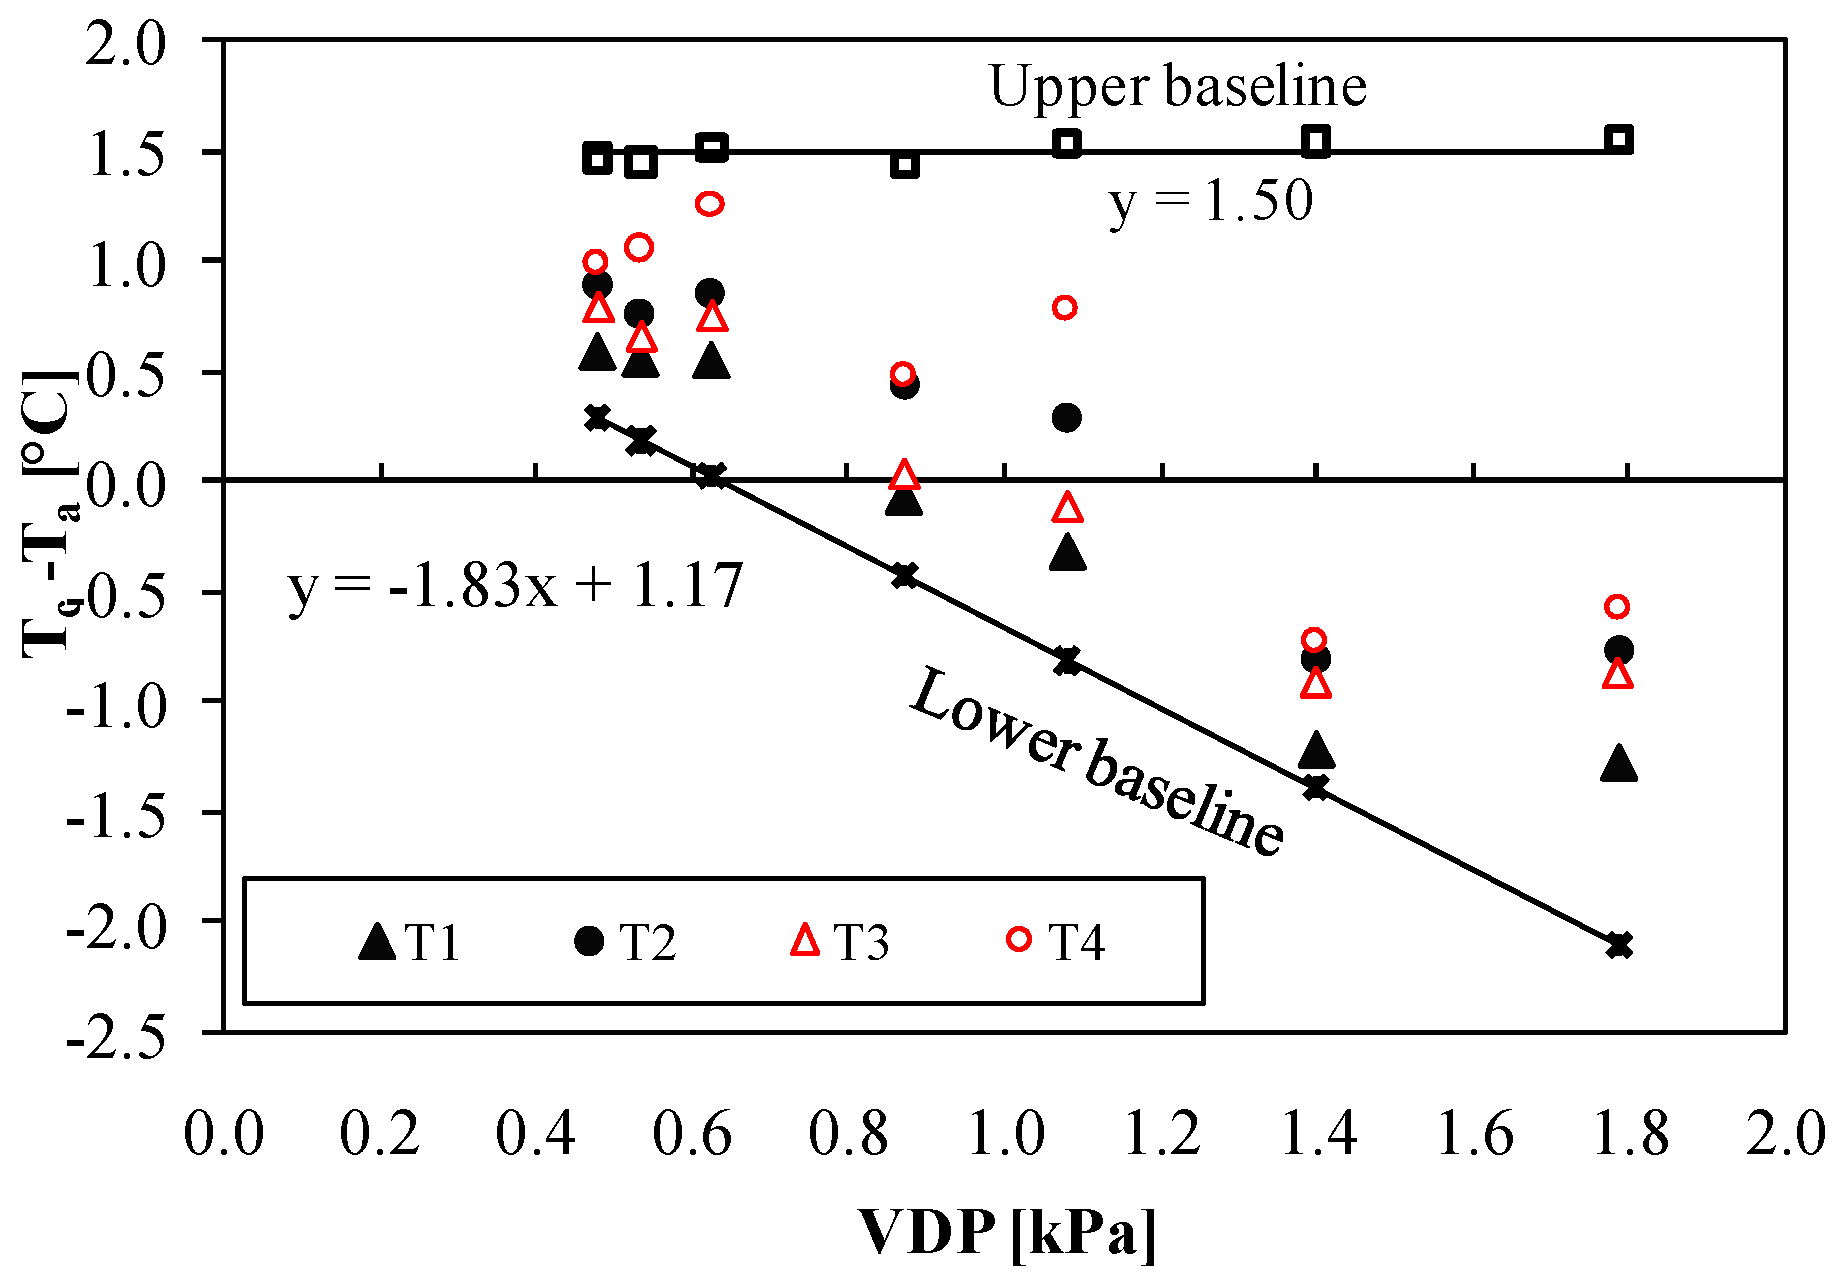
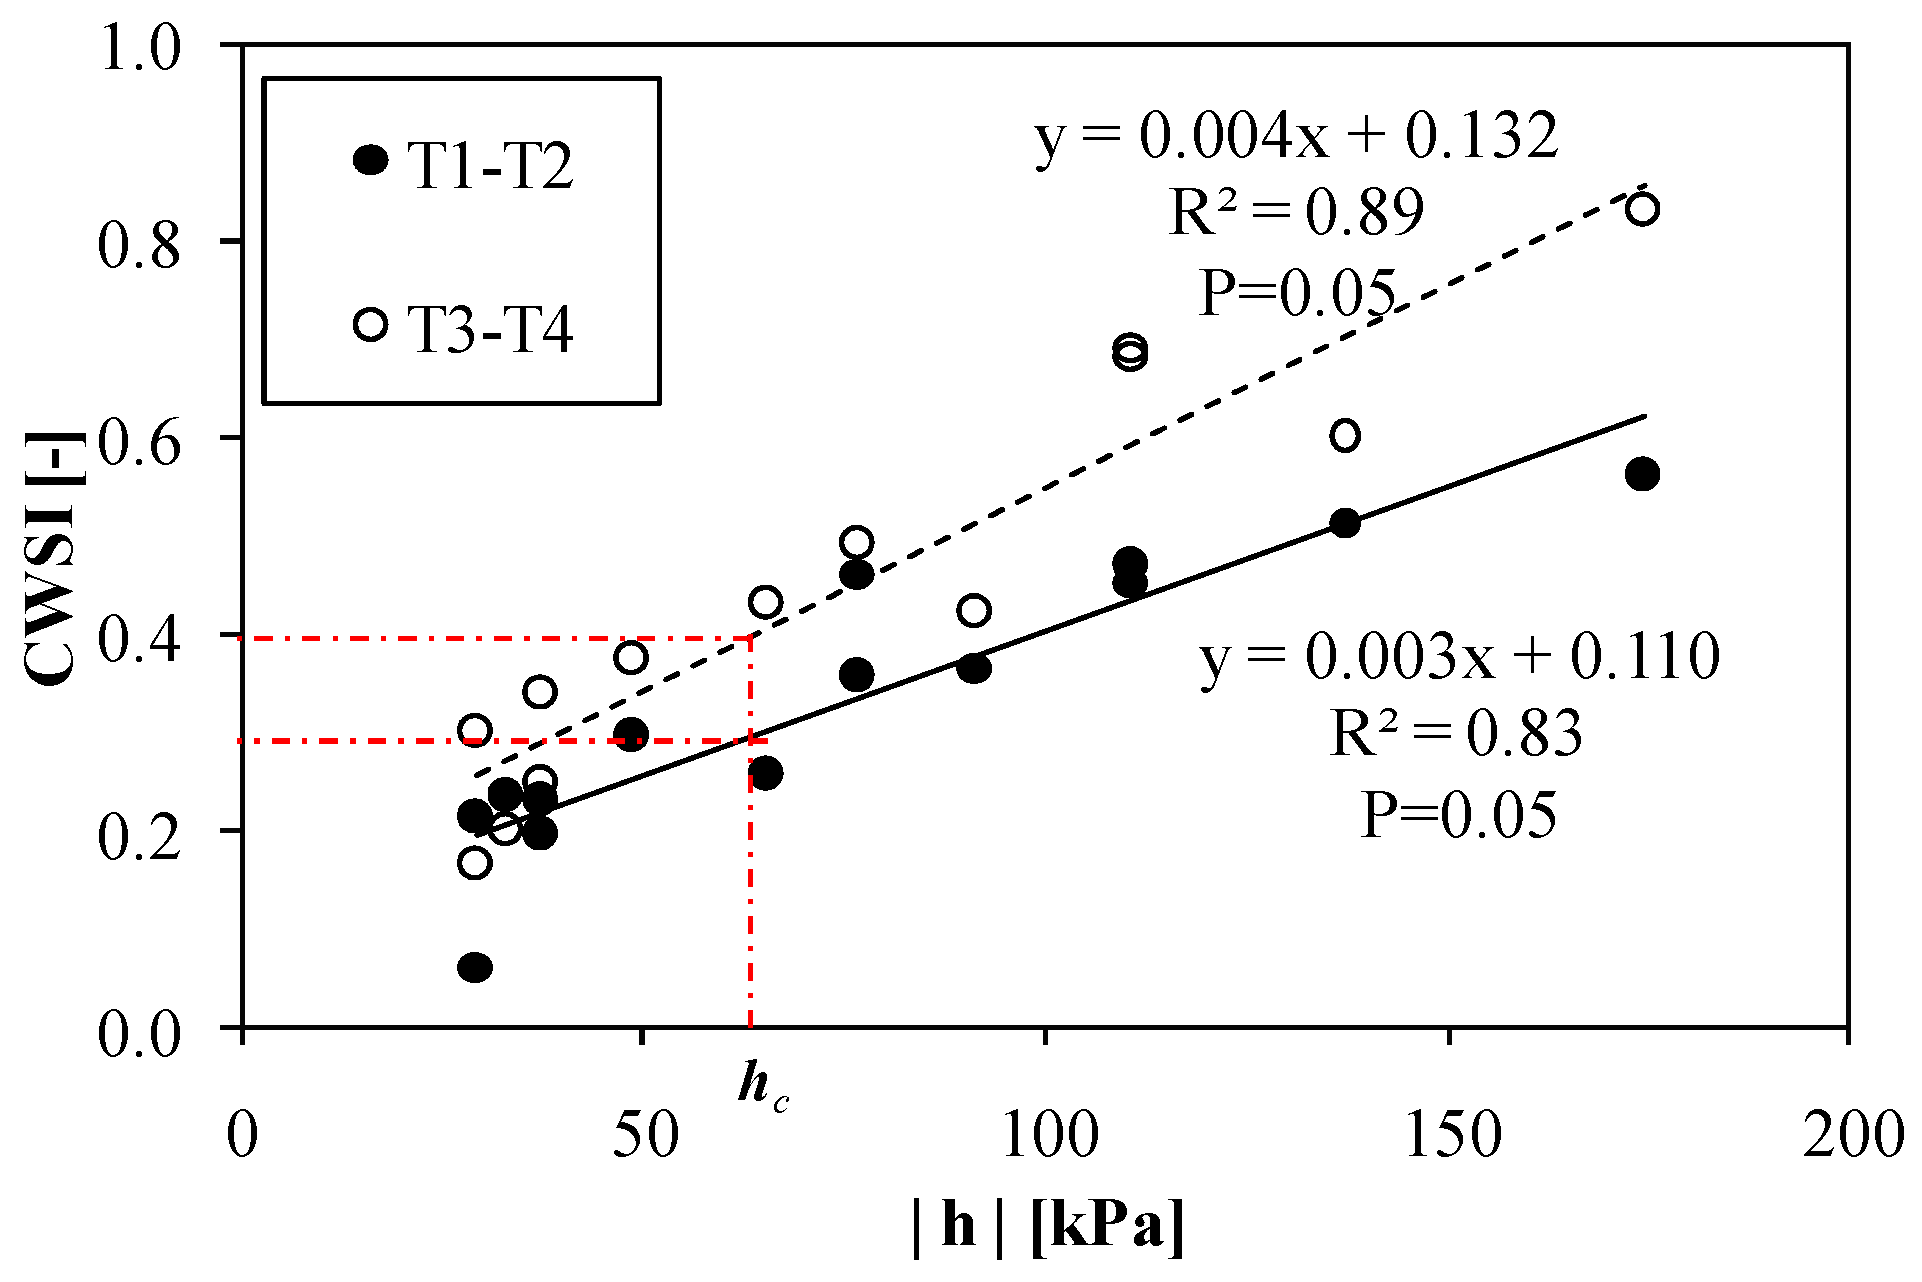
3.3.2. Analysis of Thermal Data and Patterns of Crop Water Status

In 2015, thermal measurements were acquired in the field to identify, in the different treatments, the patterns of crop water status based on the Crop Water Stress Index (CWSI). Evaluation of such an index required to estimate the differences between canopy and air temperature under well-watered and stressed conditions as a function of vapor pressure deficit, VPD, in order to construct the empirical upper and lower baseline.
Figure 7 shows the differences between canopy and air temperature as a function of vapor pressure deficit (VPD) measured during the growth season 2015, as well as the upper and lower baselines obtained by following the procedure proposed by Idso et al. (1981), with the related equations used to estimate the CWSI. Figure 8 illustrates the values of CWSI [–] as a function of soil matric potential, h [kPa], as well as the corresponding regression lines obtained by separating the treatments characterized by different water quality.

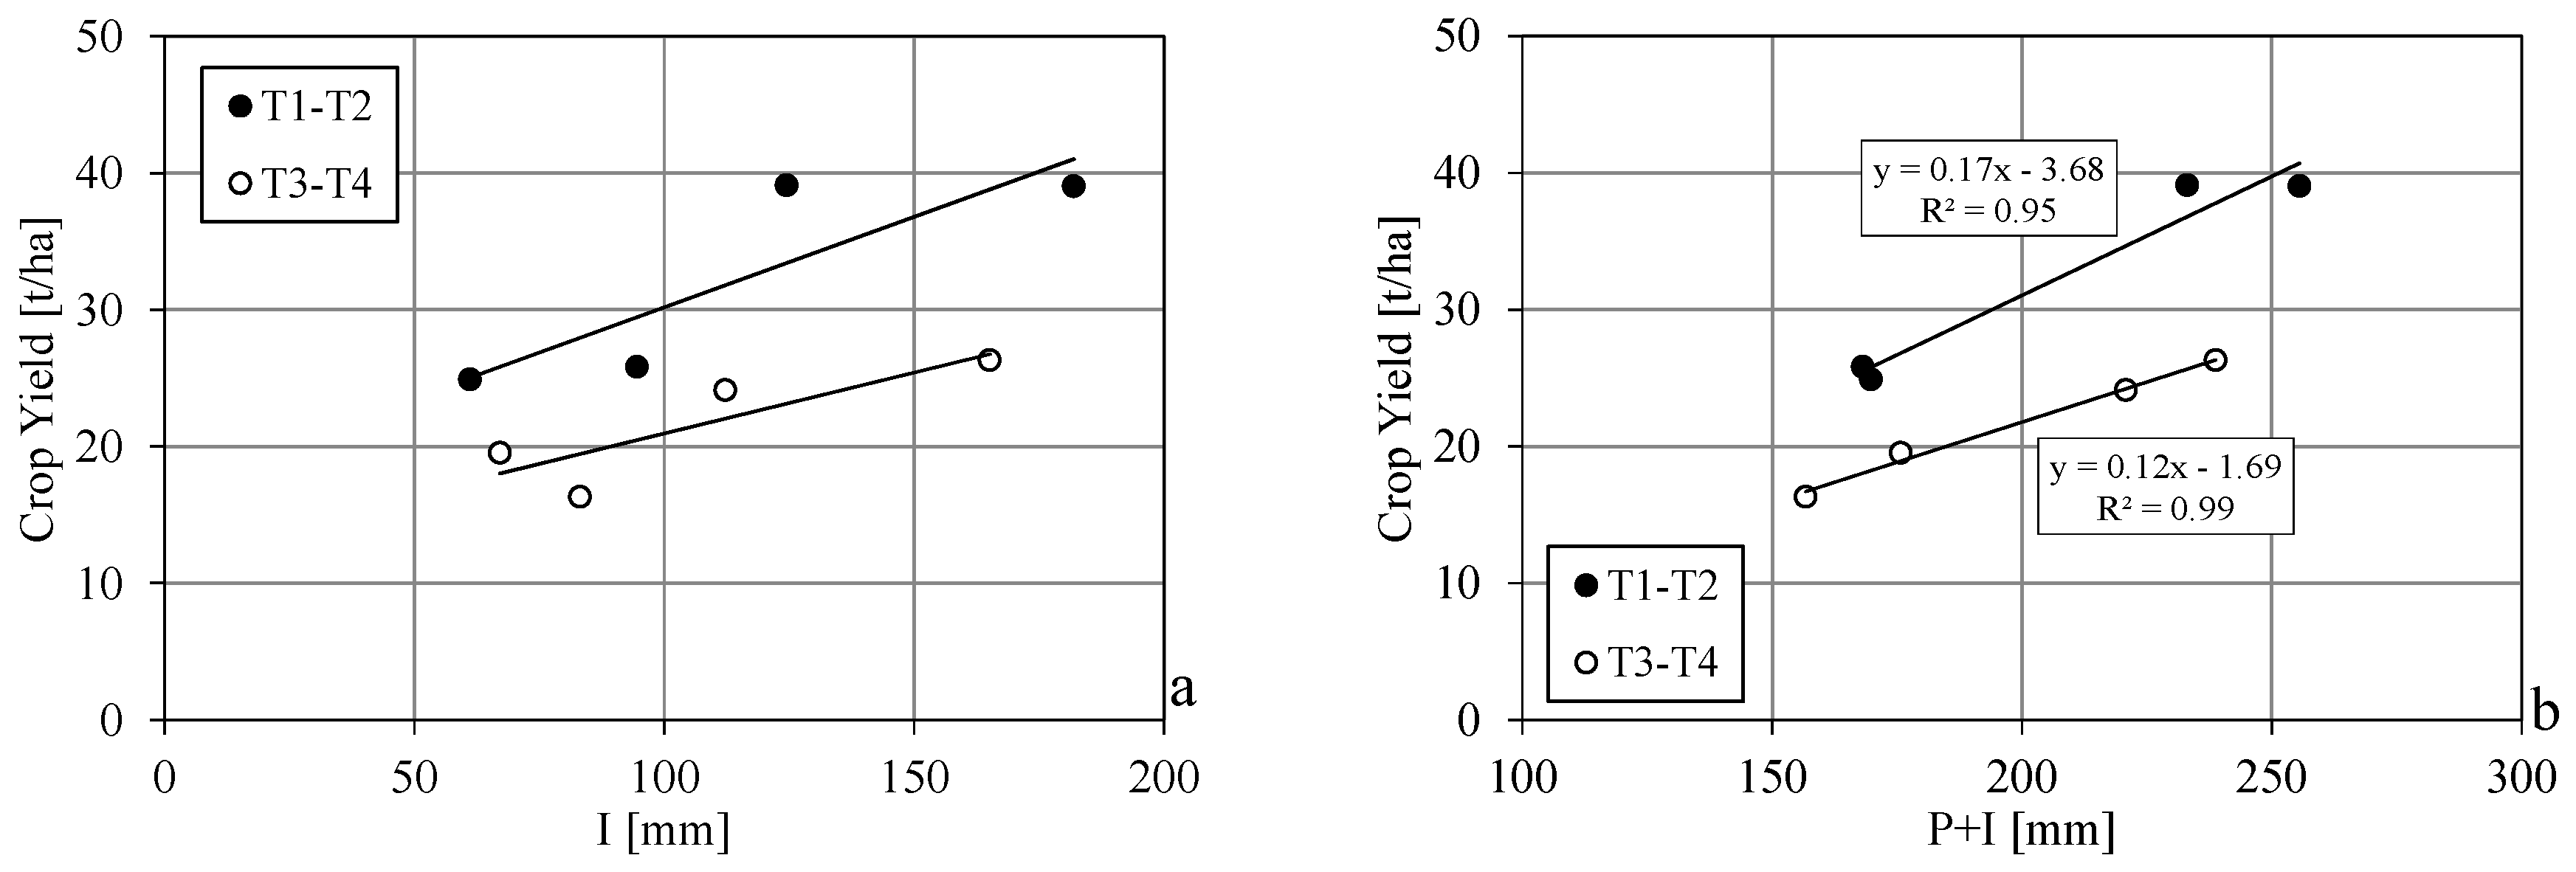
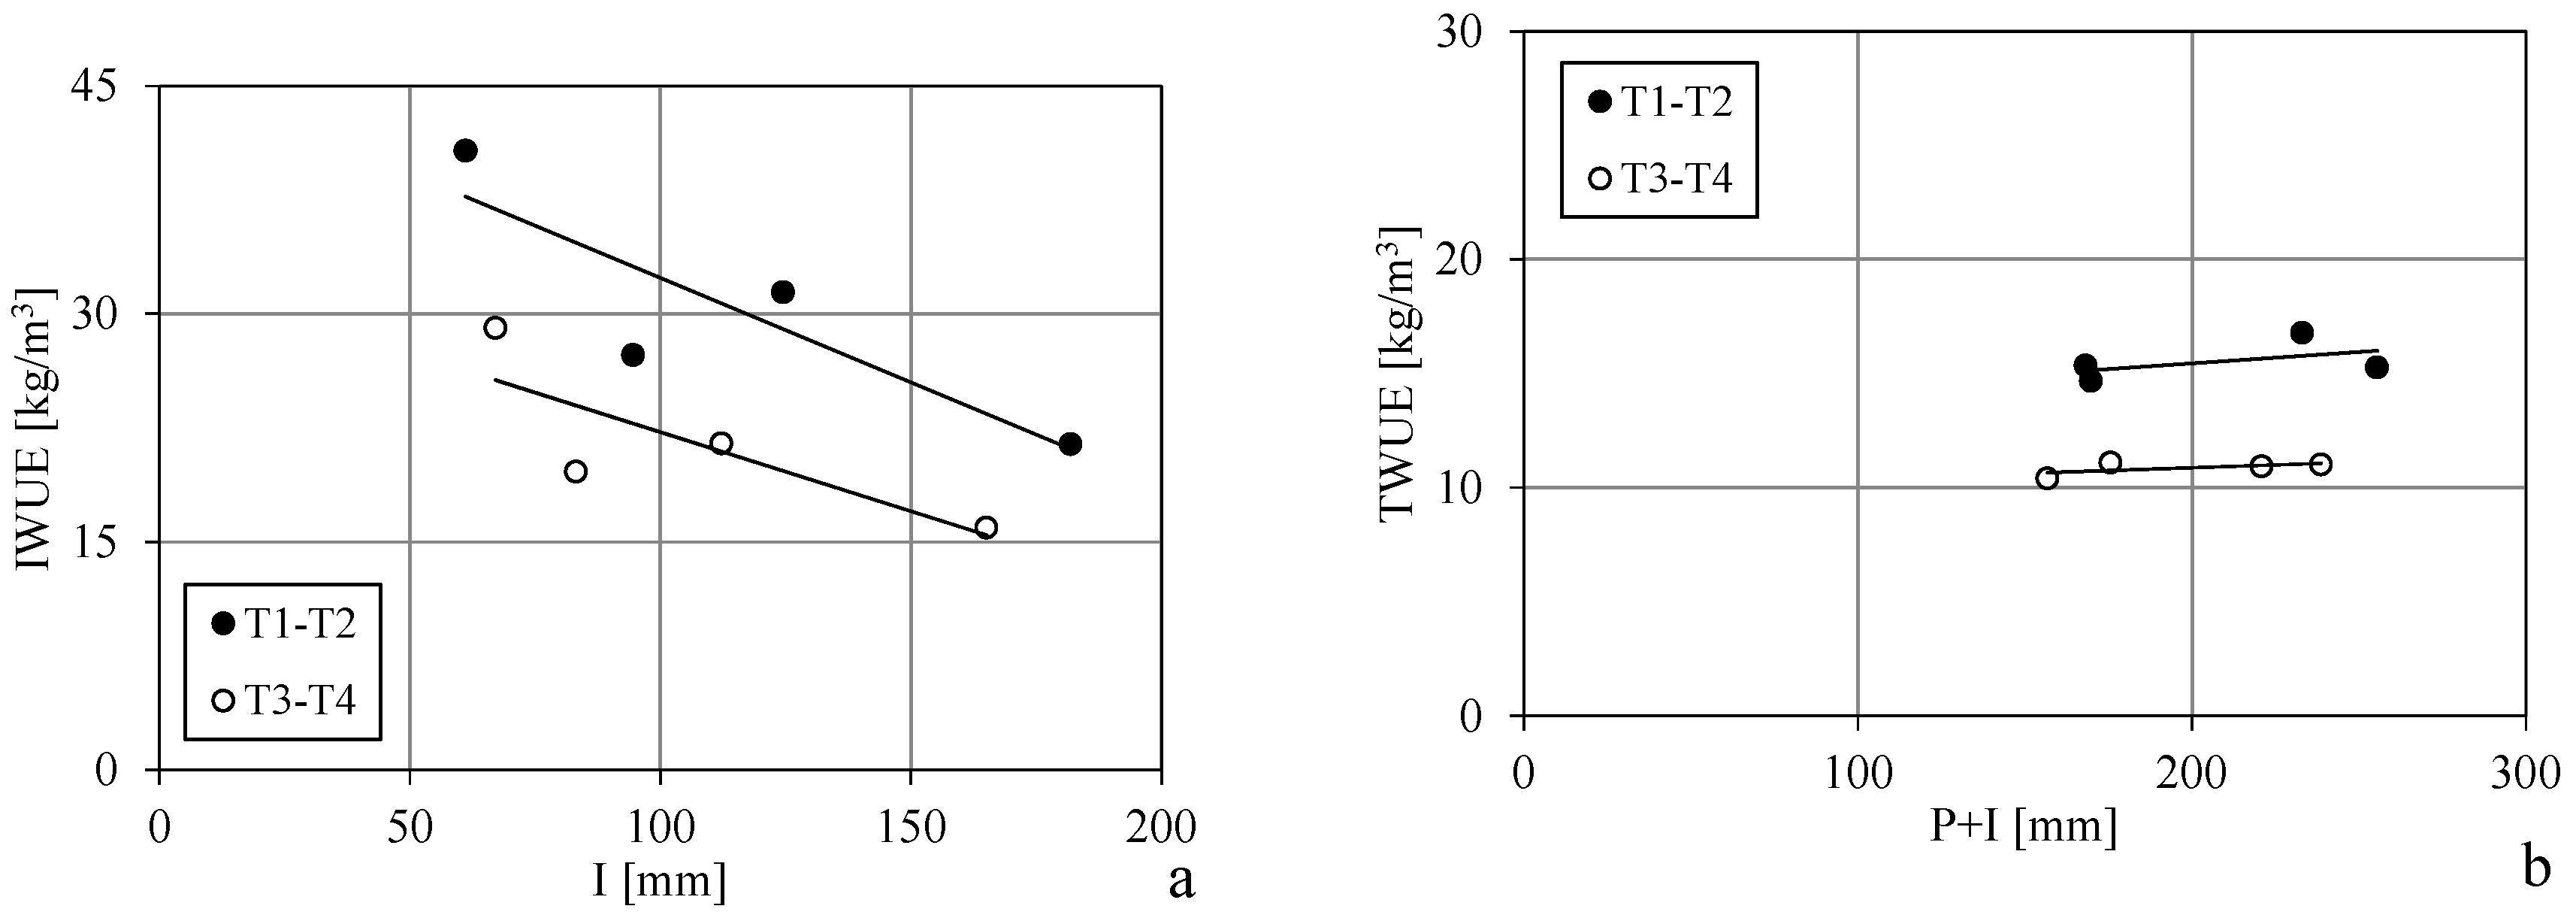
3.4. Crop Yield Response to Irrigation Management and Water Quality

In order to assess the distinct or combined effects of the examined treatments on crop yield and water use efficiency, the values of two efficiency indices (IWUE and TWUE) were evaluated as summarized in Table 2 in which, the total amount of irrigation and precipitation are also shown.
As can be easily verified, potato crop yield varied in the four treatments, from a maximum of 39.1 ± 8.3 t/ha, in treatment T1 in which soil matric potentials was always higher than or equal to 65.6 kPa and CWSI equal to 0.3 to a minimum of 16.3 ± 2.4 t/ha in treatment T4 in which soil matric potential reached the value of 174.5 kPa and CWSI equal to 0.8. The high variability on crop yield observed within the treatments were associated to the variability of emitters’ flow rate mainly due to possible clogging phenomena, rather than their quality or deficiency in field distribution uniformity [33,34]. When considering the effects of water stress on crop yield, by comparing treatments T1 and T2, as well as treatments T3 and T4 during the growth seasons 2014 and 2015, it is possible to notice that in both years the average yields in treatments T1 and T3 were higher than in T2 and T4. However, from a statistical point of view, the differences in crop yield were significant only between T1 and the other treatments (P < 0.05) and not between T2, T3 and T4. The latter result is due to the high yield variability of crop yield generally observed in both years.
When separating the treatments in terms of water quality, Figure 9a,b illustrates potato crop yield as a function of the seasonal irrigation depth (I) as well as the total amount of water applied, (P+I) for treatments T1 + T4. When analyzing the water use efficiency, Figure 10a,b shows the values of IWUE and TWUE as a function of irrigation depth, I and total amount of applied water, P + I.

4. Discussion and Conclusions

When water saving strategies are advocated to increase water use efficiency, it is crucial to control specific indicators related to soil and plant water status and to know how these indicators are associated with the functions governing the soil plant atmosphere continuum (soil water retentivity and conductivity functions, root distribution, root water uptake). Monitoring soil and/or plant water status allows the accurate evaluation of irrigation timing and doses according to specific objectives in terms of quality and quantity of the productions and to prevent severe stress conditions that could cause irreversible effects on plant growth and on productions. However, under localized irrigation, the gradients of soil water content and active roots are quite high, and therefore in order to monitor soil water status it is necessary to identify where to place the sensors in order to detect values of soil water contents representative of the whole root zone. Moreover, the presence of potato tubers in the soil can affect the speed wave of the signals generated by the TDR sensors. In addition, when irrigating with saline water, the plant may be subject to additional osmotic potential that could reduce the water availability. Monitoring crop water status overcomes the problems related to the gradients of soil water contents, salt concentration and root distribution, and also the problems associated with the presence of tubers; in fact, measurements of the crop are the result of the combined effects of atmospheric demand, soil water potential, rooting density and distribution as well as other crop features. During the two seasons investigated, cumulative rainfall totaled 108.6 mm in 2014 and 73.6 mm in 2015, when precipitation events occurred on a lower number of rainy days; on the other hand, the trends of reference evapotranspiration revealed that after a first phase, lasting about 40 days in which ET0 ranged between 1.0 and 2.0 mm d−1, the values of ET0 in 2015 resulted sensibly higher than in 2014 as a consequence of the generally higher daily temperature, solar radiation and wind speed (Figure 1). According to the temporal dynamic of ET0, Tmax tended to increase during the crop development stage, to stabilize around a value of about 2.8 mm d−1 in 2014 and 3.2 mm d−1 in 2015 (Figure 2). At the end of the seasons, Tmax declined as a consequence of the reductions of Kcb values.
When examining the data of maximum rooting depth, it was observed that Zmax increased during the whole growth season up to values of about 50 cm (Figure 4). Similar results were presented by Boone et al. [35] in a young alluvial loamy sandy soil; these authors observed that the growing rate of Zmax is not constant during all the phenological stages, but increased more rapidly during the vegetative stage than in the full development stage. Even if the observed differences of Zmax between treatments receiving different irrigation doses (T1–T2) and between (T3–T4) were in general statistically not significant, it can be noticed that lower irrigation volumes correspond to slightly longer roots, which extend into deeper soil layers. In fact, Zmax resulted in both years generally higher in T2 compared to T1, as well as in T4 compared to T3. Moreover, despite the different climatic conditions over the two years (Figure 1), similar rooting depths between treatments were identified. This result can be attributed to the dripline installation depth, which represents the most determinant factor on root development, more than the climatic variables. Drip installation depth affects the wetted soil volumes in which roots can develop. In this direction, Patel and Rajput [36], after testing five different drip lateral installation depths, demonstrated that in light soils, keeping drip laterals within the root zone and sufficiently below the soil surface allows effective replenishment of the root zone due to gravity flow and simultaneous reduction of evaporation losses due to minor upward capillary flow. However, when examining the effects of water quality (T1–T3 and T2–T4) on rooting depth, it was verified that differences in Zmax, according to the Student’s t-test, was not significant (P < 0.05). This outcome is in agreement with the results of Maas and Hoffman [32], who found that rooting depth is not sensitive to salinity.
When analyzing the patterns of rainfall, soil water contents and irrigation distribution in both years (Figure 5a–h), it can be remarked that rainfall events occurred only during the first period of the crop cycle, till roughly 11 March in 2014 (Figure 5a,b), and 21 March 2015 (Figure 5e,f). The occurrence of precipitation allowed keeping the soil water contents close to field capacity, especially in 2014 when precipitation events were higher in volume and number. However, after mid-March of both years, atmospheric water demand increased (Figure 1) and the amount of rainfall decreased. This last period corresponded to the full development stage (Figure 2), during which tuber formation and bulking occurred, and it was therefore necessary to shorten the period between consecutive watering. Moreover, the greater irrigation doses supplied in treatments T1 and T3, compared to T2 and T4, corresponded to the constantly higher soil water contents in the root zone. Values of soil water content resulted always higher than about 0.20 cm3 21 cm−3, to which correspond a matric potential of 65.6 kPa (Figure 3) and a water depletion of about 33% of total available water, TAW, with the exception of a very short period in 2015, around the end of crop development stage. According to FAO-56 Manual (Allen et al., 1998), for a potato crop readily available water (RAW) should varied between 40 and 60% of total available water. This circumstance showed that during the whole crop cycle, treatments T1 and T3 were, in general, not subjected to water deficit conditions, so that the adverse effects on crop yield observed in T3 only depended on the water electrical conductivity. On the contrary, during both seasons soil water contents in treatments T2 and T4 were lower than 0.20 cm3 cm−3 for long periods, reaching the minimum of about 0.15 cm3 cm−3 (corresponding to a matric potential of 175.5 kPa) at the end of the full development stage. In the latter two treatments, therefore, based on the temporal dynamic of soil water contents or matric potentials, as well as on water quality, the crop was subjected to a certain level of water and/or salinity stress mainly during the full development stage. However, due to the generally high variability of crop yield observed in both the treatments, differences of crop yield were not statistically significant (P < 0.05). Experiments carried out by Shock et al. [8] aimed to investigate potato crop response to deficit irrigation, showed that deficit conditions may cause drastic reduction of total yield and affects the quality of production, even if occurring for very short periods. These authors also underlined that the effects of water stress also depend on the growth stages in which they occur, being tuber initiation and bulking stages more sensitive than plant initiation, early crop development and harvesting stages. On the other hand, Iqbal et al. [37] found that the timing and the duration of water stress affect crop yield. Conditions of water stress during the growth development stage are responsible for greater yield reductions than those occurring during the tuber formation phase. Hence, according to these authors, the crop is more sensitive to water deficit in the early development stage compared to tuber formation and flowering. Moreover, for both years, soil electrical conductivity of treatments T3 and T4 drastically increased when the crop was at full development stage, with higher values in 2015 than in 2014, as a result of antecedent rainfall events, which could have shifted the salts outside the soil volume occupied by roots. Moreover, soil electrical conductivity values in treatment T4 were generally higher than the corresponding observed in T3. The higher soil salinity can be attributed to the lower soil water contents observed. In line with this result, Schoups et al. [38] reported that when applying deficit irrigation, there is the risk to increase soil salinity due to the reduced leaching. The differences between treatments in terms of ECe, observed during the full development stage, may be responsible of the observed differences in crop yield. Heuer and Nadler [39] in fact, showed that the full development is the most sensible stage for soil salinity, because in this phase tuber initiation and building occur. According to the threshold value of salt tolerance defined by Maas and Hoffman [32], treatments T3 and T4 in 2014 and 2015 were subjected to salt stress, even if in different periods of vegetative growth. Considering that soil salinity on saturated extract (ECe) is always lower than the salinity of circulating soil solution (ECw) (moisture content of the saturated soil paste is usually two-to-four times greater than that in the field as stated by Smedema and Rycroft [40]), under the examined field conditions the crop could have been subjected to high levels of saline stress. Therefore, when using saline waters to irrigate short-cycle crops like the potato, it is better to anticipate the sowing time, to take advantage of the beneficial effect of winter rainfall in terms of reduction of soil salinity. Moreover, when using saline water for irrigation, irrigation doses must fully replenish the crop’s water requirement to avoid water deficit conditions, as well as to ensure salt leaching.
When analyzing the differences between canopy and air temperature, Tc-Ta, as a function of vapor pressure deficit (VPD), it was observed that in treatment T1, at any fixed VPD, the value of (Tc-Ta) were slightly higher than that of the lower baseline, whereas for treatment T4 were slightly lower than that corresponding to the upper baseline; this result indicates that T4 was subject to the highest stress level, due to the combination of water and saline stress, being T2 and T3 at intermediate levels. Erdem et al. [41], based on experiments carried out a semiarid region of Turkey on potato crop maintained in the absence of water stress, found two different lower baselines for furrow and drip irrigation systems, respectively characterized by intercept and slope equal to −0.068 and −1.24 (furrow) and to 1.75 and −1.84 (drip). Despite the slope of the lower baseline for drip irrigation resulted similar to that found in Tunisia for subsurface drip irrigation, the different intercept could be consequent to the diverse climate conditions characterizing the investigated environments. In fact, according to Idso et al. [17], the lower baseline may differ based on the agro-climatic zone where the crop is grown. With reference to the upper baseline Erdem et al. [41], on an additional non-irrigated plot in Turkey, found differences between canopy and air temperatures ranging between −0.30 to 0.63 °C. However, these rather lower differences compared to those theoretically obtained in Tunisia, are probably due to the higher range of VPD investigated. Crop water stress index was then evaluated based on Idso et al. [29], by considering the upper and lower baselines. The higher the absolute value of soil matric potentials, the higher the CWSI, as a result of the growing stress level achieved by the plant (Figure 8). For a fixed soil matric potential, the value of CWSI associated to treatments T3 and T4 (dotted line) was greater than the corresponding in T1 and T2 (continuous line). Moreover, the increasing differences between CWSIs with soil matric potentials are a consequence of the increasing concentration of salt in the soil solution that, as the soil dries, further limits the plant access to soil water. This result suggests that CWSI based on thermal imaging should be considered a more effective water stress indicator than the soil matric potential, especially when saline water is used for irrigation; this indicator, in fact, allows accounting for both water and saline stress. In the same direction, Autovino et al. [25] found for olive trees that monitoring transpiration fluxes with sap flow sensors provides correct measurements of root water uptake, avoiding the problems related to the active root characterization and gradient of water in the soil. Therefore, the critical threshold value of soil matric potential, hc, previously suggested as 65.6 kPa (corresponding to RAW = 60% TAW), could be assumed to define irrigation timing only under application of good quality water. In particular, for a hc = 65.6 kPa, CWSI was equal to 0.3 under the application of good quality water and equal to 0.4 when saline water is used. When using saline water, the threshold of soil matric potential should be reduced to 43.7 kPa (matric potential corresponding to CWSI equal to 0.3), and consequently soil water contents should be maintained at values of about 0.22 cm3 cm−3, slightly higher than those corresponding to the application of good quality water (0.20 cm3 cm−3), to minimize the crop water stress and the possible deleterious effects on crop yield. Moreover, for treatments T2 and T4 the matric potential values of 174.5 kPa observed at the end of full development stage, corresponded to a CWSI equal to 0.55 and 0.82, respectively. Feng-Xin et al. [42], examined the effects of five soil matric potentials (15 kPa, 25 kPa, 35 kPa, 45 kPa and 55 kPa) on potato crop under drip irrigation conditions in the North China Plain. Authors found that a soil matric potential of 25 kPa was the most favorable for potato production, while 15 kPa was too high and 45 kPa led to severe water stress. The lower threshold suggested by Feng-Xin et al. [42] could be attributed to the irrigation system used for the experiment, which was placed on the soil surface. In fact, according to Ghazouani et al. [22], subsurface drip irrigation, SDI, presents better performance, compared to drip irrigation, DI, due to the minor evaporation losses from the soil surface and the consequently higher irrigation water use efficiency. Moreover, when the drip laterals are buried, the soil wetted bulbs increase the concentration of roots in the soil volume around the emitter.
When examining crop yield as a function of the seasonal volume (Figure 9a,b), it was evident that for a fixed water quality, crop yield was affected either by the irrigation amount (I), as well as by the total amount of water supplied (P + I). In particular, during the investigated seasons, crop yield decline resulted equal to 17.0 t/ha and 12.0 t/ha per each 100 mm decrease of applied water, respectively in treatments T1 and T2, and in treatments T3 and T4. Even Shock et al. [8], in Eastern Oregon, found that total tuber yield decreases significantly under deficit irrigation and, based on an economic analysis, suggested that deficit irrigation cannot be considered a viable management option for potato crop production. Moreover, reductions of crop yield in T3 and T4 were consequent of the combined effects of salt and water stress. As discussed in fact, the soil electrical conductivity above the threshold value of salt tolerance of 1.7 dS m−1 since the beginning of the full development stage, was responsible for the saline stress conditions and the associated yield reductions. For any fixed amount of water applied during the growth season (P + I), important relative yield reductions, quantified at about 26% of the corresponding maximum achievable, were associated with the lower water quality. Moreover, the results achieved showed that increasing the water electrical conductivity of 1.0 dS m−1 determined a yield decline rate of about 10%.
On the one hand, for any fixed seasonal volume, the values of IWUE tend to decrease when the seasonal irrigation depth decreases and lower IWUEs are associated with those treatments irrigated with worse quality water (Figure 10a). On the other hand, when considering the TWUE, the corresponding values are independent of the seasonal volumes of water applied and only depends on the quality of irrigation water (Figure 10b). TWUE values resulted, on average, equal to 15.5 kg m−3 and 10.9 kg m−3 for water electrical conductivity of 1.6 dS m−1 and 4.2 dS m−1, respectively. This outcome is consequent of the compensatory effect exerted by irrigation; yield rise is proportional to the amount of applied water, so that the TWUE remains constant, being the values only depending on the quality of irrigation water. El Mokh et al. [43], based on experiments carried out in southern Tunisia, found that higher IWUE values are associated to deficit irrigation, even if the high efficiencies connected to the water restricted regimes are counterbalanced by reduced yield and quality. However, if from one side limiting irrigation depth determines a certain increase of IWUE, from the other side produces a reduction of crop yield, with unavoidable effects on the farmer’s gross revenues. For this reason, in order to identify irrigation scheduling strategies, it is necessary to monitor the climatic variables, but also to make economic analysis aimed to compare the costs associated to irrigation and the benefits corresponding to the higher productions. In line with El Mock et al. [43], full irrigation strategies could be recommended for irrigation of potato crops under the semi-arid climate of Tunisia, even if the possibility to reduce water supply can be envisaged when water availability is limited, but with the awareness to accept the consequent reduction in production. Finally, when saline waters are the only source available to the farm, it is necessary to avoid the adoption of strategies involving the application of water deficit, to prevent excessive salt accumulation in the root zone and unacceptable effects on crop yield.
Further investigation should be carried out with the aim to investigate the effects of the application of the suggested thresholds on crop yield components (caliber, starch and dry mass).

Author Contributions

Contributions to the paper by different authors are: H.G., A.M. and B.L. collected the experimental data. H.G., G.R. and G.P. elaborated the data and wrote the paper. All the authors contributed to plan the experiments, to build the experimental setup and to revise the final version of the manuscript.

Funding

This research received no external funding from public and private, nor from commercial or not-for-profit sector.

Acknowledgments

The research activity was carried out in the frame of the co-tutel PhD of H.G., who was enrolled in the PhD course “Water-Soil-Environment” at the high Agronomic Institute of Chott Mariem, Sousse, Tunisia, and in the PhD course in “Scienze Agrarie, Forestali ed Ambientali—curriculum Idronomia Ambientale” at University of Palermo, Palermo, Italy.

Conflicts of Interest

The authors declare no conflict of interest.

References

  1. Bouksila, F. Sustainability of irrigated agriculture under salinity pressure—A study in semiarid Tunisia. Ph.D. Thesis, Lund University, Lund, Sweden, 2011. [Google Scholar]
  2. IPCC. Climate Change. Synthesis Report. Contribution of Working Groups I, II and III to the Fourth Assessment Report of the Intergovernmental Panel on Climate Change; Core Writing Team; Pachauri, R.K., Reisinger, A., Eds.; IPCC: Geneva, Switzerland, 2007; p. 104. [Google Scholar]
  3. Provenzano, G.; Rodriguez-Sinobas, L.; Roldán-Cañas, J. Irrigated agriculture: Water resources Managment for a sustainable environment. Biosyst. Eng. 2014, 128, 1–3. [Google Scholar] [CrossRef]
  4. Rodriguez-Sinobas, L.; Provenzano, G.; Roldán-Cañas, J. Special issue: Water Management strategies in irrigated areas. Agric. Water Manag. 2016, 170, 1–4. [Google Scholar] [CrossRef]
  5. Chehaibi, S.; Hamdi, W.; Abroug, K. Effects of planting depth on agronomic performance of two potato varieties grown in the Sahel region of Tunisia. J. Dev. Agric. Econ. 2013, 5, 272–276. [Google Scholar] [CrossRef]
  6. Mauromicale, G.; Ierna, A.; Licandro, P. Harvest time and yield of globe artichoke in relation to the production environment of plantlets. Acta Hortic. 2003, 681, 117–126. [Google Scholar] [CrossRef]
  7. Ierna, A.; Mauromicale, G. Tuber yield and irrigation water productivity in early potatoes as affected by irrigation regime. Agric. Water Manag. 2012, 155, 276–284. [Google Scholar] [CrossRef]
  8. Shock, C.C.; Feibert, E.B.G.; Saunders, L.D. Potato yield and quality response to deficit irrigation. Hortic. Sci. 1998, 33, 655–659. [Google Scholar]
  9. Alagna, V.; Iovino, M.; Bagarello, V.; Mataix-Solera, J.; Lichner, L. Alternative analysis of transient infiltration experiment to estimate soil water repellency. Hydrol. Proc. 2018, 33, 661–674. [Google Scholar] [CrossRef]
  10. Ghazouani, H.; Rallo, G.; Mguidiche, A.; Latrech, B.; Douh, B.; Boujelben, A.; Provenzano, G. Assessing Hydrus-2D model to investigate the effects of different on-farm irrigation strategies on potato crop under subsurface drip irrigation. Water 2019, 11, 540. [Google Scholar] [CrossRef]
  11. Mguidiche, A.; Provenzano, G.; Douh, B.; Khila, S.; Rallo, G.; Boujelben, A. Assessing Hydrus-2D to simulate soil water content (SWC) and salt accumulation under an SDI system: Application to a potato crop in a semi-arid area of central Tunisia. Irrig. Drain. 2015, 64, 263–274. [Google Scholar] [CrossRef]
  12. Chamba, D.; Zubelzu, S.; Juana, L. Energy, cost and uniformity in the design of drip irrigation systems. Biosyst. Eng. 2019, 178, 200–218. [Google Scholar] [CrossRef]
  13. Provenzano, G.; Di Dio, P.; Palau Salvador, G. New computational fluid dynamic procedure to estimate friction and local losses in coextruded drip laterals. J. Irrig. Drain. Eng. 2007, 133, 520–527. [Google Scholar] [CrossRef]
  14. Provenzano, G.; Alagna, V.; Autovino, D.; Juarez, J.M.; Rallo, G. Analysis of geometrical relationships and friction losses in small-diameter lay-flat polyethylene pipes. J. Irrig. Drain. Eng. 2016, 142, 04015041. [Google Scholar] [CrossRef]
  15. Rallo, G.; Agnese, C.; Minacapilli, M.; Provenzano, G. Comparison of SWAP and FAO agro-hydrological models to schedule irrigation of wine grape. J. Irrig. Drain. Eng. 2012, 138, 581–591. [Google Scholar] [CrossRef]
  16. Rallo, G.; Provenzano, G. Modelling eco-physiological response of table olive trees (Olea europaea L.) to soil water deficit conditions. Agric. Water Manag. 2013, 120, 79–88. [Google Scholar] [CrossRef] [Green Version]
  17. Idso, S.B.; Reginato, R.J.; Farah, S.M. Soil and atmosphere induced plant water stress as inferred from foliage temperatures. Water Res. Res. 1982, 18, 11–43. [Google Scholar] [CrossRef]
  18. Jackson, R.D. Canopy temperature and crop water stress. In Advances in Irrigation; Hillel, D.I., Ed.; Academic Press: Cambridge, MA, USA, 1982; Volume 1, pp. 43–85. [Google Scholar]
  19. Ghazouani, H.; Capodici, F.; Ciraolo, G.; Maltese, A.; Rallo, G.; Provenzano, G. Potential of thermal images and simulation models to assess water and salt stress: Application to potato crop in central Tunisia. Chem. Eng. Trans. 2017, 58, 709–714. [Google Scholar]
  20. Idso, S.B. Non-water-stressed baselines: A key to measuring and interpreting plant water stress. Agric. Meteorol. 1982, 27, 59–70. [Google Scholar] [CrossRef]
  21. Maher, M. Le climat agricole au Sahel Tunisien et les changements climatiques. Master’s Thesis, Mémoire, Université du Québec à Montréal, Montreal, QC, Canada, 2009. (In French). [Google Scholar]
  22. Allen, R.G.; Pereira, L.S.; Raes, D.; Smith, M. Crop Evapotranspiration: Guidelines for Computing Crop Water Requirements; FAO Irrigation and Drainage Paper 56; Food and Agriculture Organization of the United Nations: Rome, Italy, 1998. [Google Scholar]
  23. Ghazouani, H.; Autovino, D.; Rallo, G.; Douh, B.; Provenzano, G. Using Hydrus-2D model to assess the optimal drip lateral depth for Eggplant crop in a sandy loam soil of central Tunisia. Ital. J. Agrometeorol. 2016, 1, 47–57. [Google Scholar]
  24. Negm, A.; Capodici, F.; Ciraolo, G.; Maltese, A.; Provenzano, G.; Rallo, G. Assessing the performance of thermal inertia and Hydrus models to estimate surface soil water content. Appl. Sci. 2017, 7, 975. [Google Scholar] [CrossRef]
  25. Autovino, D.; Rallo, G.; Provenzano, G. Predicting soil and plant water status dynamic in olive orchards under different systems with Hydrus-2D: Model performance and scenario analysis. Agric. Water Manag. 2018, 203, 225–235. [Google Scholar] [CrossRef]
  26. Douh, B. Etude Théorique et Expérimentale de L’irrigation Goutte à Goutte Souterraine Sur une Culture de Mais (Zea mays L.). Ph.D. Thesis, Higher Agronomic Institute of Chott Meriem, Sousse, Tunisia, 2012. [Google Scholar]
  27. Provenzano, G.; Rallo, G.; Ghazouani, H. Assessing Field and Laboratory Calibration Protocols for the Diviner 2000 Probe in a Range of Soils with Different Textures. J. Irrig. Drain. Eng. 2015, 142. [Google Scholar] [CrossRef]
  28. U.S. Salinity Laboratory Staff. Diagnosis and Improvement of Saline and Alkali Soils; USDA, Handbook 60; U.S. Government Printing Office: Washington, DC, USA, 1954.
  29. Idso, S.B.; Jackson, R.D.; Pinter, P.J.; Reginato, R.J.; Hatfield, J.L. Normalizing the stress-degree-day parameter for environmental variability. Agric. Meteorol. 1981, 24, 45–55. [Google Scholar] [CrossRef]
  30. Van Genuchten, M.T. A closed-form equation for predicting the hydraulic conductivity of unsaturated soils. Soil Sci. Soc. Am. J. 1980, 44, 892–898. [Google Scholar] [CrossRef]
  31. Seki, K. SWRC fit—A nonlinear fitting program with a water retention curve for soils having unimodal and bimodal pore structure. Hydrol. Earth Syst. Sci. Discuss. 2007, 4, 407–437. [Google Scholar] [CrossRef]
  32. Maas, E.V.; Hoffman, G.J. Crop salt tolerance-current assessment. J. Irrig. Drain. Div. 1977, 103, 115–134. [Google Scholar]
  33. Rallo, G.; González-Altozano, P.; Manzano-Juárez, J.; Provenzano, G. Using field measurements and FAO-56 model to assess the eco-physiological response of citrus orchards under regulated deficit irrigation. Agric. Water Manag. 2017, 180, 136–147. [Google Scholar] [CrossRef]
  34. Martínez-Gimeno, M.A.; Bonet, L.; Provenzano, G.; Badal, E.; Intrigliolo, D.S.; Ballester, C. Assessment of yield and water productivity of clementine trees under surface and subsurface drip irrigation. Agric. Water Manag. 2018, 206, 209–216. [Google Scholar] [CrossRef]
  35. Boone, F.R.; Bouma, J.; de Smet, L.A.H. A case study on the effect of soil compaction on potato growth in a loamy sand soil. I. Physical measurements and rooting patterns. Neth. J. Agric. Sci. 1978, 26, 405–420. [Google Scholar]
  36. Patel, N.; Rajput, T.B.S. Effect of drip tape placement depth and irrigation level on yield of potato. Agric. Water Manag. 2007, 88, 209–223. [Google Scholar] [CrossRef]
  37. Iqbal, M.M.; Shah, S.M.; Mohammad, W.; Nawaz, H. Field response of potato subjected to water stress at different growth stages. In Crop Yield Response to Deficit Irrigation; Kirda, C., Moutonnet, P., Hera, C., Nielsen, D.R., Eds.; Kluwer Academic Publishers: Dordrecht, The Netherlands, 1999. [Google Scholar]
  38. Schoups, G.; Hopmans, J.W.; Young, C.A.; Vrugt, J.A.; Wallender, W.W.; Tanji, K.K.; Panday, S. Sustainability of irrigated agriculturein the San Joaquin Valley, California. Proc. Natl. Acad. Sci. USA 2005, 102, 15352–15356. [Google Scholar] [CrossRef]
  39. Heuer, B.; Nadler, A. Growth and development of potatoes under salinity and water deficit. Austr. J. Agric. Res. 1995, 46, 1477–1486. [Google Scholar] [CrossRef]
  40. Smedema, L.K.; Rycroft, D.W. Land Drainage: Planning and Design of Agricultural Drainage Systems; Batsford Academic and Educational Ltd.: London, UK, 1983; p. 384. [Google Scholar]
  41. Erdem, T.; Orta, H.; Erdem, Y.; Okursoy, H. Crop water stress index for potato under furrow and drip irrigation systems. Potato Res. 2005, 48, 49–58. [Google Scholar] [CrossRef]
  42. Wang, F.-X.; Kang, Y.; Liu, S.-P.; Hou, X.-Y. Effects of soil matric potential on potato growth under drip irrigation in the North China Plain. Agric. Water Manag. 2007, 88, 34–48. [Google Scholar] [CrossRef]
  43. El Mokh, F.; Nagaz, K.; Masmoudi, M.M.; Mechlia, N.B. Effects of surface and subsurface drip irrigation regimes with saline water on yield and water use efficiency of potato in arid conditions of Tunisia. J. Agric. Environ. Int. Dev. 2014, 108, 227–246. [Google Scholar]
Figure 1. (a,b)—Temporal patterns of daily reference evapotranspiration, ET0, and precipitation, P, during growth seasons 2014 (a) and 2015 (b).
Sustainability 11 02706 g001
Figure 2. Daily maximum crop transpiration, Tmax, and soil evaporation, Emax, during growth seasons 2014 (a) and 2015 (b). Basal crop coefficient, Kcb, and evaporation coefficient, Ke, are indicated in the secondary axes.
Sustainability 11 02706 g002
Figure 3. Experimental values of matric potential versus soil water content for the three soil layers investigated. The fitting curve, valid for all the layers (0–60 cm), is also shown.
Sustainability 11 02706 g003
Figure 4. Maximum rooting depth, Zmax, observed in 2014 (a) and 2015 (b).
Sustainability 11 02706 g004
Figure 5. Comparison between temporal variability of soil water content in the root zone for treatments receiving different irrigation depths for 2014 (c,d) and 2014 (g,h). Irrigation timing and rainfall events are also indicated in 2014 (a,b) and 2015 (e,f). The red box shows the period of the full development stage.
Sustainability 11 02706 g005
Figure 6. Temporal variability of average soil electrical conductivity, ECe, in 2014 (a) and 2015 (b). The threshold of ECe proposed by Maas and Hoffman (1977) for potatoes crop is also shown.
Sustainability 11 02706 g006
Figure 7. Difference between canopy and air temperature, (Ta–Tc), versus the vapor pressure deficit (VDP). Equations of upper and lower baselines under are also shown.
Sustainability 11 02706 g007
Figure 8. Values of CWSI vs soil matric potentials and regression lines obtained for treatments with different water quality. The critical threshold of soil matric potential, hc, is also indicated.
Sustainability 11 02706 g008
Figure 9. Potato crop yield as a function of seasonal irrigation depth (I) (a), and total amount of water applied (P+I) (b), for treatments irrigated with waters withdrawn from Nebhana reservoir (T1–T2) and from the well (T3–T4).
Sustainability 11 02706 g009
Figure 10. IWUE (a) and TWUE (b) versus the seasonal irrigation depth (I), for treatments irrigated with waters withdrawn from Nebhana reservoir (T1–T2) and from the well (T3–T4).
Sustainability 11 02706 g010
Table 1. Percentages of clay (Cl), silt (Si) sand (Sa), bulk density (ρb), saturated hydraulic conductivity (Ks) and van Genuchten parameters of the soil water retention curve (SWRC) for the three investigated layers and average values for the whole profile. Water content at field capacity, θfc, is also indicated.
DepthClSiSaρbKsθsθrαn
[cm][%][%][%][g cm−3][cm h−1][cm3cm−3][cm3cm−3][-][-]
0–2017.314.668.11.2711.000.410.080.011.83
20–4017.615.167.31.436.400.370.070.011.49
40–6017.914.366.91.473.800.400.080.011.69
0–6017.614.767.71.397.060.390.080.011.59
θs and θr are saturated and residual soil water content, α and n are fitting parameters.
Table 2. Values of seasonal precipitation (P), irrigation (I) mean and standard deviation of crop yield, irrigation water use efficiency (IWUE) and total water use efficiency (TWUE) obtained in all treatments during the two growth seasons.
PIYieldIWUETWUE
Treatment[mm][mm][t/ha]Kg/m3Kg/m3
µσµσµσ
2014
T1108.6124.439.1 a8.331.5 a,b6.716.8 a3.6
T261.124.9 b10.740.7 a17.414.7 a,b6.3
T3112.224.1 b9.421.5 b,c8.410.9 a,b4.3
T467.119.5 b13.329.1 b,c20.011.1 a,b7.7
2015
T173.6181.939.0 a8.321.4 b,c5.215.3 a,b3.7
T294.525.8 b3.227.3 b,c3.415.3 a,b1.9
T3165.126.3 b9.415.9 c2.511.0 a,b1.7
T483.116.3 b2.419.6 b,c2.910.4 b1.5

