Article

Between the Social and Economic Dimensions of Sustainability in Rural Areas—In Search of Farmers’ Quality of Life

by
Agnieszka Wojewódzka-Wiewiórska
1,*,
Anna Kłoczko-Gajewska
2 and
Piotr Sulewski
3
1
Department of Development Policy and Marketing, Institute of Economics and Finance, Warsaw University of Life Sciences, 02-787 Warsaw, Poland
2
Department of Economics and Economic Policy, Institute of Economics and Finance, Warsaw University of Life Sciences, 02-787 Warsaw, Poland
3
Department of Economics and Organization of Enterprises, Institute of Economics and Finance, Warsaw University of Life Sciences, 02-787 Warsaw, Poland
*
Author to whom correspondence should be addressed.
Sustainability 2020, 12(1), 148; https://0-doi-org.brum.beds.ac.uk/10.3390/su12010148
Submission received: 26 November 2019 / Revised: 11 December 2019 / Accepted: 18 December 2019 / Published: 23 December 2019
(This article belongs to the Collection Sustainable Development of Rural Areas and Agriculture)

Abstract

:
Life quality is an important indicator of sustainable development. Farmers’ quality of life strongly affects the farm’s viability. The main goal of this study was to identify the relationships between three main components of farmers’ quality of life: economic situation, living conditions, and mental comfort. In the first phase of the study, the theoretical model representing potential relationships between quality of life components was constructed, and in the second phase the relationships were verified with the use of the structural equation modelling method. The sample consisted of 600 farmers participating in the Polish Farm Accountancy Data Framework (FADN). In the analyses, data from the FADN database and data obtained during supplementary interviews with farmers were used. The analyses revealed that living conditions are significantly and positively correlated with the economic situation and mental comfort, while mental comfort turned out to be negatively correlated with the economic situation. It was concluded that future agricultural and rural development policies should be more focused on the social dimension of sustainable development than before, particularly considering the fact that a farmer’s higher engagement in the improvement of their family’s economic condition might result in lowering their mental comfort due to the stress and work overload.

1. Introduction

According to the most popular definitions, sustainable agriculture is a farming system based on three basic rules: ecological soundness, economic viability, and social acceptability [1,2,3]. The first term refers to the preservation and improvement of the natural environment, the second refers to maintenance of yields and productivity of crops and livestock, the last one refers to self-reliance, equality, and improved quality of life. Sustainable agriculture is part of a wider concept of sustainable development, defined in the Report of the World Commission on Environment and Development UN, “Our Common Future” [4]. According to this document, the main aim of sustainable development is “to ensure that it meets the needs of the present without compromising the ability of future generations to meet their own needs” (p. 54). The fundamental issue for sustainable development is to take care of the natural environment, as its quality determines the conditions of life, and even survival, of humankind [5,6,7]. Even though the sustainability concept puts emphasis on keeping the natural environment in good shape as a condition for the survival of our civilisation, [4,7,8], in fact the theoretical model illustrating the concept is based on three pillars of sustainability: ecological, economic, and social [4,7,9,10,11,12,13]. Consequently, contrary to the neoclassical paradigm of economic growth, the paradigm of sustainability assumes the necessity to consider three types of goals while considering development plans—that is, economic, social, and environmental goals [4,9,11]. The three-dimensional structure of the sustainability concept allows and understanding of the interdependencies occurring between differing aspects of life in the course of economic and social development, putting an emphasis on the need to find a balance between obtaining various, even contradicting, goals [13,14,15,16,17]. As a result, the theory of sustainable development is still discussed, and authors dispute differing approaches. In this context, it is especially important to consider what was suggested by Daly [18] on the division of strong and weak sustainability, which differ especially in the understanding of the key sustainability element presented in the Brundtland report [4], that is, keeping the natural environment for the future generations. Turner et al. [19] also argued that it is possible to grade the level of sustainability and presented four possible levels, depending on the level of realisation of economic and environmental goals. The more rigorous approach, named strong sustainability, is focused mostly on the environmental level, while in the weak sustainability approach it is allowed to substitute the natural capital with the capital created by humans.
Even though the accessibility of natural resources for future generations is an indisputable foundation of the sustainability concept [10], in fact, sustainable development is of social character; according to Sachs [11], “development goals are always social, there are environmental conditions which need to be respected, and in order to be able to do anything, the proposed solutions must be economically feasible.”(p.210) In practice, this goal can be achieved only through integrating economic, environmental, and social factors in the decision-making process [9]. Some authors have suggested widening the list of sustainability dimensions, for example, through adding institutional environment [13] or even more complex concepts [12,20]. Regardless of the number of dimensions used, it is crucial to integrate all of them in one system [14,15,16,17]. For practical reasons, sometimes researchers concentrate on one of the sustainability dimensions [17,21], in order to identify and deeply analyse, in detail, specific problems in a certain dimension. As a rule, sustainability is measured through characterising economic units or whole socio-economic systems with a set of indicators. These indicators are supposed to assess the concordance of these parameters with the sustainability paradigm [22,23]. The parameters usually describe chosen features of a particular dimension, and only afterwards are they used to prepare more complex holistic assessments [2,24].
As for research dealing with agriculture, most of the publications concentrate on the agro-ecological or environmental components of sustainability [25,26,27,28], with economic matters in the second place [29,30,31]. Even though there are some papers concentrating on the social dimension of sustainability in agriculture [32,33,34], in general, research on this dimension is seriously underdeveloped (especially when it comes to discussing indicators) [23]. It is worth noting that the issue of “social sustainability” seems to be particularly important in the broader context of “rural sustainability”, which underlines the role of social factors in achieving the sustainability of rural communities and sustainable development of rural areas [35]. It also seems quite obvious that sustainable rural communities are an indispensable component of more general social sustainability [36]. Hitherto, much more discussion has been devoted to social sustainability in general terms and in the context of urban development [37,38,39,40,41] (however, it is stressed that the “definition of social sustainability is still in the making” [42]).
While discussing the social dimension of sustainability it is worth mentioning that quality of life is one of its crucial components [41,43,44,45,46,47]. The identification of factors determining life satisfaction is important for understanding people’s needs and providing appropriate educational and financial assistance programs to enhance their lives [48]. The impact of the farming system on the natural environment strongly affects the living conditions of the rural population, in particular, while the mental comfort and broadmindedness of farmers have an impact on social relationships in their neighbourhood. Farmers’ behaviour (such as polluting, political engagement, or neighbourhood relationships, resulting, among others, from stress) strongly affect the life quality of the whole rural community, regardless of other inhabitants’ occupations. The situation of farms is very important for the life quality of the country population in general, as well. Economic viability and environmental friendliness of farms influence the quality of food and the state of the natural environment of the whole country. Consequently, better recognition of the structure and interdependencies between the elements of farmers’ life quality gives a chance to improve the effectiveness of attempts aimed at strengthening the social sustainability of farms and rural areas.
Taking into account these circumstances, in particular the need for enhancing sustainable rural development, the main objective of the study is to identify key components of farmers’ quality of life and evaluate the relationships existing between them, based on the example of Poland. The research papers on this topic published to date usually contain a set of direct or indirect parameters that can be used for analysing the farmers’ life quality, but they did not result in a wide agreement on the methods. Moreover, the analysis of dependencies between the indicators or life quality dimensions was also not common. Thus, in this study we make an attempt to identify the direction (positive or negative) and strength of relationships between three dimensions representing farmers’ Quality of Life (QoL)—economic situation, living conditions, and mental comfort—which seems to be an important and still poorly recognized issue in the context of the sustainability paradigm.

2. Quality of Life and Sustainability

2.1. General Information about the QoL Concept

Quality of life is not a new concept, as the first research on this topic was published in the 1960s (in fact, this term was used as early as 1920, by A.C. Pigou, who defined it as a “non-economic welfare”) [49,50]. Nowadays, the term “quality of life” (QoL) is used by many various disciplines, especially in social sciences and health sciences [48], to reflect the idea of personal well-being in a framework which goes beyond the simple economic assumption equating well-being with income level [51]. The basis of QoL is an individual’s well-being and mental state in a broad multidimensional sense [52,53,54]. More detailed discussion on the similarities and differences between the well-being concept and QoL based on the literature review was carried out by Pinto et al. [55]. They concluded that well-being is understood closely to happiness, while QoL is associated with the “development and improvement of life”, thus it is an objective assessment rather than subjective feeling; nevertheless, it is difficult to clearly state the border between these two terms.
Skevington and Böhnke [56] also stressed that the relationship between well-being and QoL is obscure However, it seems that quality of life is a wider concept than well-being [48]. According to an overview of various conceptions of well-being prepared by Dolan et al. [57], the term well-being can be defined in five various ways: objective lists, preference satisfaction, flourishing, hedonic, and evaluative. Objective list means that well-being reaches the highest level when the personal needs (material, socia, and psychological) of an individual are fulfilled. Preference satisfaction assumes that an individual’s life is of better quality if they get what they want. Well-being understood in the flourishing manner refers to the Aristotle’s term “eudaimonia”. From this point of view, the quality of life is evaluated by considering the distance to reaching the potential of humankind. The hedonic and evaluative approaches can be incorporated into an account of subjective well-being, which focuses on people’s opinions about their own lives.
Murawska [58] paid attention to the fact that the lack of one widely recognised definition results in using the term “quality of life” interchangeably with “living conditions”, even though living conditions should refer to fulfilling material needs, and quality of life should also incorporate immaterial aspects. The life quality can be assessed based on the subjective opinion of the respondents, or objectively, with the use of secondary data [59,60,61,62].
Many indicators are used when measuring and assessing QoL. Subjective indicators reflect the individual perception of the respondents and their satisfaction covering such topics as career, family life, socialising, and leisure life, while objective indicators include an external evaluation of income levels, social life, and health [60,63]. Both subjective and objective assessment of QoL can be carried out on the level of an individual, family, community, state, and the whole world [60]. In practice, living conditions and tangible aspects of life quality can be measured on an aggregated level (for example, living space per one person, number of houses with access to a communal water supply system, sewage system, or central heating) [64,65,66] or on individual level, based on a questionnaire [67,68]. Subjective quality of life can be measured only with the use of a questionnaire.
The weak relationships between subjective and objective measures that are usually observed [69] are a big challenge for researchers—only in the case of very poor living conditions do objective and subjective indicators display stronger covariation [59]. Probably, these differences between QoL measured with objective indicators and subjective perceptions are caused by differing expectations of the respondents referring to various aspects of life (resulting from values, perceived living conditions of peers, etc.). Due to the weak correlations usually observed between objective and subjective QoL measures, some authors have emphasized the complimentary character of these two approaches and suggest using both simultaneously [49,70,71]. To sum up, the concept of QoL is quite complex and multi-dimensional, thus both objective and subjective parameters need to be used in order to evaluate its level [51,57].

2.2. QoL from a Sustainability Perspective

Over 200 years of industrial development have meant that in the second half of the 20th century, a large group of the world’s population became wealthier than ever before. Unfortunately, this same industrial revolution brought many unfavourable consequences, such as exploiting natural resources, accumulation of waste and pollution, and the greenhouse effect. As a consequence, scholars, publicists, and social activists started raising questions concerning the survival of humankind in the future [72,73].
When negative consequences of industrial (or, in general, civilizational) development were recognised, decision-makers and scholars started to look for a new development model. The first attempts were made by British economist Barbara Ward (1914–1981), who in 1940–1960 was dealing with reducing poverty and preparing development programmes in underdeveloped countries [74]. Basing on her experience, she recognised that economic development and poverty reduction cannot be treated separately from the natural environment; these observations she described in 1966 in her book Spaceship Earth. The problem of relationships between the natural environment on one hand and socio-economic development on the other was a main topic of discussion of the conference “Human Environment” organised by the UN in 1972. Even though it did not bring any clear solution for the complex interdependencies between nature preservation and the development of humankind [75], it at least identified the directions of discussion and potential actions that would ensure proper living conditions both for the present and future generations [76]. The results of these debates were used while preparing the report “Our Common Future” [4], which defined sustainable development as the inseparable coexistence of environmental, economic, and social dimensions that are prerequisites of true development.
Nowadays, the UN promotes 17 Sustainable Development goals, some of which directly refer to social problems of the contemporary world (no poverty, zero hunger, good health and well-being, quality education, gender equality, clean water and sanitation, decent work and economic growth, reduced inequalities) [77]. Although such a long list of goals can lead to softening the fundamental assumptions underlining sustainability of natural resources [78] or to the conflict of priorities [79], at the same time it reminds us that at the end of the day the development goals are of social character [11]. This approach leads to strengthening the importance of the life quality concept, while discussing sustainable development. According to Streimikiene [80], the improvement of quality of life is the main aim of sustainable development. Also, Mella and Gazzola [81] underlined the significance of QoL for sustainable development and made it a central part of a figure illustrating relationships between basic sustainability dimensions.
Even though the concept of sustainable development with three basic dimensions is quite clear, there are still problems with its operationalisation and measurement, as well as the assessment of the distance between its desired level and the socio-economic practice (including its social goals) [82,83,84,85]. Moreover, Elington [86] underlined that assuming triple line sustainability, it is not possible to achieve the desired level of sustainability in the economic, social, and environmental dimensions without considering that they interplay. Taking into account the inseparable coexistence of three dimensions of sustainability, it seems justifiable to emphasize that quality of life as an element of social sustainability plays a significant role in this overall concept of sustainability [87].
Due to the significant involvement of organisations such as the United Nations (UN), Organisation for Economic Co-operation and Development (OECD), and the World Bank in sustainable development measurements and assessments, the indicators of sustainability developed by these organisation have become widely used [88]. Among the most popular ones we can find are: the Human Development Index (HDI), created by the United Nations Development Program, which is a composite indicator that consists of such parameters like income, life expectancy, and schooling [88]; genuine savings, developed by the World Bank in 1998 and relating to the concept of green national accounts, taking into consideration investments in human capital, depletion of natural resources, and damage caused by pollution and greenhouse gas emissions [89]; and a series of indicators prepared by OECD, such as “Society at a Glance—OECD Social Indicators” [90], including indicators for social policy, such as general context indicators (e.g., national income per capita, fertility rates, migrations), self-sufficiency indicators (e.g., employment, child care), equity indicators (e.g., income inequality, poverty), and health indicators (e.g., life expectancy, perceived health status), “OECD Key Environmental Indicators” [91], including climate change, state of the ozone layer, air quality, waste generation, freshwater quality and water resources, forest resources, fish resources, energy resources, and biodiversity, and “Economic Policy Reforms: Going for Growth” [92], referring to indicators of productivity, employment, inclusiveness, and environmental sustainability.
Such indicators are used especially often by policy-makers who want to measure society’s progress in a simple and understandable manner, reducing complex issues to one dimension. In fact, such measurement is very complicated—this is why, until now, no widely accepted way of measuring sustainability has been developed—neither in an aggregated way, nor separately for each dimension. This results both from the complexity of the concept and from its dynamic character [93,94]. Moreover, the level of sustainability can be measured on various levels and subsystems, from international level, to country level, to a farm, and even to a field [95]. An interesting overview of sustainability indicators used for analysing agricultural systems and farms can be found in the publications of authors such as Hayati et al. [96], Hayati [25], Latruffe et al. [23], Reytar et al. [27], and Briassoulis [97]. Most of the sustainable agriculture indicators refer to various aspects of the environmental dimension [27], while rather few refer to the social dimension [23].
Even though some of the authors include social indicators while assessing agricultural sustainability [32,33], they usually concentrate on the status of the family, ways of supporting decision-making, living conditions, involvement in community issues or safety—not treating the quality of life (QoL) as a whole. Moreover, the available tools are useful for assessing the social situation of farmers only to a limited extent [98].

3. The Concept of “Quality of life” (QoL) and Farmers’ Life

The quality of life of inhabitants is an important indicator of rural economic development [99,100,101]. Taking into account that in many countries, farmers are the main social and professional group of village inhabitants, it can be assumed that their QoL determines the general picture of rural areas. What is more, it seems reasonable to say that QoL is not only an important indicator, but also an important determinant of farms’ durability.
When we consider that subjective indicators of life quality reflect an individual’s perception of satisfaction in work and leisure, we can assume that the quality of life of farmers is a component of farm viability [63]. It is especially important when we make projections concerning intergenerational farm transfers [102], as younger generations usually expect more from the quality of life than their forefathers, and they are rarely willing to sacrifice their comfort for a farm life [103]. Thus, the higher the difference in life quality between urban and rural areas (and farmers’ families, in particular), the stronger the tendency among young farmers to change their occupation or even move to the cities.
In this context, Arbuckle [61] focused our attention on the problem of “rural brain drain” [104], which means the brightest young people leaving the countryside, who move out of their home villages in search of a better life quality. This leads to further deepening the urban–rural disparity with respect to life quality, for example, in the access to infrastructure and therefore possibilities of development [58,105]; this problem is stronger in Poland than in Western Europe [106]. Also, Bernard’s study [107] conducted in Czechia presented some disadvantages of rural areas rather specific to Eastern European Countries (e.g., limited availability of jobs, problems with access to certain services). Some authors have indicated that the reason for the urban–rural gap was rapid urbanization and industrialization, which can be seen as a significant determinant of rural sustainable development [99,108]. On the other hand, living in rural areas can be seen as more comfortable than in cities, especially when we include environmental aspects and social surroundings [109]. In order to prevent young people from migrating to cities, policy-makers (among others in the EU) implemented special programmes aimed at keeping them on the farms (support for young farmers) [110].
Similarly, as in the case of quality of life in general, research on farmers’ quality of life lacks a widely accepted and clear definition. Consequently, there is a problem with comparing the results. The most commonly used indicators of farmers’ life quality usually refer to: health, work, different dimensions of the natural environment, and social and family support [48]. According to the theoretical model suggested by Windon [48], relationships between various groups of factors can be presented in a form of a set of circles encapsulating other circles: the inner one covers the farmer’s demographic and social background, the middle one is external environmental factors, and the external one is the farmer’s health and work–leisure factors.
Chase [63] carried out principal components factor analysis and found that changes in life quality of farmers resulted from changes in two groups of factors: changes in personal time and changes in personal satisfaction. Detailed analyses carried out by Windon et al. on the life quality of farmers from Ohio [48] revealed that most of them generally had a positive outlook on life, and its quality was lowered mostly by factors connected to farming, such as input costs, financial pressures, and cost of agricultural equipment. Also, hours of sleep in the busy season and annual vacation time had an influence on life quality. On the other hand, emotional support received from family members and overall health status had the strongest positive influence on their subjective life quality.
Arbuckle and Kast [61] found that the farmers’ perception of life quality strongly depends on non-farming domains of their life, including off-farm employment (which can lower QoL through reducing free time) and good relationships with neighbours. They also observed positive relationships between household income, community vitality, and farm family on one hand and farmers’ QoL on the other. At the same time, there was a negative relationship between QoL and individual stress and economic dependence on farming. With regard to dependence on farming, Levins and Cochrane [111] mentioned a so-called “agricultural trade mill”, which means that strong economic pressure severely lowers farmers’ life quality [61]. It is worth emphasising that relationships between income, farm size, and employment are quite often analysed while dealing with farmers’ quality of life [49]. There are also some papers concerning farmers’ QoL relating to other factors, such as a comparison of quality of life and work between organic and conventional farmers [87]. The conclusion was that organic farmers are characterised by a higher life quality and sustainability than conventional ones.

4. Living Conditions in Rural Areas in Poland—General Information

For decades, living conditions in Polish rural areas were much poorer than in the cities, especially with regard to access to public infrastructure. During the last few decades, the equipment of flats/dwellings and access to various goods and services has gradually improved, which was a result not only of support from the local administration, but also of improvement in the financial situation of households in the countryside, including farmers (disposable income in the countryside in 2014–2017 increased from 82.7% to 83.1% of the average income in Poland) [112]. The improvement in living conditions is connected with Poland’s accession to the EU in 2004, and following this, access to various non-returnable assistance funds such as pre-accession funds, instruments of the common agricultural policy and cohesion policy. It has been pointed out that farmers and rural residents are a social group that has gained a lot due to the EU accession [113]. The remarkable improvement in living conditions means that the attractiveness of rural areas as a place of residence has increased [114].
Poland, as compared to other European Union countries, is classified as a country with a low standard of living of the population (synthetic indicators of the standard of living of the inhabitants placed the country in 18th place (2011) and 20th place (2012) among 28 EU countries [115,116,117]), although in recent years, the rating of Poles’ satisfaction with life has been systematically increasing [118]. According to data from 2015, 81.2% of Poles are satisfied with their lives, which is an increase of 14.4 percentage points compared to 2000. In addition, the standard of living in Poland is spatially diverse [119], which is also reflected in rural areas. An analysis of data for the years 2003–2013 [120] revealed very large spatial differences in the standard of living in rural areas, resulting from differences in the conditions of rural development, industrialization, and urbanization [121]. The accumulation of unfavorable development elements is visible in rural areas of eastern and south-eastern Poland (higher unemployment, small farms, unbalanced age structure), which adversely affects the possibilities of development and improvement of the quality of life in these areas [120]. The highest standard of living is recorded in rural areas near urban agglomerations [120,122]. The lowest standard of living is found in typical rural communes with underdeveloped service functions.
Housing conditions are an important element of the standard of living. While in recent decades the differences in the standard of housing equipment have significantly differentiated the situation in cities and in the countryside, it is currently indicated that despite the “worse conditions” that characterize the Polish countryside, significant progress has been made [58,64,122,123]. Living in the countryside is no longer associated with the inability to use home equipment and basic technical infrastructure. The equipment of flats in the countryside (Table 1) has significantly improved in recent years [124], but overall it is still worse than in cities.
The countryside, due to the needs of commuting, exceeds the city in passenger cars, which is accompanied by a gap in public transport [64,124]; in 2017, about 76.3 % of households were equipped with passenger cars in the countryside (about 64.0% in cities), as much as 96.4% of farmers’ households had a passenger car, while in 2000 it was over 51% (in cities 45%) [112]. The access to public health services is better in the countryside than in cities: in 2017 the inhabitants’ needs with regard to healthcare services were met every time by 89.7% of respondents in rural areas and 87.6% in urban areas. If they were not met, it was mostly due to the waiting list and lack of time, and only in very few cases was it because of distance and lack of transport—both in rural and urban areas [112].
The subjective assessment of living conditions in the countryside has also increased in recent years. In 2000, 16.4% of rural households assessed their financial situation as bad and 25% as rather bad, while in 2015, the percentage of households was 4.3% and 12.2%, respectively [124]. People living in the countryside felt safer than people living in the city, as indicated by 88% and 80%, respectively [112]. They assessed their living conditions most often as satisfactory (62.7%), while only 8.1% and 1.4% of respondents were dissatisfied or very dissatisfied, respectively. However, as many as 65.6% of rural households indicated that they had difficulties making ends meet, of which 9.7% had very great difficulties in this respect. As many as 46.1% of households declared it impossible to cover with their own funds an unexpected expenditure to the amount of PLN 1200 (approximately EUR 280) (in the city the percentage of responses was 36.9%, and 23.1% among farmers). When it came to meeting needs, slightly more than half of the households (52.2%) declared that they had no possibility of a week’s family rest once a year. Among farmers’ households the percentage of such responses was similar and amounted to 53.1%. Around 16% of the village inhabitants assessed their health as very well, and 43.1% assessed it as well. The village inhabitants were satisfied with the amount of free time, as indicated by 64.2% of them [112].
In Poland, complicated historical conditions had a significant impact on the living conditions of residents, including village residents. The differences in the level of rural development, which ultimately translates into the quality of life of the inhabitants, date back to the 19th century, when Poland officially did not exist and its land was ruled by three different empires, until World War I [123]. Military operations and the communist system prevailing after World War II also had a significant impact on the situation of rural areas in this respect. Significant changes in the matter of catching up with rural development backlogs towards cities occurred after 1989, along with the transformation of the economy [125,126]. As a result, rural areas underwent dynamic transformations, including intensive development of some elements of technical and social infrastructure, which resulted, among others, from the creation of an authentic local government, which was the main initiator of development.

5. Materials and Methods

5.1. Method of Analysis

The literature review presented above proves that farmers’ life quality can be assessed by considering different parameters connected with dimensions of QoL such as economic situation, mental comfort, and living conditions. There is no one simple and commonly accepted solution to measure and express QoL [127], thus in this study we decided to use our own approach based on structural equation modelling (SEM). While operationalising the quality of life, we came to the conclusion that all these three dimensions should be treated separately. In order to analyse the dependencies between these parameters of the life quality of Polish farmers producing for the market, we chose a set of indicators for each of these parameters. In the first step we prepared a theoretical model based on the interdependencies between different components of QoL described in the literature. Later on, we used structural equation models to look for and verify the interdependencies in our sample (more details in the next sections of this paper).
Because the life quality cannot be observed directly, we chose to use structural equation modelling (SEM)—a general statistical modelling technique, which is widely used in the social sciences [128,129,130]. SEM makes it possible to verify hypotheses (based on theoretical assumptions) concerning dependencies between a set of variables. In general, structural equation models are quite similar to multiple regression models and factor analysis models, but they are more flexible when it comes to describing interactions, especially between qualitative variables that do not fulfil the regression assumptions [131]. The main tool used in this method was path diagram, which presents cause-and-effect dependencies between the variables. This method makes it possible to analyse multilevel relationships at a glance.
A detailed description of SEM methodology can be found, among others, in Kaplan’s publication [128]. General structural equation model consists of two components, i.e., the structural part and the measurement part. The structural component links variables to each other using a set of simultaneous equations. The measurement component links unobserved variables to observed parameters. The structural part of the model can be described by a general formula [128]:
Sη = Bη + Γξ + ζ,
where η is a vector representing endogenous unobserved variables, ξ relates to a vector of exogenous unobserved variables, B is a matrix of relating the latent endogenous variables to each other, Γ is a matrix of regression coefficients linking endogenous to exogenous variables, and ζ is a vector of disturbance parameters. The unobserved variables are linked to observable ones by constructing measurement equations for the endogenous and exogenous variables, which can be expressed by the following formulas:
y = Λyη + ε,
and:
x = Λxξ + δ,
where Λy and Λx denote matrices of factor loadings, and ε and δ are vectors of uniqueness. In the general model, variances and covariances for ξ, ζ, ε, and δ are also specified. The remaining technical details of calculating SEM can be found in quite rich literature [128,132,133,134,135].
Observed variables are visible representatives of a latent variable.
Endogenous variables are seen as dependent variables, while exogenous variables are seen as independent variables. The structural part of the model verifies the hypothesis formed by the researcher—in our case, it is an assumption that there are interdependencies between economic situation, mental comfort, and the living conditions of a farmer. We stated a hypothesis that the economic situation of a farmer significantly affects their living conditions and mental comfort.

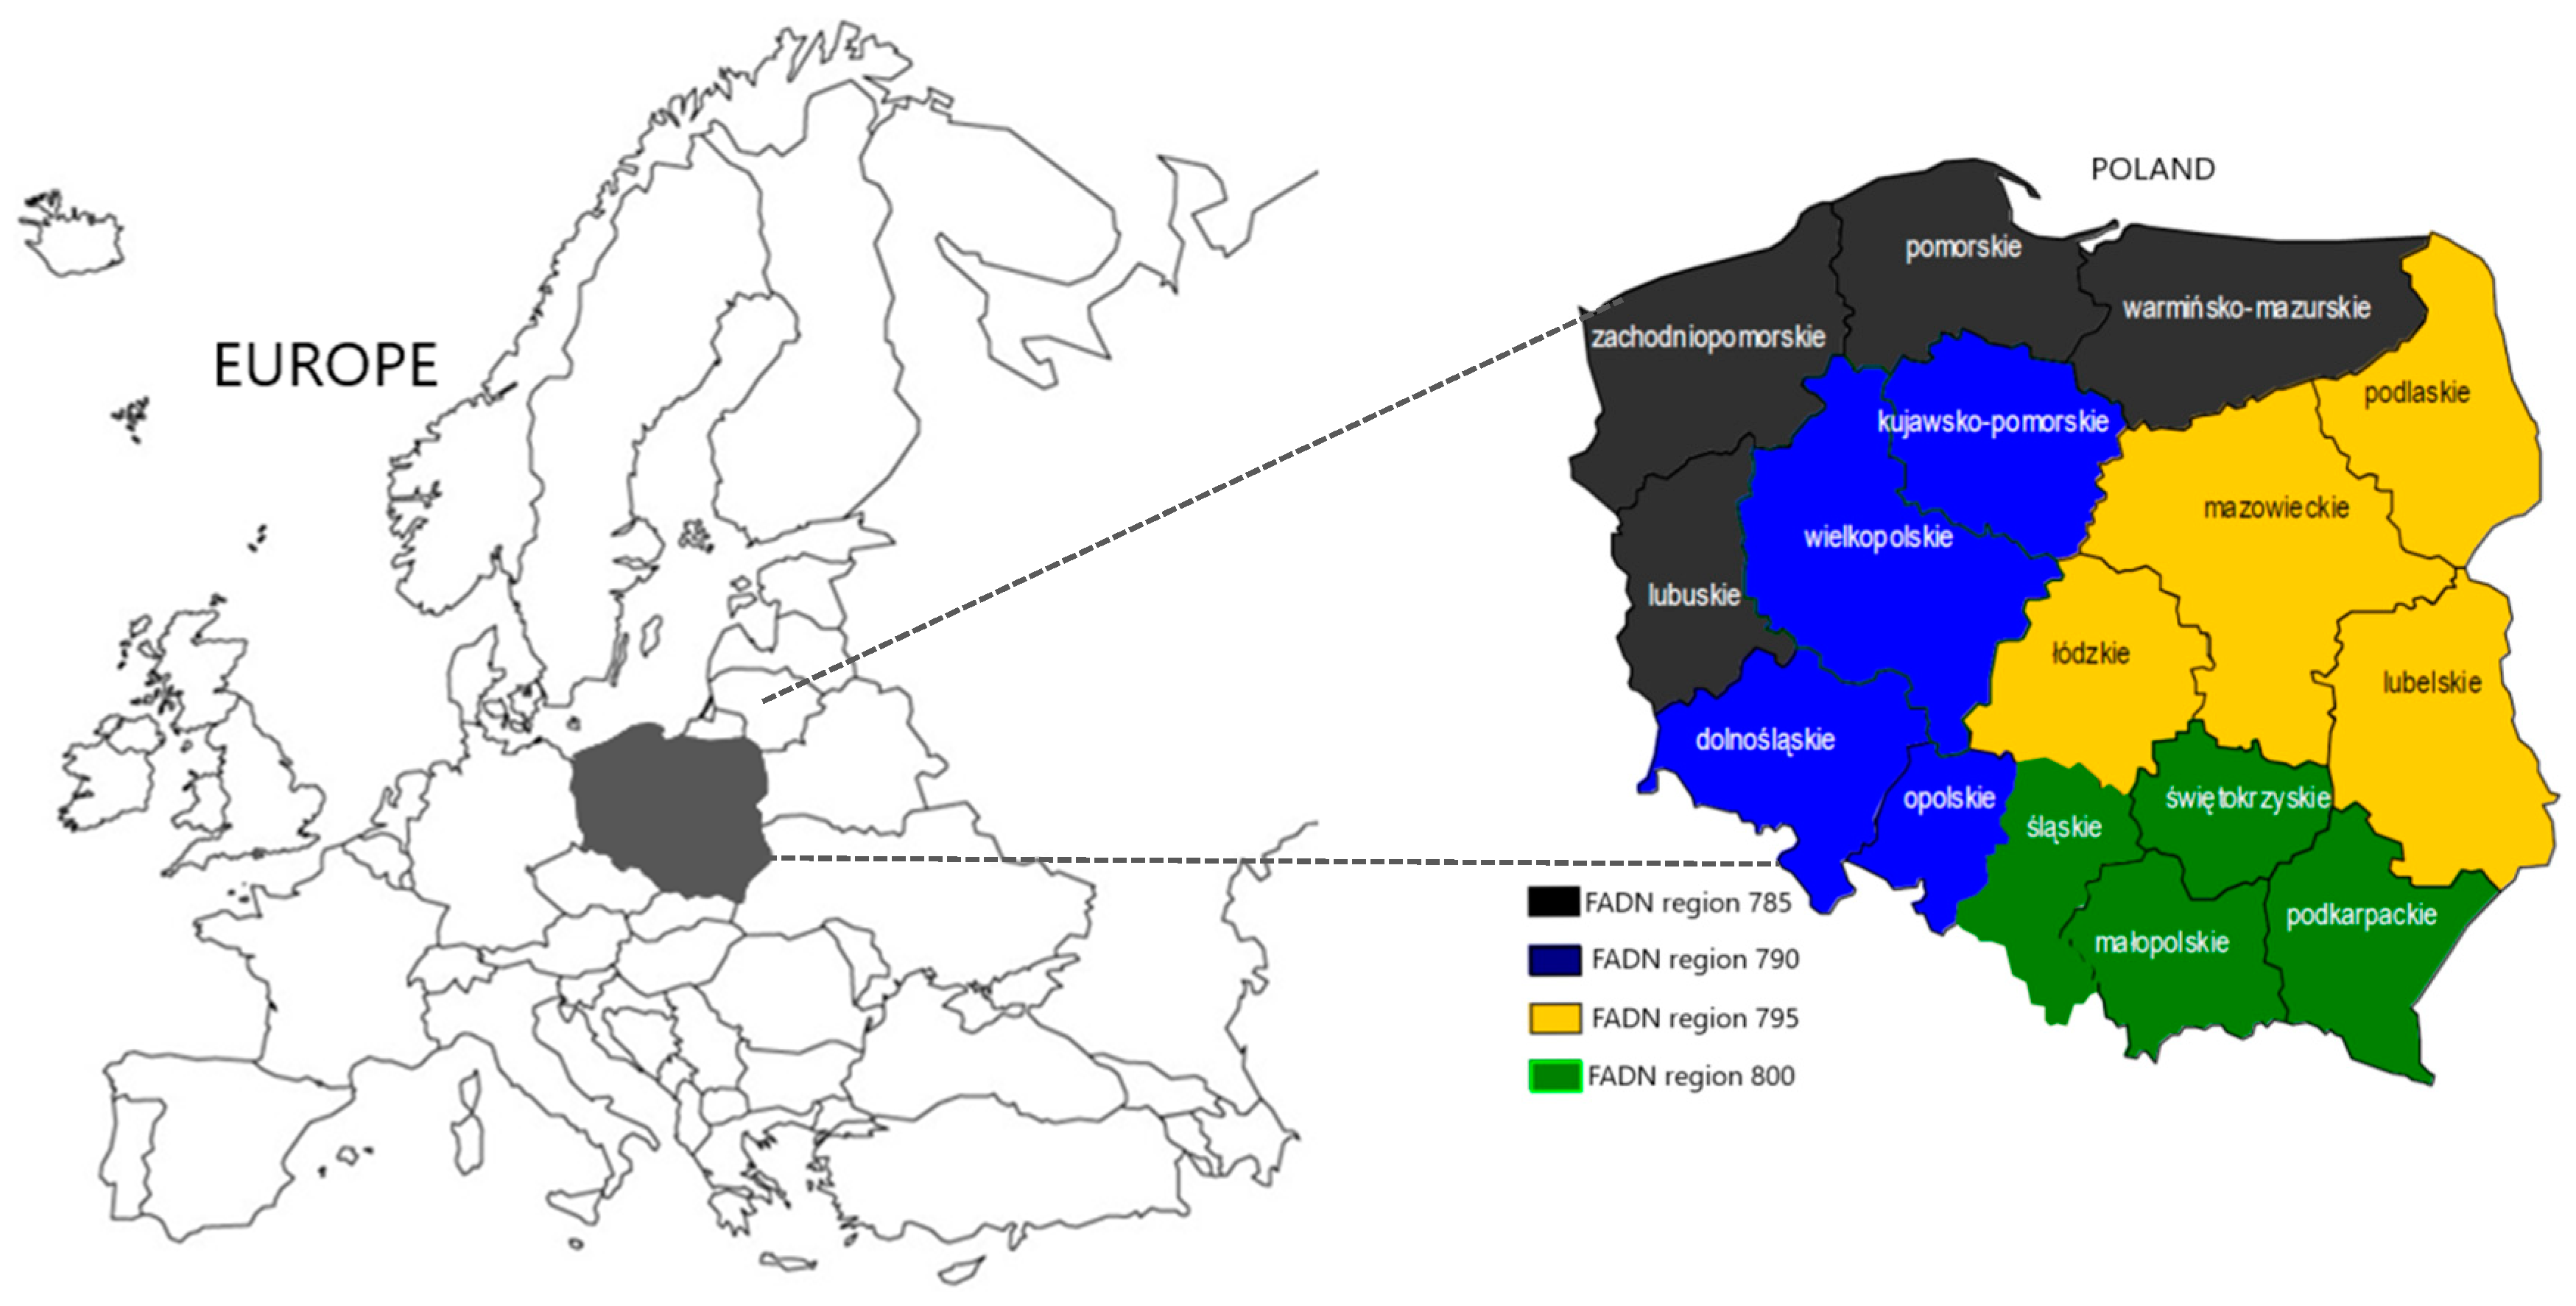
5.2. Sample Selection

In our research, we used data from the Farm Accountancy Data Network (FADN) database and structured interviews carried out with farmers in autumn 2017. FADN is a system of collecting accountancy data from farms in all EU countries, aimed at evaluating the impacts of common agricultural policy. The Polish FADN database keeps economic and financial data, such as the value of production of the different crops, stocks, sales and purchases, production costs, assets, liabilities, production quotas, and subsidies, as well as basic information on the organisation of work in 12.1 thousand farms, representing 730 thousand farms exceeding 4000 EUR of standardized production (standard output—SO). The farms cover about 87% of the total agricultural area and 94% of the production value in Poland [136]. For this research, we selected (with the use of a layer/random selection procedure) 600 farms participating in the Polish FADN system, in which additional direct interviews were conducted in order to supplement the data collected in the standard FADN dataset (including data on QoL). For the sampling purpose, four layers reflected farming specialization (crop farms, cattle farms, pig farms, and mixed farms), three layers were based on standard output (SO) (SO below25,000 EUR, SO between 25,000 and 100,000 EUR, SO above 100,000 EUR ), and four layers corresponded to the regions (see Figure 1).
The number of farmers that were to be interviewed in each layer was determined with the use of the same (the Neyman [138]) method as used while preparing the sample for FADN [137]:
n h   =   n   N h σ h k = 1 L N k σ k ,
where nh = sample size in layer h, n = sample size, Nh = size of population in layer h, σh = standard deviation standard h, L = number of layers.
The information concerning the number of farmers interviewed (according to the production types and standard output groups) is presented in Table 2. The structure reflects the structure of commercial farms in Poland.
The interviews were carried out by advisers from regional extension centres, who coordinated collecting the data for the FADN system. The questionnaire contained questions dealing with some aspects of the operation of farms, including attitudes towards environmental and societal aspects of sustainability. This information was connected to the appropriate data stored in the FADN database (farm costs, production value, financial results, and basic organisational data).
As the layered random sampling method reflected the structure of farms (economic size, type of production, and region) surveyed by FADN, we can assume that our sample was representative of the population of farms in the scope of observation of the Polish FADN. More details on the two-stage sampling procedures can be found in the literature [139,140].

6. Results

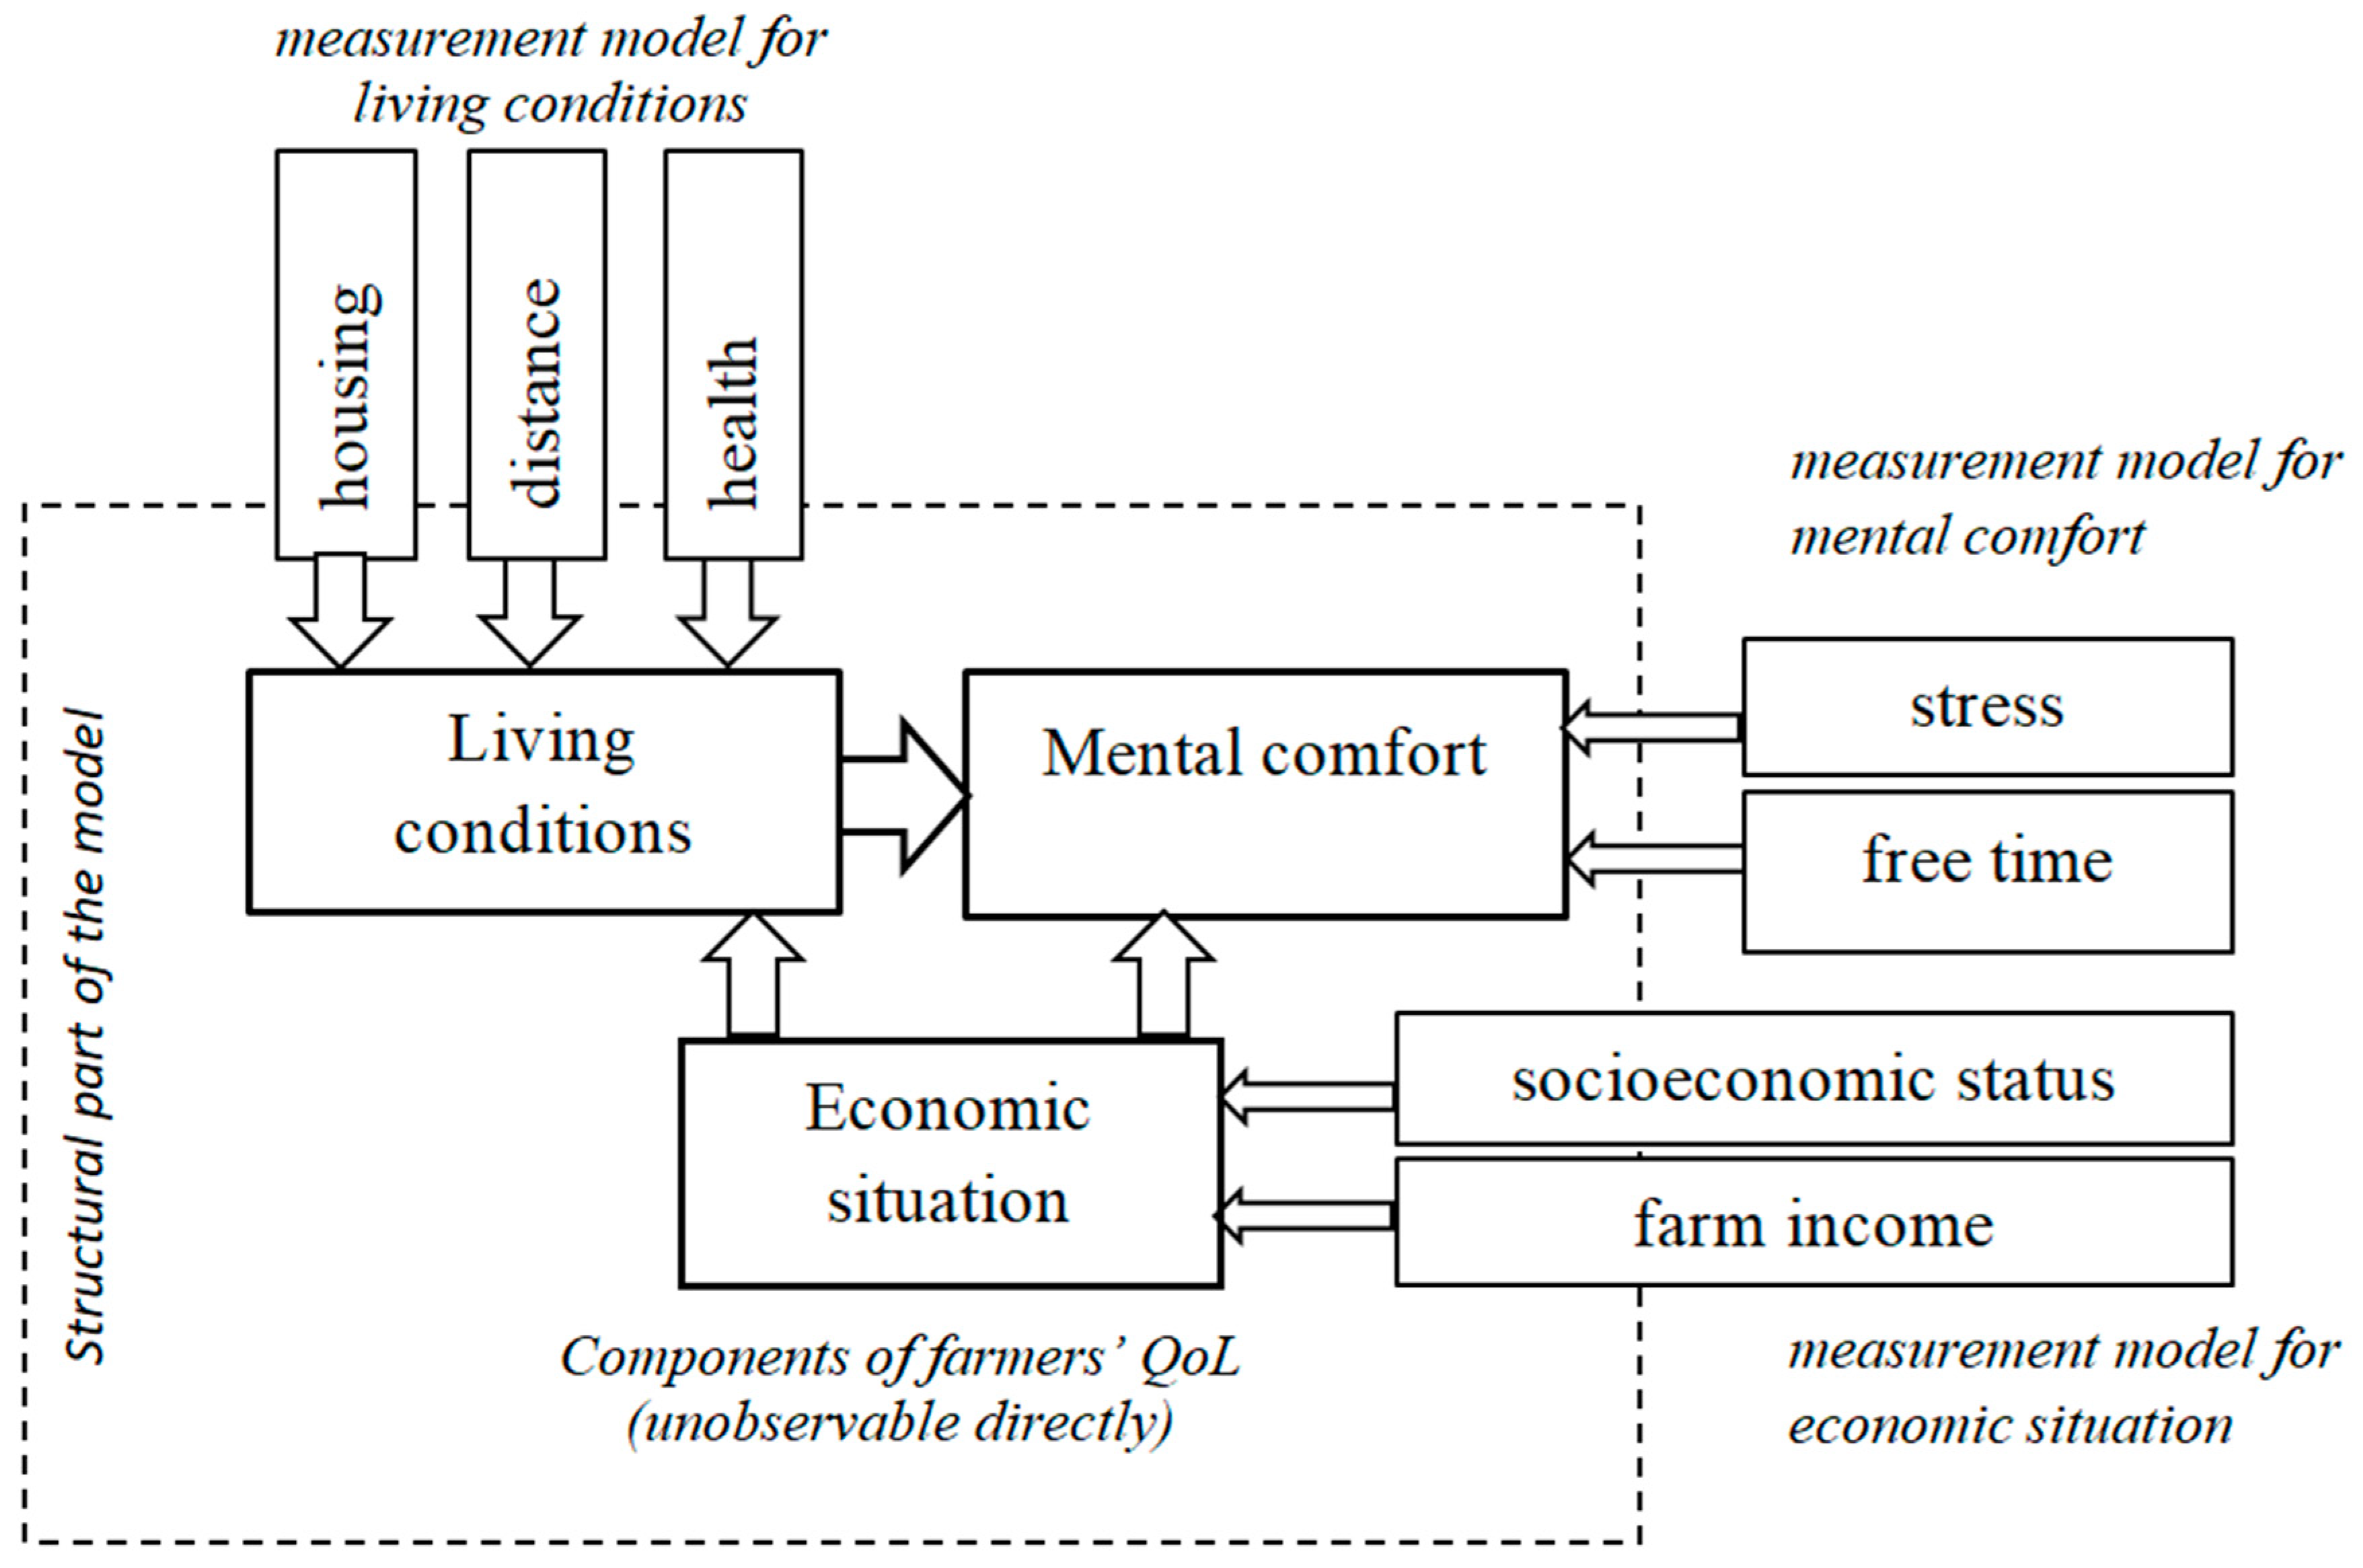
6.1. Theoretical Model

According to the literature review, the concept of QoL is quite complex, and thus there is no simple way to reflect all its intricacies in one simple indicator. Based on our knowledge and literature review, we prepared our own model reflecting the complex nature of the life quality concept. The general idea of our approach is presented in Figure 2.
As written above, QoL is most often assessed with the use of indicators reflecting living conditions, economic situation, and/or subjective perception of mental comfort. We assumed that these three categories reflected three interdependent and not directly observed dimensions of life quality (they are latent variables). It is difficult to find any analyses of relationships between life quality components in the literature, and thus this is a novel approach. We assumed that the economic situation of the household affected both the living conditions and mental comfort of a farmer [61,80,141,142,143]. This assumption was based on the knowledge that a better economic situation usually results in better living conditions. At the same time, the ability to make ends meet causes relative mental comfort [48,61,63,102] (although it is also possible that a good financial situation is a result of very hard work, resulting in stress and lack of time [61,144]—empirical findings of such elaborations can be found further in the text). Some scholars have underlined that using pure income as a measure of the economic side of life quality is not enough [51], thus while assessing the economic situation of the farmer we included, aside farm income, the subjective perception of the socio-economic situation of the household. Furthermore, we assumed that there is a positive relationship between living conditions and metal comfort, as in general living in comfort affects mental comfort [145,146].
It is worth noting that categories such as economic situation, living conditions, and mental comfort do not have clear definitions and (as we could see in the literature review) can be described with the use of both subjective and objective measures. In our theoretical model, economic situation was represented by observed variables such as socioeconomic status and farm income; living conditions were represented by housing, distance, and health; mental comfort was represented by stress and free time. In the empirical part of our research, these variables were treated as observed variables and used to describe three QoL dimensions, while three dimensions were treated as latent variables (factors in the factor analysis). Our theoretical model was verified empirically with the use of data from the farmers. A detailed description of the variables is given below, followed by results of the modelling procedure.

6.2. Characteristics of the Variables Used in the Model

Table 3 contains descriptions of the variables used in the structural equation model and information on whether they were latent variables or observed variables. Observed variables were standardised, because they were originally measured on differing scales. Most of the observed variables were aggregates of sets of variables taken form the questionnaire or the FADN database (details are given in Table 3).
Basic information concerning the distribution of the variables is given in Table 4 and Table 5. To make Table 4 easier to read, original replies of the respondents on a 0–6 Likert scale were reduced according to the following rule: low ≤ 2; medium = 3 or 4; high ≥ 5. When we look at the “stress” variable we can see that the highest levels were reached by factors related to farming practice: price volatility and production risks, followed by changes in law regulations and pest hazards, together with plant and animal diseases. On average, the lowest level of stress was assigned to current indebtedness. It seems that stress results mainly from unpredictable and unmanageable reasons, while current indebtedness is known, contrary to the factors that can cause lowering of the future income, thus reducing the ability to pay back the debts. In the theoretical model, we assumed that a high level of stress was followed by low mental comfort, which in effect causes a downswing in life quality.
Let us move now to the free time variable. We assumed that a large amount of time that can be spent on a set of activities results in higher mental comfort. The respondents declared that they have the least amount of time to attend cultural institutions, followed by a few days’ holiday and deepening knowledge about farming. Only a few farmers complained that they did not have enough time to sleep and have basic rest. Here, we should remember that the interviews were carried out in November, and the situation might be different in high season.
Most of the respondents declared that their housing conditions were average or very good, but only a few farmers assessed themselves as the most affluent in their village. Almost one in three declared that they were rather poor, which goes in line with the dispersion of farmers’ incomes (the bulk of the farmers achieve relatively low incomes, while there is a small group with very high incomes—this conclusion can be drawn from the relationship between the median and mean of the farm income). In the theoretical model, higher income and self-assessed affluence reflected a better economic situation.
Most of the farmers were characterised with good health (which was an element of living conditions). The greatest distance from an important institution, measured by access time in minutes, was from the institutions of culture—this goes in line with the lack of time to visit such places (declared above). In this model, we assumed that the lower the time of access the higher the living conditions of the respondent.
The variables (parameters) presented in Table 4 and Table 5 were later used to identify the relationships between unobservable directly latent variables, which in our study represented three components of QoL (in accordance with theoretical framework presented in Figure 2). In contrast to the variables described in Table 3 and Table 4, latent variables are not directly observable, hence statistical description and analysis cannot be made in this case like in the case of observable variables. However, these latent variables are the core of the structural modelling procedure presented in the next subsection of the paper.

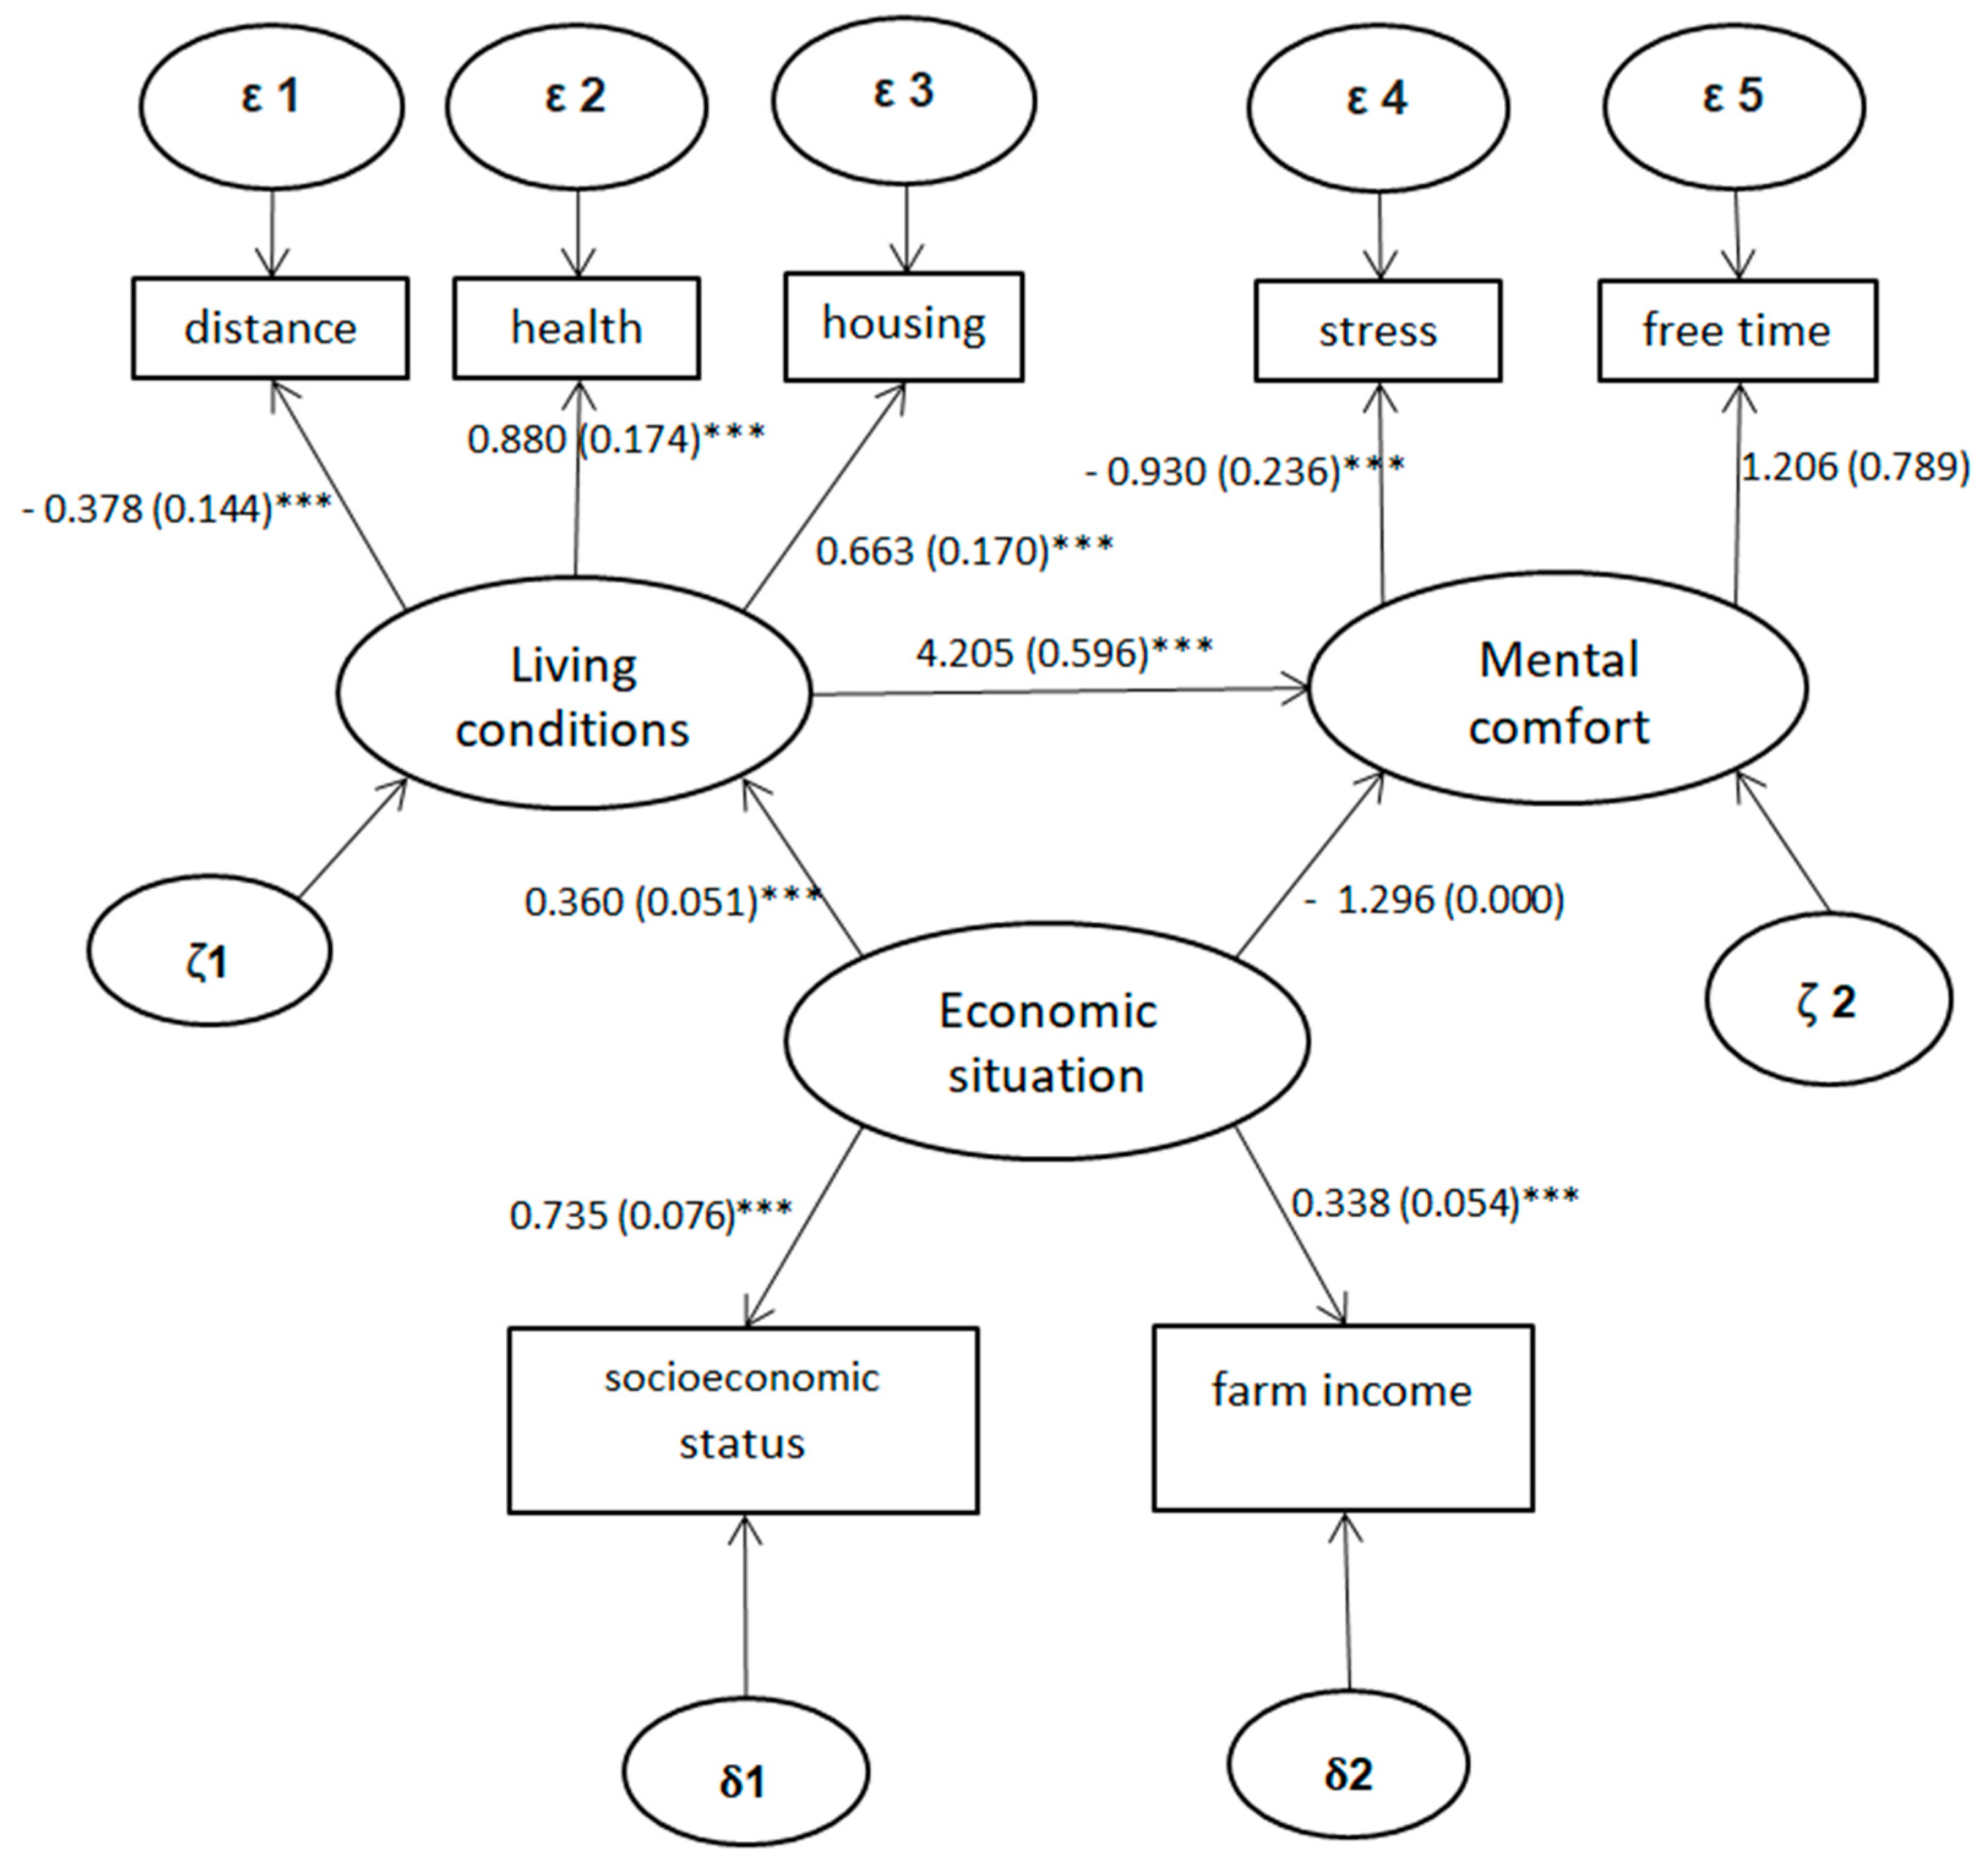
6.3. The Results of Structural Equation Modelling

Detailed information concerning structural modelling, with the use of the SEPATH module (Structural Equation Modelling and Path Diagrams module), is given in Figure 3. Each structural path, reflected in the Figure in the form of arrows, contains information on the coefficients’ values, standard errors, and statistical significance.
It is worth noting that for all of the paths the coefficient values were significantly higher than standard errors; at the same time, almost all of the paths were statistically significant (p < 0.1). Our model looks similar to a model suggested by Jöreskog i Sörbom [147], and can be treated as a compilation of four less complex models, where three models (visible at the top and at the bottom of the Figure 3) are ordinary factor analysis models, while the main structural model (situated in the centre of the Figure 3) is a multiple regression model. In the structural part of the model, economic situation is an exogenous variable, while living conditions and mental comfort are endogenous variables. In the terms of factor analysis, latent (unobservable) variables represent common factors for observable and measured items. Thus, from a methodological point of view, figures assigned to the arrows between latent variables and observable variables (measurement parts of the model) reflect factor loadings of observable variables on the latent factor. The factors named with Greek letters (δ1, δ2; ε1 to ε5; ζ1, ζ2) represent measurement errors.
Prior to discussing the results, we should assess the statistical significance of the model. While using structural equation modelling techniques, it is important to pay special attention to the goodness of fit indices based on non-centrality. These indices are based on an estimation of the population non-centrality parameter. Instead of testing the hypothesis that the fit is perfect, we ask the questions: “How bad is the fit of our model to our statistical population?” and “How accurately have we determined population badness-of-fit from our sample data?” [135]. The indices presented above make it possible to answer both questions, because they allow for the confidence interval assessment (see Table 6).
Table 7 contains the assessment of the goodness-of-fit of the model carried out with the use of single sample indices of fit. According to the literature, special attention should be paid to the Akaike’s information criterion (the smaller the parameter, the better the fit of the model) and Joreskog’s criteria (a value of 0.9 is needed to accept the model, while 0.95 makes the model good [130]). As we can see, the fit of the model was good.
The analysis of this model provided some interesting conclusions. In the measurement part of the model we can see positive correlations between the latent variable economic situation on one hand and observed variables income and socio-economic status on the other—this result confirms assumptions from the theoretical model. There was also a positive correlation between living conditions and health and a negative correlation between living conditions and distance—the latter means that a small distance from various institutions does not go in line with good living conditions (we could imagine people moving from cities to the countryside to improve their living conditions despite enlarging the distance to many institutions [148]). We can also see that the negative correlation between the variable of stress and latent variable mental comfort suggested in the theoretical model was confirmed. Simultaneously, living conditions were positively and significantly correlated with health.
Correlations between latent endo- and exogenous variables were the most important for reaching our research goal (structural part of the model). The analyses revealed that economic situation positively (and significantly) affects living conditions, while it has no significant relationship with mental comfort. The reason for this might be that efforts made to improve the economic side of life reduce the amount of free time and might cause stress. This goes in line with the possible conflict between social and economic dimensions of sustainable development described in the literature [149]. Simultaneously, our analyses show a positive correlation between both endogenous variables used in the structural model, that is, living conditions and economic situation, which is quite understandable. Considering all three variables that were used in the structural model, we can conclude that economic situation affects living conditions, and living conditions affect mental comfort, but there is no direct influence of economic situation on mental comfort.

7. Discussion

Our research was based on an assumption—shared also by López-Ruiz [141], Sachs [11], and the UN [150]-that quality of life is a general aim of sustainable development. Undoubtedly, it is also one of the important factors influencing farms’ sustainability [98,151,152,153,154]. Research dealing with life quality (not only of farmers but of other social groups, as well) usually contains construction and analyses of subjective and objective indices, see [141]. In this research, we decided not to create a general life quality index, but to analyse relationships between crucial elements of farmers’ life quality instead; such analyses are not common. In this approach, it was not possible to rank a particular person, region, or country in a life quality continuum, which is done by many researchers [141]. We decided to use the structural equation modelling technique—a widely used method, but so far not (or very rarely) used for analysing farmers’ life quality. Similar analyses were carried out on other social groups, for example, while analysing the impacts of leisure and tourism on the elderly’s quality of life in Japan [155], assessing preferences among quality of life dimensions for the elderly (people aged from 65 to 94 years old) [156], or examining the relationships between authenticity, subjective happiness, and life satisfaction [157]. As we can see, SEM can be used mainly to analyse not the life quality level, but the relationships between the elements of this concept.
In our model, most of the theoretically assumed relationships were confirmed. These results go in line with relationships discovered by other authors, who used different methods. It should be emphasized that in our model, quality of life was expressed both in economic and social terms. We followed the results obtained by López-Ruiz et al. [141], who explored which of the three dimensions of sustainability of a city (economic, social, or environmental) has the greatest effect on citizens’ subjective quality of life. According to their analyses, economic and social dimensions determined almost all elements of life quality, while environmental factors had rather low connections with the life quality.
In our research, socioeconomic status and farm income were important elements of the economic situation that influenced the quality of life of the farmers. Similarly, positive relationships between household income and QoL were observed, for example, by Arbuckle and Kast [61]. Such a result is not surprising, because incomes determine the possibilities to satisfy people’s basic needs, which is why they are widely used as an objective QoL indicator [101]. For instance, Eurostat [158], in order to assess the QoL of EU inhabitants, uses parameters such as economic security and physical safety. Some research on the QoL of farmers in other countries also confirms that income is an important parameter of QoL [159,160,161,162].
However, we should be aware of the fact that even though economic parameters are very important, they are not sufficient to assess even the objective dimension of quality of life in a holistic way [51]. In order to carry out such an assessment, it is important to apply at least some additional parameters related to the physical dimension of quality of life, like health and material living conditions [158]. According to our results, health, housing, and distance to various institutions affect living conditions. The impact of health on life quality is widely acknowledged and generally the positive impact of good health on QoL is underlined, i.e., [48,60,163], which is in line with our observations, however the picture can be more nuanced. For example, Zagozdzon [143] found out that women living in rural areas have better mental health and worse physical health compared to those from urban settings.
Talking about urban–rural differences, it is worth noting that, naturally, in rural areas there are longer distances between objects, including important institutions. Thus, remoteness is perceived as a factor lowering quality of life [164], because it can limit access to different institutions. However, in our research, a rise in distance from a set of institutions was correlated with a rise in the latent variable living conditions, which in consequence improved the mental comfort variable. At first glance it seems surprising, but in fact higher distance form urban settings can improve physical (environmental) and social surroundings [109]. Taking into account the rather good equipping of farms with passenger cars, it can be assumed that nowadays even a trip to a city located 30–40 km away is not a significant challenge for the majority of commercial farmers. The positive correlation between housing conditions and life quality seems obvious, and is confirmed also by other authors [80,158].
Mental comfort was represented by the observed variables stress and free time. Negative consequences of stress and lack of free time have been described many times in research on both mental and physical health [165,166], as well as in research on farming [61,63,102,156,167]. Also, Windon et al. [48] found out that farmers’ life quality was lowered mostly by stress-generating factors connected to farming (input costs, financial pressures, and cost of agricultural equipment) and lack of sleep (meaning absolutely no free time in busy season). Similarly, research carried out in sectors other than agriculture also drew the conclusion that better working conditions have an influence on QoL [127].
Since the three dimensions of our model of QoL (economic situation, living conditions, and mental comfort) are not directly observed in reality, the interpretation of the results is more difficult. Contrary to many previous studies, our research did not directly reveal interpretative values of aggregated indexes of QoL, but provided evidence for theoretically assumed relationships between three components of the QoL concept. The presumptions justifying the selection of variables and structure of our models have been wider explained in the section with the theoretical model description; thus, here we would like to discuss only the result of the verification of the initial assumptions. As for the whole model representing relationships between the three dimensions, we confirmed significant and positive relationships between economic situation and living conditions, as well as between living conditions and mental comfort. Although these results are not directly comparable with previous research, due to the differing methods used, in general our results are in line with the results obtained by other authors; this suggest their universality. The importance of economic issues for the farmers’ QoL was also described by Arbuckle and Kast [61], Sandbichler et al. [49], Streimikiene [80], Bennett [144], Chase [63], and they were also given in Eurostat statistics [158]. Similarly, the relationship observed in our sample between living conditions and mental comfort is in general supported by the literature, but here we should acknowledge that these two parameters may be defined in a variety of ways. A positive influence of living conditions on mental comfort was observed by de Sa [145] or Bonnefoy [146], however they did not refer directly to the farmers.
The relationship between economic situation and mental comfort seems more interesting and needs deeper analysis. Contrary to our initial assumptions, economic situation negatively correlated with mental comfort. In our model, mental comfort depended, at least partly, on the level of stress; the most stressful factors for our farmers came to be price volatility, weather hazards, and changes in law regulations. Moreover, more effort put into work reduces free time available, which was also included in our model as a parameter of mental comfort. This is supported by earlier research, as the improvement in economic situation might cause a lowering of mental comfort, as a result of stress and lack of free time, which are the consequences of putting more effort into work [61,144]. This means that the good current economic situation is usually burdened with sacrifices in personal life. On the other hand, scholars have underlined that the bad economic situation of farmers, combined with other stress-generating factors (such as fluctuating weather, long work hours, lack of information, isolation, remoteness) result in the low level of farmers’ mental comfort [164,168,169].

8. Conclusions

The theoretical and empirical analyses presented above allowed us to draw the conclusion that farmers’ quality of life is a complex concept that cannot be described simply with one indicator. It seems inevitable to include in such research, in addition to economic situation, living conditions and mental comfort. Our analyses, carried out using structural equations modelling, was supposed to discover dependencies between life quality components such as living conditions, mental comfort, and economic situation. Although these three components are widely used in the literature to describe life quality, in reality they are not observed directly and in practice they have to be operationalised with the use of parameters that are easier to measure. Our analysis proved the usefulness of the structural modelling technique in investigating relationships between different components of QoL. In consequence, the main aim of the study, which was to identify the key components of farmers’ quality of life and to discover the direction and strength of relationships between them, was achieved.
In our model, we assumed that both mental comfort and living conditions are influenced by economic situation. In fact, only living conditions came to be directly dependent on economic situation. At the same time, there is a significant negative influence of economic parameters on mental comfort. We can assume that a good financial condition of a farmer’s household results from their engagement in intense work, which reduces free time and might cause stress. At the same time, economic situation influences mental comfort indirectly, with living conditions as a mediating variable. To sum up, economic situation is an important factor influencing life quality, but cannot be the only indicator used in such analyses. Further research on relationships between various quality of life components in other social groups is needed, because these relationships might be different in various income, occupational, or age groups. Still, a comparison of our results with the results of other authors (although based on other methodologies) indicates that the observed relationships are rather universal, however there are undoubtedly some conditions (e.g., historical) which mean that in some aspects significant differences in QoL assessment can be observed. In particular, this refers to the mental comfort dimension, which is assumed to be subjective in nature and thus is the most sensitive to parameters of the farmer’s mental condition at a specified moment in time.
Assuming universality of the observations, it is important to underline the significance of the identified and verified relationships for future agricultural and rural development policy in EU, where highly developed non-agricultural sectors may create a strong incentive for abandoning the agricultural land (particularly in the case of young farmers). One of the objectives of agricultural policy and rural areas is to create conditions for agricultural activity which provide farmers with a satisfactory income, which is a condition for maintaining the vitality of rural areas. However, in the context of our study’s results, it is worth emphasising that policy measures based on economic stimulators may be insufficient to keep farmers in the agricultural business; even though economic measures stimulate farmers to make an effort to expand their agricultural activity, such expansion can also be a source of additional stress, leading to the lowering of mental comfort (e.g., financial support to investment loans). Our results indicate that mental comfort depends largely on stress, and the most stressful factors turned out to be frequent changes in legal regulations, price and transaction volatility associated with weather anomalies. Moreover, a farmer’s strong involvement in the farm’s activities reduces free time. Hence, it can be concluded that in the countries where living conditions are on a decent level (and making a living is not a very difficult task), if individual farmers must face the above-mentioned stress factors, it is very likely that improving their economic situation is associated with mental comfort deterioration. Thus, future policy framework should be focused on the social dimension of sustainable development even more than before, particularly considering farmers’ mental comfort and living conditions.
In the context of presented analysis, it should be underlined that research on relationships between various components of farmers’ life quality is important not only for the farmers, but also for the whole rural development policies, as in many countries, farming families make up a significant share of the rural population. The quality of life of rural inhabitants is an important element of the social dimension of sustainability, thus determining the possibilities of sustainable development in rural areas. Better understanding of the interdependencies between life quality components is part of larger research aimed at finding the best possible sustainability indicators. We should remember that the farmers’ QoL is a complex issue, shaped by various economic, political, historical, and cultural factors. This is why the dependencies between various QoL parameters might differ between countries. Nevertheless, we think that our conclusions might be useful for policy-shaping in countries with a relatively similar level of development, where family farmers producing for the market face similar challenges to Polish farmers.

Author Contributions

Conceptualization, P.S., A.W.-W., methodology, P.S., A.K.-G., software, P.S..; validation, A.W.-W., A.K.-G. and P.S.; formal analysis, P.S. investigation, A.K.-G., A.W.-W.; writing—original draft preparation, P.S., A.W.-W.; writing—review and editing, A.K.-G.; visualization, P.S..; project administration, A.W.W. All authors have read and agreed to the published version of the manuscript.

Funding

The article was funded by the Warsaw University of Life Sciences as part of the support of scientific research teams in 2019. Analyses were carried out on the dataset coming from a project financed by the National Science Center in Poland (2015/19/ B/HS4/02273).

Acknowledgments

We gratefully acknowledge technical support in data preparation by Kinga Pogodzińska.

Conflicts of Interest

The authors declare no conflict of interest.

References

  1. Hansen, J.W. Is agricultural sustainability a useful concept? Agric. Syst. 1996, 50, 117–143. [Google Scholar] [CrossRef]
  2. Rigby, D.; Cáceres, D. Organic farming and the sustainability of agricultural systems. Agric. Syst. 2001, 68, 21–40. [Google Scholar] [CrossRef]
  3. Velten, S.; Leventon, J.; Jager, N.; Newig, J. What is sustainable agriculture? A systematic review. Sustainability 2015, 7, 7833–7865. [Google Scholar] [CrossRef] [Green Version]
  4. United Nations. Report of the World Commission on Environment and Development: Our Common Future; United Nations: New York, NY, USA, 1987. [Google Scholar]
  5. White, L. The historical roots of our ecologic crisis. Science 1967, 155, 1203–1207. [Google Scholar] [CrossRef] [PubMed] [Green Version]
  6. Du Pisani, J.A. Sustainable development–historical roots of the concept. Environ. Sci. 2006, 3, 83–96. [Google Scholar] [CrossRef]
  7. Vehkamäki, S. The concept of sustainability in modern times. In Sustainable Use of Renewable Natural Resources: Principles to Practices; Helsingin yliopisto, metsäekologian laitos: Helsinki, Finland, 2005; pp. 23–35. [Google Scholar]
  8. Ministry of the Environment. Annual Report on the Environment in FY2010, Annual Report on a Sound Material-Cycle Society in FY2010, Annual Report on Biodiversity in FY2010. Chapter 1. Sustainability and Quality of Life. 2010. Available online: https://www.env.go.jp/en/wpaper/2010/fulltext.pdf (accessed on 15 November 2019).
  9. Emas, R. The Concept of Sustainable Development: Definition and Defining Principals; Brief for GSDR; Florida International University: Miami, FL, USA, 2015. [Google Scholar]
  10. Voinov, A.; Smith, C. Dimensions of Sustainability; Discussion Paper; International Institute of Ecological Economics: Solomons, MD, USA, 1998. [Google Scholar]
  11. Sachs, I. La Troisième Rive: A La Recherche de l’écodéveloppement; Bourin éditeur: Paris, France, 2008. [Google Scholar]
  12. Mauerhofer, V. 3-D sustainability: An approach for priority setting in situation of conflicting interests towards a sustainable development. Ecol. Econ. 2008, 64, 496–506. [Google Scholar] [CrossRef]
  13. Bardy, R.; Rubens, A.; Massaro, M. The systemic dimension of sustainable development in developing countries. J. Organ. Transform. Soc. Chang. 2015, 12, 22–41. [Google Scholar] [CrossRef]
  14. United Nations. Integrating the Three Dimensions of Sustainable Development: A Framework and Tools; Greening of Economic Growth Series; United Nations: New York, NY, USA, 2015. [Google Scholar]
  15. Jiliberto, H.R. A holarchical model for regional sustainability assessment. J. Environ. Assess. Policy Manag. 2004, 6, 511–538. [Google Scholar] [CrossRef]
  16. Sadok, W.; Angevin, F.; Bergez, J.-É.; Bockstaller, C.; Colomb, B.; Guichard, L.; Reau, R.; Doré, T. Ex ante assessment of the sustainability of alternative cropping systems: Implications for using multi-criteria decision-aid methods. A review. Agron. Sustain. Dev. 2008, 28, 163–174. [Google Scholar] [CrossRef] [Green Version]
  17. Ciegis, R.; Ramanauskiene, J.; Martinkus, B. The concept of sustainable development and its use for sustainability scenarios. Eng. Econ. 2009, 62. [Google Scholar] [CrossRef]
  18. Daly, H.E. Sustainable development: From concept and theory to operational principles. Popul. Dev. Rev. 1990, 16, 25–43. [Google Scholar] [CrossRef]
  19. Turner, R.K.; Pearce, D.W.; Bateman, I. Environmental Economics: An Elementary Introduction; Johns Hopkins University Press: Baltimore, MD, USA, 1993. [Google Scholar]
  20. Seghezzo, L. The five dimensions of sustainability. Environ. Politics 2009, 18, 539–556. [Google Scholar] [CrossRef] [Green Version]
  21. Pierantoni, I. A Few Remarks on Methodological Aspects Related to Sustainable Development; OECD: Paris, France, 2004; pp. 63–89. [Google Scholar] [CrossRef]
  22. Olsson, J.A.; Bradley, K.; Hilding-Rydevik, T.; Ruotsalainen, A.; Aalbu, H. Indicators for Sustainable Development; Paper for Discussion; European Regional Network on Sustainable Development: New York, NY, USA, 2004. [Google Scholar]
  23. Latruffe, L.; Diazabakana, A.; Bockstaller, C.; Desjeux, Y.; Finn, J.A.; Kelly, E.; Ryan, M.; Uthes, S. Measurement of sustainability in agriculture: A review of indicators. Stud. Agric. Econ. 2016, 118, 123–130. [Google Scholar] [CrossRef]
  24. Talukder, B.; Hipel, K.W.; vanLoon, G.W. Developing composite indicators for agricultural sustainability assessment: Effect of normalization and aggregation techniques. Resources 2017, 6, 66. [Google Scholar] [CrossRef] [Green Version]
  25. Hayati, D. A Literature Review on Frameworks and Methods for Measuring and Monitoring Sustainable Agriculture; Global Strategy Technical Report Technical Report n.22; FAO: Rome, Italy, 2017. [Google Scholar]
  26. de Olde, E.M.; Oudshoorn, F.W.; Sørensen, C.A.G.; Bokkers, E.A.M.; de Boer, I.J.M. Assessing sustainability at farm-level: Lessons learned from a comparison of tools in practice. Ecol. Indic. 2016, 66, 391–404. [Google Scholar] [CrossRef]
  27. Reytar, K.; Hanson, C.; Henninger, N. Indicators of Sustainable Agriculture: A Scoping Analysis; Installment 6 of “Creating a Sustainable Food Future”; World Resources Institute: Washington, DC, USA, 2014. [Google Scholar]
  28. Hammond, A.; Adriaanse, A.; Rodenburg, E.; Bryant, D.; Woodward, R. Environmental Indicators: A Systematic Approach to Measuring and Reporting on Environmental Policy Performance in the Context of Sustainable Development; World Resources Institute: Washington, DC, USA, 1995. [Google Scholar]
  29. ODonoghue, C.; Devisme, S.; Ryan, M.; Conneely, R.; Gillespie, P.; Vrolijk, H. Farm economic sustainability in the European Union: A pilot study. Stud. Agric. Econ. 2016, 118, 163–171. [Google Scholar] [CrossRef] [Green Version]
  30. Pannell, D.J.; Glenn, N.A. A framework for the economic evaluation and selection of sustainability indicators in agriculture. Ecol. Econ. 2000, 33, 135–149. [Google Scholar] [CrossRef]
  31. Hatai, L.; Sen, C. An economic analysis of agricultural sustainability in Orissa. Agric. Econ. Res. Rev. 2008, 21, 273–282. [Google Scholar]
  32. Campbell, H.; Fairweather, J.; Hunt, L.; McLeod, C.; Rosin, C. Social Dimensions of Sustainable Agriculture: A Rationale for Social Research in ARGOS; Agriculture Research Group on Sustainability: Christchurch, New Zealand, 2004. [Google Scholar]
  33. Bacon, C.; Getz, C.; Kraus, S.; Montenegro, M.; Holland, K. The social dimensions of sustainability and change in diversified farming systems. Ecol. Soc. 2012, 17. [Google Scholar] [CrossRef] [Green Version]
  34. Galdeano-Gómez, E.; Pérez-Mesa, J.C.; Godoy-Durán, Á. The social dimension as a driver of sustainable development: The case of family farms in southeast Spain. Sustain. Sci. 2016, 11, 349–362. [Google Scholar] [CrossRef]
  35. Lekić, O.; Gadžić, N.; Milovanović, A. Sustainability of rural areas. In Sustainability and Resilience Socio-Spatial Perspective; TU Delft Open: Delft, The Netherlands, 2018. [Google Scholar]
  36. Scott, K.; Park, J.; Cocklin, C. From “sustainable rural communities” to “social sustainability”: Giving voice to diversity in Mangakahia Valley, New Zealand. J. Rural Stud. 2000, 16, 433–446. [Google Scholar] [CrossRef]
  37. Eizenberg, E.; Jabareen, Y. Social sustainability: A new conceptual framework. Sustainability 2017, 9, 68. [Google Scholar] [CrossRef] [Green Version]
  38. Boyer, R.; Peterson, N.; Arora, P.; Caldwell, K. Five approaches to social sustainability and an integrated way forward. Sustainability 2016, 8, 878. [Google Scholar] [CrossRef] [Green Version]
  39. Munzel, A.; Meyer-Waarden, L.; Galan, J.-P. The social side of sustainability: Well-being as a driver and an outcome of social relationships and interactions on social networking sites. Technol. Forecast. Soc. Chang. 2018, 130, 14–27. [Google Scholar] [CrossRef]
  40. Woodcraft, S. Understanding and measuring social sustainability. J. Urban Regen. Renew. 2015, 8, 133–144. [Google Scholar]
  41. Dempsey, N.; Bramley, G.; Power, S.; Brown, C. The social dimension of sustainable development: Defining urban social sustainability. Sustain. Dev. 2011, 19, 289–300. [Google Scholar] [CrossRef]
  42. Åhman, H. Social sustainability–society at the intersection of development and maintenance. Local Environ. 2013, 18, 1153–1166. [Google Scholar] [CrossRef]
  43. Anand, S.; Sen, A. Human development and economic sustainability. World Dev. 2000, 28, 2029–2049. [Google Scholar] [CrossRef] [Green Version]
  44. Caulfield, J.; Polèse, M.; Stren, R. The social sustainability of cities: Diversity and the management of change. Can. Public Policy Anal. Polit. 2001, 27, 381. [Google Scholar] [CrossRef]
  45. Lupala, J.M. The social dimension of sustainable development: Social inclusion in Tanzania’s Urban centres. Curr. Urban Stud. 2014, 2, 350–360. [Google Scholar] [CrossRef] [Green Version]
  46. Missimer, M. The Social Dimension of Strategic Sustainable Development; Licentiate Dissertation Series; School of Engineering, Blekinge Institute of Technology: Karlskrona, Sweden, 2013. [Google Scholar]
  47. Biczyńska, E. Measuring rhe social component of sustainable development in the cities. The case of Medellin, Colombia. Barom. Reg. 2015, 13, 119–126. [Google Scholar]
  48. Windon, S. Assessing Ohio Farmers: Determining Factors That Affect Their Quality of Life, The Ohio State University. Master’s Thesis, The Ohio State University, Columbus, OH, USA, 2014. [Google Scholar]
  49. Sandbichler, M.; Kantelhardt, J.; Kapfer, M.; Moser, T.; Franzel, M. More Than Income Benefits? The Impact of Farm Investments on Farmers’ Perceived Quality of Life. Evidence from Austria. In 19th International Farm Management Congress; SGGW: Warsaw, Poland, 2013. [Google Scholar]
  50. Pigou, A.C. The Economics of Welfare, 4th ed.; Macmillan: London, UK, 1932. [Google Scholar]
  51. Malkina-Pykh, I.; Pykh, Y. Environmental Sustainability and Quality of Life: From Theory to Practice. Int. J. Sustain. Dev. Plan. 2016, 11, 853–863. [Google Scholar] [CrossRef]
  52. Mella, P.; Gazzola, P. Sustainability and Quality of Life: The Development Model. In Enterprise and competitive environment; Mendel University: Brno, Czechia, 2015. [Google Scholar]
  53. Böhnke, P. First European Quality of Life Survey: Life Satisfaction, Happiness and Sense of Belonging; Office for Official Publications of the European Communities: Luxembourg, 2005. [Google Scholar]
  54. Vesan, P.; Bizzotto, G. Quality of Life in Europe: Conceptual Approaches and Empirical Definitions; LABORatorio R. Revelli Working Papers Series; 108; LABORatorio R. Revelli, Centre for Employment Studies: Moncalieri, Italy, 2011. [Google Scholar]
  55. Pinto, S.; Fumincelli, L.; Mazzo, A.; Caldeira, S.; Martins, J.C. Comfort, well-being and quality of life: Discussion of the differences and similarities among the concepts. Porto Biomed. J. 2017, 2, 6–12. [Google Scholar] [CrossRef]
  56. Skevington, S.M.; Böhnke, J.R. How is subjective well-being related to quality of life? Do we need two concepts and both measures? Soc. Sci. Med. 1982 2018, 206, 22–30. [Google Scholar] [CrossRef] [Green Version]
  57. Dolan, P.; Peasgood, T.; Dixon, A.; Knight, M.; Phillips, D.; Tsuchiya, A.; White, M. Research on the Relationship between Well-Being and Sustainable Development; Final Report for Defra; Defra: London, UK, 2006. [Google Scholar]
  58. Murawska, A. Zmiany w poziomie i jakości życia ludności na obszarach wiejskich w Polsce. J. Agribus. Rural Dev. 2012, 3, 169–180. [Google Scholar]
  59. Cummins, R.A. Objective and subjective quality of life: An interactive model. Soc. Indic. Res. 2000, 52, 55–72. [Google Scholar] [CrossRef]
  60. Sirgy, M.J.; Rahtz, D.R.; Cicic, M.; Underwood, R. A method for assessing residents’ satisfaction with community-based services: A quality-of-life perspective. Soc. Indic. Res. 2000, 49, 279–316. [Google Scholar] [CrossRef]
  61. Arbuckle, J., Jr. Quality of life on the agricultural treadmill: Individual and community determinants of farm family well-being. J. Rural Soc. Sci. 2012, 27, 84–113. [Google Scholar]
  62. Haslauer, E.; Delmelle, E.; Keul, A.; Blaschke, T.; Prinz, T. Comparing subjective and objective quality of life criteria: A case study of green space and public transport in Vienna, Austria. Soc. Indic. Res. 2014, 124, 911–927. [Google Scholar] [CrossRef]
  63. Chase, L. Agritourism and quality-of-life for farmers. In Best Practices in Hospitality and Tourism Marketing and Management: A Quality of Life Perspective; Applying Quality of Life Research; Campón-Cerro, A.M., Hernández-Mogollón, J.M., Folgado-Fernández, J.A., Eds.; Springer International Publishing: Cham, Switzerland, 2019; pp. 337–352. [Google Scholar] [CrossRef]
  64. Ciura, G. Warunki życia ludności wiejskiej. Stud. BAS 2010, 4, 159–178. [Google Scholar]
  65. OECD. How’s Life? Measuring Well-Being; OECD Publishing: Paris, France, 2011. [Google Scholar]
  66. GUS. Warunki Mieszkaniowe w Polsce w 2017 r. Stan w Dniu 31 Grudnia 2017 r; GUS Informacje Sygnalne: Warsaw, Poland, 2018. [Google Scholar]
  67. Greenley, J.R.; Greenberg, J.S.; Brown, R. Measuring quality of life: A new and practical survey instrument. Soc. Work 1997, 42, 244–254. [Google Scholar] [CrossRef] [PubMed]
  68. Majewski, E. Dochody i jakość życia w gospodarstwach niskotowarowych z wybranych regionów polski. Rocz. Nauk Rol. 2009, 96, 122–129. [Google Scholar]
  69. Kalinowski, S.; Kiełbasa, B. Poziom życia ludności wiejskiej w polsce. Rocz. Nauk Ser. 2012, 14, 50–54. [Google Scholar]
  70. Quendler, E. Integrativer Ansatz Für Nachhaltiges, Gutes Leben–Ein Konzept; Agrarpolitischer Arbeitsbehelf; der Bundesanstalt für Agrarwirtschaft: Vienna, Austria, 2011. [Google Scholar]
  71. Diener, E.; Suh, E. Measuring quality of life: Economic, social, and subjective indicators. Soc. Indic. Res. 1997, 40, 189–216. [Google Scholar] [CrossRef]
  72. Pyka, A.; Prettner, K. Economic growth, development, and innovation: The transformation towards a knowledge-based bioeconomy. In Bioeconomy: Shaping the Transition to a Sustainable, Biobased Economy; Lewandowski, I., Ed.; Springer International Publishing: Cham, Switzerland, 2018; pp. 331–342. [Google Scholar] [CrossRef] [Green Version]
  73. Pezzey, J. Sustainability: An interdisciplinary guide. Environ. Values 1992, 1, 321–362. [Google Scholar] [CrossRef]
  74. Satterthwaite, D. Barbara Ward and the Origins of Sustainable Development; International Institute for Environment and Development (IIED): London, UK, 2006. [Google Scholar]
  75. Seyfang, G.; Jordan, A. The Johannesburg Summit and Sustainable Development: How Effective Are Environmental Mega-Conferences? In Yearbook of International Co-operation on Environment and Development; Stokke, O., Thommessen, O.B., Eds.; Earthscan: London, UK, 2002. [Google Scholar]
  76. Ward, B.; Dubos, R. The Care and Maintennance of a Small Planet; W.W Norton and Company: New York, NY, USA; London, UK, 1972. [Google Scholar]
  77. United Nations. The Sustainable Development Goals Report 2019; United Nations: New York, NY, USA, 2019. [Google Scholar]
  78. Rogall, H. Nachhaltige Ökonomie; Springer: Berlin, Germany, 2006. [Google Scholar] [CrossRef]
  79. Swain, R.B. A critical analysis of the sustainable development goals. In Handbook of Sustainability Science and Research; Leal Filho, W., Ed.; World Sustainability Series; Springer International Publishing: Cham, Switzerland, 2018; pp. 341–355. [Google Scholar] [CrossRef]
  80. Streimikiene, D. Quality of life and housing. Int. J. Inf. Educ. Technol. 2015, 5, 140–145. [Google Scholar] [CrossRef] [Green Version]
  81. Shafer, C.S.; Lee, B.K.; Turner, S. A tale of three greenway trails: User perceptions related to quality of life. Landsc. Urban Plan. 2000, 49, 163–178. [Google Scholar] [CrossRef]
  82. Klauer, B.; Baumgärtner, S. Operationalization of the Concept of Sustainable Development on Different Time Scales; Wirtschaftswissenschaftliche Fakultät, Universität Heidelberg: Heidelberg, Germany, 1998; pp. 175–194. [Google Scholar]
  83. Leslie, H.M.; Basurto, X.; Nenadovic, M.; Sievanen, L.; Cavanaugh, K.C.; Cota-Nieto, J.J.; Erisman, B.E.; Finkbeiner, E.; Hinojosa-Arango, G.; Moreno-Báez, M.; et al. Operationalizing the social-ecological systems framework to assess sustainability. Proc. Natl. Acad. Sci. USA 2015, 112, 5979–5984. [Google Scholar] [CrossRef] [Green Version]
  84. Sroufe, R. Operationalizing sustainability. J. Sustain. Stud. 2016, 1, 2469–9357. [Google Scholar]
  85. Mouysset, L.; Doyen, L.; Léger, F.; Jiguet, F.; Benton, T.G. Operationalizing sustainability as a safe policy space. Sustainability 2018, 10, 3682. [Google Scholar] [CrossRef] [Green Version]
  86. Elkington, J. Triple Bottom Line Revolution: Reporting for the Third Millennium. 1994. Available online: https://www.scienceopen.com/document?vid=7ef4b115-f046-435a-ae0e-d2cf1ab2ca8f (accessed on 5 November 2019).
  87. Riocerezo, C.; Álvarez-Esteban, R.; Fernández, P.; Hidalgo, C.; Revilla, I.; Aguirre, I.; Batalla, I.; Eguinoa, P. Quality of Live and Quality of Work Life in Organic Versus Conventional Farmers; Universidad de Sevilla. Departamento de Ciencias Agroforestales: Seville, Spain, 2014. [Google Scholar]
  88. Stanton, E. The Human Development Index: A History; Global Development and Environment Institute: Medford, MA, USA, 2007. [Google Scholar]
  89. Hamilton, K. Genuine saving as a sustainability indicator’. Environ. Dep. Pap. 2000, 10, 65–78. [Google Scholar]
  90. OECD. Society at a Glance 2009: OECD Social Indicators; OECD Publishing: Paris, France, 2009. [Google Scholar]
  91. OECD. OECD Key Environmental Indicators; OECD Publishing: Paris, France, 2008. [Google Scholar]
  92. OECD. Economic Policy Reforms 2019: Going for Growth; OECD Publishing: Paris, France, 2019. [Google Scholar]
  93. Ikerd, J.E. Two related but distinctly different concepts. Small Farm Today USA 1993, 10, 30–31. [Google Scholar]
  94. Saifi, B.; Drake, L. A coevolutionary model for promoting agricultural sustainability. Ecol. Econ. 2008, 65, 24–34. [Google Scholar] [CrossRef]
  95. Lowrance, R.; Hendrix, P.F.; Odum, E.P. A hierarchical approach to sustainable agriculture. Am. J. Altern. Agric. 1986, 1, 169–173. [Google Scholar] [CrossRef]
  96. Hayati, D.; Ranjbar, Z.; Karami, E. Measuring agricultural sustainability. In Biodiversity, Biofuels, Agroforestry and Conservation Agriculture; Lichtfouse, E., Ed.; Sustainable Agriculture Reviews; Springer Netherlands: Dordrecht, The Netherlands, 2011; pp. 73–100. [Google Scholar] [CrossRef]
  97. Briassoulis, H. Sustainable development and its indicators: Through a (Planner’s) glass darkly. J. Environ. Plan. Manag. 2010, 44, 409–427. [Google Scholar] [CrossRef]
  98. Röös, E.; Fischer, K.; Tidåker, P.; Källström, H.N. How well is farmers’ social situation captured by sustainability assessment tools? A Swedish case study. Int. J. Sustain. Dev. World Ecol. 2019, 26, 268–281. [Google Scholar] [CrossRef] [Green Version]
  99. Ma, C.; Zhang, M.; Fang, S. Rural poverty identification and comprehensive poverty assessment based on quality-of-life: The case of Gansu Province (China). Sustainability 2019, 11, 4547. [Google Scholar] [CrossRef] [Green Version]
  100. Janmaimool, P. Rural villagers’ quality of life improvement by economic self-reliance practices and trust in the philosophy of sufficiency economy. Societies 2016, 6, 26. [Google Scholar] [CrossRef] [Green Version]
  101. Prus, P. Farmers’ opinions about the prospects of family farming development in Poland. In Proceedings of the 2018 International Conference “Economic Science For Rural Development”, Jelgava, Latvia, 11 May 2018; pp. 267–274. [Google Scholar] [CrossRef]
  102. Källström, H.N. How Changes in Farmers’ Views of Quality of Life Bring about Structural Changes: The Case of Farming in Three Marginal Areas of Sweden. In Proceedings of the 4th European IFSA Symposium; International Farming Systems Association Europe Group: Uppsala, Sweden, 2002; pp. 505–511. [Google Scholar]
  103. Gasson, R.; Errington, A. The Farm Family Business; CAB International: Wallingford, UK, 1993. [Google Scholar]
  104. Carr, P.J.; Kefalas, M.J. Hollowing Out the Middle: The Rural Brain Drain and What It Means for America; Beacon Press: Boston, MA, USA, 2009. [Google Scholar]
  105. Chmielewska, B. Zmiany Jakości Życia Na Obszarach Wiejskich; In Konkurencyjność gospodarki w kontekście działań polityki społecznej; Instytut Ekonomiki Rolnictwa i Gospodarki Żywnościowej – PIB: Jachranka, Poland, 2016. [Google Scholar]
  106. Sikora, J. Poziom zadowolenia mieszkańców wsi z życia na wsi w świetle badań empirycznych. Stud. Obsz. Wiej. 2016, 41, 31–41. [Google Scholar] [CrossRef]
  107. Bernard, J. Rural quality of life–poverty, satisfaction and opportunity deprivation in different types of rural territories. Eur. Countrys. 2018, 10, 191–209. [Google Scholar] [CrossRef] [Green Version]
  108. Watson, P.; Deller, S. Economic diversity, unemployment and the great recession. Q. Rev. Econ. Financ. 2017, 64, 1–11. [Google Scholar] [CrossRef]
  109. Morgan, J.Q.; Lambe, W.; Freyer, A. Homegrown responses to economic uncertainty in rural America. Rural Realities 2009, 3, 16–28. [Google Scholar]
  110. European Parliament. Report on the Implementation of CAP Young Farmers’ Tools in the EU after the 2013 Reform; 2017/2088(INI); European Parliament: Brussels, Belgium, 2018. [Google Scholar]
  111. Levins, R.A.; Cochrane, W.W. The treadmill revisited. Land Econ. 1996, 72, 550–553. [Google Scholar] [CrossRef]
  112. GUS. Income and Living Conditions of the Population of Poland; Report from the EU-SILC Survey of 2017; GUS: Warsaw, Poland, 2018. [Google Scholar]
  113. Baer-Nawrocka, A.; Bartkowski, J.; Chmielewska, B.; Fedyszak-Radziejowska, B.; Frenkel, I.; Herbst, J.; Nurzyńska, I.; Poczta, W.; Wilkin, J.; Zegar, J.S. Polska Wieś 2018; Wilkin, J., Nurzyńska, I., Eds.; Raport o Stanie wsi; Fundacja na rzecz Rozwoju Polskiego Rolnictwa (FDPA): Warsaw, Poland, 2018. [Google Scholar]
  114. Uglis, J.; Kozera-Kowalska, M. Synthetic measure of rural area attractiveness for living, working and business activities–concept analysis and statistical evaluation. Ann. Pol. Assoc. Agric. Agribusiness Econ. 2019, 21, 275–284. [Google Scholar] [CrossRef]
  115. Murawska, A. Ocena poziomu życia w krajach Unii Europejskiej (UE-28) w aspekcie zrównoważonego rozwoju za pomocą wielowymiarowej analizy porównawczej. Metody Ilościowe w Badaniach Ekonomicznych 2014, 15, 80–90. [Google Scholar]
  116. GUS. Jakość Życia w Krajach Unii Europejskiej-Podstawowe Wskaźniki; GUS: Warsaw, Poland, 2015. [Google Scholar]
  117. Wawrzyniak, D. Standard of living in the European Union. Comp. Econ. Res. 2016, 19, 141–155. [Google Scholar] [CrossRef]
  118. Czapiński, J. Indywidualna jakość i styl życia. diagnoza społeczna. Warunki i jakość życia Polaków-raport. Contemp. Econ. 94 2015, 9, 200–331. [Google Scholar] [CrossRef]
  119. Razniak, A.W.; Razniak, P. Regional differences in the standard of living in Poland (based on selected indices). Procedia Soc. Behav. Sci. 2011, 19, 31–36. [Google Scholar] [CrossRef] [Green Version]
  120. Brambert, P.; Kiniorska, I. Changes in the standard of living in rural population of Poland in the period of the Eu membership. Eur. Countrys. 2018, 10, 263–279. [Google Scholar] [CrossRef] [Green Version]
  121. Zeliaś, A. Poziom Życia w Polsce i Krajach Unii Europejskiej; Polskie Wydawnictwo Ekonomiczne: Warsaw, Poland, 2004. [Google Scholar]
  122. Sobala-Gwosdz, A. The change in the rural standard of living during the transformation period in the podkarpackie province. Pr. Geogr. 2004, 114, 93–106. [Google Scholar]
  123. Rosner, A.; Stanny, A. Monitoring Rozwoju Obszarów Wiejskich; IRWiR PAN: Warsaw, Poland, 2014. [Google Scholar]
  124. GUS. Sytuacja Społeczno-Ekonomiczna Gospodarstw Domowych w Latach 2000–2015-Zróżnicowanie Miasto-Wieś; GUS: Warsaw, Poland, 2017. [Google Scholar]
  125. Marczyńska-Witczak, E. Changes in living conditions in Poland under economic transition. Int. Adv. Econ. Res. 1998, 4, 318–323. [Google Scholar] [CrossRef]
  126. Kovach, I. Jakość życia na wsi w 6 wybranych krajach postsocjalistycznych. Wieś i Rolnictwo 1997, 3, 75–87. [Google Scholar]
  127. Ruzevicius, J. Quality of Life and of Working Life: Conceptions and Research. In 17th Toulon-Verona International Conference; Liverpool John Moores University: Liverpool, UK, 2014. [Google Scholar]
  128. Kaplan, D. Structural equation modeling. In International Encyclopedia of the Social & Behavioral Sciences, 2nd ed.; Wright, J.D., Ed.; Elsevier: Oxford, UK, 2015; pp. 15215–15222. [Google Scholar] [CrossRef]
  129. Tarka, P. An overview of structural equation modeling: Its beginnings, historical development, usefulness and controversies in the social sciences. Qual. Quant. 2018, 52, 313–354. [Google Scholar] [CrossRef] [PubMed] [Green Version]
  130. Hox, J.; Bechger, T. An introduction to structural equation modeling. Fam. Sci. Rev. 1999, 11, 354–373. [Google Scholar]
  131. Sagan, A. Model Pomiarowy Satysfakcji i Lojalności. StatSoft Pol. 2003, 1, 75–85. [Google Scholar]
  132. Kaplan, D. Structural equation modeling; Sage Publishing: Madison, WI, USA, 2000. [Google Scholar]
  133. Spirtes, P. Latent structure and causal variables. In International Encyclopedia of the Social & Behavioral Sciences, 2nd ed.; Wright, J.D., Ed.; Elsevier: Oxford, UK, 2015; pp. 394–397. [Google Scholar] [CrossRef]
  134. Ye, J.; Chen, J.; Bai, H.; Yue, Y. Analyzing transfer commuting attitudes using a market segmentation approach. Sustainability 2018, 10, 2194. [Google Scholar] [CrossRef] [Green Version]
  135. Statistica Help. Structural Equation Modeling Results-Advanced Tab. Available online: https://documentation.statsoft.com/STATISTICAHelp.aspx?path=SEPATH/Indices/SEPATHAnalysis_HIndex (accessed on 21 November 2019).
  136. FADN. Wyniki Standardowe 2016 Uzyskane Przez Gospodarstwa Rolne Uczestniczące w Polskim FADN Część I; Wyniki Standardowe: Warsaw, Poland, 2017. [Google Scholar]
  137. FADN. Plan Wyboru Próby Gospodarstw Rolnych Polskiego FADN 2008 (Plan of Sampling for Polish FADN); IERiGŻ-PIB: Warsaw, Poland, 2008. [Google Scholar]
  138. Neyman, J. On the two different aspects of the representative method: The method of stratified sampling and the method of purposive selection. J. R. Stat. Soc. 1934, 97, 558–625. [Google Scholar] [CrossRef]
  139. Kalton, G. Introduction to Survey Sampling. Series: Quantitative Applications in the Social Sciences; SAGE Publications: Newbury Park, CA, USA; London, UK; New Delhi, India, 1983. [Google Scholar]
  140. Cochran, W.G. Sampling Techniques; John Wiley & Sons: New York, NY, USA; Chichester, England; Brisbane, Australia; Toronto, ON, Canada; Singapore, 1977. [Google Scholar]
  141. López-Ruiz, V.-R.; Alfaro-Navarro, J.-L.; Nevado-Peña, D. An intellectual capital approach to citizens’ quality of life in sustainable cities: A focus on Europe. Sustainability 2019, 11, 6025. [Google Scholar] [CrossRef] [Green Version]
  142. Stępień, S.; Muntean, A. Economic and social features of small-scale farms in Poland against a background of average results for agriculture. Roczniki Naukowe Stowarzyszenia Ekonomistów Rolnictwa i Agrobiznesu 2019, 21, 441–450. [Google Scholar] [CrossRef]
  143. Zagozdzon, P.; Kolarzyk, E.; Marcinkowski, J. Quality of life and rural place of residence in polish women—Population based study. Ann. Agric. Environ. Med. 2011, 18, 429–432. [Google Scholar]
  144. Bennett, K. An Exploratory Study of the Effects of Stress and Fatigue on Irish Farm Safety; Department of Psychology Dublin Business School: Dublin, Ireland, 2016. [Google Scholar]
  145. de Sa, J. How does housing influence our health? Health Found. 2017. Available online: www.health.org.uk/infographic/how-does-housing-influence-our-health (accessed on 5 November 2019).
  146. Bonnefoy, X. Inadequate housing and health: An overview. Int. J. Environ. Pollut. 2007, 30, 411–429. [Google Scholar] [CrossRef] [Green Version]
  147. Joreskog, K.G.; Sorbom, D. Advances in Factor Analysis and Structural Equation Models; Rowman & Littlefield Publishers: Lanham, MD, USA, 1984. [Google Scholar]
  148. Connaught, J. Moving to the Countryside Will Make you Happier and Less Stressed. Available online: https://www.worthingherald.co.uk/news/moving-to-the-countryside-will-make-you-happier-and-less-stressed-1-8755800 (accessed on 21 November 2019).
  149. Sulewski, P.; Kłoczko-Gajewska, A.; Sroka, W. Relations between agri-environmental, economic and social dimensions of farms’ sustainability. Sustainability 2018, 10, 4629. [Google Scholar] [CrossRef] [Green Version]
  150. United Nations. Report of the Open Working Group of the General Assembly on Sustainable Development Goals; United Nations publication: New York, NY, USA, 2014. [Google Scholar]
  151. Hayati, D.; Ranjbar, Z.; Karami, E. Measuring agricultural sustainability. In Biodiversity, Biofuels, Agroforestry and Conservation Agriculture; Lichtfouse, E., Ed.; Springer: Amsterdam, The Netherlands, 2010. [Google Scholar]
  152. Kelly, E.; Ryan, M.; Finn, J.; Hennessy, T. Farm-Level Indicators for Evaluating Sustainability and Emerging New Policy Topics; Flint Project; European Commission: Brussels, Belgium, 2015. [Google Scholar]
  153. Diazabakana, A.; Latruffe, L.; Bockstaller, C.; Desjeux, Y.; Finn, J.; Kelly, E.; Ryan, M.; Uthes, S. A Review of Farm Level Indicators of Sustainability with a Focus on CAP and FADN; Flint Project; European Commission: Brussels, Belgium, 2014. [Google Scholar]
  154. Gosetti, G. Sustainable agriculture and quality of working life: Analytical perspectives and confirmation from research. Sustainability 2017, 9, 1749. [Google Scholar] [CrossRef] [Green Version]
  155. Zhang, L.; Zhang, J. Impacts of leisure and tourism on the elderly’s quality of life in intimacy: A comparative study in Japan. Sustainability 2018, 10, 4861. [Google Scholar] [CrossRef] [Green Version]
  156. Elosua, P. Subjective values of quality of life dimensions in elderly people. A SEM preference model approach. Soc. Indic. Res. 2011, 104, 427–437. [Google Scholar] [CrossRef]
  157. Sarıçam, H. Life satisfaction: Testing a structural equation model based on authenticity and subjective happiness [otantiklik ve öznel mutluluğa dayali yaşam doyumunun yapisal eşitlik modeli ile test edilmesi]. Pol. Psychol. Bull. 2015, 46, 278–284. [Google Scholar] [CrossRef] [Green Version]
  158. Eurostat. Quality of Life Indicators-Material Living Conditions. Available online: https://ec.europa.eu/eurostat/statistics-explained/index.php?title=Quality_of_life_indicators_-_material_living_conditions&oldid=381390#Housing_conditions (accessed on 21 November 2019).
  159. Terano, R.; Mohamed, Z. Quality of life among farmers in selected granary areas in Malaysia. Eur. J. Soc. Sci. 2013, 41, 1450–2267. [Google Scholar]
  160. McCoy, M.; Filson, G. Working off the farm: Impacts on quality of life. Soc. Indic. Res. 1996, 37, 149–163. [Google Scholar] [CrossRef]
  161. Malhotra, S. Keynote lecture initiatives for doubling farmers income for income security & quality of life. In Proceedings of the Souvenir of Global Meet on Science and Technology for Ensuring Quality life, Uttar Pradesh, India, 26–30 November 2017. [Google Scholar]
  162. Rapsomanikis, G. The Economic Lives of Smallholder Farmers; Organization of the United Nations: Rome, Italy, 2015. [Google Scholar]
  163. Wu, H.; Wu, S.; Wu, H.; Xia, Q.; Li, N. Living arrangements and health-related quality of life in Chinese adolescents who migrate from rural to urban schools: Mediating effect of social support. Int. J. Environ. Res. Public Health 2017, 14, 1249. [Google Scholar] [CrossRef] [Green Version]
  164. Brew, B.; Inder, K.; Allen, J.; Thomas, M.; Kelly, B. The health and wellbeing of Australian farmers: A longitudinal cohort study. BMC Public Health 2016, 16, 988. [Google Scholar] [CrossRef] [Green Version]
  165. Ames, S.C.; Jones, G.N.; Howe, J.T.; Brantley, P.J. A prospective study of the impact of stress on quality of life: An investigation of low-income individuals with hypertension. Ann. Behav. Med. 2001, 23, 112–119. [Google Scholar] [CrossRef] [PubMed]
  166. Ribeiro, Í.J.S.; Pereira, R.; Freire, I.V.; de Oliveira, B.G.; Casotti, C.A.; Boery, E.N. Stress and quality of life among university students: A systematic literature review. Health Prof. Educ. 2018, 4, 70–77. [Google Scholar] [CrossRef]
  167. Windon, S.R.; Jepsen, S.D.; Scheer, S.D. Identifying the factors affecting Ohio farmers quality of life. J. NACAA 2014, 7, 40–45. [Google Scholar]
  168. Berntson, E.A.; Sparrow, H.O. Farm Stress: Its Economic Dimension, Its Human Consequences. Interim Report of the Special Study on Farm Safety and Farm Related Health Issues of the Standing Senate Committee on Agriculture and Forestry. 1993. Available online: https://sencanada.ca/content/sen/committee/371/agri/rep/farm-stress-e.htm (accessed on 12 November 2019).
  169. Parker, M. American Farmers Confront a Mental Health Crisis. Available online: https://www.bloomberg.com/news/articles/2019-03-20/america-s-farmers-call-for-help-as-debts-climb-to-1980s-levels (accessed on 21 November 2019).
Figure 1. Study area and localisation of Farm Accountancy Data Network (FADN) regions. (source: own elaboration based on [137]).
Sustainability 12 00148 g001
Figure 2. Theoretical model of the relationships between the components of farmers’ quality of life. (Source: own elaboration).
Sustainability 12 00148 g002
Figure 3. Path diagram for model assessing quality of life (coefficient, standard errors in parentheses, significant codes *** = p < 0.01; ** = p < 0.05; * = p < 0.10) (Source: own elaboration).
Sustainability 12 00148 g003
Table 1. Selected Data on the Dwelling Conditions of Households in Poland in 2000–2015 (%).
Specification2015Improvement in Percentage Points 2000–2015
Rural AreasUrban AreasRural AreasUrban Areas
central heating8286.725.612.1
water supply98.499.79.40.8
hot running water93.897.622.36.1
flush toilet95.198.420.53.7
bathroom94.175.418.75.3
Source: own study based on [124].
Table 2. The Number of Farms Interviewed According to the Production Types and Standard Output Groups.
Production TypeGroups of Standard Output (Thousands EUR)Total
4–2525–100>100
Crop farms514615112
Cattle farms180915276
Pigs farms25451989
Mixed farms84318123
Total34021347600
Source: own elaboration.
Table 3. Description of Variables Used in the Model of Farmers’ Quality of Life (QoL).
Latent VariableObserved VariablesCharacteristics of the VariablesScale of Measurement
Mental comfortStressAn aggregated variable—an average of farmer’s self-evaluated level of stress resulting from the following factors:
- current indebtedness;
- future indebtedness;
- work overload;
- not understanding legal requirements connected with farming;
- changes in law regulations;
- price volatility;
- weather hazards;
- pest hazards, plant and animal diseases.
Ordinal variable measured on a Likert scale from 0 (not stressed at all) to 6 (very stressed)
Free timeAn aggregated variable—an average self-evaluated by the farmer of their free time for the following activities:
- sleep and rest;
- going out to a restaurant or to a cinema;
- meeting with friends and family;
- deepening knowledge about farming;
- a few days’ holiday.
Ordinal variable measured on a Likert scale from 0 (completely no time for this activity) to 6 (plenty of time for this activity)
Economic situationIncomeThe level of farm income per person—a variable taken from the Polish FADN database.Ratio variable—income in PLN
Socioeconomic statusThe farmer’s self-evaluation of their socioeconomic status: is the farmer (in comparison to other villagers):
  • Poor;
  • Rather poor;
  • Rather not affluent;
  • Moderately affluent;
  • The most affluent.
Ordinal variable measured on a Likert scale from 1 to 5 according to the scale given on the left
Living conditionsHealthSelf-evaluation of the respondent’s health:
  • Very bad;
  • Rather bad;
  • Rather good;
  • Very good.
Ordinal variable measured on a Likert scale from 1 to 4 according to the scale given on the left
DistanceAn aggregated variable—an average from assessed time needed to get to the following institutions:
- doctor;
- closest hospital;
- primary school;
- secondary school;
- extension service;
- commune office;
- institution of culture (cinema, theatre).
Ratio variable-time (in minutes) needed to get to a chosen institution with a usual mean of transport
HousingThe farmer’s self-evaluation of the housing conditionsOrdinal variable measured on a Likert scale from 0 (very poor) to 6 (very good)
Source: own elaboration.
Table 4. Basic Characteristics of Qualitative Variables Used in the Analysis.
VariableFarmers’ Assessment * (% of farmers)Average
Level of stress according to a set of reasons Low level of stressMedium level of stressHigh level of stressAverage on a 0–6 scale
Current indebtedness7119101.54
Future indebtedness682581.78
Work overload5433132.38
Not understanding legal requirements5334122.41
Changes in law regulations2839333.49
Price volatility1144454.19
Weather hazards1345424.10
Pest hazards, plant and animal diseases2748253.45
Free time for a set of activities Not enough timeModerate amount of timeEnough timeAverage on a 0–6 scale
Sleep and rest2342353.63
Going out to a restaurant or to a cinema563492.17
Meetings with friends and family3047233.26
Deepening knowledge about farming3349173.08
A few days’ holiday3349173.08
Housing conditionsVery poor and poorAverageGood and very goodAverage on a 0–6 scale
1.338.660.14.69
AffluencePoor and rather poorModerately affluentThe most affluent
29674-
HealthVery bad and badRather goodVery good-
9.081.99.1-
* For simplicity, the original replies of the respondents on a 0–6 Likert scale were reduced according to the following rule: low ≤ 2; medium = 3 or 4; high ≥ 5. (Source: own elaboration)
Table 5. Basic Characteristics of Quantitative Variables Used in the Analysis.
VariableParameters of the Distribution
Lower QuartileMedianUpper QuartileAverageStd. Dev.
Income (PLN)15,26939,355105,319817,56.7136,338
Distance (access time in minutes)Doctor10101513.78.2
Closest hospital20303529.215.8
Primary school5101511.57.4
Secondary school15253026.315.6
Agricultural extension center15203025.715.7
Commune office10152014.47.4
Institution of culture (cinema, theatre)20304536.823.9
Source: own elaboration.
Table 6. Non-Centrality-Based Goodness-of-Fit Indices for Evaluating the Structural Equation Model.
SpecificationLower Bound of the Confidence Interval (90%)Point EstimateUpper Bound of the Confidence Interval (90%)
Population Non-centrality Parameter0.0020.0180.048
Steiger-Lind RMSEA Index (Root Mean Square Error of Approximation)0.0130.0390.063
McDonald’s Index of Non-centrality0.9760.9910.999
Population Gamma Index0.9870.9950.999
Adjusted Population Gamma Index0.9690.9880.999
Source: own computation carried out with SEPATH module of Statistica.
Table 7. Single Sample Goodness-of-Fit Indices for Evaluating the SEPATH Model.
SpecificationValue of Selected Indices
Akaike’s information criterion0.092
Joreskog’s GFI0.989
Joreskog’s AGFI0.975
Source: own computation carried out with the SEPATH module of Statistica.

