Analysis of China Commercial Banks’ Systemic Risk Sustainability through the Leave-One-Out Approach


1
Department of Finance, Beijing Jiaotong University, Beijing 100044, China
2
Department of Business and Economics, University of Cagliari, 74 09123 Cagliari, Italy
*
Author to whom correspondence should be addressed.
Sustainability 2020, 12(1), 203; https://0-doi-org.brum.beds.ac.uk/10.3390/su12010203
Submission received: 23 November 2019
/
Revised: 17 December 2019
/
Accepted: 23 December 2019
/
Published: 25 December 2019
(This article belongs to the Section Economic and Business Aspects of Sustainability)
Abstract
:One of the main issues in the recent Chinese financial reform is aimed at effectively measuring systemic risk and taking appropriate measures to ensure its sustainability and prevent new crises. In this paper, we firstly introduced the present macro-prudential policies implied in China and pointed out the existing problems. Secondly, we analyzed the banks’ assets riskiness and the banks’ probability to default, then, by means of a leave-one-out model, we measured each commercial bank systemic risk contribution. Thirdly, based on comprehensive empirical results and theoretical analysis, we provided some references for macro-prudential regulation and supervision. Results show that systemic risk is increasing in 2013–2017, in particular with reference to contagion risk, with a specific concentration within joint-stock commercial banks, suggesting a specific attention of regulators and supervisors for this category.
1. Introduction
As the 2008 financial crisis demonstrated, a single financial institution failure can have devastating consequences for the entire financial system and for the real economy, as the banking industry is closely connected to a country’s economic development.
As reported, among others, by Silva [1], there is a negative feedback mechanism between the financial sector and the real sector, so, banks’ systemic crises lead to a vicious cycle of fire sales and illiquidity diffusion, worsening the macro economy framework and banks’ asset quality, this inducing higher shares of non-performing loans, and the risk of more bank defaults.
After the global financial crisis, how to prevent systemic crisis has become one of the main issues under the attention of regulators. The concept of financial regulation and supervision changed from micro level (single banks) to the macro-prudential level (whole system). Thus, while Basel I and II were aimed at improving the safety and soundness of individual financial institutions from a micro perspective, the Basel III framework takes full account of the risk exposure of individual banks and their interbank linkages from a systemic perspective, in order to prevent the occurrence of a systemic financial crisis. Global systemically important financial institutions (G-SIFIs) have been identified to address issues that are ‘too big to fail’. G-SIFIs are defined by the Financial Stability Board (FSB) as “institutions of such size, market importance, and global interconnectedness that their distress or failure would cause significant dislocation in the global financial system and adverse economic consequences across a range of countries [2].’’ The Basel Committee on Banking Supervision (BCBS) identified systemically important financial institutions from five indicators: size, interconnectedness, market importance, fungibility, and global activity [3]. Bank of China, Agricultural Bank of China, Industrial and Commercial Bank of China, and China Construction Bank were considered as G-SIFIs in 2018 [4]. However, BCBS has only considered the identification of G-SIFIs, not yet fully resolved the system-level complexity, as to say, the role of interlinkages and correlation of risks among banks acting in the same market. In December 2017, the Basel committee revised Basel III, with additional modifications to leverage ratios and minimum capital requirements with the aim of improving the robustness and risk sensitivity of standardized models to credit risk and operational risk. In general, the direction of regulation is to focus on the standard minimum capital requirement computation model, and to further strengthen bank capital requirements, which is the cornerstone of the global banking post-crisis reform. For commercial banks, higher capital means stronger buffer capacity, thus a lower probability of default even in event of crisis, but a too high capitalization can induce a higher cost of capital, which typically turns into a credit crunch and/or in a higher cost of credit. Thus, the minimum capitalization level must be attentively evaluated, for correctly balancing the costs and benefits, as to say, of safety and efficiency of the banking system.
More, as explained in Llewellyn [5], bank business models are not static and evolve over time, influenced by a complex mix of exogenous and endogenous pressures, thus regulators are continuously adapting and revising the system regulations.
Although China suffered no large-scale financial crisis in recent years, risks in some industries are not negligible. In June 2013, a “money shortage” occurred in the interbank lending market, around 2014 some trust products defaulted, not only avoiding to regularly pay the expected coupons, but also failing to refund the principal debt. Risky events in the trust industry have raised social concerns about the safety of the financial market. In the past two years, P2P platform, a private micro-lending product belonging to Internet finance, registered more defaults than expected, harming the interests of many investors. In May 2019, due to the serious credit risk of Baoshang Bank, the China Banking and Insurance Regulatory Commission decided to take over for one year, in order to protect the legitimate rights and interests of depositors and other customers. Even rural and city business faced a significant liquidity crisis. Therefore, the regulatory authorities now attentively monitor the systemic risks accumulated in China’s financial market, and the assessment of the actual systemic risk sources by means of a proper measure can be particularly important to effectively reduce the probability of a systemic crisis to occur, and to evaluate its structure sustainability in the long term.
In this framework, the Chinese economy has entered a critical period of supply-side reform. The implementation of the three-go policy of “de-capacity, de-stocking, and de-leveraging” may lead to banks’ bad assets exposure in short, with nontrivial risks of banks’ default. According to the China Banking Regulatory Commission statistics, the commercial banks non-performing loans ratio increased from 1.00% in 2013 to 1.89% in 2018, showing a continuous upward trend. At the same time, there are serious maturity gaps between the assets and liabilities of commercial banks.
In the context of the China’s financial reforms and the continuous implementation of new asset management regulations, financing has tightened, default events have occurred frequently, and systemic risk have continued to accumulate, rising questions on its structure sustainability.
In this sense, the measurement of the banks’ assets riskiness, their probability to default, and the contribution to systemic risk here reported, can provide a useful tool for regulators and supervisors to monitor these risks and possibly develop new regulation on this topic. At present, in China’s financial industry, risks are not negligible, systemic risks tend to rise, and financial institutions are increasingly connected. The failure of some financial institutions may cause great losses in the entire financial system due to the inter-institutional contagion effect, which will be very detrimental to the sustainable development of China’s economy, which would encourage the implementation of comprehensive macro-prudential regulatory policies.
Since 2016, China has implemented MPA (macro-prudential assessment), shifting the focus of supervision to broad credit, and assessing banks from seven aspects, including capital and leverage, balance sheet situation, liquidity, pricing behavior, asset quality, cross-border exposure risk, and credit policy implementation. MPA splits domestic financial institutions into three categories, namely, national systemically important institutions, regional systemically important financial institutions, and general institutions.
Under the international background that macro-prudential regulation has become the core content of global financial governance, China’s macro-prudential regulation is making steady progress, but some problems have been exposed, including the identification and measurement of systemic risks. Firstly, financial information is not statistically complete, which makes it impossible to comprehensively assess systemic risks. To fill the information gap and accelerate the integration and standardization of financial statistics has become the top priority. Second, regulatory policies are mostly targeted at individual banks and lacking a comprehensive supervision of the entire financial system. Moreover, there is a lag in financial regulation, as typically regulators introduce relevant policies and measures to protect the interests of investors only after the occurrence of serious problems in emerging financial products, such as the P2P case. Finally, the financial institutions resolution and recovery mechanism has not been improved. The reason for establishing a more specific bankruptcy exit mechanism is the risks of moral hazard, since, if the state always protects financial institutions from bankruptcy, the financial institutions will be prone to take excessive risks and expansion, determining a threatening accumulation of systemic risks.
The 19th China Financial Work Conference pointed out that preventing and controlling financial risk and avoiding systemic financial crises had become the main stream of financial supervision. Under the background of de-leveraging and risk prevention, how to measure the systemic risk of China’s commercial banks and provide a reference for effective control in the post-crisis era, is a conducive way for regulators to develop macro-prudential policies, rising important research questions.
To participate in resolving these issues, this paper, based on a simulation model which includes both correlation and interbank exposures, and based on the leave-one-out approach, assessed the systemic risk and contagion effect of 25 listed commercial banks in China (Listed commercial banks are divided into four categories. Large state-owned banks: Industrial and Commercial Bank of China, China Construction Bank, Agricultural Bank of China, Bank of China, Bank of Communications; Joint-stock banks: China Merchants Bank, China CITIC Bank, Shanghai Pu dong Development Bank, Min Sheng Banking, Industrial Bank, China Everbright Bank, Hua Xia Bank, Ping An Bank; City commercial banks: Bank of Beijing, Bank of Nanjing, Bank of Ningbo, Bank of Jiangsu, Bank of Guiyang, Bank of Hangzhou, Bank of Shanghai; Rural commercial banks: Bank of Jiangyin, Bank of Wuxi, Bank of Zhangjiagang, Bank of Changshu, Bank of Wujiang.), and analyzed the financial regulatory policies in China, finding that systemic risk is increasing in 2013–2017, in particular with reference to contagion risk, with a specific concentration within joint-stock commercial banks, suggesting a specific attention of regulators and supervisors to this category.
The rest of the paper is organized as follows: In the second section, we outline a revision of the systemic risk metrics and of the results of previous literature; in the third section we present the methodology for measuring China’s commercial banks’ systemic risk contribution, defining the leave-one-out model and the variables involved, combined with the description of China’s financial market specificities; the fourth part reports the data and results, including a descriptive statistical analysis individually for large state-owned banks, joint-stock banks, city commercial banks, and rural commercial banks. The last section is the conclusion, which also provides a reference basis for the “post-crisis” era of China’s systemic risk prevention and effective control.
2. Literature Review
The Chinese banking system has been analyzed by different points of view. In his evaluation of the profitability of the Chinese main banking categories, Tan [6] found that state owned banks and city commercial banks have higher profitability than joint-stock banks, and that, in the same time span, “the risk conditions in the Chinese banking sector over the period 2003–2006 were highly volatile”.
In their analysis of Chinese macroprudential policy and banks risk taking based on 231 commercial banks from 2003 to 2016, Zhang et al. [7] highlight the important role of implementing Chinese macroprudential supervision, for reducing banks risk taking, and mitigating financial system vulnerabilities.
Ji et al. [8] pay close attention to the Chinese financial structure and systemic risk of banks and find that the financial structure towards a more market-based structure can reduce the systemic risk of the banking sector.
In their paper on contagion risks based on the Shanghai stock exchange data, Dai et al. [9] reported that “At present, the research of Chinese Banks’ risk transmission characteristics is still lack of systemic measure”.
The core problem in implementing macro-prudential regulations within the financial system is devising an effective measure of systemic risk, so risk measurement methods have become one of the main research issues in this field. The earliest measure of systemic risk is the early warning method proposed by Frankel and Rose in 1996 [10] and the comprehensive index method proposed by Illing and other scholars [11,12,13]. International financial regulators mostly adopted the indicator method. For example, Basel III [14] required commercial banks to hold sufficient liquid assets and establish liquidity coverage ratio (LCR) and net stable capital ratio (NSFR) to monitor the liquidity risk of commercial banks.
Brunnermerier et al. [15], starting from the evidence that commercial banks business models are mainly based on deposits and loans with individuals and enterprises, characterized by “short deposits and long loans” and, subsequently, prone to liquidity gaps, set the weights of the bank’s assets and liabilities through indicators such as the national debt discount rate, to compute the liquidity mismatch gap of commercial banks and obtain a liquidity mismatch index (LMI). Bai et al. [16] further refined the weight setting method of LMI model indicators, for measuring the size of liquidity risk. Adrian and Brunnermeier [17] proposed the conditional value at risk (CoVaR) model, based on the tail association of financial institution’s rate of return, and the derived ΔCoVaR to measure the systemic risk contribution of a single financial institution. Since the CoVaR method is not additive, Acharya et al. [18] proposed the systemic expected shortfall (SES) model to measure each financial institution’s contribution to systemic risk. SES includes the institution’s leverage and its marginal expected shortfall (MES). Brownlees and Engle [19,20] proposed the systemic risk index (SRISK), a function of the degree of leverage, size, and MES of a firm. SRISK measures the capital shortfall of a firm conditional on a severe market decline, providing early warning signals of possible distress. He et al. [21] based on the principal components quantile regression method to construct a comprehensive systemic risk index that aggregates information from 15 popular measures of systemic risk, and the index is able to provide an accurate forecast of macroeconomic shocks in China.
The systemic crisis can come from a huge default event, or many smaller default events and their contagion effects, as the interconnections among financial institutions create potential channels for contagion and amplification of shocks to the financial system. Thus, the measurement of systemic risk should include the risk of spillover effects of other banks’ defaults coming through the interbank exposures, and the correlation of results due to the common exposure to macro variables of commercial banks.
For analyzing these effects, another stream of literature developed the study of mechanisms and channels of financial contagion, to model and simulate the possible outcomes of a crisis. Along these lines, Allen and Gale [22]’s pioneering research on the risk of contagion effect between banks, based on simple network structure, found that when a department presented risks it would accelerate the spread of risks among related departments, and that risks were more easily transmitted among financial institutions with sparse network structure. Since then, the network approach was developed by many other researchers [23,24,25].
Based on this approach, there are some scholars who analyzed the interconnections among financial institutions from the international outlook. Daly et al. [26] used bank samples from twenty countries including all G8 (Canada, France, Germany, Italy, Japan, Russia, the United Kingdom and the United States) and BRICS (Brazil, Russia, India, China, South Africa) countries to investigate the contagion risk from the global banking level. Three different distance (distance to default, distance to capital, and distance to insolvency) were measured to show that systemic risk in-between global economies must take strict steps to ensure minimal transference. Chen et al. and others [27,28,29,30,31] have also studied the global systemic risk contribution.
Focus on the Chinese systemic risk contagion channels [32,33,34]. By means of the hyperlink-induced topic search algorithm (HITS), Gao et al. [35] analyzed the level of China bank’s systemic risk. Xu et al. [36] developed the LASSO-CoVaR approach (the least absolute shrinkage and selection operator method into the CoVaR estimation) to measure the systemic risk of Chinese financial institutions and contagion channels from the perspective of network. Results showed the network interconnectedness increased significantly during the stock market crash and the contagion risk cannot be ignored. Sun [37] investigated the contagion risk of Chinese commercial banking system and result showed the contagious risk is trivial, whereas the amplification effects (snowball effects) of losses through the channel of interbank networks are non-trivial.
Other studies developed the simulation approach by Allen and Gale (2000) [22] to have more realistic estimations. In this line, De Lisa et al. [38] developed a Monte Carlo simulation model for estimating the loss distribution of a deposit insurance scheme (DIS), showing that the Italian DIS can cover 98.96% of potential losses. Due to the model flexibility (then identified as systemic model of banking originated losses, or SYMBOL), it was subsequently adopted by the European Commission as a standard tool for testing and back testing the banking regulation proposals and directives. Zedda and Cannas [39] furtherly developed this approach, for measuring each financial institution’s systemic risk contribution through the leave-one-out model, splitting it into the stand-alone and contagion risk factors, and analyzing the role of significant variables in the balance sheet as systemic risk determinants.
A comprehensive study of financial systemic risk papers showed that most models adopted in literature (as like ΔCoVaR, SES and, in part, SRISK) are based on high-frequency data coming from the financial market. Although they can timely and accurately reflect the magnitude of systemic risk as currently perceived by the financial market, these models implicitly rely on the markets’ capability to detect and reflect financial instability risks. However, in recent years, a large number of scholars like Liu et al. and others [40,41] believed that securities prices in China’s financial market are mispricing, that is, the prices of stocks cannot truly reflect their intrinsic value. Securities price and their volatility distortion weaken the rationality of this kind of method, in particular when measuring China’s systemic risk. Therefore, at this stage, the current development of China’s financial market suggests to rely on other information sources.
The leave-one-out model proposed by Zedda [39,42] being based on the bank’s balance sheet values proved to be more accurate and appropriate for analyzing China’s banking system. The basic idea behind the leave-one-out approach is that the marginal effects of the bank on systemic risk can be obtained by comparing the performance of the entire banking system to the performance of the same system excluding the bank under consideration.
The leave-one-out contribution also splits systemic risk into two parts, namely stand-alone risk and contagion risk, where the first represents the expected losses that each bank as such, unrelated to the system, can suffer due to idiosyncratic shocks, while the second (contagion risk contribution) measures the risk of a shock to be spread through interbank market. Considering that this method identifies contagion risk, overcoming the limitations of traditional research methods, and that, through the Monte Carlo simulation, the systemic risk of commercial banks can be adequately measured, in this paper we selected the leave-one-out model as suitable for assessing China’s systemic financial risk.
3. Methodology
The leave-one-out model allows measuring the systemic risk of commercial banks on the basis of the subjacent SYMBOL model, proposed by De Lisa et al. [38], initially used to simulate the loss distribution of the deposit insurance scheme, and later adopted by the European Commission to evaluate bank-related policies [43,44,45] and for assessing the possible effects of banking crises on public finances stability [46,47,48,49,50].
The first step in the SYMBOL model is to compute the commercial bank implied obligor probability of default (IOPD), which is obtained by inverting the Basel internal rating–based function (FIRB).
The capital requirement (CR) commercial banks have to store for a unitary exposure is given by the FIRB formula as it follows:
where is the estimate by bank i of the k counterpart probability to default, is the loss given default of the same counterpart, is the exposure residual maturity, and and are functions of given by:
where is the size of the borrowing firm.
The total capital requirement for commercial banks are then obtained as the sum of each credit capital requirement ratio multiplied by its amount :
Even if we have no details on each credit asset, but only on the total capital requirement (which is reported on each bank balance sheet), on the base of his value and of the total assets, and fixing the other variables at their standard values, namely LGD = 0.45, M = 2.5, and S = 50, and inverting the Formula (1) we can obtain a proxy of each bank’s assets average riskiness, given by:
where is the capital requirement for bank i, and reminding that:
where is the value of bank i total assets.
The second step of the SYMBOL model is the Monte Carlo simulation. The higher the number of simulations, the closer the loss distribution to the real banking system. For each simulation j, the loss of commercial banks is also based on the Basel FIRB function, setting here also the other variables at their standard values, and replacing the unexpected loss threshold (which in the FIRB formula is set at 99.9%) by the random variable , representing the possible shocks the bank can suffer, and correlated at 50% among banks:
The third step in the SYMBOL model is to check if any bank defaults from idiosyncratic shocks. When the loss suffered by bank i is greater than the bank’s total capital , the bank defaults:
The fourth step of the model refers to contagion: as the defaulted bank will not be able to repay the interbank liabilities, the remaining banks will be affected by the contagion effect. One of the main limits in this approach is due to the lack of information on the bank to bank exposures matrix, which are not known. It is thus necessary to base our estimation on the total credits and debts on the interbank market, which are reported in the bank’s balance sheet, and on the maximum diversification (or entropy) hypothesis. On this base, if bank i defaults, the h bank’s losses due to interbank lending can be proxied by its share of the interbank credits, as follows:
where is the debt exposure of bank i in the interbank market, and is the credit asset exposure of bank h. In case of more defaults, the total loss of bank h due to interbank contagion effects are:
The losses of bank h are the losses from the idiosyncratic shocks, plus the losses from interbank contagion. In addition, we examine whether other banks have failed due to the interbank contagion effect, repeat the above steps until no bank has failed or all banks have failed, and establish the final bank loss matrix, for obtaining the loss distribution for the whole system.
Based on the SYMBOL model reported in the previous paragraphs, the leave-one-out model develops a novel approach for measuring the systemic risk contribution of each bank. In short, the idea is to compare the performance of the whole system, with the performance of the same system when one bank is left out. In this way, it is possible to correctly measure the systemic effect of each bank to the system.
More formally, let denote the expected loss of the banking system, and denote the total expected loss of the banking system when the bank h is left out. The difference between L and can be split in two parts, namely the stand-alone risk contribution , and the contagion risk contribution , as follows:
In the above formula, high values of denote commercial banks with important risk transmission, but may also be negative, indicating the commercial banks which can absorb some losses coming from other banks’ defaults, without defaulting and passing more losses to the system.
As the summation of the right sides of the above equation for all banks does not equal the total systemic risk of the considered banking system, to obtain an additive measure it is possible to rescale the values as follows:
In this case, the total systemic risk contribution of bank h is given by:
As expressed in Equation (13), the total risk contribution of a single bank to the banking system consists of two components, stand-alone risk contribution and contagion risk contribution. Stand-alone risk contribution represents the expected loss when a single bank is not connected to the whole banking system, not considering contagion risks. Contagion risk contribution instead measures the risks coming from the interbank linkages as contagion channel. Thus, the leave-one-out method provides important information for supervision and regulation, detailing each bank’s risk contribution (micro level) to systemic risk (macro level).
4. Data and Results
The analysis is developed on a sample of 25 Chinese listed banks, classified as large state-owned banks, joint-stock banks, city commercial banks, and rural commercial banks, data coming from Orbis Bank Focus database, for 2013–2017. Table 1 reports the total value for each of the considered years, in terms of total assets (TA), total capital (TC), risk-weighted assets (RWA), and the incidence of interbank assets (IB+) and interbank liabilities (IB−).
The total assets of the sample account for about 60% of the total assets of the Chinese banking system, so it can give a realistic approximation of the whole banking system. From 2013 to 2017, the total assets value (TA) increased by 51.67%, denoting an important expansion, higher than the GDP growth, (which scored a +30.7% in the same time span, data coming from Workdbank accompanied by the synchronous increase of risk-weighted assets (RWA), of capitalization (TC) and of interbank liabilities (IB-), while interbank credits (IB+) show in the same time span a progressive reduction from 10.39% of 2013 to 5.64% of 2017. The same variables are reported for each of the four bank categories in 2017 in Table 2.
From the above table, we can see that the total assets of state-owned banks are significantly higher than the other three types of banks, 165.49 times that of rural commercial banks. There are small differences in the ratio of interbank assets to total assets among the four types of commercial banks, the largest being city commercial banks. In terms of interbank liabilities, joint-stock commercial banks hold relatively more interbank liabilities.
4.1. IOPD and Bank PD
Table 3 shows two different risk measures. The first is the implicit obligor probability to default (IOPD), or the average riskiness of the bank’s assets, obtained by inverting the internal rating-based function (FIRB). This measure is based on the banks’ risk weighting, thus including the expected probability to default of each asset, also based on the economic framework expectations. The second measure is the bank probability to default (Bank PD), obtained by means of Monte Carlo simulation in two different ways, including (with contagion) or not including (without contagion) the additional risk coming from interbank exposures. Around 10 million Monte Carlo simulations were conducted to obtain 100,000 cases with at least one bank default.
From the table above, we can see that the IOPD (assets riskiness) ranges from the minimum value of 0.461% of China Merchants Bank, to the maximum value of 0.974% of China CITIC Bank, showing that Chinese banks business models are quite diversified. Without considering the interbank lending market, the average bank PD is 0.0367%, which is significantly different from the case of contagion which scores 0.0426%. Among the considered banks, with or without contagion, the largest bank PD is of Ping An Bank (0.0794% with contagion and 0.0689% without contagion), and the smallest is of China Construction Bank (respectively of 0.0208% and 0.0186%).
With reference to the relationship between the IOPD and bank PD, Table 4 reports the correlation coefficient between the two risk measures, bank size (LN(TA)) and excess capital, defined as the actual capital divided by the minimum capital requirement.
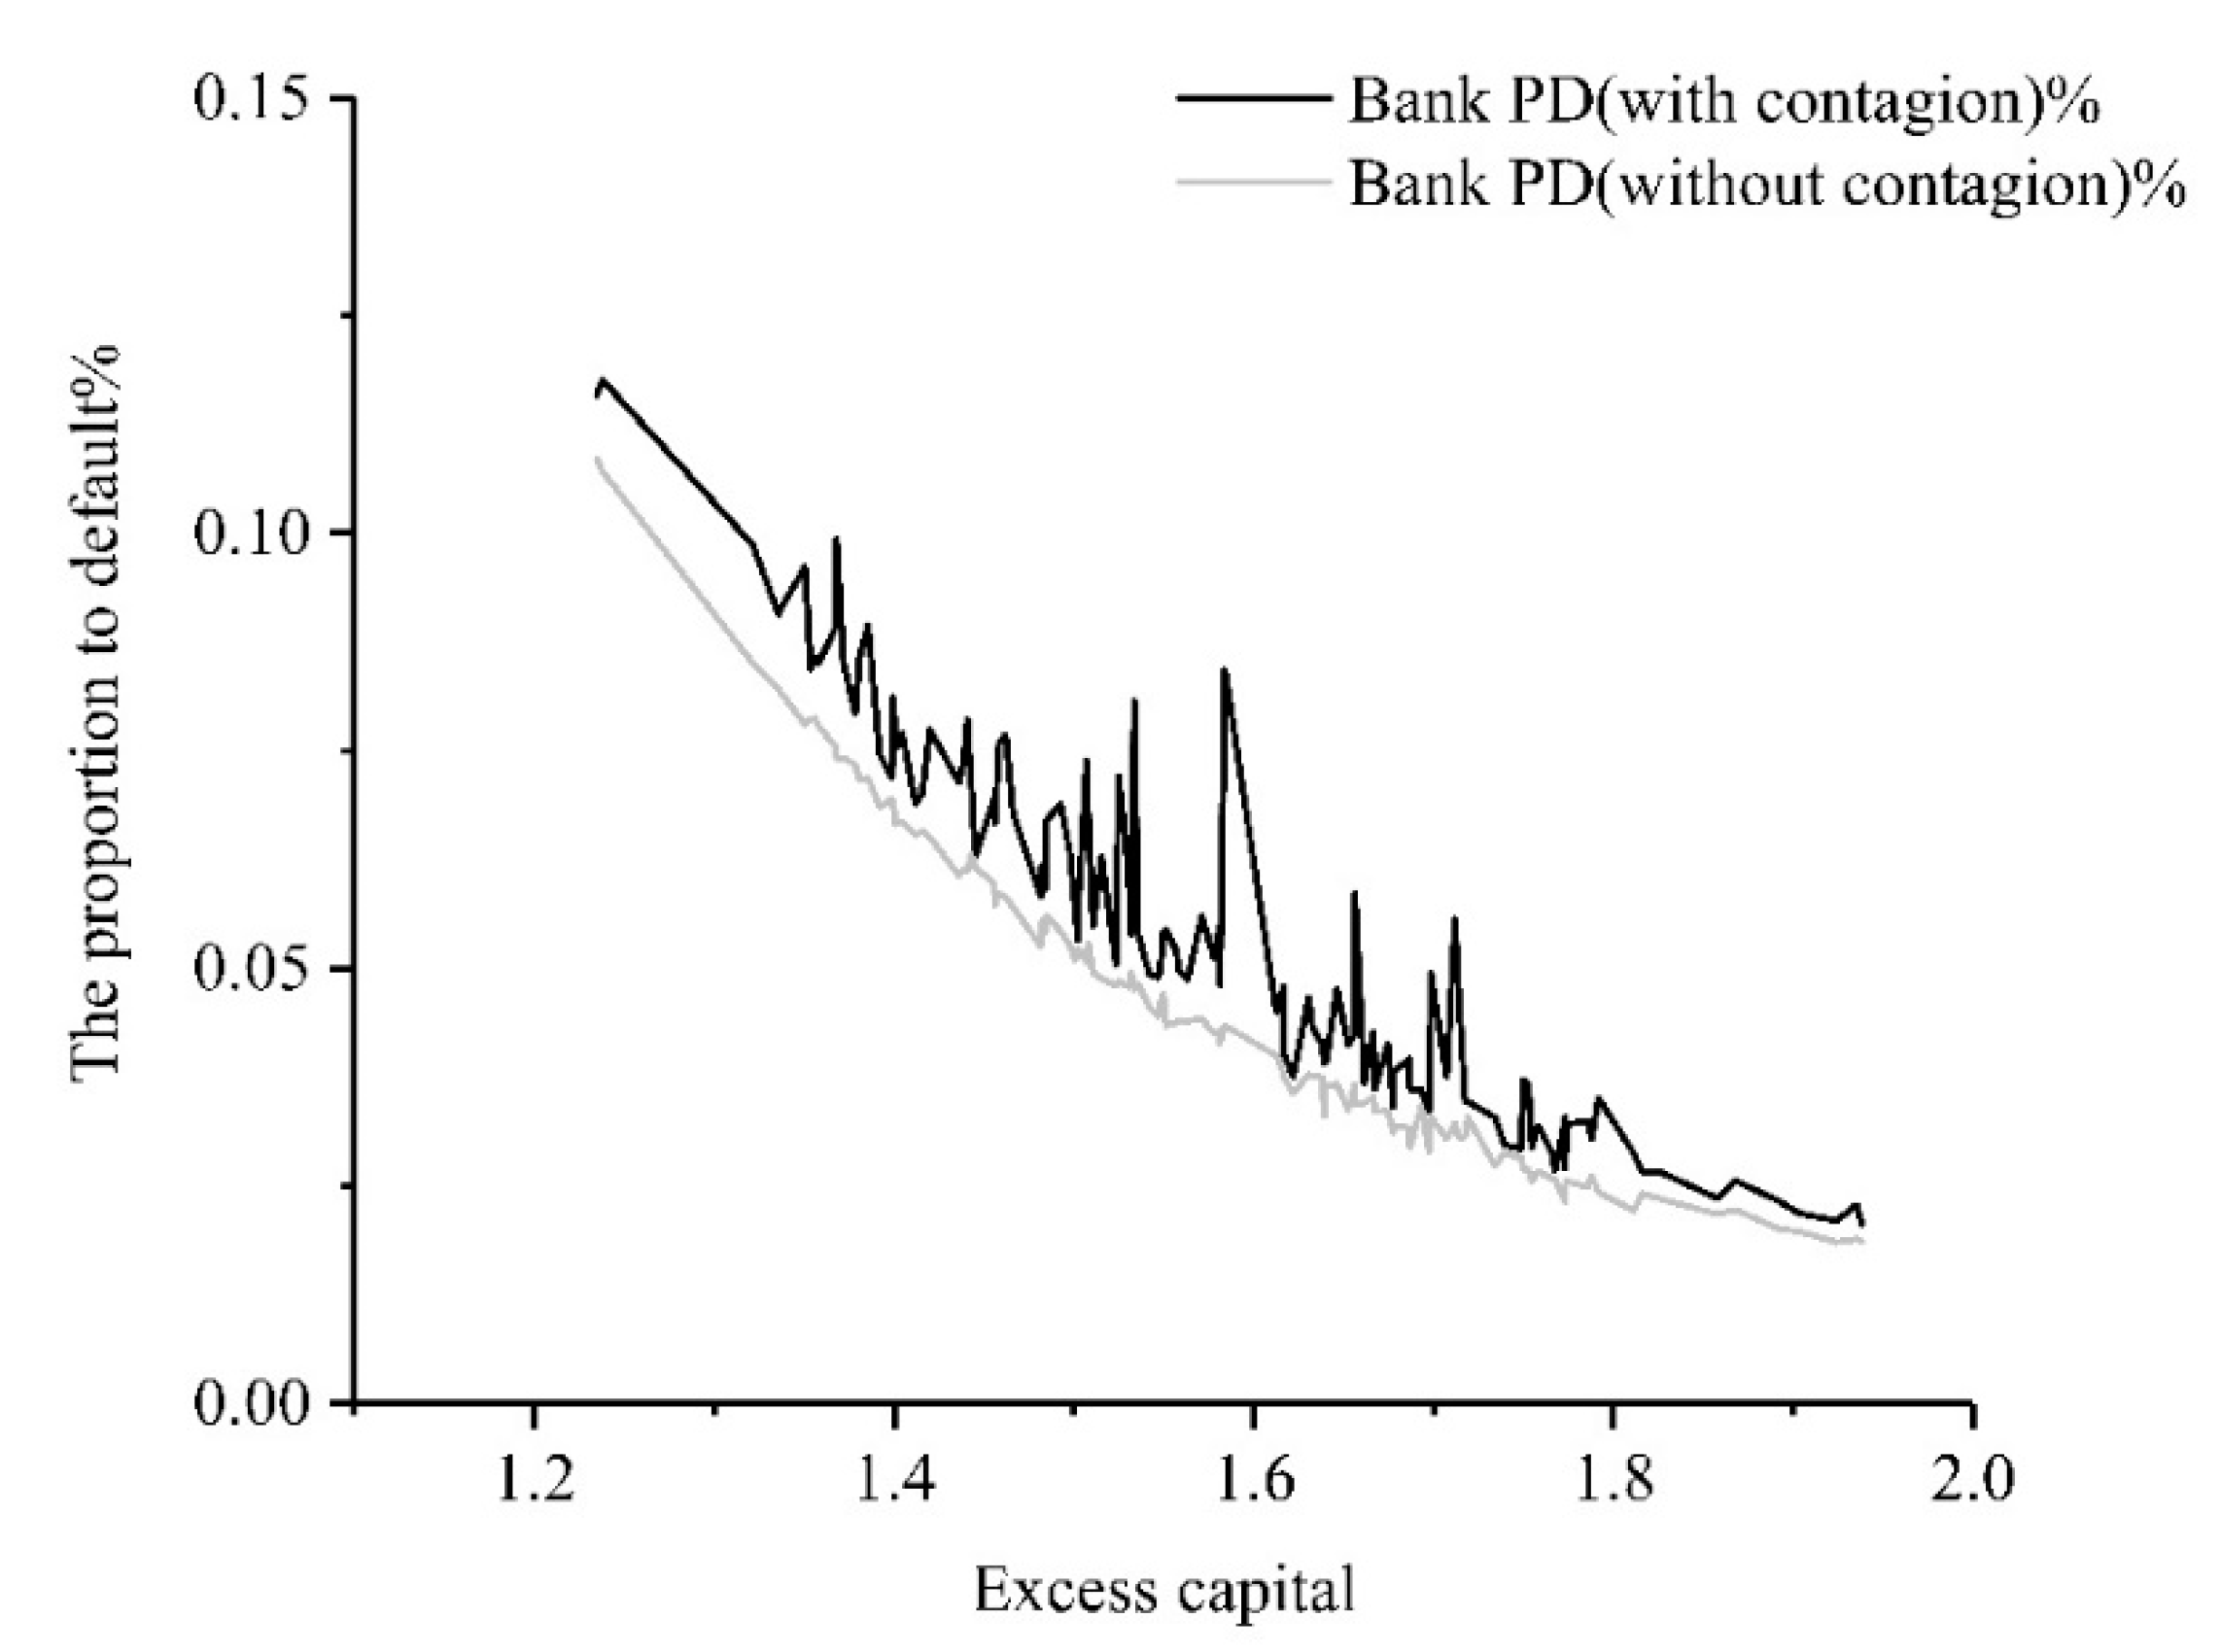
The above table shows that the IOPD of commercial banks has a positive correlation with the bank PD, as expected, and is negatively correlated with the bank size, even if the correlation coefficient is very small. As expected, we find that both IOPD and bank PD are negatively correlated with excess capital, confirming that the increase of excess capital can significantly reduce the probability to default of commercial banks. A more detailed description of the relationship between probability of default and excess capital, is shown in Figure 1 below:
Figure 1 shows that as the excess capital increases, the bank PD shows a downward nonlinear reduction, both when considering contagion or not, reflecting its capital capability to absorb the losses possibly coming from its assets. A more detailed reference of the banks with a bank PD over 0.1% (the Basel II minimum coverage threshold) is reported in the following Table 5.
It is interesting to note that all cases reported in Table 5 refer to joint-stock banks, (with the only exception of Bank of Beijing, which is a city commercial bank), suggesting a specific attention of supervisors and regulators on this category, in particular, monitoring capital indicators so to further reduce the probability of systemic crises.
4.2. Systemic Risk Contribution Estimation for Commercial Banks
Based on the leave-one-out model, we measured the systemic risk of China commercial banks from 2013 to 2017, and analyzed the changes of systemic risk over time, as shown in the following Table 6.
From the above table, we can find that the total systemic risk did not have a significant trend, its largest value is registered in 2016, when both stand-alone and contagion risk registered temporary high values, which went back around the average in the next year, while the stand-alone risk reached its highest value of 1.064 billion RMB yuan in 2013.
With reference to the share of total systemic risk attributed to stand-alone risk and contagion risk, Table 7 shows that contagion risk had an upward trend, from 20.93% in 2013 to 23.52% in 2016, with a decrease to 22.05% in 2017, determining a total increase in 2013–2017 of 5.35%.
Table 7 also shows that contagion risk accounts for more than 20% of the total systemic risk, which further demonstrates the importance of considering the contagion risk when measuring the systemic risk of commercial banks. At the same time, the rising trend of contagion risk indicates that regulators should not only consider the stand-alone risk of individual institutions, but also pay more attention to preventing the contagion risk caused by the interconnection of banks’ balance sheets.
For a more detailed analysis, the sample is split by categories, for state-owned banks, joint-stock banks, city commercial banks, and rural commercial banks, as shown in the following Table 8.
The values in Table 8 show that the stand-alone risk contribution of state-owned commercial banks and joint-stock banks are higher than city commercial banks, with a minor role for rural commercial banks, partially reflecting their assets share, but accounting for about 50% of the total stand-alone risk, while their proportion of the total assets in the sample is of about 66%.
Joint-stock commercial banks instead account for about 40% of the total systemic stand-alone risk, while their assets share in the same sample is around 27%, resulting in the riskier category, while city commercial banks and rural commercial banks’ role is much lower.
Table 8 and Table 9 show that contagion risk results as the main determinant of total systemic risk contribution of joint-stock commercial banks from 2013 to 2016, reporting the highest and more diversified values, and showing that even relatively safe banks (with lower stand-alone risk) may be important risk vectors in case of contagion. Even during the whole considered time span, joint-stock commercial banks report consistently positive contributions to contagion risk, while the contagion risk contribution of the other categories, and in particular of state-owned commercial banks, is negative (except for the state-owned ones in 2017) reporting that contagion risk is in fact concentrated on joint-stock banks, and possibly related to their relatively large size of interbank liabilities, which makes the interbank linkages more exposed to this risk factor.
Finally, Table 10 reports the total systemic risk contribution for the four commercial banks categories during 2013–2017, furtherly evidencing that within the Chinese banking system, the main risk relies in joint-stock commercial banks, while state owned banks report a relatively lower systemic risk contribution despite their larger share of total assets.
Since joint-stock commercial banks have proved to be a higher contribution to systemic risk, we further analyzed the risk contribution of each of the banks in this category, namely China Merchants Bank, China CITIC Bank, Shanghai Pudong Development Bank, China Min Sheng Bank, Industrial Bank, China Everbright Bank, Hua Xia Bank and Ping An Bank, reported in the following Table 11.
Among the considered banks, values are highly diversified, Industrial Bank, Shanghai Pudong Development Bank, and China Min Sheng Bank scoring the highest contribution, respectively, accounting for 71.78%, 63.99%, and 46.41%, while China Merchants Bank showed the lowest contagion risk contribution, with a negative value of −64.95%. Regulators should focus on these joint-stock banks with higher systemic risk contribution to ensure the sustainability of China’s financial system.
5. Conclusions
This paper developed the analysis of China’s banking system riskiness evolution from 2013 to 2017, by means of a sample of 25 listed banks. Within this time span, China recorded an important economic growth, and its banking system evolution followed a similar path, growing in credit volumes to sustain this trend. As typically happens in similar cases, the important growth is not balanced within sectors and areas, and this occurred within the Chinese banking system, where different banking categories, and different banks within each category, evolved in different ways and recorded different results. Our results show that in recent years, the proportion of contagion risk has increased year by year, reporting different systemic risk contribution levels for the different bank categories.
More specifically, the joint-stock commercial banks resulted in being the highest contributors to systemic risk, especially in terms of contagion risk. This can be related to their higher flexibility and attitude to sustain financial innovation. But if these risks are not adequately monitored and covered, they could possibly trigger or support and amplify a systemic financial crisis. Thus, for such banks, a strengthening of internal control and supervision, and a great attention in measuring the risk related to each operation is suggested for maintaining its sustainability on the long term.
Capital is widely regarded as a buffer against the risks commercial banks face [51,52,53], and it can be used as the core reference to prevent higher risks and keep the banking system safe and sound. The deep differences recorded by different bank categories also suggest an attentive and tailored approach with reference to the riskier banks.
Last but not least, the country growth should be accompanied by a parallel strengthening of the regulation and supervision structures, and of the financial safety net. The construction of financial information platform, an adequate measure of the systemic risk and of each bank contribution to it, the evolution of supervision for following the ongoing and expected financial innovation, and the improvement of the banking resolution and recovery mechanisms in case of crisis, will thus be of fundamental importance to avoid the accumulation of systemic risk, and keep China’s financial system safe and sound.
Author Contributions
X.Z. conceptualized the framework of this study; X.Z. and C.W. contributed to the writing-original draft, data collection, Graph, table drawing and results analysis; S.Z. contributed to the methodology, software implementation; X.Z. and S.Z. revised the original manuscript. All authors have read and agreed to the published version of the manuscript.
Funding
This research received no external funding.
Conflicts of Interest
The authors declare no conflict of interest.
References
- Silva, T.C.; Silva, M.A.; Tabak, B.M. Systemic risk in financial systems: A feedback approach. J. Econ. Behav. Organ. 2017, 144, 97–120. [Google Scholar] [CrossRef]
- FSB. Policy Measures to Address Systemically Important Financial Institutions. Available online: https://www.fsb.org/wp-content/uploads/r_111104bb.pdf?page_moved=1 (accessed on 20 November 2012).
- BCBS. Global Systemically Important Banks: Assessment Methodology and the Additional Loss Absorbency Requirement. Available online: http://www.Bis.org/publ/bcbs207.Pdf (accessed on 4 November 2011).
- FSB. 2018 List of Global Systemically Important Banks (G-SIBs). Available online: https://www.fsb.org/2018/11/2018-list-of-global-systemically-important-banks-g-sibs/ (accessed on 16 November 2018).
- Llewellyn, D.T. The Evolution of Bank Business Models: Pre- and Post-Crisis. In Future Risks and Fragilities for Financial Stability; SUERF Study: Wien, Austria, 2012; pp. 45–67. [Google Scholar]
- Tan, Y. Competition and Profitability in the Chinese Banking Industry: New Evidence from Different Ownership Types. J. Ind. Compet. Trade 2019, 1573–7012. [Google Scholar] [CrossRef]
- Zhang, X.; Li, F.C.; Li, Z.; Xu, Y.Y. Macroprudential Policy, Credit Cycle, and Bank Risk-Taking. Sustainability 2018, 10, 3620. [Google Scholar] [CrossRef] [Green Version]
- Ji, G.; Kim, D.S.; Ahn, K. nancial Structure and Systemic Risk of Banks: Evidence from Chinese Reform. Sustainability 2019, 11, 3721. [Google Scholar] [CrossRef] [Green Version]
- Dai, Z.M.; Li, Y.M.; Jiang, Z.Y. The contagion analysis effect of systemic risk in China listing Banks under the infection matrix norm theory. J. Discret. Math. Sci. Cryptogr. 2016, 19, 457–467. [Google Scholar] [CrossRef]
- Frankel, J.A.; Rose, A.K. Currency Crashes in Emerging Markets: An Empirical Treatment. Soc. Sci. Electron. Publ. 1996, 41, 351–366. [Google Scholar] [CrossRef] [Green Version]
- Illing, M.; Liu, Y. Measuring financial stress in a developed country: An application to Canada. J. Financ. Stab. 2006, 2, 243–265. [Google Scholar] [CrossRef]
- Cardarelli, R.; Elekdag, S.; Lall, S. Financial Stress and Economic Contractions. J. Financ. Stab. 2011, 7, 78–97. [Google Scholar] [CrossRef]
- Balakrishnan, R.; Danninger, S.; Elekdag, S. The transmission of Financial Stress from Advanced to Emerging Economies. Emerg. Mark. Financ. Trade 2011, 47, 40–68. [Google Scholar] [CrossRef] [Green Version]
- Basel Committee on Banking Supervision. A Global Regulatory Framework for More Resilient Banks and Banking Systems; Bank for International Settlements Communication: Basel, Switzerland, 2011. [Google Scholar]
- Brunnermeier, M.; Gorton, G.; Krishnamurthy, A. Liquidity Mismatch Measurement. Natl. Bur. Econ. Res. 2012. [Google Scholar] [CrossRef]
- Bai, J.; Kishinamurthy, A.; Charles-Henri, W. Measuring Liquidity Mismatch in the Banking Sector. J. Financ. 2018, 73, 51–93. [Google Scholar] [CrossRef]
- Adrian, T.; Brunnermeier, M.K. CoVaR; Federal Reserve Bank of New York Staff Reports, No. 348; Federal Reserve Bank: New York, NY, USA, 2008. [CrossRef]
- Acharya, V.V.; Pedersen, L.H.; Philippon, T.; Richardson, M. Measuring systemic risk. Rev. Financ. Stud. 2017, 30, 2–47. [Google Scholar] [CrossRef]
- Brownlees, C.; Engle, R.F. Volatility, correlation and tails for systemic risk measurement. Work. Pap. NYU-Stern 2012. [Google Scholar] [CrossRef] [Green Version]
- Brownlees, C.; Engle, R.F. SRISK: A Conditional Capital Shortfall Measure of Systemic Risk. Rev. Financ. Stud. 2017, 30, 48–79. [Google Scholar] [CrossRef]
- He, Q.; Liu, J.Y.; Gan, J.Y.; Qian, Z.X. Systemic financial risk and macroeconomic activity in China. J. Econ. Bus. 2019, 102, 57–63. [Google Scholar] [CrossRef]
- Allen, F.; Gale, D. Financial Contagion. J. Polit. Econ. 2000, 108, 1–33. [Google Scholar] [CrossRef]
- Caccioli, F.; Shrestha, M.; Moore, C.; Farmer, D.J. Stability analysis of financial contagion due to overlapping portfolios. J. Bank. Financ. 2014, 46, 233–245. [Google Scholar] [CrossRef] [Green Version]
- Glasserman, P.; Young, P.H. How likely is contagion in financial networks? J. Bank. Financ. 2015, 50, 383–399. [Google Scholar] [CrossRef] [Green Version]
- He, Y.; Wu, S.; Tong, M. Systemic risk and liquidity rescue in complex financial networks: Pit hole and black hole of liquidity. Phys. A Stat. Mech. Appl. 2019. [Google Scholar] [CrossRef]
- Daly, K.; Batten, J.A.; Mishra, A.V.; Choudhury, T. Contagion risk in global banking sector. J. Int. Financ. Mark. Inst. Money 2019, 63, 101136. [Google Scholar] [CrossRef]
- Chen, L.; Han, Q.; Qiao, Z.L.; Stanley, H.E. Correlation analysis and systemic risk measurement of regional, financial and global stock indices. Phys. A Stat. Mech. Appl. 2019, 122653. [Google Scholar] [CrossRef]
- Bostandzic, D.; Weiß, G.N.F. Why do some banks contribute more to global systemic risk? J. Financ. Intermediat. 2018, 35, 17–40. [Google Scholar] [CrossRef]
- Akhter, S.; Daly, K. Contagion risk for Australian banks from global systemically important banks: Evidence from extreme events. Econ. Model. 2017, 63, 191–205. [Google Scholar] [CrossRef]
- Kanno, M. Assessing systemic risk using interbank exposures in the global banking system. J. Financ. Stab. 2015, 20, 105–130. [Google Scholar] [CrossRef]
- lupo-Pasini, F.; Buckley, R.P. Global Systemic Risk and International Regulatory Coordination: Squaring Sovereignty and Financial Stability. Am. Univ. Int. Law Rev. 2015, 30, 665–741. Available online: http://0-search-ebscohost-com.brum.beds.ac.uk/login.aspx?direct=true&db=buh&AN=110097077&lang=zh-cn&site=ehost-live (accessed on 17 December 2019).
- Fang, L.B.; Sun, B.Y.; Li, H.J.; Yu, H.H. Systemic risk network of Chinese financial institutions. Emerg. Mark. Rev. 2018, 35, 190–206. [Google Scholar] [CrossRef]
- Wang, G.J.; Jiang, Z.Q.; Lin, M.; Xie, C.; Stanley, H.E. Interconnectedness and systemic risk of China’s financial institutions. Emerg. Mark. Rev. 2018, 35, 1–18. [Google Scholar] [CrossRef]
- Gong, X.L.; Liu, X.H.; Xiong, X.; Zhang, W. Financial systemic risk measurement based on causal network connectedness analysis. Int. Rev. Econ. Financ. 2019, 64, 290–307. [Google Scholar] [CrossRef]
- Gao, H.D.; Li, Y.; Chen, W.L.; Chen, J. Systemic risk in China’s interbank lending market. J. Math. Financ. 2017, 7, 188–198. [Google Scholar] [CrossRef] [Green Version]
- Xu, Q.F.; Li, M.T.; Jiang, C.X.; He, Y.Y. Interconnectedness and systemic risk network of Chinese financial institutions: A LASSO-CoVaR approach. Phys. A Stat. Mech. Appl. 2019, 534, 122173. [Google Scholar] [CrossRef]
- Sun, L.X. Financial networks and systemic risk in China’s banking system. Financ. Res. Lett. 2019. [Google Scholar] [CrossRef] [Green Version]
- De Lisa, R.; Zedda, S.; Vallascas, F.; Campolongo, F.; Marchesi, M. Modelling deposit insurance schemes’ losses in a Basel 2 framework. J. Financ. Serv. Res. 2011, 40, 123–141. [Google Scholar] [CrossRef]
- Zedda, S.; Cannas, G. Analysis of Banks’ systemic risk contribution and contagion determinants through the leave-one-out approach. J. Bank. Financ. 2017, in press. [Google Scholar] [CrossRef]
- Liu, D.H.; Gu, H.M.; Lung, P. The equity mispricing: Evidence from China’s stock market. Pac.-Basin Financ. J. 2016, 39, 211–223. [Google Scholar] [CrossRef]
- Lee, E.J. Short selling and market mispricing. Rev. Quant. Financ. Account. 2016, 47, 797–833. [Google Scholar] [CrossRef]
- Zedda, S. Banking Systems Simulation: Theory, Practice, and Application of Modeling Shocks, Losses, and Contagion; John Wiley & sons: Hoboken, NJ, USA, 2017. [Google Scholar] [CrossRef]
- Marchesi, M.; Petracco Giudici, M.; Cariboni, J.; Zedda, S.; Campolongo, F. Macroeconomic Cost-Benefit Analysis of Basel III Minimum Capital Requirements and of Introducing Deposit Guarantee Schemes and Resolution Funds; EUR Scientific and Technical Research Series 24603 EN; European Commission: Ispra, Italy, 2012; pp. 1–25. [Google Scholar]
- European Commission. Directorate-General for Internal Market and Services, “Commission Staff Working Document-Economic Review of the Financial Regulation Agenda”. Available online: https://eur-lex.europa.eu/resource.html?uri=cellar:841b8a91-dc18-11e3-8cd4-01aa75ed71a1.0001.01/DOC_1&format=PDF (accessed on 15 May 2014).
- European Commission. Directorate-General for Financial Stability, Financial Services and Capital Markets Union. Effects Analysis on the European Deposit Insurance Scheme (EDIS). Available online: https://ec.europa.eu/info/sites/info/files/161011-edis-effect-analysis_en.pdf (accessed on 11 November 2016).
- European Commission. Directorate General for Economic and Financial Affairs. Public Finances in EMU 2011. European Economy 3. Available online: http://ec.europa.eu/economy_finance/publications/european_economy\\/2011/ee3_en.htm (accessed on 27 July 2011).
- European Commission. Directorate-General for Internal Market and Services: Commission Staff Working Document-Impact Assessment Accompanying the Proposal for a Directive of the European Proposal for a Directive of the European Parliament and of the Council establishing a framework for the recovery and resolution of credit institutions and investment firms and amending Council Directives. 2011. Available online: https://eur-lex.europa.eu/legal-content/EN/TXT/PDF/?uri=CELEX:52012SC0167&from=en (accessed on 30 May 2012).
- Benczur, P.; Cannas, G.; Cariboni, J.; Di Girolamo, F.; Maccaferri, S.; Petracco Giu-dici, M. Evaluating the effectiveness of the new EU bank regulatory framework: A farewell to bail-out? J. Financ. Stab. 2017, 33, 207–223. [Google Scholar] [CrossRef]
- Galliani, C.; Zedda, S. Will the bail-in break the vicious circle between banks and their sovereign? Comput. Econ. 2015, 45, 597–614. [Google Scholar] [CrossRef]
- Zedda, S.; Cariboni, J.; Marchesi, M.; Petracco Giudici, M.; Salto, M. The EU Sovereign Debt Crisis: Potential Effects on EU Banking Systems and Policy Options; EUR Scientific and Technical Research Series 25556 EN; European Commission: Ispra, Italy, 2012; pp. 1–26. [Google Scholar]
- Laeven, L.; Ratnovski, L.; Tong, H. Bank size, capital, and systemic risk: Some international evidence. J. Bank. Financ. 2016, 69, S25–S34. [Google Scholar] [CrossRef]
- Gauthier, C.; Lehar, A.; Souissi, M. Macroprudential capital requirements and systemic risk. J. Financ. Intermediat. 2012, 21, 594–618. [Google Scholar] [CrossRef]
- Raz, A. Risk and capital in Indonesian large banks. J. Financ. Econ. Policy 2018, 10, 165–184. [Google Scholar] [CrossRef]
Figure 1.
Bank PD and excess capital. The black line indicates the bank PD when considering interbank contagion effect, while the grey line represents the bank PD without contagion.
Figure 1.
Bank PD and excess capital. The black line indicates the bank PD when considering interbank contagion effect, while the grey line represents the bank PD without contagion.


Table 1.
Sample description.
| Year | Number of Banks | TA | RWA | TC | IB+ (as % of TA) | IB− (as % of TA) | Sample TA (as % of the Whole System) |
|---|---|---|---|---|---|---|---|
| 2013 | 24 | 97,593.59 | 63,892.37 | 7761.46 | 10.39% | 13.81% | 64.48% |
| 2014 | 25 | 108,986.82 | 70,348.71 | 9274.25 | 9.12% | 15.29% | 63.24% |
| 2015 | 23 | 117,278.60 | 73,615.59 | 10,012.03 | 8.39% | 17.31% | 58.83% |
| 2016 | 25 | 139,307.02 | 85,448.37 | 11,470.03 | 7.00% | 19.36% | 59.98% |
| 2017 | 25 | 148,017.20 | 95,466.19 | 12,950.71 | 5.64% | 18.05% | 58.68% |
Note: The units of total assets (TA), risk-weighted assets (RWA), total capital (TC) are in billions RMB yuan.
Table 2.
Sample description for four types of banks in 2017.
| Variables | State-Owned Banks | Joint-Stock Banks | City Commercial Banks | Rural Commercial Banks |
|---|---|---|---|---|
| Number of banks | 5 | 8 | 7 | 5 |
| TA | 97,770.49 | 40,277.14 | 9378.77 | 590.80 |
| RWA | 59,232.44 | 27,476.01 | 8351.71 | 406.03 |
| TC | 8657.65 | 3438.54 | 799.68 | 54.84 |
| IB+ (as% of TA) | 5.69% | 5.28% | 6.81% | 4.01% |
| IB− (as% of TA) | 13.03% | 29.33% | 22.13% | 15.65% |
| Sample TA (as % of the whole system) | 38.76% | 15.97% | 3.72% | 0.23% |
| Share of TA (as % of the sample) | 66.05% | 27.21% | 6.34% | 0.40% |
Note: The units of total assets (TA), risk-weighted assets (RWA), total capital (TC) are in billions RMB yuan.
Table 3.
IOPD and bank PD in 2017.
| Statistics | IOPD% | Bank PD (without Contagion%) | Bank PD (with Contagion%) |
|---|---|---|---|
| Mean | 0.6701 | 0.0367 | 0.0426 |
| Median | 0.6600 | 0.0327 | 0.0378 |
| Standard Deviation | 0.1517 | 0.0136 | 0.0145 |
| Maximum | 0.9740 | 0.0689 | 0.0794 |
| Minimum | 0.4610 | 0.0186 | 0.0208 |
| Range | 0.5130 | 0.0503 | 0.0587 |
Table 4.
The correlation coefficients.
| IOPD | Bank PD (with Contagion) | Bank PD (without Contagion) | Excess Capital | |
|---|---|---|---|---|
| Bank PD(with) | 0.2244 | 1.0000 | 0.9574 | −0.9337 |
| Bank PD(without) | 0.2515 | 0.9746 | 1.0000 | −0.9368 |
| Excess Capital | −0.3447 | −0.9337 | −0.9368 | 1.0000 |
| LN(TA) | −0.0333 | 0.0499 | 0.0751 | −0.0042 |
Note: The correlation coefficients were calculated by Eviews software.
Table 5.
Bank PD over 0.1% with contagion.
| Year | Bank | Bank PD (without Contagion)% | Bank PD (with Contagion)% | Excess Capital |
|---|---|---|---|---|
| 2013 | Min Sheng Bank | 0.0817 | 0.1115 | 1.3366 |
| 2013 | Industrial Bank | 0.0786 | 0.1133 | 1.3535 |
| 2013 | China Everbright Bank | 0.0851 | 0.1035 | 1.3213 |
| 2013 | Hua Xia Bank | 0.1086 | 0.1283 | 1.2345 |
| 2013 | Ping An Bank | 0.1071 | 0.1383 | 1.2376 |
| 2013 | Bank of Beijing | 0.0741 | 0.1046 | 1.3680 |
| 2014 | Min Sheng Bank | 0.0820 | 0.1066 | 1.3357 |
| 2015 | Hua Xia Bank | 0.0787 | 0.1015 | 1.3561 |
Note: Within the sample period, the bank probability to default (bank PD) over 0.1%.
Table 6.
Systemic risk of China commercial banks in 2013–2017.
| Year | Stand-Alone Risk | Contagion Risk | Total Systemic Risk |
|---|---|---|---|
| 2013 | 1,064,050.20 | 281,727.30 | 1,345,777.50 |
| 2014 | 876,224.80 | 251,210.40 | 1,127,435.20 |
| 2015 | 849,648.92 | 257,330.31 | 1,106,979.23 |
| 2016 | 1,034,293.60 | 318,040.13 | 1,352,333.73 |
| 2017 | 944,101.10 | 266,998.20 | 1,211,099.30 |
Note: The units of stand-alone risk, contagion risk and total systemic risk are in thousands RMB yuan.
Table 7.
Proportion of stand-alone risk and contagion risk.
| Year | Stand-Alone Risk | Contagion Risk |
|---|---|---|
| 2013 | 79.07% | 20.93% |
| 2014 | 77.72% | 22.28% |
| 2015 | 76.75% | 23.25% |
| 2016 | 76.48% | 23.52% |
| 2017 | 77.95% | 22.05% |
Table 8.
Stand-alone risk contribution of four types of banks in 2013–2017.
| Year | State-Owned Banks | Joint-Stock Banks | City Commercial Banks | Rural Commercial Banks |
|---|---|---|---|---|
| 2013 | 610,117.80 | 396,342.20 | 54,375.87 | 3214.44 |
| 2014 | 442,582.90 | 369,422.10 | 61,398.25 | 2821.50 |
| 2015 | 441,003.10 | 338,499.90 | 67,385.76 | 2760.23 |
| 2016 | 501,992.30 | 446,345.80 | 82,226.46 | 3728.01 |
| 2017 | 476,695.00 | 388,721.20 | 74,638.65 | 4046.27 |
Note: The unit of stand-alone risk contribution is in thousands RMB yuan.
Table 9.
Contagion risk contribution of four types of banks in 2013–2017.
| Year | State-Owned Banks | Joint-Stock Banks | City Commercial Banks | Rural Commercial Banks |
|---|---|---|---|---|
| 2013 | −52,183.70 | 527,719.40 | −173,013.00 | −20,795.00 |
| 2014 | −199,233.00 | 594,282.40 | −130,153.00 | −13,686.10 |
| 2015 | −81,336.10 | 451,945.60 | −106,014.00 | −7265.36 |
| 2016 | −128,334.00 | 602,316.00 | −144,742.00 | −11,199.40 |
| 2017 | 119,591.20 | 345,088.60 | −185,353.00 | −12,328.70 |
Note: The unit of contagion risk contribution is in thousands RMB yuan.
Table 10.
Total systemic risk contribution of four types of banks in 2013–2017.
| Year | State-Owned Banks | Joint-Stock Banks | City Commercial Banks | Rural Commercial Banks |
|---|---|---|---|---|
| 2013 | 557,934.10 | 924,061.50 | −118,638.00 | −17,580.50 |
| 2014 | 243,350.20 | 963,704.60 | −68,754.90 | −10,864.60 |
| 2015 | 359,667.00 | 790,445.50 | −38,628.10 | −4505.13 |
| 2016 | 373,658.10 | 1,048,662.00 | −62,515.80 | −7471.34 |
| 2017 | 596,286.20 | 733,809.80 | −110,714.00 | −8282.42 |
Note: The unit of total systemic risk contribution is in thousands RMB yuan.
Table 11.
The risk contribution of joint-stock banks in 2017.
| Bank | |||
|---|---|---|---|
| China Merchants Bank | 2.80% | −64.95% | −12.14% |
| China CITIC Bank | 7.25% | 26.02% | 11.39% |
| Shanghai Pudong Development Bank | 7.00% | 63.99% | 19.57% |
| Min Sheng Bank | 7.06% | 46.41% | 15.73% |
| Industrial Bank | 6.90% | 71.78% | 21.20% |
| China Everbright Bank | 2.83% | −26.88% | −3.72% |
| Hua Xia Bank | 2.49% | −5.09% | 0.82% |
| Ping An Bank | 4.85% | 17.98% | 7.74% |
Note: The first column represents individual banks’ stand-alone risk divided by total systemic stand-alone risk, the second column represents individual banks’ contagion risk divided by total systemic contagion risk, and the last column represents individual banks’ total systemic risk contribution divided by total systemic risk.
© 2019 by the authors. Licensee MDPI, Basel, Switzerland. This article is an open access article distributed under the terms and conditions of the Creative Commons Attribution (CC BY) license (http://creativecommons.org/licenses/by/4.0/).
Share and Cite
MDPI and ACS Style
Zhang, X.; Wei, C.; Zedda, S. Analysis of China Commercial Banks’ Systemic Risk Sustainability through the Leave-One-Out Approach. Sustainability 2020, 12, 203. https://0-doi-org.brum.beds.ac.uk/10.3390/su12010203
AMA Style
Zhang X, Wei C, Zedda S. Analysis of China Commercial Banks’ Systemic Risk Sustainability through the Leave-One-Out Approach. Sustainability. 2020; 12(1):203. https://0-doi-org.brum.beds.ac.uk/10.3390/su12010203
Chicago/Turabian StyleZhang, Xiaoming, Chunyan Wei, and Stefano Zedda. 2020. "Analysis of China Commercial Banks’ Systemic Risk Sustainability through the Leave-One-Out Approach" Sustainability 12, no. 1: 203. https://0-doi-org.brum.beds.ac.uk/10.3390/su12010203
Note that from the first issue of 2016, this journal uses article numbers instead of page numbers. See further details here.