Article

Does Competitive Intensity Moderate the Relationships between Sustainable Capabilities and Sustainable Organizational Performance in New Ventures?

School of Economics and Management, Xi’an Technological University, Xi’an 710021, China
*
Author to whom correspondence should be addressed.
Sustainability 2020, 12(1), 253; https://0-doi-org.brum.beds.ac.uk/10.3390/su12010253
Submission received: 16 November 2019 / Revised: 15 December 2019 / Accepted: 24 December 2019 / Published: 27 December 2019
(This article belongs to the Collection Sustainable Innovation in Organizations for Improving Decisions)

Abstract

:
Competitive intensity presents challenges to new ventures. Capabilities may lead to sustainable new venture performance. Yet, few studies have explored how competitive intensity moderates the effects of capabilities on sustainable new venture performance. Based on capability-based view, this study develops a research model to investigate how new ventures translate capabilities (marketing, technology, market-linking, and information technology capabilities) to achieve sustainability of new venture growth and performance under the different levels of competitive intensity. Using data collected from 146 U.S. new ventures, this study uses ordinary least squares regression analysis to test the research model and employs “pick-a-point” approach to examine how capabilities affect sustainable new venture performance at different levels of competitive intensity. The empirical results suggest that increasing competitive intensity decreases, not increases, the positive effects of marketing capabilities on performance. When competitive intensity is very high, the positive effects of marketing capabilities on performance become insignificant. In contrast, the positive effects of market-linking capabilities on performance increase, not decrease, as competitive intensity increases. For technology and information technology capabilities, there are no moderating effects of competitive intensity. The theoretical and managerial implications are suggested for sustainable entrepreneurship and sustainable development of new enterprises.

1. Introduction

The literature suggests that enterprises need to develop sustainable capabilities in order to achieve sustainable organizational performance [1,2]. Yet, previous empirical research has shown mixed results on the relationship between capabilities and sustainable organizational performance (the capabilities–performance relationship) [1,2,3,4,5,6]. Based on the capability-based view (CBV) theory [2], many empirical studies have provided support for a direct link between capabilities and sustainable organizational performance [2,3,4,6,7,8]. The argument that effective use of capabilities to achieve sustainable organizational performance depends on environmental conditions is widely accepted in the literature [1,2,9,10]. As Newbert [1] suggests, the positive capabilities–performance relationship exists in certain situations. Conversely, Eisenhardt and Martin [9] argue that under some environmental conditions, capabilities may decrease, not increase, sustainable organizational performance. Given the inconsistent findings in the literature, scholars have emphasized the needs for new research to explore the environmental boundary conditions for the capabilities–performance relationship [4,5].
New ventures are particularly sensitive to changes in environmental conditions and often deal with significant effects of environmental factors [8,11,12,13,14]. The competitive environment in which new ventures operate changes quickly and frequently and new ventures must promptly respond to the competitive changes [13,14]. It is important to understand how new ventures can most effectively use their capabilities to achieve sustainability of growth and performance in high versus low competitive environments [3,15,16,17]. Accordingly, prior studies have suggested that analysis of the capabilities–performance relationship should consider the potential moderating effects of complex competitive conditions [18]. We argue that as one of the most important environmental factors for new ventures, competitive intensity is a boundary condition of capability-based view theory [2] and resource-based view (RBV) theory [19]. Therefore, it is an important environmental factor to consider in resolving existing debates about the moderators that affect the capabilities–performance relationship.
In this study, we contribute to the literature by developing a research model to investigate how competitive intensity moderates the relationships between four important sustainable capabilities (marketing capabilities, technology capabilities, market-linking capabilities, and IT capabilities) and sustainability of new venture performance. Using data collected from 146 U.S. new ventures, we use ordinary least squares regression analysis to test the research model and employ “pick-a-point” approach to examine how capabilities affect sustainable new venture performance at different levels of competitive intensity.
This study makes two additional contributions to the literature. First, our empirical results indicate that competitive intensity is an important boundary condition of the CBV and RBV theories. Previous entrepreneurship research on environmental uncertainty has focused on how marketing and technology uncertainties moderate the relationship between capabilities and sustainable new venture performance [13,14]. Prior research has failed to provide empirical supports for the moderating effects of competitive intensity on the capability–performance relationship in new ventures. Second, we find that competitive intensity moderates the effects of marketing capabilities and market-linking capabilities on sustainable new venture performance. The empirical results indicate that as competitive intensity increases, the positive effect of marketing capabilities on sustainable new venture performance decreases, not increases, and the positive effect of market-linking capabilities on sustainable new venture performance increases, not decreases. In contrast, the relationships between technology capabilities and IT capabilities and sustainable new venture performance are not moderated by competitive intensity. These empirical findings provide new insights into our understanding of how new ventures cope with competitive intensity, why some new ventures invest in certain types of capabilities, and why some new ventures perform better than others. These insights are useful to the development of sustainable entrepreneurship.

2. Theory and Research Hypotheses

Literature indicates that resources do not automatically lead to sustainable organizational performance [1,2,9,20,21]. Mahoney and Pandain suggest that only with the best use of resources can firms achieve maximal productivity and/or financial yield [22]. Peteraf also argues that firms need to effectively manage and use their valuable resources to achieve superior organizational performance [23]. Over the past two decades, scholars have explored the mechanisms of resource deployment and utilization, such as core capabilities, competences, and organizational capabilities [2,3,5,7,21,22,23,24,25].
Capabilities are intangible resources that integrate knowledge, skills, and organizational processes, enabling firms to coordinate activities and make effective use of their assets [2,21,22]. This integration, which derives from firms’ experiences, tacit knowledge, and unique complex combinations of resources, affects the creation of valuable outputs [15,25]. The literatures in marketing, management, and entrepreneurship have suggested several major capabilities, such as marketing capabilities, technology capabilities, information technology capabilities, research and development (R&D) capabilities, management-related capabilities, operational capabilities, design capabilities, and innovation capabilities [3,7,20,21,24,25,26,27,28,29,30,31]. These capabilities can be deployed to reduce costs and to create sustainable competitive advantages [32].
According to the CBV theory, sustainable competitive advantages are primarily driven by capabilities that cannot be easily traded or imitated [2,19,21,25] and distinctive capabilities have positive relationships with sustainable organizational performance [3,7,24,25]. Yet, the results are mixed [1,2,4,5]. Some studies have shown that the positive effect of capabilities on superior sustainable organizational performance depends on environmental conditions [1,9,10]. For new ventures, the environmental factors are important contingent factors affecting the relationships between capabilities and sustainable organizational performance [11,12,33,34]. Several studies have identified some variables that moderate the relationships between different capabilities and sustainable organizational performance [2,5,25,26]. Although competitive intensity is widely recognized as a moderator, e.g., [2,17], the moderating effect of competitive intensity in the capability–performance relationship remains understudied [15].
We propose a research model (shown in Figure 1) focusing on four capabilities (marketing, technology, market-linking, and IT capabilities) that have been suggested as most important for new ventures [3,7,25]. The model contains eight research hypotheses. It predicts that the four capabilities have positive effects on sustainable new venture performance (H1–H4). Furthermore, the model suggests that the level of competitive intensity moderates the four capability–performance relationships (H5–H8).

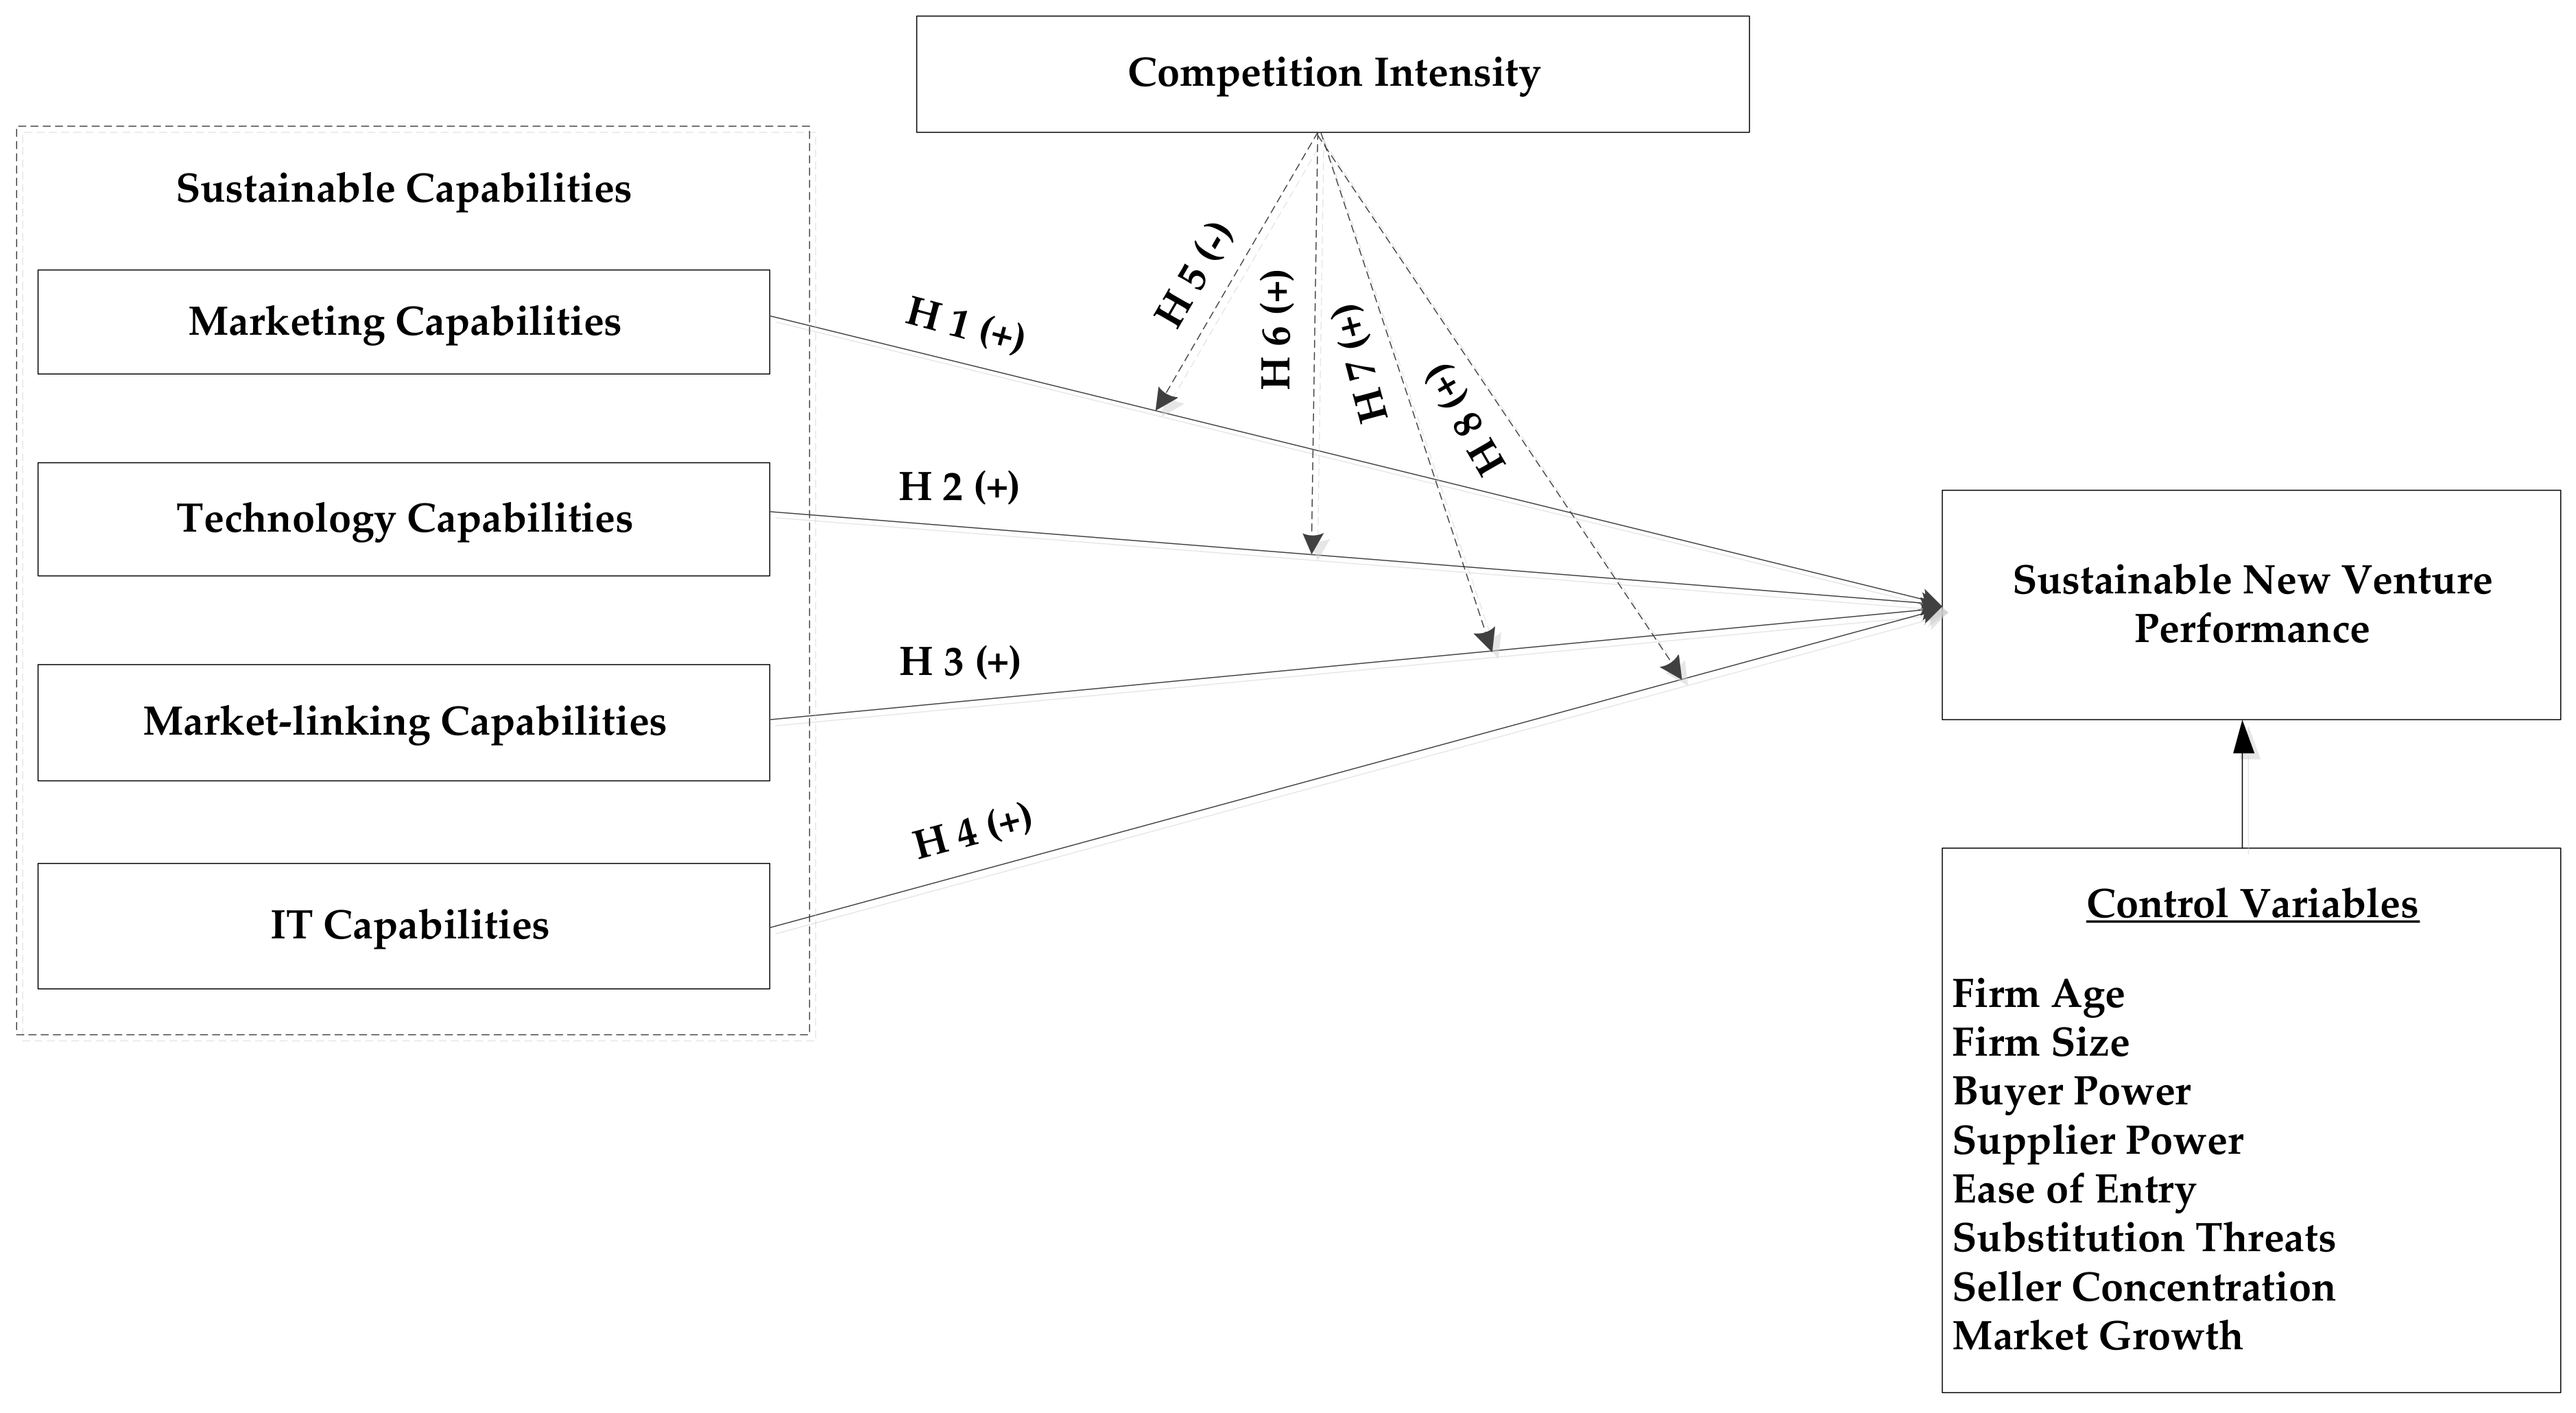
2.1. Capabilities and Sustainable New Venture Performance (H1–H4)

New ventures should possess multiple capabilities to achieve superior sustainable organizational performance [3]. New ventures are notorious for cash flow and capital needs. When new ventures are faced with investment constraints [13], it is critical for them to choose what capabilities to invest their capitals in order to improve their survival and enhance performance [3]. Day has suggested that “it is not possible for organizations to enumerate all possible capabilities, because every business develops its own configuration of capabilities that is rooted in the realities of its competitive market, past commitments, and anticipated requirements” [21] (p. 40). In this article, we choose to focus on four important capabilities consistent with research in marketing and management [3,7,24,25] and study the different effects of these four capabilities on the sustainable new venture performance.
Marketing capabilities permit the firm to swiftly and effectively respond to customer needs and implement marketing programs, which require skill in segmentation, targeting, pricing, advertising, and integrating marketing activity [3,7,24,26]. Technology capabilities include R&D, product development, production processes, manufacturing processes, forecasting technological change, and logistics technologies [3,24,25]. According to the CBV theory, marketing capabilities enable new ventures to generate and disseminate market information and carry out appropriate responses to customer needs and preferences [3,24,35]. Technology capabilities enable new ventures to differentiate products to respond external challenges and seize market opportunities [3,7,25]. In addition, prior studies have found that marketing and technology capabilities have positive impacts on sustainable new venture performance [3,7,25,36,37].
Market-linking capabilities include market sensing, channel linking, customer linking, and technology monitoring [3,38]. Market-linking capabilities enable new ventures to improve their sustainable competitiveness by managing durable relationships with customer and partners, detecting changes in the market, and responding to changes in customer demand [3,24]. Keeping good and durable relationships with customers and partners helps new ventures to know and meet the needs of customers [26]. Durable relationships with customers increase the sustainability of new venture growth and performance [3,7,26,38,39].
IT capabilities include facilitating technology and market knowledge creation, cross-functional integration, and internal and external communication [3,15,25]. For new ventures to achieve superior sustainable growth and performance, they need IT capabilities to disseminate technical and market information effectively across all relevant organizational areas [3,15,25,40,41]. Therefore, following the literature, we propose the following four hypotheses:
Hypothesis 1 (H1).
Marketing capabilities are positively related to sustainable new venture performance.
Hypothesis 2 (H2).
Technology capabilities are positively related to sustainable new venture performance.
Hypothesis 3 (H3).
Market-linking capabilities are positively related to sustainable new venture performance.
Hypothesis 4 (H4).
IT capabilities are positively related to sustainable new venture performance.

2.2. The Moderating Effect of Competitive Intensity

The current view of the CBV theory is that the utility of capabilities is contingent on the environment in which the firm operates [1,2,4,5]. Capabilities are essentially the application of resources, and that application occurs within a specific environment [2,10,18,42]. Therefore, the relationships between capabilities and sustainable organizational performance may vary under different environmental conditions [2]. This view is consistent with the contingency theory argument that the external environmental situation has a moderating effect on the relationships between capabilities and sustainable organizational performance [43,44,45].
As discussed earlier, competitive intensity is a key environmental factor in the organization theory, marketing, strategic management, and sustainability literatures [18,46,47]. In this study, competitive intensity refers to the degree of competitive actions in the industry. A high level of competitive intensity is characterized by cutthroat competition, many promotion wars, similar product offerings, and a high level of price competition. Competitive intensity may be caused by intentional strategic action of the competitors in the industry or a lack of understanding of information and the prospective actions of competitors [48,49]. Because competitive intensity derives from both current and future competitors, it is very difficult for new ventures to control. Past research suggests that competitive intensity influence strategic decision making [50,51].
We argue that competitive intensity negatively moderates the positive relationship between marketing capabilities and sustainable new venture performance. Relative to less competitive industries, new ventures in highly competitive environments face more cutthroat competition, higher entry barriers, more difficulties in differentiating product offerings, frequent promotion wars, and higher levels of price competition. It is much more difficult for those new ventures facing highly competitive intensity to execute effective marketing decisions such as market segmentation, pricing, advertising, and integrative marketing activity [3,7,21,24]. New ventures need to spend more on marketing (advertising and promotions, marketing strategy adjustment) and reduce profit margins as a result of high competitive intensity. Therefore, we hypothesize:
Hypothesis 5 (H5).
Increasing competitive intensity decreases the positive effect of marketing capabilities on sustainable new venture performance.
Increasing technology capabilities leads to better R&D, more product sustainable development, improved production and manufacturing sustainability processes, more accurate forecasting of technological change [3,24,52]. In a highly competitive environment, it is much more important for new ventures to differentiate their products and services from existing competitors. Increasing technology capabilities in a highly competitive environment then enables and promotes the sustainable development of new technology, lower costs, higher quality, and more differentiated products to allow the firm to better compete in highly competitive industries [7,21,24,53]. Therefore, we hypothesize:
Hypothesis 6 (H6).
Increasing competitive intensity increases the positive effect of technology capabilities on sustainable new venture performance.
Past studies have suggested that market-linking capabilities have a stronger effect on sustainable organizational performance in environments with high levels of competitive intensity [54,55]. Under the conditions of fierce competition, new ventures will depend more on market-linking capabilities to build or maintain long-term relationships between customers and stakeholders, which can bring about customer loyalty, and strategic partnership with suppliers [56]. Therefore, we hypothesize:
Hypothesis 7 (H7).
Increasing competitive intensity increases the positive effect of sustainable market-inking capabilities on sustainable new venture performance.
Relative to less competitive environments, new ventures operating in highly competitive intensity will face frequent promotional wars and cutthroat competition. New ventures in highly competitive environments will need constant updating of competitive activity. Increases in IT capabilities lead to greater access to competitive information, facilitate internal and external communication, and increase cross-functional communication of competitive information [7,24]. The effect of IT capabilities on sustainable new venture performance is greater in highly competitive environments than in less competitive environments [15]. Therefore, we hypothesize:
Hypothesis 8 (H8).
Increasing competitive intensity increases the positive effect of IT capabilities on sustainable new venture performance.

3. Method

3.1. Data

From the companies listed in the ReferenceUSA.com, we selected the research sample of 2103 new ventures in four steps: (1) the initial population from all companies listed in ReferenceUSA.com was reduced to include only new ventures (less than 8 years old following prior study [3]) in the manufacturing businesses (with North American Industry Classification System code 31–33); (2) the sample was further reduced by including only new ventures in three industries: consumer electronics and accessories; electronics games, toys, and computer software; and manufacturing appliances for homes; (3) a random sample of 2500 new ventures was selected using a random number generator; (4) after deleting 397 companies with incomplete or outdated contact information, the sample was reduced to 2103 firms with necessary information. The three industries were chosen because prior studies suggest that they offer rich empirical context for studying the capability-performance relationship in new ventures [3,7,27,38].
The empirical data used for this study were collected in three phases starting in January 2012. First, using fax, express mail, and/or email, we conducted a one-page presurvey by sending a formal letter requesting participation and offering a list of free research reports. The results of the presurvey are: 286 companies declined to provide data due to confidentiality of the data, company policy, and lack of time; 348 companies were contactable; 948 companies did not respond; and 521 new ventures agreed to participate and provided a contact person with the necessary background information such as when the new venture was created and firm size. From the ReferenceUSA.com, we also collected firm age and firm size for all firms.
Second, after the presurvey, we followed the three-wave mailing approach to collect data (i.e., capabilities, competitive intensity, firm age, total number of full-time employees, and industry characteristics such as buyer power, supplier power, ease of entry, substitution threats, seller concentration, and market growth) [3]. The first package included a new $1 bill, a business card, a personalized letter, a professionally created survey, a preaddressed and prepaid returned express mail, and a list of free research reports. The package was sent by express mail to all 521 new ventures which had agreed to participate. The three-wave mailing approach was used following prior studies [3]. We also asked two questions to assess the respondent’s confidence in providing the necessary data and deleted the survey if the answer was less than 3 (on 1–5 scales). We collected the required data from 221 new ventures.
The third phase took place one year later to reduce potential common method bias and enhance our ability to draw causal relationships. We collected the performance data (total sales and total costs) one year after collecting data on independent variables. As an additional check, we also independently verified performance data with ReferenceUSA.com. However, performance information was missing or unavailable for 67 firms. The final data used to test our research model included 53 new ventures in consumer electronics and accessories; 44 new ventures in electronics games, toys, and computer software; and 49 new ventures in manufacturing appliances for homes.

3.2. Tests for Potential Nonresponse Bias

We used two tests to evaluate possible nonresponse bias and representativeness of the participating firms [3,57]. First, we performed a multivariate analysis of variance to compare participating new ventures with nonparticipating new ventures in terms of firm age and total number of employees. The results suggested that the participating group is not significantly different from nonparticipating new ventures (p < 0.10). Second, we conducted t-tests to examine any significant differences between the early respondents (from the first package of the mail) and the late respondents (after two follow-ups) using all capability, industry variables, and profit margin. All t-statistics were not significant (p < 0.10). Therefore, we concluded that nonresponse bias was not a significant problem for this study.

3.3. Study Measures

3.3.1. Capabilities

To measure the four types of sustainable capabilities, we asked participants to evaluate how well or poorly they believe their organizations perform the specific activities or have the sustainable capability relative to their three main competitors. All capability scales were rated using a 5-point Likert-type scale ranging from 1 (much worse than the top three major competitors in the industry) to 5 (much better than the top three major competitors in the industry). The Appendix A presents the entire measures with sources.
All measures of capabilities were directly adopted from the existing well-validated measures. To measure marketing capabilities, we adopted 4-items scale from Di Benedetto et al. [7] and Hao et al. [3] to assess knowledge of customers and competitors, integration of marketing activities, skills in segmentation, and targeting markets. We measured technology capabilities using 5-items scale from Song et al. [25] and Hao et al. [3] asking about new product sustainable development capabilities, manufacturing sustainability processes, technology sustainable development capabilities, ability of predicting technological changes in the industry, production facilities. To measure market-linking capabilities, we used 5-items scale from Di Benedetto et al. [38] and Hao et al. [3] to assess market sensing capabilities, customer-linking, capabilities of creating durable relationships with our suppliers, ability to retain customers, channel–bonding capabilities. We adopted 5-items scale from Song et al. [25] and Hao et al. [3] to measure sustainable information technology capabilities by assessing the sustainable information technology systems that support new product sustainable development projects, facilitating cross-functional integration, facilitating technology knowledge creation, facilitating market knowledge creation, and internal communication.

3.3.2. Competitive Intensity

To measure competition intensity, we adopted 5-items scale from Narver and Slater [58]. The 5-items scale of competition intensity composed included competition in our industry is cutthroat, there are many “promotion wars” in our industry, anything that one competitor can offer, others can match readily, price competition is a hallmark of our industry, and our competitors are relatively weak. Participants rated each item using a 5-point Likert-type scale, which ranges from 1 (not descriptive) to 5 (very descriptive).

3.3.3. Sustainable New Venture Performance

We used profit margin to measure sustainable new venture performance. The scale for the profit margin was adopted from prior studies [27,32]. Profit margin was measured using an objected measure, calculated using the following equation:
Profit Margin = 100 × (Total Sales − Total Costs)/(Total Sales)
This measure of sustainable new venture performance has been widely accepted in entrepreneurship literature [3,27] and sustainability literature [32]. Ideally, one should also collect data on sales growth rate and profit margin over a few years (see [32] for example).

3.3.4. Other Factors as Control Variables

In addition to the focal variables of this study, entrepreneurship literature has suggested that new venture performance may be affected by other variables [3,27]. Following prior studies [3], we include same eight control variables as used in [3] to control for the effects of firm age, firm size, and the six variables as proxies of industry characteristics [3,58]. We used the logarithm of the number of employees as an indicator of firm size [3,27,58].

4. Results

4.1. Hypothesis Testing

All multi-item constructs have good reliability as Cronbach’s α ranges from 0.826 to 0.970 (see Appendix A). Table 1 presents the means, standard deviations, and correlations for the variables. We performed an exploratory factor analysis and found that all factor loadings exceeded 0.400 and that there were no double loadings (see Table 2).
To test the first four hypotheses (H1–H4), we performed ordinary least squares regression analysis. Our results are reported in Table 3. Model 1 includes all the main effects of the capabilities on sustainable new venture performance (F = 10.410, p < 0.01). As hypothesized (H1–H4), the empirical results of Model 1 in Table 3 indicate that the parameter estimates for the impact of the four capabilities on sustainable new venture performance are significant and positive for marketing capabilities (β = 2.350, p < 0.01), technology capabilities (β = 2.420, p < 0.01), market–linking capabilities (β = 2.263, p < 0.01), and IT capabilities (β = 5.363, p < 0.01). These results provide support for our four main hypotheses and are consistent with the CBV theory and prior studies [3,7,24].
The moderating hypotheses (H5–H8) predict that the four capabilities–performance relationships are moderated by the competitive intensity, we performed further analyses using the following equation:
Profit margin = α + β1 × MC + β2 × TC + β3 × MLC + β4 × ITC
+ β5 × COIN + β6 × (MC × COIN) + β7 × (TC × COIN)
+ β8 × (MLC × COIN) + β9 × (ITC × COIN) + β10 × AGE
+ β11 × SIZE + β12 × BPOW + β13 × SPOW + β14 × ENTRY
+ β15 × SUBS + β16 × CONC + β17 × MGRO
+ β18 × (AGE × COIN) + β19 × (SIZE × COIN)
+ β20 × (BPOW × COIN) + β21 × (SPOW × COIN)
+ β22 × (ENTRY × COIN) + β23 × (SUBS × COIN)
+ β24 × (CONC × COIN) + β25 × (MGRO × COIN) + ε,
where: MC = marketing capabilities, TC = technology capabilities, MLC = market-linking capabilities, ITC = IT capabilities, COIN = competitive intensity, AGE = firm age, SIZE = log(# of employees), BPOW = buyer power, SPOW = supplier power, ENTRY = ease of entry, SUBS = substitution threats, CONC = seller concentration, MGRO = market growth, ε = disturbance terms for the equation.
We mean-centered four capabilities, competitive intensity, and control variables, as suggested by Jaccard, Turrisi, and Wan [59]. The resulting variable inflation factor (VIF) scores for all models were within acceptable parameters, giving us confidence that multicollinearity was not an issue [60]. Therefore, the mean-centered data were used in subsequent data analyses.
The results in Model 2 of Table 3 reveal a negative and significant moderating effect of competitive intensity on the relationship between marketing capabilities and sustainable new venture performance (β = −1.849, p < 0.05), providing support for H5.
In addition, the empirical results in Model 2 of Table 3 indicate that the moderating effect of competitive intensity on the relationship between market-linking capabilities and sustainable new venture performance is significant and positive (β = 1.556, p < 0.10). Thus, H7 is supported by our empirical data.
Surprisingly, the empirical data do not provide supports for the hypothesized positive moderating effect of competitive intensity on the relationships between technology capabilities, IT capabilities, and sustainable new venture performance, respectively (p > 0.10). Therefore, H6 and H8 are not supported by our empirical data.

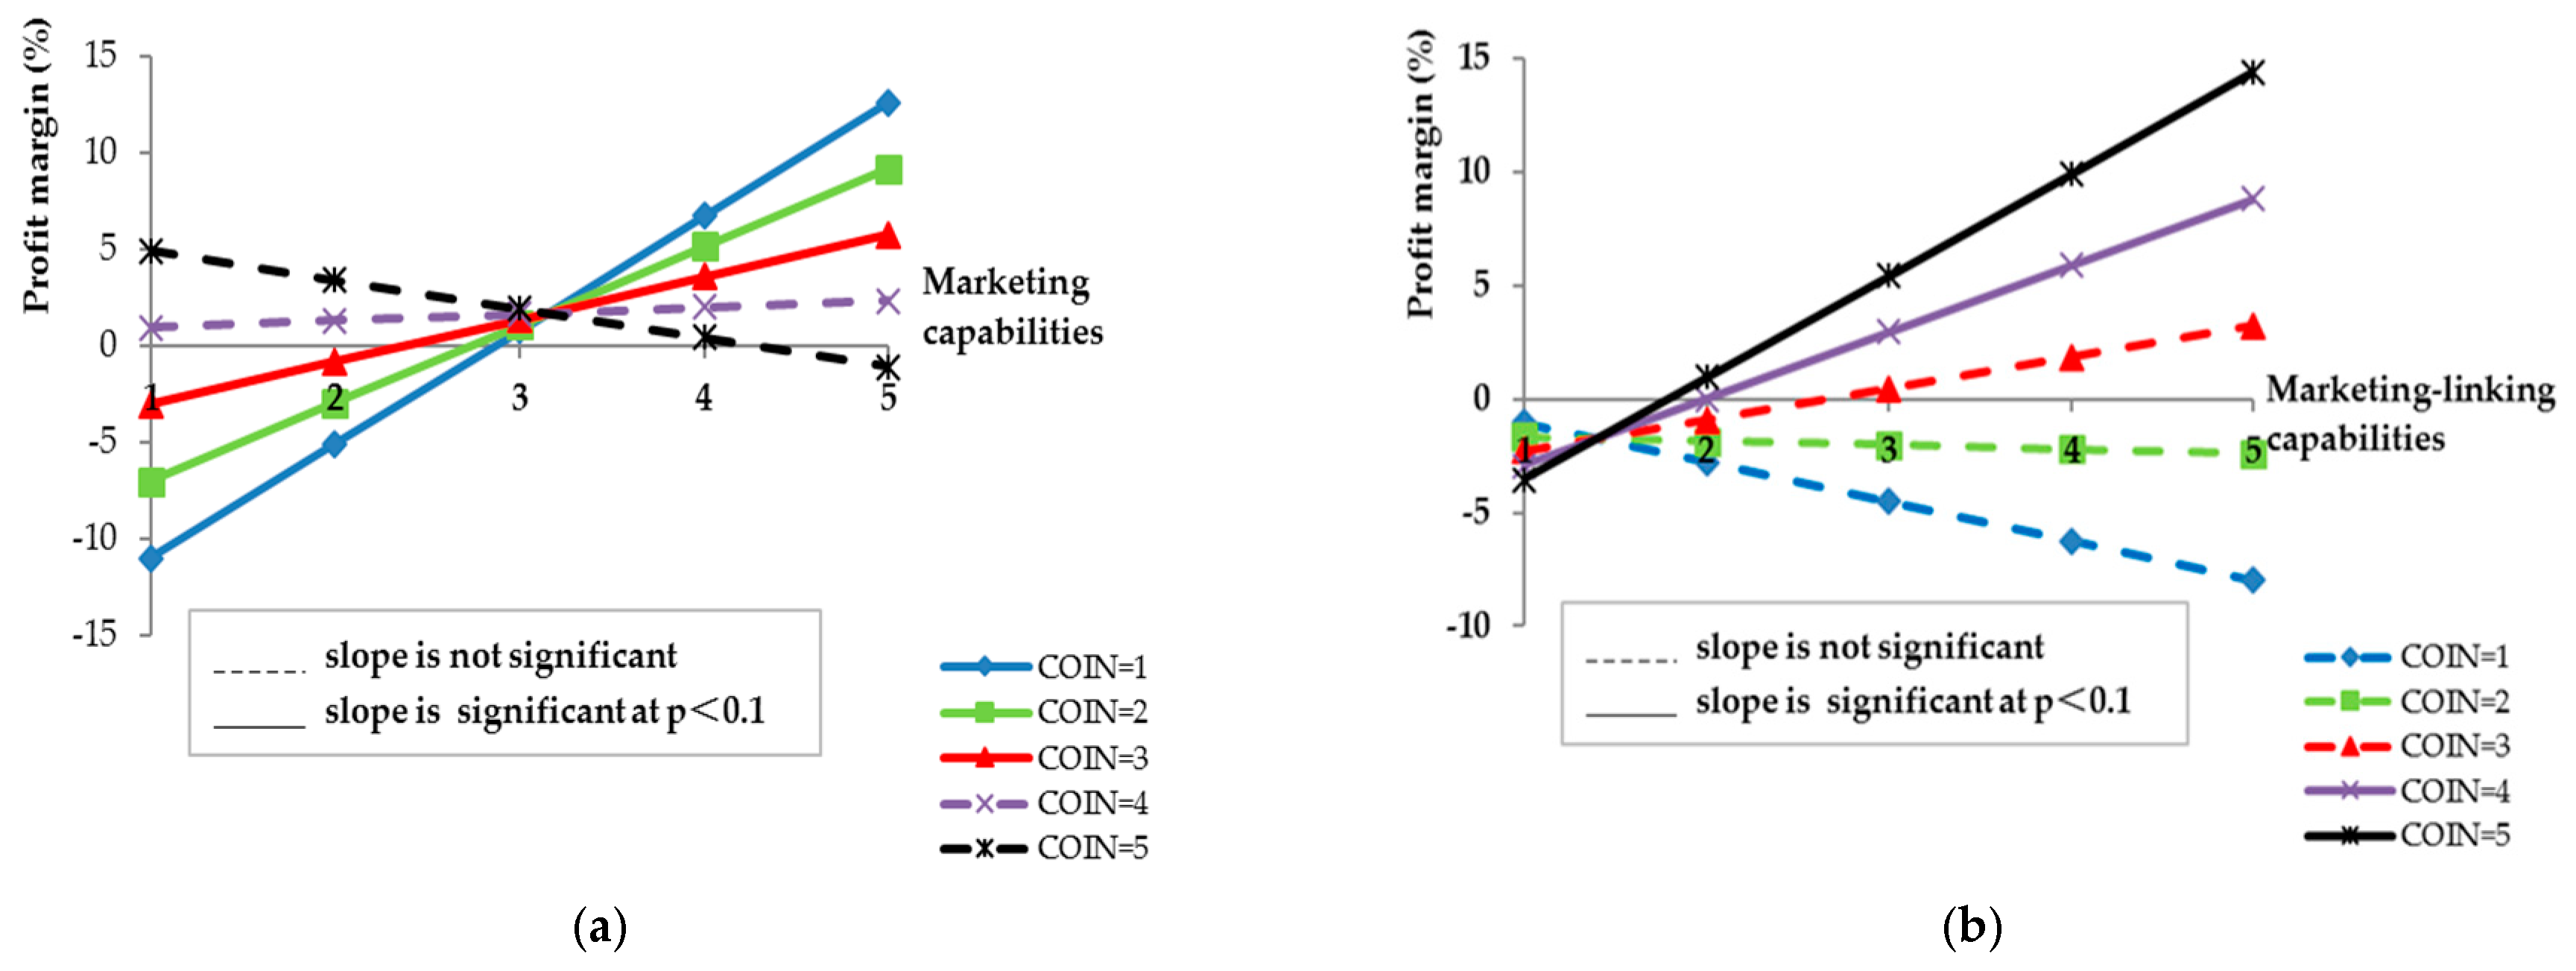
4.2. Additional Analyses by “Pick-a-Point Approach”

We extended the above analyses by applying the “pick-a-point approach” to determine whether marketing capabilities and market-linking capabilities affect sustainable new venture performance at different levels of competitive intensity [61]. We use Equation (2) to analyze the moderating effect of competitive intensity on the positive effects of marketing capabilities on sustainable new venture performance and use Equation (3) to analyze the moderating effect of competitive intensity on the positive effects of market-linking capabilities on sustainable new venture performance. The equations are as following:
Profit margin = (α + β2 × TC + β3 × MLC + β4 × ITC + β10 × AGE+ β11 × SIZE + β12 × BPOW
+ β13 × SPOW + β14 × ENTRY + β15 × SUBS + β16 × CONC + β17 × MGRO) + β1 × MC
+ (β5 + β7 × TC + β8 × MLC + β9 × ITC + β18 × AGE + β19 × SIZE + β20 × BPOW
+ β21 × SPOW + β22 × ENTRY + β23 × SUBS + β24 × CONC + β25 × MGRO) × COIN
+ β6 × (MC × COIN) + ε,
Profit margin = (α + β1 × MC + β2 × TC + β4 × ITC + β10 × AGE + β11 × SIZE + β12 × BPOW
+ β13 × SPOW + β14 × ENTRY + β15 × SUBS + β16 × CONC + β17 × MGRO) + β3 × MLC
+ (β5 + β6 × MC + β7 × TC + β9 × ITC + β18 × AGE + β19 × SIZE + β20 × BPOW
+ β21 × SPOW + β22 × ENTRY + β23 × SUBS + β24 × CONC + β25 × MGRO) × COIN
+ β8 × (MLC × COIN) + ε.
To analyze the effects of marketing capabilities on profit margin at different levels of competitive intensity by applying the “pick-a-point approach”, we used the coefficient estimates in Model 2 of Table 3 and set all variables to their means except marketing capabilities and competitive intensity. Equation (2) becomes:
Profit margin = −0.462 + 1.993 × (MC − 2.283) + 1.683 × (COIN − 3.144)
− 1.849 × [(MC − 2.283) × (COIN − 3.144)],
where: MC = marketing capabilities (from 1 to 5), COIN = competitive intensity (from 1 to 5).
The results from calculating the effects of marketing capabilities on profit margin for each level of competitive intensity are displayed in Figure 2a. From Figure 2a, we find that when competitive intensity is low (at levels equal to 1, 2, or 3), marketing capabilities increase sustainable new venture performance (p < 0.10). However, the effect of marketing capabilities on sustainable new venture performance decreases as competitive intensity increases. When competitive intensity increases to levels 4 or 5, market capabilities have no significant effect on sustainable new venture performance (p < 0.10). Therefore, we find that a new venture’s return on its investment from marketing capabilities is not useful when competitive intensity is at 4 or higher (p < 0.10).
To analyze the effects of market-linking capabilities on profit margin at different levels of competitive intensity, we used the coefficient estimates in Model 2 of Table 3 and set all variables in Equation (3) to their respective means except the market-linking capabilities (MLC), and competitive intensity. Equation (3) becomes:
Profit margin = −0.462 + 1.602 × (MLC − 2.485) + 1.683 × (COIN − 3.144)
+ 1.556 × ((MLC − 2.485) × (COIN − 3.144)) + ε,
where: MLC = market–linking capabilities (from 1 to 5), COIN = competitive intensity (from 1 to 5).
By changing the market-linking capabilities from 1 to 5 for each level of the competitive intensity, we present the results in Figure 2b. Market-linking capabilities have a positive and significant effect on sustainable new venture performance only when competitive intensity equals to 4 or 5 (p < 0.10). When the competitive intensity is at levels between 1 and 3, increases in market-linking capabilities do not significantly lead to higher sustainable new venture performance (p > 0.10).

5. Discussion

5.1. Theoretical Implications

New ventures face different and perhaps even more challenging competitive circumstances than established firms do. Yet, there has been few prior research examining how the competitive intensity affects the capabilities–performance relationships in new ventures. In this study, we propose a theoretical model, based on the CBV theory, that examines the moderating role of competitive intensity in the relationships between capabilities and sustainable new venture performance.
This study contributes to the literature in several ways. First, our findings contribute to theoretical development in the relationships between capabilities and sustainable new venture performance. Previous research has highlighted the role of four key capabilities for sustainable new venture performance improvements, e.g., [3,7,8,13,27,29,38]. We find that marketing capabilities, technology capabilities, market-linking capabilities, and IT capabilities all have positive impacts on sustainable new venture performance, consistent with prior studies of new ventures, e.g., [3,7,27,29,38] and established firms, e.g., [25,38]. These findings bolster previous research results showing that investment in capabilities leads to increase in sustainable new venture performance [3,7,24,25,38].
Second, we advance the extant literatures by proposing and confirming empirically that competitive intensity moderates the capabilities–performance relationships in new ventures. There is lack of empirical evidence for identifying the potential effect of competitive intensity on capabilities–performance relationship in new ventures [15,18]. Capabilities involve the deployment of new venture’s resources, which needs to consider the environmental factor [10,18,42]. Without considering competitive intensity, all four capabilities have positive and significant effects on sustainable new venture performance. However, the findings of this study suggest that the relationships between capabilities and sustainable new venture performance may vary under different levels of competitive intensity. This adds to the prior studies [15].
Our study thus shows that competitive intensity is an important boundary condition for understanding the relationships between capabilities and sustainable new venture performance [1,2,4,5,15]. As competitive intensity increases, the positive relationships between marketing capabilities and sustainable new venture performance decreases, not increases. In contrast, the positive relationships between market-linking capabilities on sustainable new venture performance increases, not decreases as for marketing capabilities. Moreover, when competitive intensity is very high, marketing capabilities have no significant effects on sustainable new venture performance. At the same time, when competitive intensity is low, market-linking capabilities have no significant effects on sustainable new venture performance. Finally, the effects of technology capabilities and IT capabilities on sustainable new venture performance are not moderated by competitive intensity. Our findings advance CBV and RBV theories by demonstrating the important role of competitive intensity as one of the boundary conditions for explaining the skepticism of the CBV and RBV theories [1,2,4,5].

5.2. Practice Implications

The results of this study provide two important insights for guiding executives of new ventures and for sustainable entrepreneurship. First, without considering competitive intensity, all four capabilities increase sustainable new venture performance. Examination of the standardized coefficient estimates in Model 1 of Table 3 suggests that these four capabilities have different effects on sustainable new venture performance. IT capabilities (B = 0.479, the highest standardized estimate) are found to have the greatest effect on sustainable new venture performance, followed by technology capabilities and the marketing capabilities. Market-linking capabilities (B = 0.211, the lowest standardized estimate) have the lowest effect on sustainable new venture performance.
These empirical results highlight the importance of investing in IT capabilities and technology capabilities to improve sustainability of new venture performance. New ventures should first consider increasing investment in IT systems for sustainable new product development projects and for facilitating market knowledge creation, technology knowledge creation, cross-functional integration, and internal communication. The next investment priority should be to invest in developing technology capabilities to predict technological changes in the industry, technology and new product development capabilities, and manufacturing processes.
Second, the above suggestions should also be conditioned on the level of competitive intensity. Specific suggestions are:
(1)
When competitive intensity is at low to moderate levels (i.e., 1, 2, or 3 on a 5-point scale), new ventures should devote the financial resources to increase marketing capabilities (see Figure 2a), but refrain from new investment to increase market-linking capabilities (see Figure 2b).
(2)
Conversely, when competitive intensity is high or very high (i.e., 4 or 5 on a 5-point scale), new ventures should make heavier investments in developing market-linking capabilities (see Figure 2b). Yet, they should not continue to invest in increasing marketing capabilities (see Figure 2a).
Therefore, it is critical for the new venture founding team to assess the level of competitive intensity in order to make appropriate investment decisions regarding what capabilities to invest in.

5.3. Research Limitations and Future Research Directions

This study has some limitations. First, this study focused on only the four most widely accepted capabilities in the literature. The sustainability of the new ventures may also be affected by other capabilities such as management capabilities, operations capabilities, supplier integration capabilities, and human resource management capabilities. Future studies should investigate if and how competitive intensity moderates the effect of these other capabilities on sustainable new venture performance.
Second, there may be other important contingent factors or boundary conditions that we did not examine in this study. The strategic management literature has called for additional research into boundary conditions to extend the CBV and RBV theories [5].
Third, this study used profit margin as a proxy to assess sustainable new venture performance. Although this measure has been widely accepted in the entrepreneurship literature [3,27] and in sustainability literature [32,62], recent studies in sustainability literature have used three-year average sales growth rate to measure sustainable performance [32,62]. Therefore, future research should collect both sales growth and gross margin to study the sustainable new venture growth and performance.
Finally, the empirical data set we used in this study included only U.S. new ventures. This study did not examine how culture may moderate or change the study findings. Future research should collect empirical data from other countries to further advance sustainable development goals.

6. Conclusions

By investigating the effects of capabilities on sustainable new venture performance, this study adds to our understanding of how marketing, technology, market-linking, and IT capabilities affects sustainable new venture performance under the different levels of competitive intensity. The results show that the relationships between four capabilities and sustainable new venture performance are moderated by the competitive intensity. Without considering competitive intensity, all four capabilities enhance sustainable new venture performance. However, as competitive intensity increases, the positive relationships between marketing capabilities and sustainable new venture performance decreases, not increases. In contrast, as competitive intensity increases, the positive relationship between market-linking capabilities and sustainable new venture performance relationships increases, not decreases in the case of marketing capabilities. These results further add to the extent literature that competitive intensity is an important contingent factor or boundary condition for the relationships between capabilities and sustainable organizational performance. The study findings contribute the development of sustainable enterprises.

Author Contributions

All authors share equally for the first authorship and contribute equally to the development of this article. Conceptualization, H.Z., Y.W., and M.S.; data curation, M.S.; formal analysis, H.Z. and M.S.; methodology, H.Z., Y.W., and M.S.; writing—original draft, H.Z. and Y.W.; writing—review & editing, H.Z., Y.W., and M.S.; funding acquisition, H.Z. All authors have read and agreed to the published version of the manuscript.

Funding

This research was supported by the Natural Science Foundation of Shaanxi Province of China grant numbers 2018JQ7003; and Scientific Research Plan Projects of Shaanxi Province Education Department of China under grant numbers 18JK0367.

Acknowledgments

The authors thank assistant editor and the three anonymous reviewers for their useful suggestions which improve the quality of this research. An earlier version was presented at the 10th INEKA Conference in June 2019 at university of Verona and conference participants provided valuable comments. The authors thank Hong Zhang for his contributions in providing comments to the conference paper.

Conflicts of Interest

The authors declare no conflict of interest. The funders had no role in the design of the study; in the collection, analyses, or interpretation of data; in the writing of the manuscript, or in the decision to publish the results.

Appendix A. Study Measures and Sources

Marketing capabilities (MC) (Cronbach’s alpha = 0.917) (1 = Much worse than the top three major competitors in the industry; 5 = Much better than the top three major competitors in the industry) (adopted from [7], see also [3])
MC1
Knowledge of customers.
MC2
Knowledge of competitors.
MC3
Integration of marketing activities.
MC4
Skill to segment and target markets.
Technology capabilities (TC) (Cronbach’s alpha = 0.970) (1 = Much worse than the top three major competitors in the industry; 5 = Much better than the top three major competitors in the industry) (adopted from [25], see also [3])
TC1
New product sustainable development capabilities.
TC2
Manufacturing sustainability processes.
TC3
Technology sustainable development capabilities.
TC4
Ability of predicting technological changes in the industry.
TC5
Production facilities.
Market-linking Capabilities (MLC) (Cronbach’s alpha = 0.829) (1 = Much worse than the top three major competitors in the industry; 5 = Much better than the top three major competitors in the industry) (adopted from [37], see also [3])
MLC1
Market sensing capabilities.
MLC2
Customer–linking (i.e., creating and managing durable customer relationships) capabilities.
MLC3
Capabilities of creating durable relationship with our suppliers.
MLC4
Ability to retain customers.
MLC5
Channel-bonding capabilities (i.e., creating durable relationship with channel members such as whole sellers, retailers, etc.).
IT Capabilities (ITC) (Cronbach’s alpha = 0.826) (1 = Much worse than the top three major competitors in the industry; 5 = Much better than the top three major competitors in the industry) (adopted from [25], see also [3])
ITC1
Information technology systems for new product sustainable development projects.
ITC2
Information technology systems for facilitating cross-functional integration.
ITC3
Information technology systems for facilitating technology knowledge creation.
ITC4
Information technology systems for facilitating market knowledge creation.
ITC5
Information technology systems for internal communication (i.e., across different departments, across different levels of the organization, etc.).
Competition Intensity (COIN) (Cronbach’s alpha = 0.921) (1 = Not descriptive; 5 = Very descriptive) (adopted from [58])
COIN1
Competition in our industry is cutthroat.
COIN2
There are many “promotion wars” in our industry.
COIN3
Anything that one competitor can offer, others can match readily.
COIN4
Price competition is a hallmark of our industry.
COIN5
Our competitors are relatively weak.
Sustainable new venture performance is calculated as: Profit Margin = 100 × (Total Sales − Total Costs)/(Total Sales) (adopted from [27])

References

  1. Newbert, S.L. Empirical research on the resource-based view of the firm: An assessment and suggestions for future research. Strateg. Manag. J. 2007, 28, 121–146. [Google Scholar] [CrossRef]
  2. Teece, D.J. Explicating dynamic capabilities: The nature and micro foundations of (sustainable) enterprise performance. Strateg. Manag. J. 2007, 28, 1319–1350. [Google Scholar] [CrossRef] [Green Version]
  3. Hao, S.; Song, M. Technology-driven strategy and firm performance: Are strategic capabilities missing links? J. Bus. Res. 2016, 69, 751–759. [Google Scholar] [CrossRef]
  4. Kraaijenbrink, J.; Spender, J.C.; Groen, A.J. The resource-based view: A review and assessment of its critiques. J. Manag. 2010, 36, 349–372. [Google Scholar] [CrossRef]
  5. Klier, H.; Schwens, C.; Zapkau, F.B.; Dikova, D. Which resources matter how and where? A meta-analysis on firms’ foreign establishment mode choice. J. Manag. Stud. 2017, 54, 304–338. [Google Scholar] [CrossRef]
  6. Giménez, J.; Madrid-Guijarro, A.; Duréndez, A. competitive capabilities for the innovation and performance of Spanish construction companies. Sustainability 2019, 11, 5475. [Google Scholar] [CrossRef] [Green Version]
  7. Di Benedetto, C.A.; DeSarbo, W.S.; Song, M. Strategic capabilities and radical innovation: An empirical study in three countries. IEEE. Trans. Eng. Manag. 2008, 55, 420–433. [Google Scholar] [CrossRef]
  8. Shan, B.; Cai, L.; Hatfield, D.E.; Tang, S. The relationship between resources and capabilities of new ventures in emerging economies. Inf. Technol. Manag. 2014, 15, 99–108. [Google Scholar] [CrossRef]
  9. Eisenhardt, K.M.; Martin, J.A. Dynamic capabilities: What are they? Strateg. Manag. J. 2000, 21, 1105–1121. [Google Scholar] [CrossRef]
  10. McKee, D.O.; Varadarajan, R.; Pride, W.M. Strategic adaptability and market performance: A market-contingent perspective. J. Mark. 1989, 53, 21–35. [Google Scholar] [CrossRef]
  11. Helfat, C.; Finkelstein, S.; Mitchell, W.; Peteraf, M.A.; Singh, H.; Teece, D.J. Dynamic capabilities: Understanding strategic change in organizations. Acad. Manag. Rev. 2007, 30, 203–207. [Google Scholar]
  12. Drnevich, P.L.; Kriauciunas, A.P. Clarifying the conditions and limits of the contributions of ordinary and dynamic capabilities to relative firm performance. Strateg. Manag. J. 2011, 32, 254–279. [Google Scholar] [CrossRef]
  13. Song, X.M.; Di Benedetto, C.A.; Parry, M.E. The impact of formal processes for market information acquisition and utilization on the performance of Chinese new ventures. Int. J. Res. Mark. 2009, 26, 314–323. [Google Scholar] [CrossRef]
  14. Parnell, J.A.; Lester, D.L.; Long, Z.; Köseoglu, M.A. How environmental uncertainty affects the link between business strategy and performance in SMEs. Manag. Decis. 2012, 50, 546–568. [Google Scholar] [CrossRef]
  15. Chen, Y.; Wang, Y.; Nevo, S.; Benitez-Amado, J.; Kou, G. IT capabilities and product innovation performance: The roles of corporate entrepreneurship and competitive intensity. Inf. Manag. 2015, 52, 643–657. [Google Scholar] [CrossRef]
  16. Lee, S.H.; Leem, C.S.; Bae, D.J. The impact of technology capability, human resources, internationalization, market resources, and customer satisfaction on annual sales growth rates of Korean software firms. Inf. Technol. Manag. 2018, 19, 171–184. [Google Scholar] [CrossRef] [Green Version]
  17. Chen, J.; Liu, L. Profiting from green innovation: The moderating effect of competitive strategy. Sustainability 2019, 11, 15. [Google Scholar] [CrossRef] [Green Version]
  18. Sirmon, D.G.; Hitt, M.A.; Ireland, R.D. Managing firm resources in dynamic environments to create value: Looking inside the black box. Acad. Manag. Rev. 2007, 32, 273–292. [Google Scholar] [CrossRef] [Green Version]
  19. Barney, J. Firm resources and sustained competitive advantage. J. Manag. 1991, 17, 99–120. [Google Scholar] [CrossRef]
  20. Day, G.S. Market Driven Strategy: Processes for Creating Value; Free Press: New York, NY, USA, 1990. [Google Scholar]
  21. Day, G.S. The capabilities of market-driven organizations. J. Mark. 1994, 58, 37–52. [Google Scholar] [CrossRef]
  22. Mahoney, J.T.; Pandian, J.R. The resource-based view within the conversation of strategic management. Strateg. Manag. J. 1992, 13, 363–380. [Google Scholar] [CrossRef] [Green Version]
  23. Peteraf, M.A. The cornerstones of competitive advantage: A resource-based view. Strateg. Manag. J. 1993, 14, 179–191. [Google Scholar] [CrossRef]
  24. DeSarbo, W.S.; Di Benedetto, C.A.; Song, M.; Sinha, I. Revisiting the miles and snow strategic framework: Uncovering interrelationships between strategic types, capabilities, environmental uncertainty, and firm performance. Strateg. Manag. J. 2005, 26, 47–74. [Google Scholar] [CrossRef]
  25. Song, M.; Di Benedetto, C.A.; Nason, R.W. Capabilities and financial performance: The moderating effect of strategic type. J. Acad. Mark. Sci. 2007, 35, 18–34. [Google Scholar] [CrossRef]
  26. Krasnikov, A.; Jayachandran, S. The relative impact of marketing, research-and-development, and operations capabilities on firm performance. J. Mark. 2008, 72, 1–11. [Google Scholar] [CrossRef]
  27. Zhao, Y.L.; Song, M.; Storm, G.L. Founding team capabilities and new venture performance: The mediating role of strategic positional advantages. Entrep. Theory Pract. 2013, 37, 789–814. [Google Scholar] [CrossRef]
  28. Chen, S.-H. The influencing factors of enterprise sustainable innovation: An empirical study. Sustainability 2016, 8, 425. [Google Scholar] [CrossRef] [Green Version]
  29. Lyver, M.J.; Lu, T.J. Sustaining innovation performance in SMEs: Exploring the roles of strategic entrepreneurship and IT capabilities. Sustainability 2018, 10, 442. [Google Scholar] [CrossRef] [Green Version]
  30. Park, J.H.; Kook, S.H.; Im, H.; Eum, S.; Lee, C. Fabless semiconductor firms’ financial performance determinant factors: Product platform efficiency and technological capability. Sustainability 2018, 10, 3373. [Google Scholar] [CrossRef] [Green Version]
  31. Akram, M.S.; Goraya, M.A.S.; Malik, A.; Aljarallah, A.M. Organizational performance and sustainability: Exploring the roles of IT capabilities and knowledge management capabilities. Sustainability 2018, 10, 3816. [Google Scholar] [CrossRef]
  32. Hao, S.; Zhang, H.; Song, M. Big data, big data analytics capability, and sustainable innovation performance. Sustainability 2019, 11, 7145. [Google Scholar] [CrossRef] [Green Version]
  33. Zahra, S.A.; Sapienza, H.J.; Davidsson, P. Entrepreneurship and dynamic capabilities: A review, model and research agenda. J. Manag. Stud. 2006, 43, 917–955. [Google Scholar] [CrossRef] [Green Version]
  34. Schreyögg, G.; Kliesch-Eberl, M. How dynamic can organizational capabilities be? Towards a dual-process model of capability dynamization. Strateg. Manag. J. 2007, 28, 913–933. [Google Scholar] [CrossRef] [Green Version]
  35. Moorman, C.; Slotegraaf, R.J. The contingency value of complementary capabilities in product development. J. Mark. Res. 1999, 36, 239–257. [Google Scholar] [CrossRef]
  36. Nath, P.; Nachiappan, S.; Ramanathan, R. The impact of marketing capability, operations capability and diversification strategy on performance: A resource-based view. Ind. Mark. Manag. 2010, 39, 317–329. [Google Scholar] [CrossRef]
  37. Wilden, R.; Gudergan, S.P. The impact of dynamic capabilities on operational marketing and technological capabilities: Investigating the role of environmental turbulence. J. Acad. Mark. Sci. 2015, 43, 181–199. [Google Scholar] [CrossRef]
  38. Di Benedetto, C.A.; Song, M. The relationship between strategic type and firm capabilities in Chinese firms. Int. Mark. Rev. 2003, 20, 514–533. [Google Scholar] [CrossRef]
  39. Walter, A.; Auer, M.; Ritter, T. The impact of network capabilities and entrepreneurial orientation on university spin-off performance. J. Bus. Ventur. 2006, 21, 541–567. [Google Scholar] [CrossRef]
  40. Neirotti, P.; Raguseo, E. On the contingent value of It-based capabilities for the competitive advantage of SMEs: Mechanisms and empirical evidence. Inf. Manag. 2017, 54, 139–153. [Google Scholar] [CrossRef]
  41. Raymond, L.; Uwizeyemungu, S.; Fabi, B.; St-Pierre, J. IT capabilities for product innovation in SMEs: A configurational approach. Inf. Technol. Manag. 2018, 19, 1–13. [Google Scholar] [CrossRef]
  42. Teece, D.J.; Pisano, G.; Shuen, A. Dynamic capabilities and strategic management. Strateg. Manag. J. 1997, 18, 509–533. [Google Scholar] [CrossRef]
  43. Lawrence, P.R.; Lorsch, J.W. Organization and Environment; Harvard Business School: Boston, MA, USA, 1967; Volume 2, pp. 314–343. [Google Scholar]
  44. Schendel, D.; Hofer, C.W. Strategic Management: A New View of Business Policy and Planning; Little Brown: Boston, MA, USA, 1979; pp. 70–81. [Google Scholar]
  45. Lumpkin, G.T.; Dess, G.G. Linking two dimensions of entrepreneurial orientation to firm performance: The Moderating role of environment and industry life cycle. J. Bus. Res. Ventur. 2001, 16, 429–451. [Google Scholar] [CrossRef]
  46. Pfeffer, J.; Salancik, G.R. The External Control of Organizations; Harper & Row: New York, NY, USA, 1978. [Google Scholar]
  47. Porter, M.E. Competitive Strategy; Free Press: New York, NY, USA, 1980. [Google Scholar]
  48. Farrell, J.; Saloner, G. Installed Base and compatibility: Innovation, product preannouncements, and predation. Am. Econ. Rev. 1986, 76, 940–956. [Google Scholar]
  49. Sutcliffe, K.M.; Zaheer, A. Uncertainty in the transaction environment: An empirical test. Strateg. Manag. J. 1998, 19, 1–23. [Google Scholar] [CrossRef]
  50. Anderson, P.; Tushman, M. Organizational environments and industry exit: The effects of uncertainty, munificence and complexity. Ind. Corp. Chang. 2001, 10, 675–711. [Google Scholar] [CrossRef]
  51. Kuivalainen, O.; Sundqvist, S.; Puumalainen, K.; Cadogan, J. The effect of environmental turbulence and leader characteristics on international performance: Are knowledge-based firms different? Can. J. Adm. Sci. 2004, 21, 35–50. [Google Scholar] [CrossRef]
  52. Song, M.; Dröge, C.; Hanvanich, S.; Calantone, R. Marketing and technology resource complementarity: An analysis of their interaction effect in two environmental contexts. Strateg. Manag. J. 2005, 26, 259–276. [Google Scholar] [CrossRef]
  53. Afuah, A. Mapping technological capabilities into product markets and competitive advantage: The case of cholesterol drugs. Strateg. Manag. J. 2002, 23, 171–179. [Google Scholar] [CrossRef] [Green Version]
  54. Castrogiovanni, G. Organizational task environments: Have they changed fundamentally over time? J. Manag. 2002, 28, 129–150. [Google Scholar]
  55. Harris, R. Organizational task environments: An evaluation of convergent and discriminant validity. J. Manag. Stud. 2004, 41, 857–882. [Google Scholar] [CrossRef]
  56. Didonet, S.; Simmons, G.; Villavicencio, G.; Palmer, M. The relationship between small business market orientation and environmental uncertainty. Mark. Intell. Plan. 2012, 30, 757–779. [Google Scholar] [CrossRef]
  57. Armstrong, J.S.; Overton, T.S. Estimating non-response bias in mail surveys. J. Mark. Res. 1977, 14, 396–402. [Google Scholar] [CrossRef] [Green Version]
  58. Narver, J.C.; Slater, S.F. The effect of a market orientation on business profitability. J. Mark. 1990, 54, 20–35. [Google Scholar] [CrossRef]
  59. Jaccard, J.; Turrisi, R.; Wan, C.K. Interaction Effects in Multiple Regression; Sage: Newbury Park, CA, USA, 1990. [Google Scholar]
  60. Chatterjee, S.; Hadi, A.S.; Price, B. Regression Analysis by Example, 3rd ed.; John Wiley & Sons, Inc.: New York, NY, USA, 2000. [Google Scholar]
  61. Hayes, A.F.; Matthes, J. Computational procedures for probing interactions in OLS and logistic regression: SPSS and SAS implementations. Behav. Res. Methods 2009, 41, 924–936. [Google Scholar] [CrossRef] [PubMed] [Green Version]
  62. Hu, C.; Zhang, H.; Song, M.; Liang, D. Past performance, organizational aspiration, and organizational performance: The moderating effect of environmental jolts. Sustainability 2019, 11, 4217. [Google Scholar] [CrossRef] [Green Version]
Figure 1. A research model for studying sustainable capabilities, competitive intensity, and sustainable new venture performance.
Sustainability 12 00253 g001
Figure 2. Moderating effects of competitive intensity on the capabilities–performance relationships. (a) Effects of marketing capabilities on profit margin (%) at different levels of competitive intensity, (b) Effects of market-linking capabilities on profit margin (%) at different levels of competitive intensity. Note: COIN = competitive intensity. The regression lines in this figure show the partial effects that are computed using “pick-a-point approach” recommended by Hayes and Matthes [61].
Sustainability 12 00253 g002
Table 1. Descriptive statistics of the sample.
Variable1234567891011121314
1. PROFIT1.000
2. MC0.0881.000
3. TC0.527 ***−0.0211.000
4. MLC0.214 ***0.162 *0.0341.000
5. ITC0.469 ***−0.391 ***0.375 ***−0.1031.000
6. COIN0.362 ***0.1030.407 ***0.383 ***0.175 **1.000
7. AGE0.013−0.021−0.0230.0810.138 *−0.0281.000
8. SIZE−0.0040.076−0.0940.107−0.0480.129−0.0051.000
9. BPOW0.0370.0150.023−0.059−0.092−0.061−0.0470.0851.000
10. SPOW−0.0720.095−0.1200.020−0.170 **−0.0830.0190.1100.0641.000
11. ENTRY−0.021−0.150 *−0.049−0.1130.023−0.1030.073−0.196 **0.056−0.170 **1.000
12. SUBS−0.169 **0.054−0.232 ***−0.104−0.0130.006−0.0240.010−0.005−0.0810.0051.000
13. CONC−0.093−0.0050.038−0.046−0.0970.080−0.0430.074−0.0290.0320.0340.0851.000
14. MGRO0.060−0.0150.143 *−0.1250.1290.052−0.040−0.088−0.027−0.104−0.051−0.062−0.1321.000
Mean9.7982.2832.7162.4853.6053.1445.6372.6763.1713.2403.3563.3013.3013.295
S. D.9.8481.0661.3710.9190.8800.8471.3840.2461.4781.4591.3481.4871.3961.425
Notes: N = 146; * p < 0.10; ** p < 0.05; *** p < 0.01 (two-tailed test). MC = marketing capabilities, TC = technology capabilities, MLC = market-linking capabilities, ITC = IT capabilities, COIN = competitive intensity, AGE = firm age, SIZE = firm size, BPOW = buyer power, SPOW = supplier power, ENTRY = ease of entry, SUBS = substitution threats, CONC = seller concentration, MGRO = market growth. The number in the first row corresponds to the number from the first column.
Table 2. Exploratory factor analysis: factor loadings.
Marketing Capabilities
(MC)
Technology Capabilities
(TC)
Market-Linking Capabilities (MLC)IT Capabilities (ITC)Competitive Intensity (COIN)
MC10.8500.007 −0.059 −0.186 0.048
MC20.857−0.074 0.050 −0.200 0.094
MC30.8540.074 0.118 −0.254 0.027
MC40.8320.009 0.145 −0.141 0.022
TC10.005 0.8930.031 0.120 0.151
TC20.021 0.936−0.032 0.125 0.223
TC3−0.007 0.891−0.007 0.167 0.140
TC4−0.004 0.8860.043 0.171 0.205
TC5−0.018 0.877−0.045 0.210 0.246
MLC10.076 −0.046 0.803−0.160 0.070
MLC20.129 0.095 0.734−0.005 0.159
MLC4−0.093 0.000 0.719−0.054 0.048
MLC30.122 −0.064 0.683−0.032 0.225
MLC50.041 0.001 0.489−0.006 0.345
ITC1−0.216 0.183 −0.106 0.6170.129
ITC2−0.197 0.123 −0.151 0.582−0.049
ITC3−0.032 0.230 −0.097 0.4290.320
ITC4−0.210 0.160 −0.020 0.870−0.003
ITC5−0.177 0.114 0.062 0.8680.041
COIN1−0.002 0.122 0.188 0.148 0.786
COIN20.076 0.148 0.220 0.027 0.810
COIN30.036 0.235 0.225 −0.130 0.750
COIN40.104 0.230 0.097 0.129 0.816
COIN50.010 0.216 0.118 0.051 0.832
Note: bold numbers indicate items that load highly for the corresponding factor.
Table 3. Regression analyses results: profit margin as dependent variable.
Model 1Model 2
Parameter
Estimate
Standard
Error
Standardized
Estimate
Parameter
Estimate
Standard
Error
Standardized
Estimate
Intercept0.0000.6110.000−0.4620.7610.000
Marketing capabilities (MC)2.350 ***0.6500.2541.993 ***0.6970.216
Technology Capabilities (TC)2.420 ***0.5210.3372.143 ***0.6250.298
Market-linking Capabilities (MLC)2.263 ***0.7000.2111.602 *0.8400.149
IT Capabilities (ITC)5.363 ***0.8670.4794.840 ***0.9720.432
Firm Age (AGE)−0.4480.455−0.063−0.3820.479−0.054
Firm Size (SIZE)0.5132.6020.013−1.0202.781−0.026
Buyer Power (BPOW)0.4770.4240.0720.5040.4490.076
Supplier Power (SPOW)0.1260.4410.0190.3580.4710.053
Ease of Entry (ENTRY)0.3940.4820.0540.3950.5030.054
Substitution Threats (SUBS)−0.4860.436−0.073−0.5060.456−0.076
Seller Concentration (CONC)−0.3470.454−0.049−0.5320.473−0.075
Market Growth (MGRO)−0.1710.448−0.025−0.2760.469−0.040
Competitive Intensity (COIN) 1.683 *1.0100.145
MC × COIN −1.849 **0.845−0.174
TC × COIN 0.3140.7890.033
MLC × COIN 1.556 *0.9080.124
ITC × COIN −1.2751.056−0.113
AGE × COIN 3.1483.5590.065
SIZE × COIN −0.1370.545−0.017
BPOW × COIN −0.3480.625−0.042
SPOW × COIN −0.2430.559−0.031
ENTRY × COIN −0.1400.619−0.016
SUBS × COIN 0.9400.5690.116
CONC × COIN −0.4670.622−0.053
MGRO × COIN 1.161 **0.5800.140
F-value10.410 *** 5.710 ***
R20.484 0.543
Adjusted R20.438 0.448
Notes: N = 146; * p < 0.10; ** p < 0.05; *** p < 0.01 (two-tailed test).

