Spatial and Temporal Variations of Potential Evapotranspiration in the Loess Plateau of China During 1960–2017


1
School of Geographical Science, Shanxi Normal University, Linfen 041000, China
2
Institute of Tibetan Plateau Research, University of Chinese Academy of Sciences, Beijing 100049, China
*
Authors to whom correspondence should be addressed.
Sustainability 2020, 12(1), 354; https://0-doi-org.brum.beds.ac.uk/10.3390/su12010354
Submission received: 11 December 2019
/
Revised: 29 December 2019
/
Accepted: 31 December 2019
/
Published: 2 January 2020
Abstract
:Potential evapotranspiration (ET0) is an integral component of the hydrological cycle and the global energy balance, and its long-term variation is of much concern in climate change studies. The Loess Plateau is an important area of agricultural civilization and water resources research. This study analyzed the spatial and temporal evolution processes and influential parameters of ET0 at 70 stations in different topographical areas of the Chinese Loess Plateau (CLP). Using the Mann–Kendall trend, Cross wavelet transform, and the ArcGIS platform, the ET0 of each station was quantified using the Penman–Monteith equation, and the effects of climatic factors on ET0 were assessed by analyzing the correlation coefficients and contribution rates of the climatic factors. The results showed that: (1) the overall trend of the ET0 in different terrains of the Loess Plateau is consistent, however, the ET0 values differ; the hill region (HR) has the highest ET0, followed by the valley region (VR), and the mountain region (MR) has the lowest, and ET0 changes differ between seasons. (2) Spatial distribution characteristics of multiyear mean ET0 in the study are as follows: the ET0 values in mountain and hilly areas are decreasing from west to east, and the higher mean annual ET0 value in the VR is mainly concentrated in the eastern CLP. (3) In the past 58 years, the annual mean and the seasonal ET0 of the region showed increasing trends, however, differences in different terrains were obvious. (4) ET0 has significant correlations with El Niño–Southern Oscillation (ENSO), Pacific–North American teleconnection (PNA), and Atlantic Multidecadal Oscillation (AMO). The resonance period of ET0 and ENSO was 3–6 a, mainly in 1976–1985. The mean coherence phase angle was close to 360°, indicating that ET0 lags behind PNA by approximately 2–6 a; ET0 has a very strong positive correlation with AMO. (5) Relative humidity (RH) is the main influencing factor of ET0 change in the Loess Plateau. Temperature (T) variation has the highest contribution rate (42%) to the regional ET0 variation in the entire CLP. We should pay more attention to the variation of evaporation under future climate change, especially temperature change.
1. Introduction
Potential evapotranspiration (ET0) is an important parameter of hydrological processes and is closely related to regional precipitation and energy spatial distribution [1,2]. With the changing global climate, rising temperatures will further result in increasing rates of water circulation which further change regional climate patterns [3,4,5]. The global temperature has a significant increasing trend over the past decade. Rising temperature has proven to have a remarkable influence on the regional ET0 variation, which caused the frequency of global heat waves and agricultural drought to increase, and the chance of a damaging hot spell for food production also increased significantly [6,7]. Besides, disordered human activities had a serious impact on regional evapotranspiration variation and further reduced plant cover and agricultural production [8,9]. Assessment of regional ET0 is not only essential for understanding the energy balance in the earth–atmospheric system but also has a key role in understanding hydrological processes and climate change. Previous research has provided numerous useful methods to evaluate the variation of the regional ET0, including the Penman–Monteith (PM) method [10], the Hargreaves method [11], the Priestley–Taylor method [12], and other empirical methods [13]. Due to the accessibility of input data and wide applicability, the PM method is recommended by the Food and Agriculture Organization (FAO) and is widely used for assessing spatial–temporal ET0 variations during various climate scenarios and the response to variations in environmental factors [14,15].
Several researchers [16,17,18] have reported on case studies of regional ET0 variations throughout the world. For example, the regional ET0 of eastern Europe has been proven to have had a significant increasing trend during 1961–2012 [19]. In Australia, obvious variability can be observed in the regional ET0 during 1995–2004, during which time the regional ET0 ranged from 699 mm to 2634 mm [20]. Similar research has been carried out in various regions [21,22]. These studies indicated that the regional ET0 has had significant changes over recent decades. Besides, an increasing number of studies have indicated close relationships between the variations of regional ET0 and environmental factors (e.g., meteorological parameters, circulation parameters, and terrain parameters) [23,24,25]. According to previous reports, meteorological parameters have been considered as important controlling factors. Based on an investigation of 500 Chinese meteorological stations between 1956 and 2000, Gao et al. [26] highlighted the importance of temperature, sunshine duration, wind speed, and relative humidity on the evapotranspiration. Liu et al. [23] indicated that wind speed variation is the main controlling factor for ET0 variations in Gansu. In the Hengduan Mountains, research has found that the ET0 variation was related to variations in regional temperature, wind speed, and sunshine duration [24].
Nowadays, an increasing amount of research has indicated that circulation parameters are related to variations in regional climate patterns [25,27,28]. Gong et al. [29] found that regional temperature fluctuation is significantly associated with variation of the North Atlantic Oscillation (NAO), the North Pacific Oscillation (NPO), and the Southern Oscillation (SO). Li et al. [30] reported that the Arctic Oscillation (AO) has a remarkable influence on the precipitation structure in some typical catchments, and results in regional ET0 variations. Besides, some studies pointed out that the regional ET0 of China, with different topographic conditions, usually appeared with obvious spatial variability. For example, Yao et al. [31] found that the ET0 in the arid and subtropical regions of northwest China is higher, while the values of the ET0 in the northeast and the Qinghai–Tibet Plateau are relatively low. Li et al. [30] concluded that the areas with higher ET0 values are mainly in the Tibetan Plateau, Hengduan Mountains, and Yunnan Plateau, whereas the ET0 values in the Guizhou Plateau and Sichuan Basin are lower (a siginificant evaporation paradox [28] can be observed).
In China, temporal and spatial variations of regional ET0 of some typical regions were also systematically evaluated. For example, Wang et al. [32] calculated ET0 values and estimated the temporal and spatial variation of the Hexi region in northwestern China. Zhou et al. [33] analyzed the variation of ET0 in southwestern China and found that the ET0 values during recent decades showed a significant increasing trend. These studies provide important information for assessing the influence of regional climate change and understanding regional hydrological processes. However, few studies have focused on evaluating ET0 variations in the Chinese Loess Plateau (CLP). Some studies focus on the ET0 variations in individual regions of the CLP [34,35]. Temporal and spatial variations of regional ET0 under different geomorphic types and the relationships with the main controlling factors remain unclear. The CLP is an important geomorphic region in Asia, and the thick, sedimentary loess is a useful material for reconstruction of paleoclimate and studying climate change. As an important place of origin of world agricultural civilization, the fragile ecological environment in the CLP is very sensitive to climate change. Therefore, it is necessary to improve our understanding of the temporal and spatial characteristics of regional ET0 in the CLP. In this study, data from 70 weather stations with three topography types in the CLP during 1960–2017 were used to analyze spatial and temporal ET0 variations. The main objectives of this study were to: (1) analyze the temporal and spatial variation characteristics of the ET0 with different topographies in the CLP; (2) determine the main controlling factors of the variations of regional ET0 with different topographies in the CLP; and (3) determine the relationship between regional ET0 of the CLP and larger-scale circulation parameters. The results of this study will be of great significance to improve our understanding of regional hydrological processes and regional water resource management.
2. Methods
2.1. Study Area
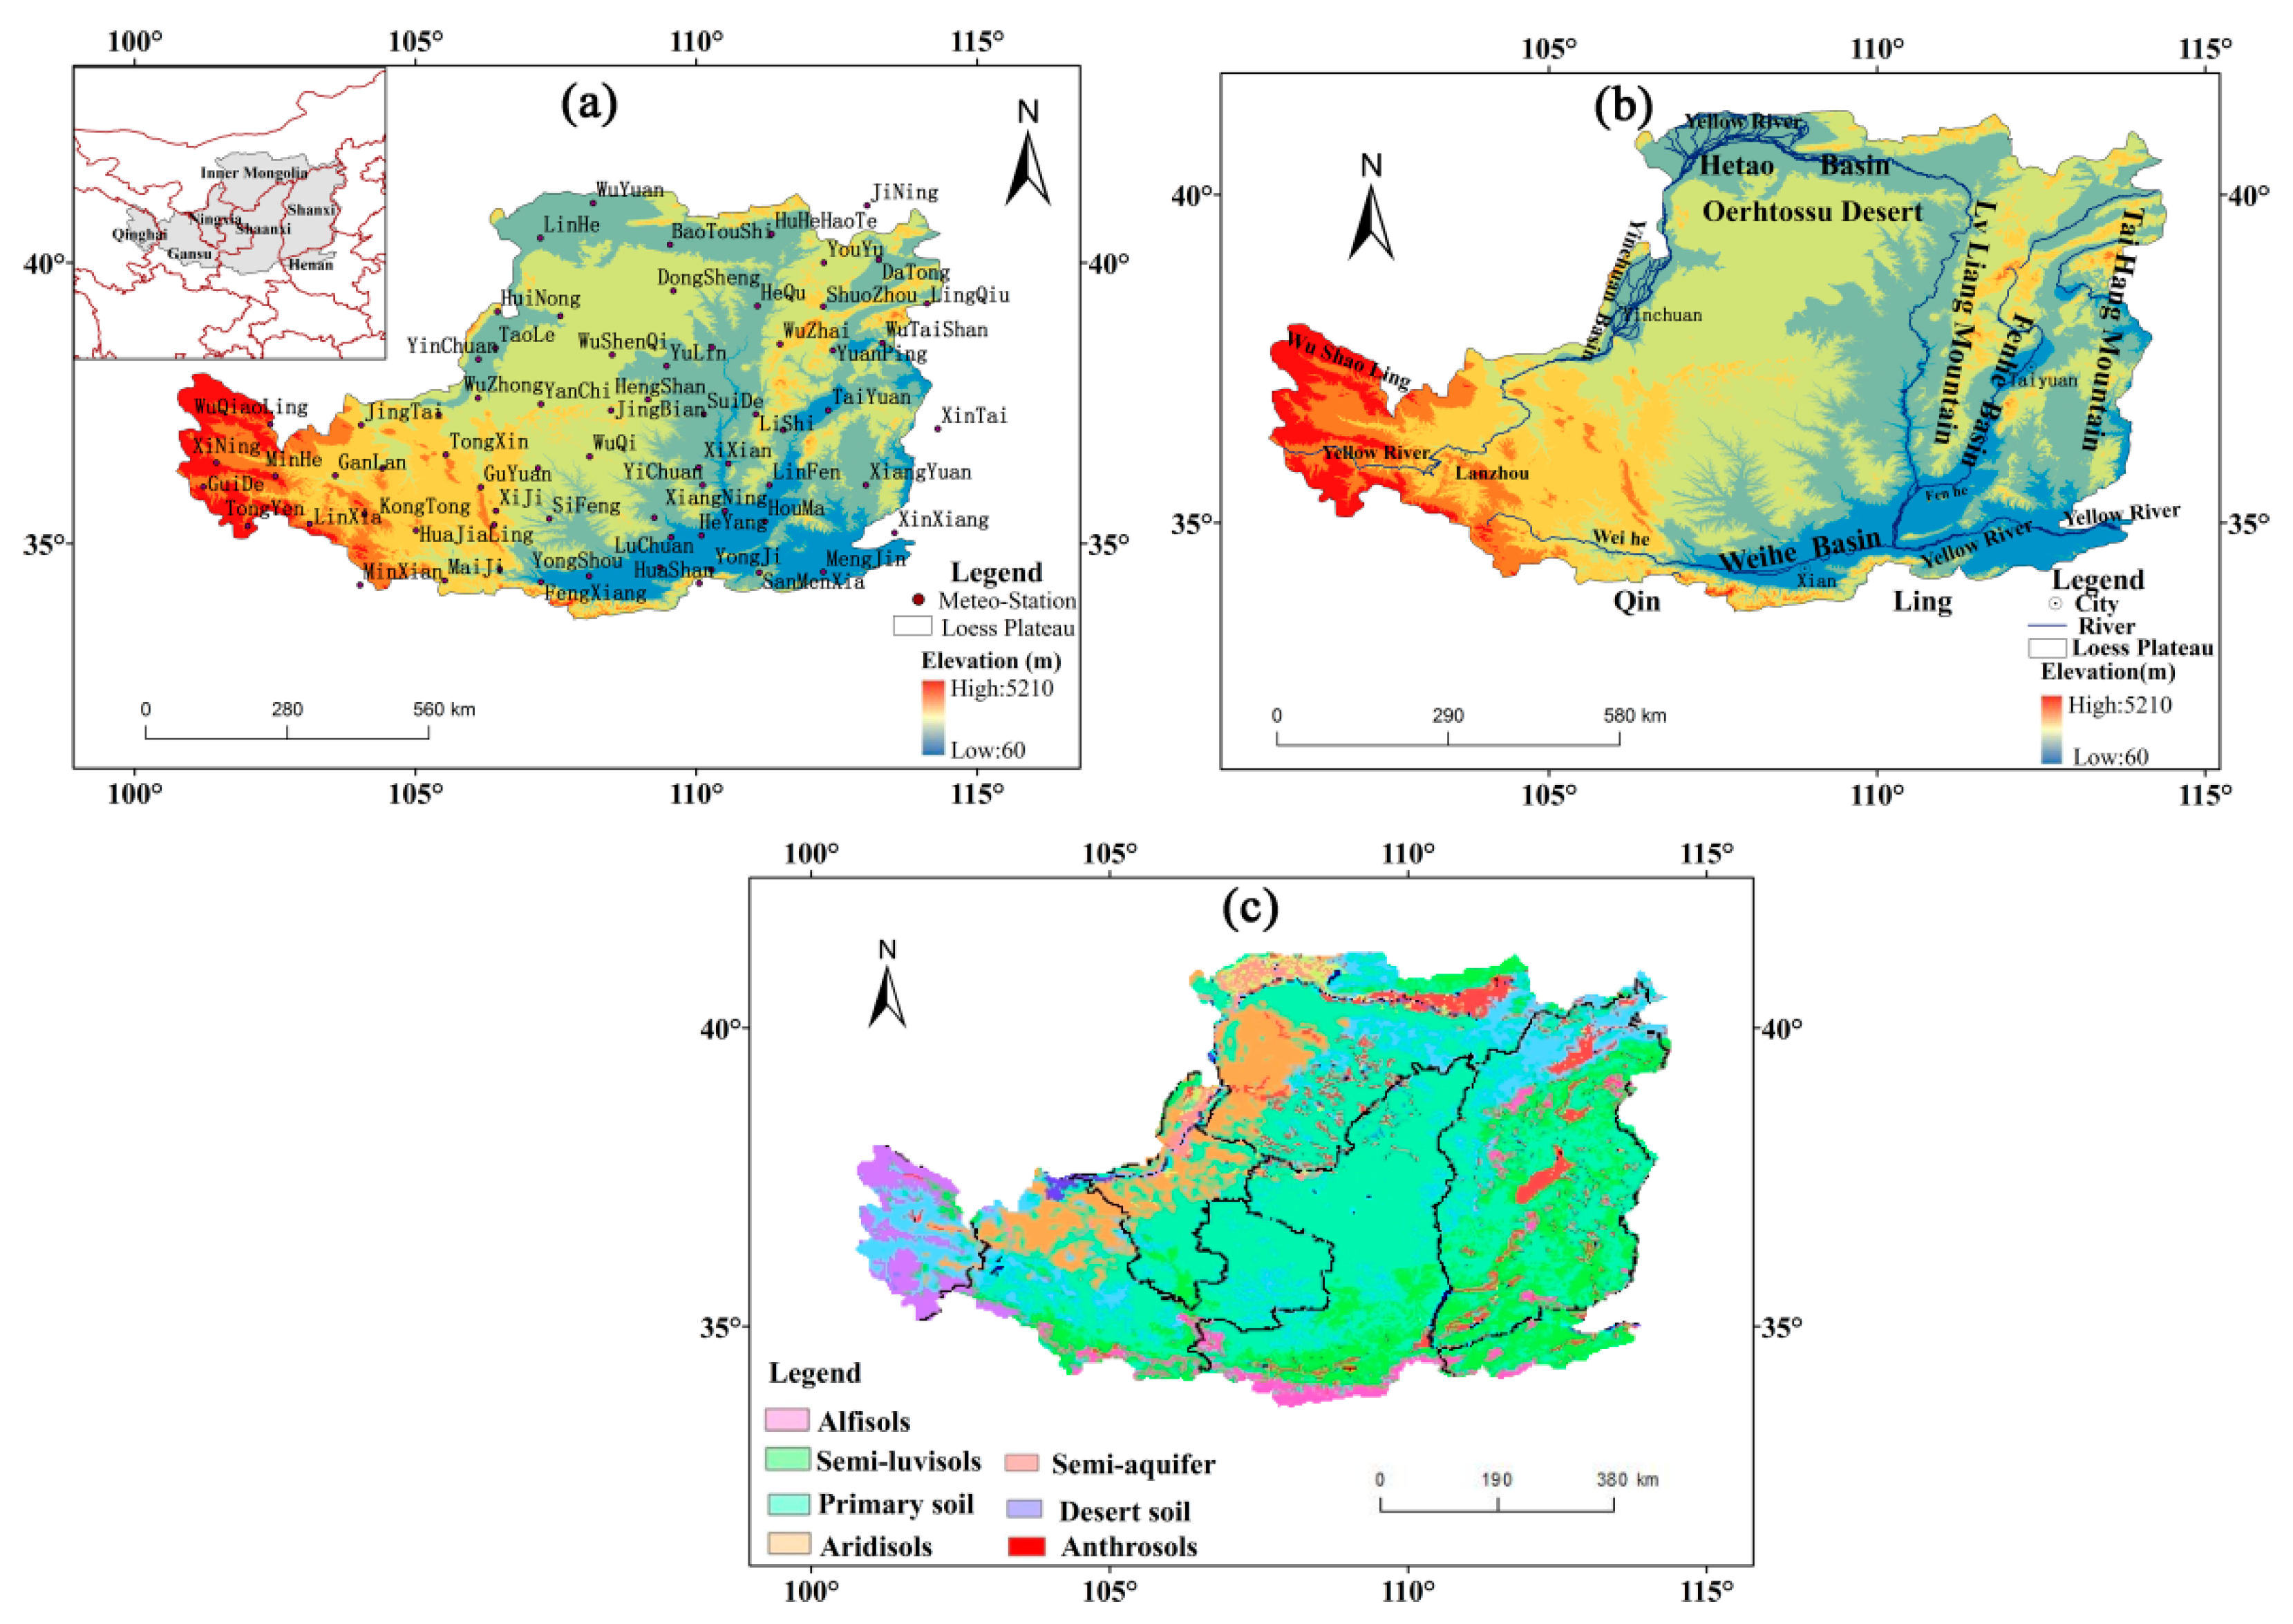
In the current study, the CLP was defined as the area between 33°43’–41°16’ N and 100°54’–114°33’ E [36] and has three geomorphic units: the mountain region (MR, including Qin Ling Mountains in the southern CLP, Wu Shao Ling Mountains in the western CLP, and Taihang Mountains and Luliang Mountains in the eastern CLP), the valley region (VR, including Hetao Basin in the northern CLP, Weihe Basin in the southern CLP, Yinchuan Basin in the western CLP, and Fenhe Basin in the eastern CLP), and the hill region (HR, mainly concentrated in the inner part of the CLP) (Figure 1). The area is approximately 64 x 104 km2, which is approximately 6.67% of the total area of China. The terrain of the CLP is high in the southwest region and low in the southeast. Based on long-term observation data from 70 national meteorological observatory stations in and around the CLP, we found the mean annual temperatures ranging from 3.6 to 14.3 °C and annual precipitation ranging from 150 to 750 mm. The soil type is mainly brown soil and cinnamon soil. Vegetation types are diverse and are mainly grassland, woodland (the categories of trees in the CLP mainly include Chinese catalpa, cypress, and Chinese prickly ash), and arable land [37]. The CLP has a long history of agricultural cultivation and its main types of crop producation are wheat and millet [38].
2.2. Data
This study used continuous daily series data from 1960 to 2017 at 70 national meteorological observatory stations in and around the CLP (Table 1). Data included wind speed (WS) (m/s), sunshine duration (SD) (h), daily mean temperature (T) (°C), daily maximum temperature (Tmax) (°C), daily minimum temperature (Tmin) (°C), and relative humidity (RH) (%). Data were provided by the China Meteorological Administration (http://data.cma.cn/site/index.html). Large-scale circulation parameters data were downloaded from the National Oceanic and Atmospheric Administration (http://www.esrl.noaa.gov/psd/data/climateindices). Four seasons were divided in this study as: spring (March to May), summer (June to August), autumn (September to November), and winter (December to February).
2.3. Methods
2.3.1. ET0 Calculation Method
In this study, the FAO Penman–Monteith method [13] was used to estimate ET0 variations. The FAO–PM equation to calculate ET0 (mm.day−1) is given as:
where ET0 is the daily potential evapotranspiration rate, ; Δ is the slope of the saturation vapor pressure curve, ; Rn is the net radiation, ; G is the soil heat flux density, ; γ is the psychometric constant, ; is the wind speed at the height of 2 m, ; T is the temperature at the height of 2 m, °C; is the saturated water vapor pressure; is the actual water vapor pressure, and is the saturated water vapor pressure differential value, .
2.3.2. Mann–Kendall Trend Test
The Mann–Kendall (MK) test was used to detect regional ET0 trends and hydrological imbalances [39,40]. For a given data series, the statistical value S and the standardized test statistics ZMK were calculated as follows [41]:
and
where and are the values of the year i and j of the time series, n is the length of the time series data, is the binding value corresponding to the pth number, and is the variation trend of the time series data. If , the time series data have an increasing trend over time; if the contrary, the data have a decreasing trend. If , then the null hypothesis that there is a significant trend in the time series data was rejected. The values can be found in the standard normal distribution chart. When taking a = 5% as the significance level, the corresponding value of is 1.96; when taking a = 1% as the significance level, the corresponding value of is 2.58.
2.3.3. Wavelet Transform Coherence and Contribution Rate Analysis
Wavelet transform coherence is a new signal analysis technology combining wavelet transform and cross-spectrum analysis. It can study the correlation between two time series in the time–frequency domain from multiple time scales [42]. Wavelet transform coherence was introduced by Hudgins et al. [43] among others. In hydrology, it has been used in rainfall–runoff cross-analysis [44].
Here, indicates the cross wavelet power spectrum, is the smoothing function, , are the normalized constants, and indicates a rectangular function. In the formula, Y is the standardized value of the ET0, are standardized values of the meteorological parameters, are regression coefficients after sequence normalization, is the relative contribution rate of variation to Y variation.
3. Results
3.1. Changes in the Annual and Seasonal ET0 of Different Topographic Regions
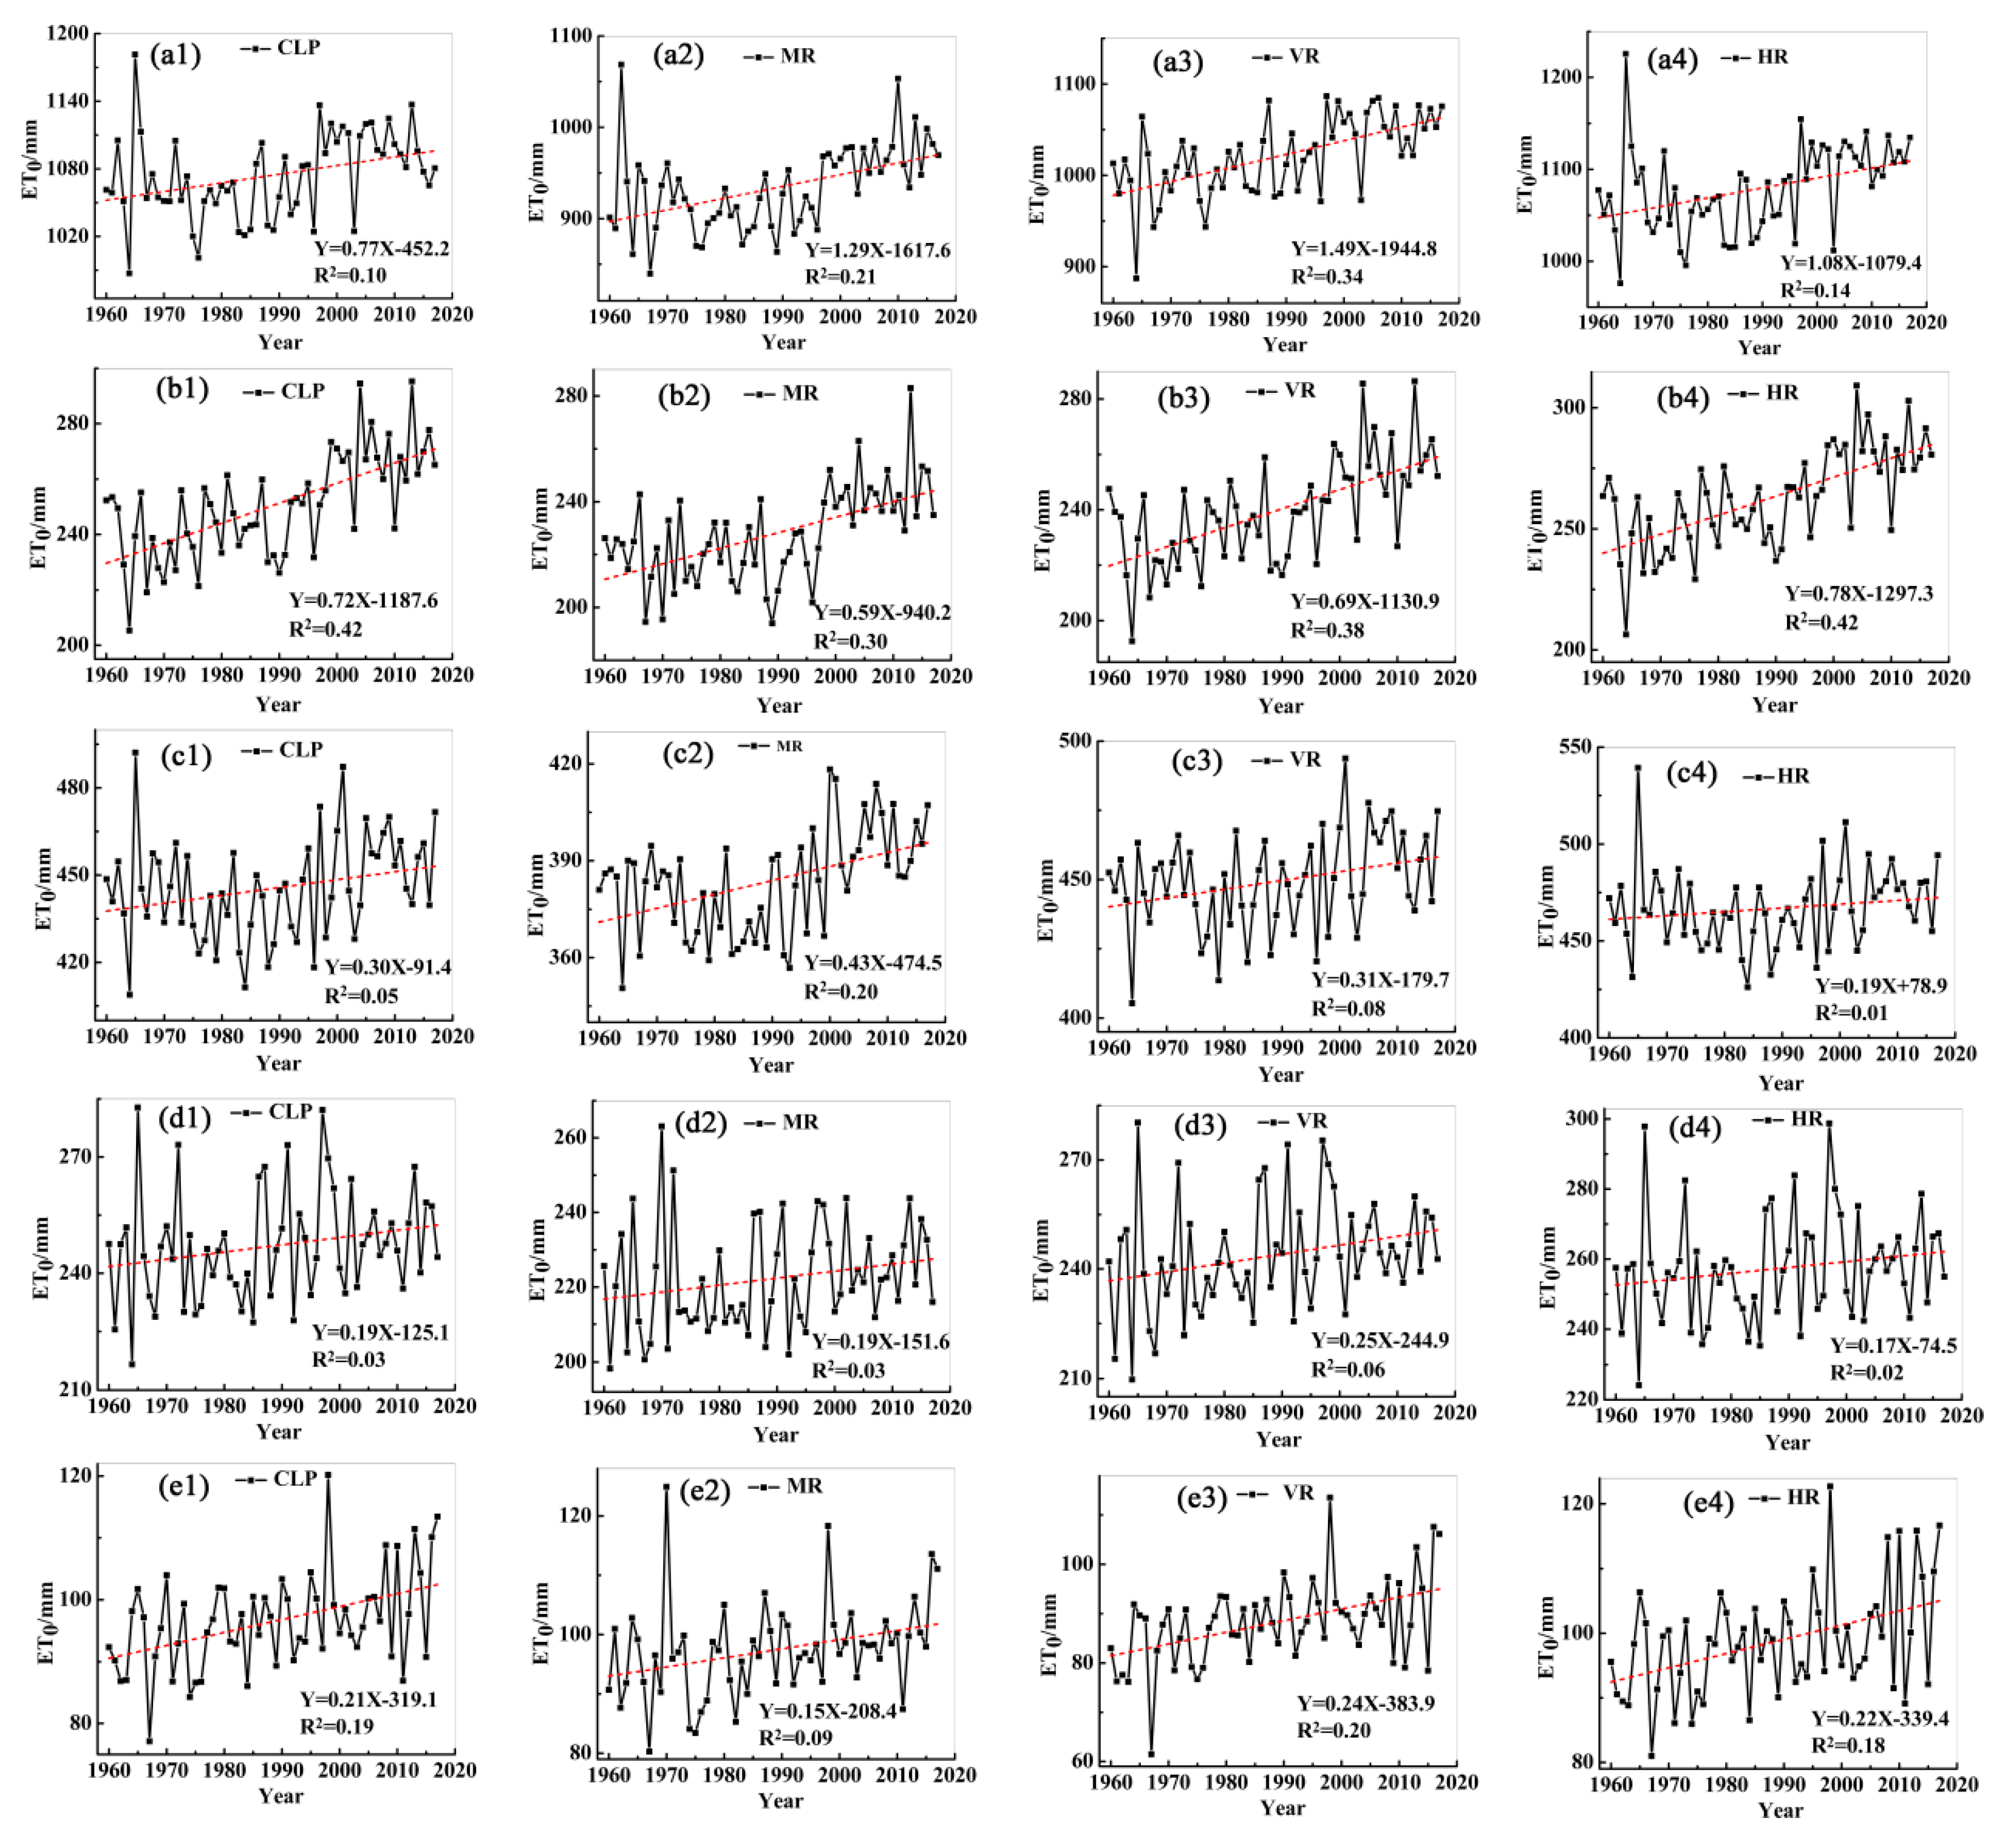
Figure 2 shows the seasonal and annual mean ET0 over the entire CLP and the three topographic regions from 1960 to 2017. The annual mean ET0 was 1074 mm during 1960–2017 in the CLP, and the maximum and minimum values were 1181 mm and 987 mm, respectively. Comparing the ET0 values of the three topographic regions (MR, HR, and VR), the mean annual ET0 value of the HR (1078 mm) was larger than that of the MR (933 mm) and the VR (1021 mm). Over recent decades, the mean annual ET0 value of the CLP displayed an upward trend of 7.7 mm/10a. There was a decreasing trend during the 1960s and 1970s. During this period, the ET0 value exhibited a decreasing trend of fluctuations from the 1960s (1074 mm) to the 1970s (1052 mm), and then, a relatively stable trend of regional ET0 variation occurred in the period of the 1970s to the 1990s. A step increase was observed in 1997. During 2005–2017, the annual ET0 of the CLP showed a decreasing trend.
During the study period, the mean ET0 values in spring, summer, autumn, and winter were 250, 445, 247, and 97mm, respectively. Comparing the four seasons, the mean ET0 value for summer during 1960–2017 was higher than that for winter. A larger temporal variation can be observed in the mean ET0 values for the spring and autumn. For spring (Figure 2b), the ET0 exhibited a relatively consistent value from 1960 to 1990, after which time a remarkable increase can be seen since the 1990s. A similar variation appeared in the mean ET0 for the summer and autumn. A slightly decreasing trend was displayed in the mean ET0 values for the summer and autumn during the period of the 1960s to the mid-1980s. From the mid-1980s, the mean ET0 for the summer and autumn showed increasing trends. The temporal variation of the mean ET0 in winter showed a similar trend to that in the spring. Regarding the three topographic regions (MR, HR, and VR), the mean ET0 values for the three regions exhibited similar temporal variations in all seasons except for the summer. In summer, the mean ET0 of the MR showed a slightly increasing trend (Figure 2c).
3.2. Spatial Distribution of Et0 in Different Terrain Regions and Seasons
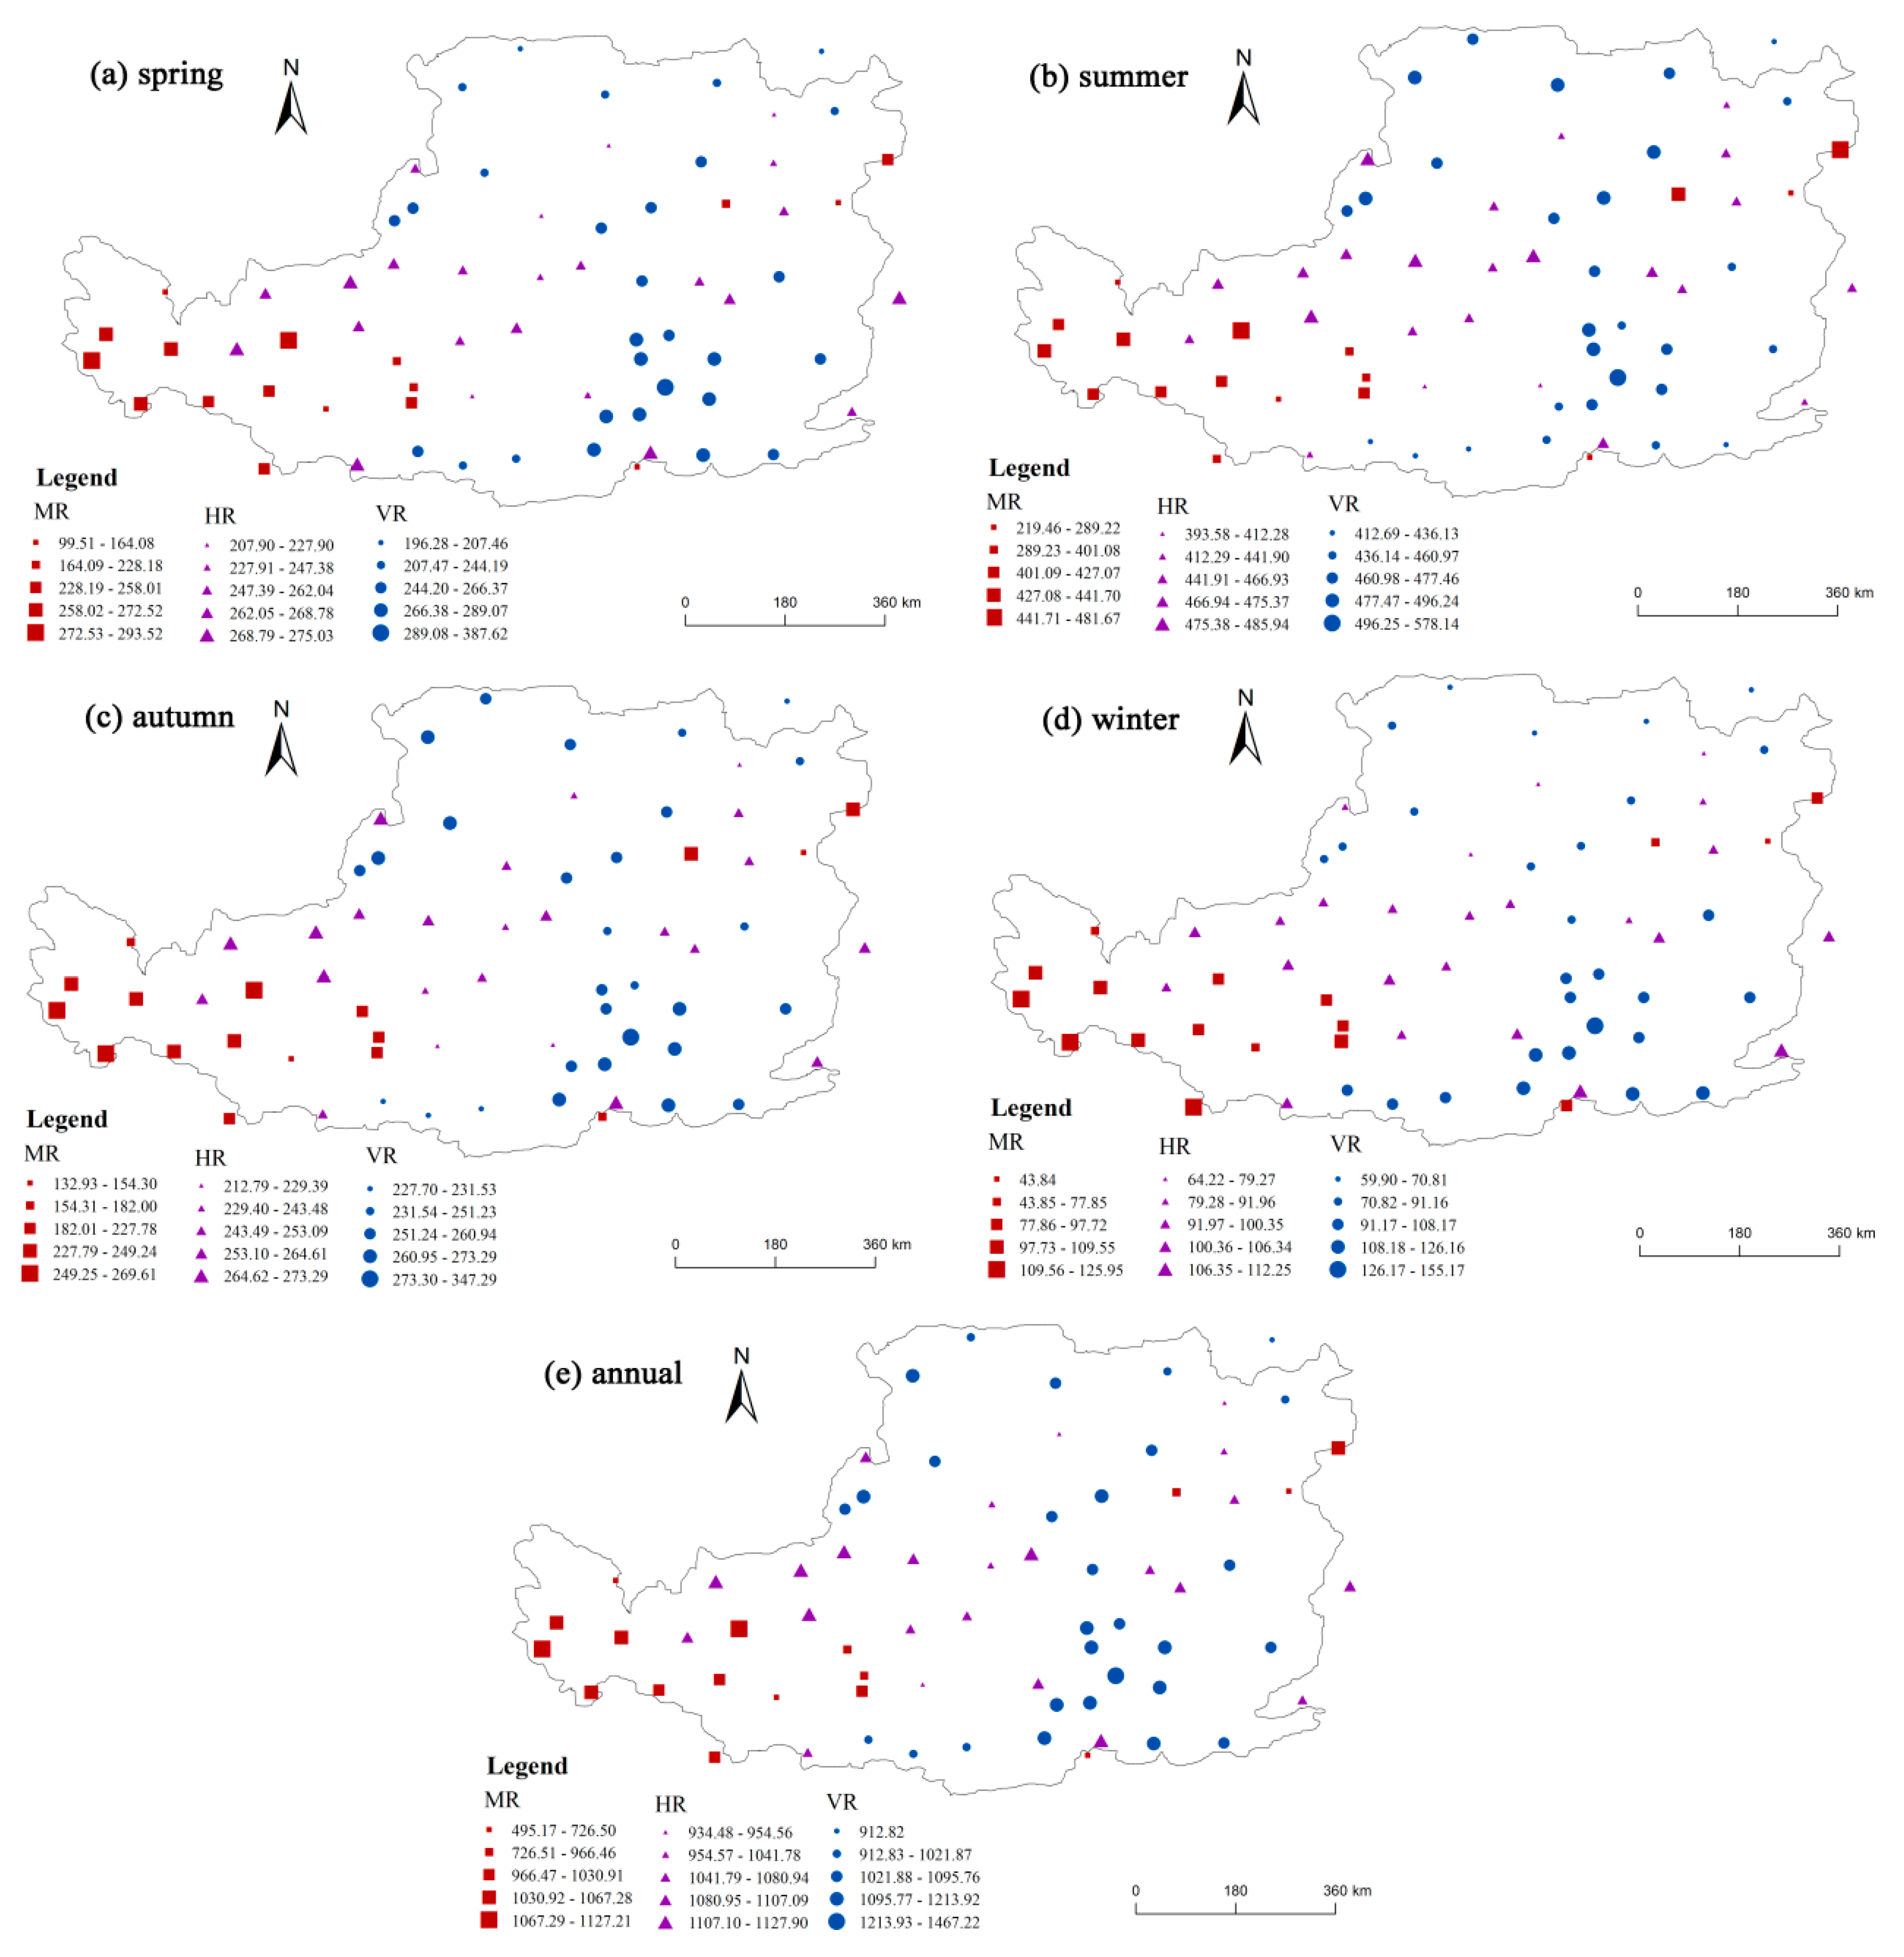
Figure 3 shows the spatial patterns of the seasonal and annual ET0 values mean from 1960 to 2017. During 1960–2017, the annual mean ET0 of the CLP was 1044 mm, ranging from 495 to 1467mm. The highest value of ET0 was at the Xiangning station (1467 mm), and the lowest value was at the Wutaishan station (495 mm). The ET0 values in the southern and eastern areas of the CLP were always higher than those in the western part of the CLP (Figure 3), which may be related to the different spatial distributions of the climatic conditions (e.g., T, WS, RH, and SD) and the complicated topography in the CLP. In spring, the maximum mean ET0 value occurred at the Xiangning station (388 mm) and the minimum mean ET0 value was observed at the Wutaishan station (100 mm). The mean ET0 values of the VR were higher than those of the MR and HR. In summer, the Xiangning station (578 mm) displayed the maximum average ET0 value, and the Wutaishan station (219 mm) displayed the minimum average ET0 value. The average ET0 values of the VR were higher than those of the HR and MR. As for the autumn, there was a minimum average ET0 value observed at the Wutaishan station (133 mm), and a maximum average ET0 value occurred at the Xiangning station (347 mm). In winter, the Xianging station (155 mm), located in the southeastern part of the Loess Plateau, displayed the maximum average ET0 value, and a minimum average ET0 value occurred at the Wutaishan station (44 mm). The average ET0 values of the MR were lower than those of the HR and VR.
In addition, the ET0 of the VR had higher values throughout the entire year, especially in spring and summer. The VR region is an important food-growing area for the CLP, and the higher ET0 values in summer and autumn may result in the regional water shortages being more serious. Therefore, water management should pay more attention to the higher ET0 values of the VR during the spring and summer.
3.3. Spatial Variation of the Trends of Annual and Seasonal Et0 Series—MK Tests
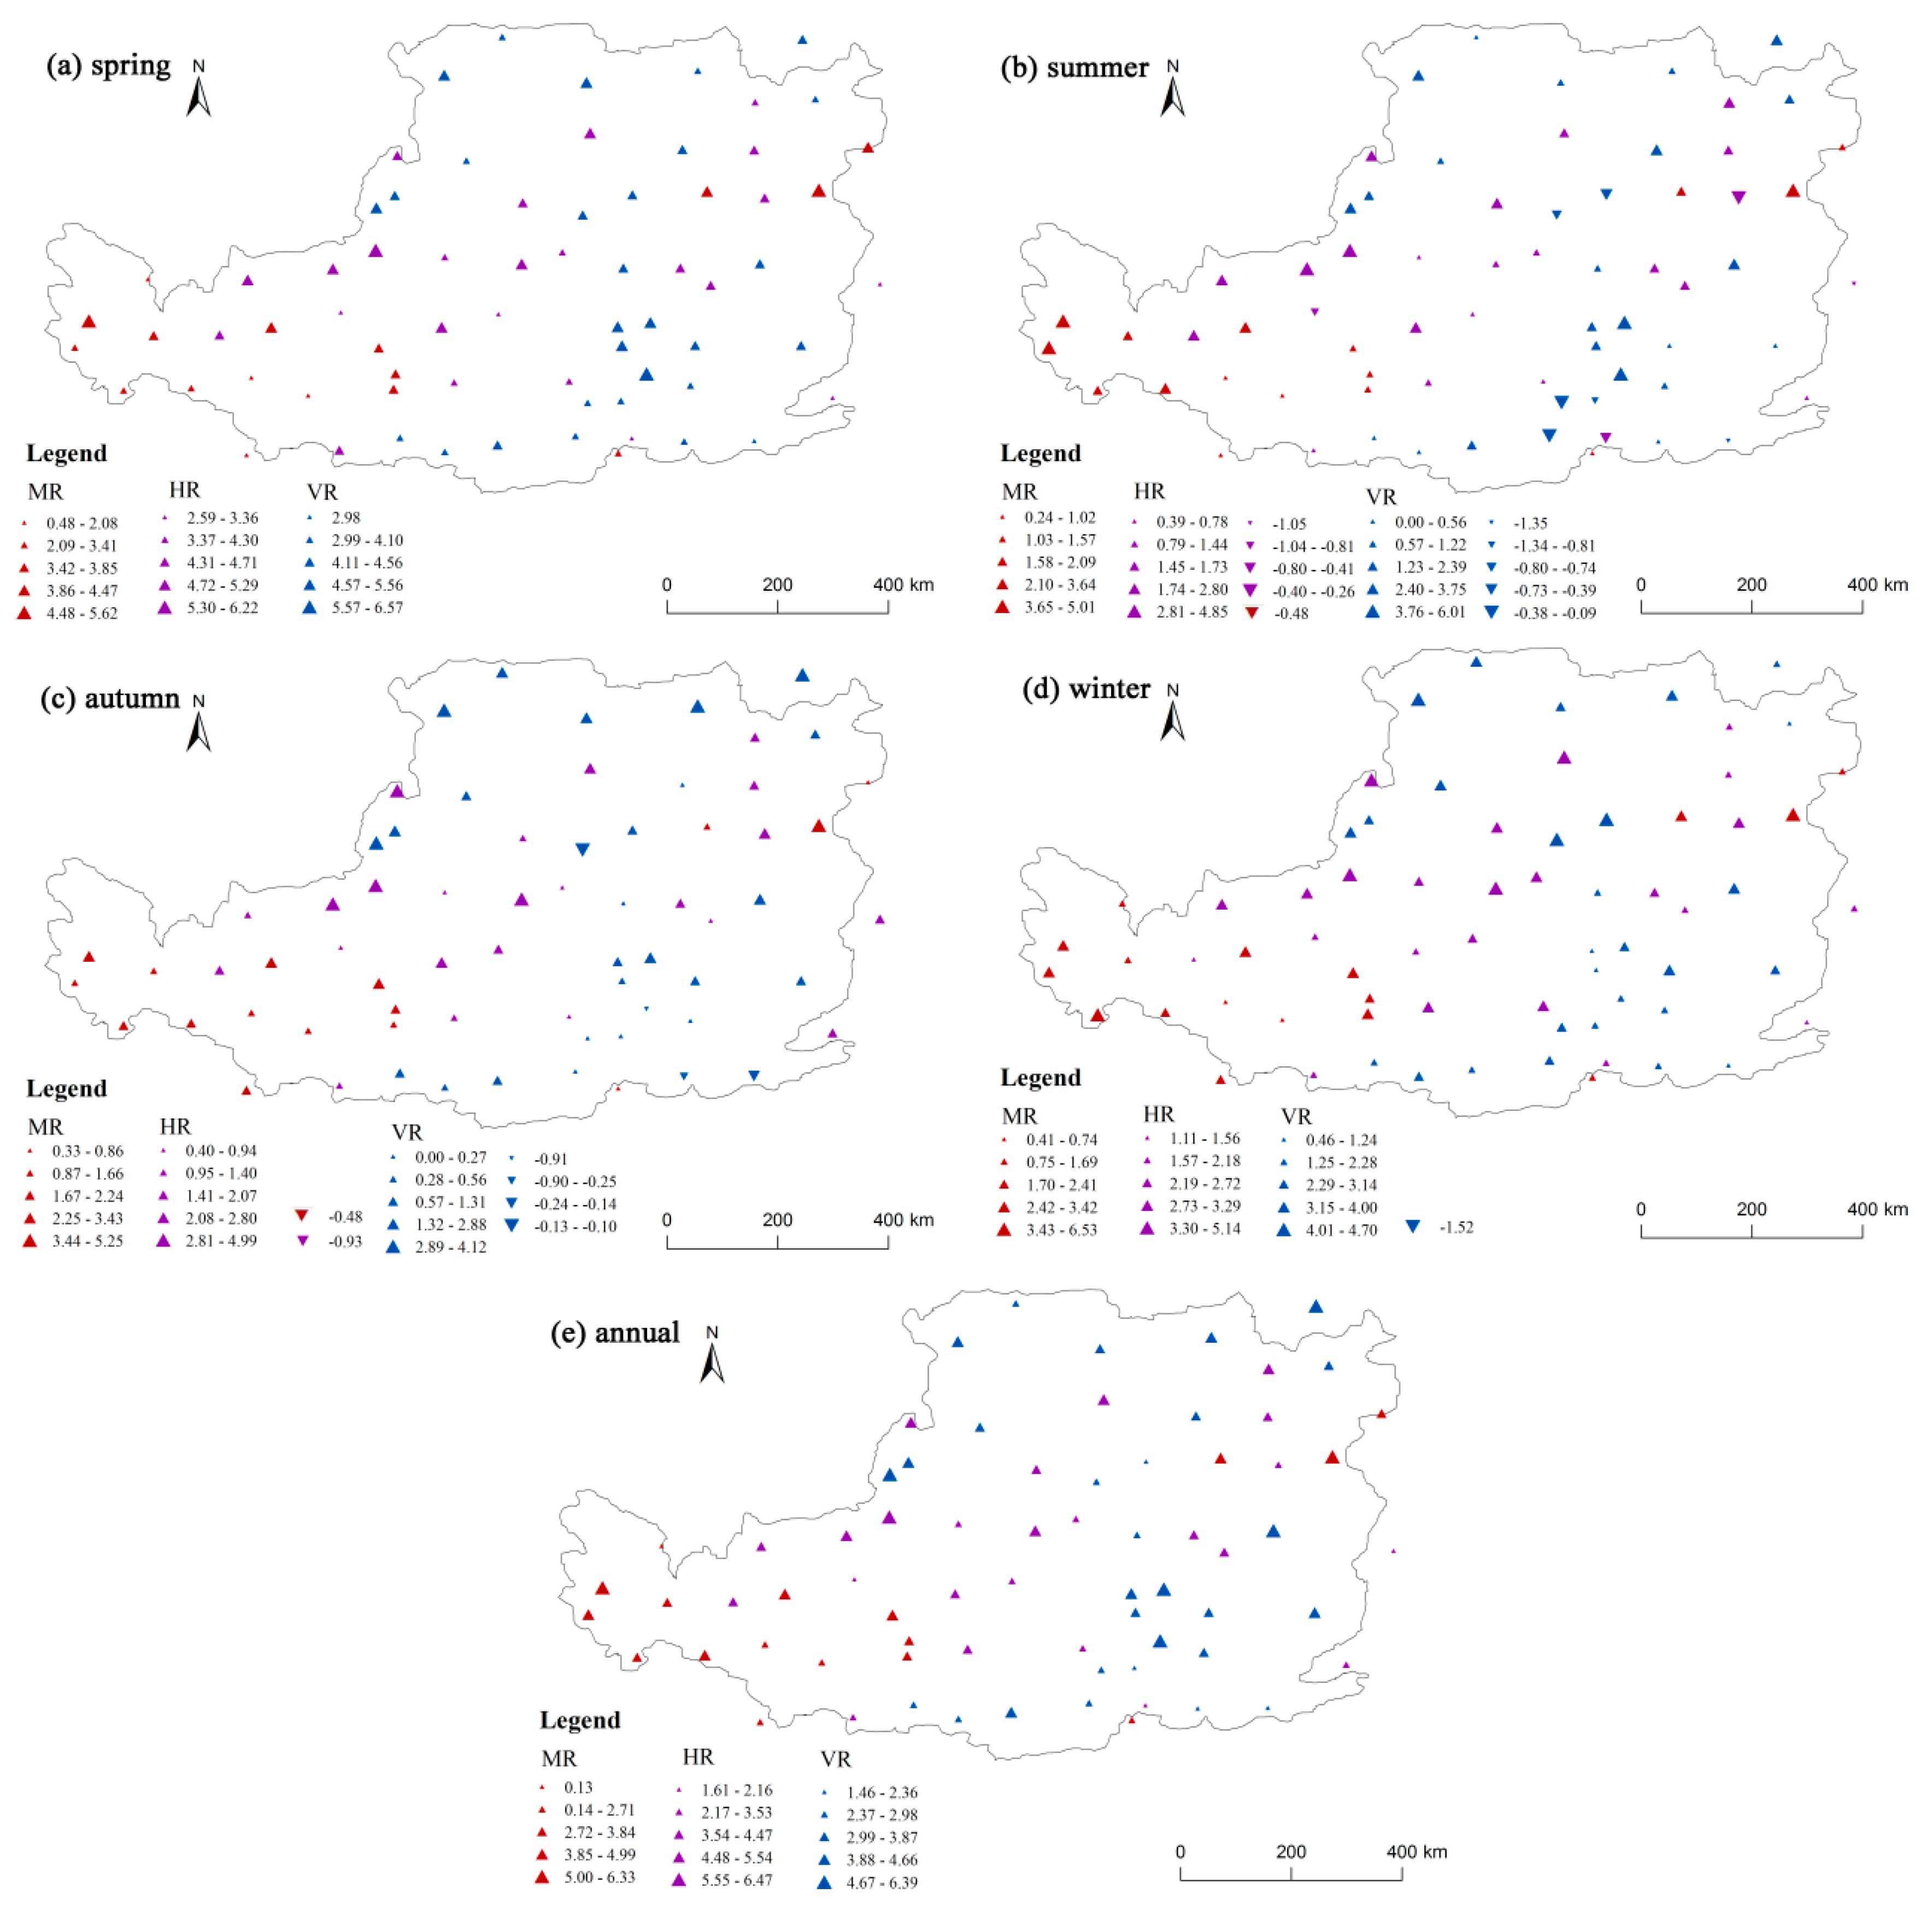
Nonparametric Mann–Kendall tests were performed for 70 meteorological stations to analyze trends of annual and seasonal ET0 series in the CLP during 1960–2017 at the 5% significance level (Figure 4). The annual mean ET0 series of the majority of stations displayed an increasing trend during 1960–2017. Approximately 93% of stations exhibited a statistically significant increasing trend in the annual mean ET0 series. The annual ET0 of the HR regions had a stronger significant increasing trend than that of the VR and MR regions. In the HR region, the most significant increasing trend appeared at the Wuzhong station (6.47 mm/a), and the slightly increasing trend of the annual mean ET0 was observed at the Xintai (1.91 mm/a) and Tongxin (1.61 mm/a) stations. In the VR region, the most significant increasing trend occurred at the Xiangning station (6.39 mm/a), and the increasing trend of the Mengjin station (1.46 mm/a) was not obvious. In the MR region, the annual mean ET0 series had overall significant increasing trends, except for Wushaoling station. However, the increase trend of the Wushaoling station (0.13 mm/a) was not obvious.
In spring, the majority of stations showed statistically significant increasing trends, with the largest increase at the Xiangning station (6.57 mm/a), and regional magnitudes declined from the VR regions to the MR regions. In summer, 59 stations showed increasing trends, while decreasing trends occurred in the majority of stations in the MR and HR. In autumn, more than 90% of the total stations showed an increasing trend during 1960–2017, and only six stations (WuQiaoLing, SanMenXia, MengJin, XiangNing, YongJi, YuLin) had statistically significant decreases. In winter, the ET0 exhibited increasing trends at 69 stations, mostly in the MR and HR regions. A decreasing trend was observed at Hequ station, which was located on the eastern edge of the Loess Plateau.
Overall, on a temporal scale, an increasing trend existed in the CLP throughout almost the entire year, especially in spring. On a spatial scale, the seasonal ET0 in the majority of the CLP exhibited increasing trends, and decreasing trends mainly occurred in the HR and VR regions.
3.4. Wavelet Transform Coherence of Et0 and the Large-Scale Circulation Patterns
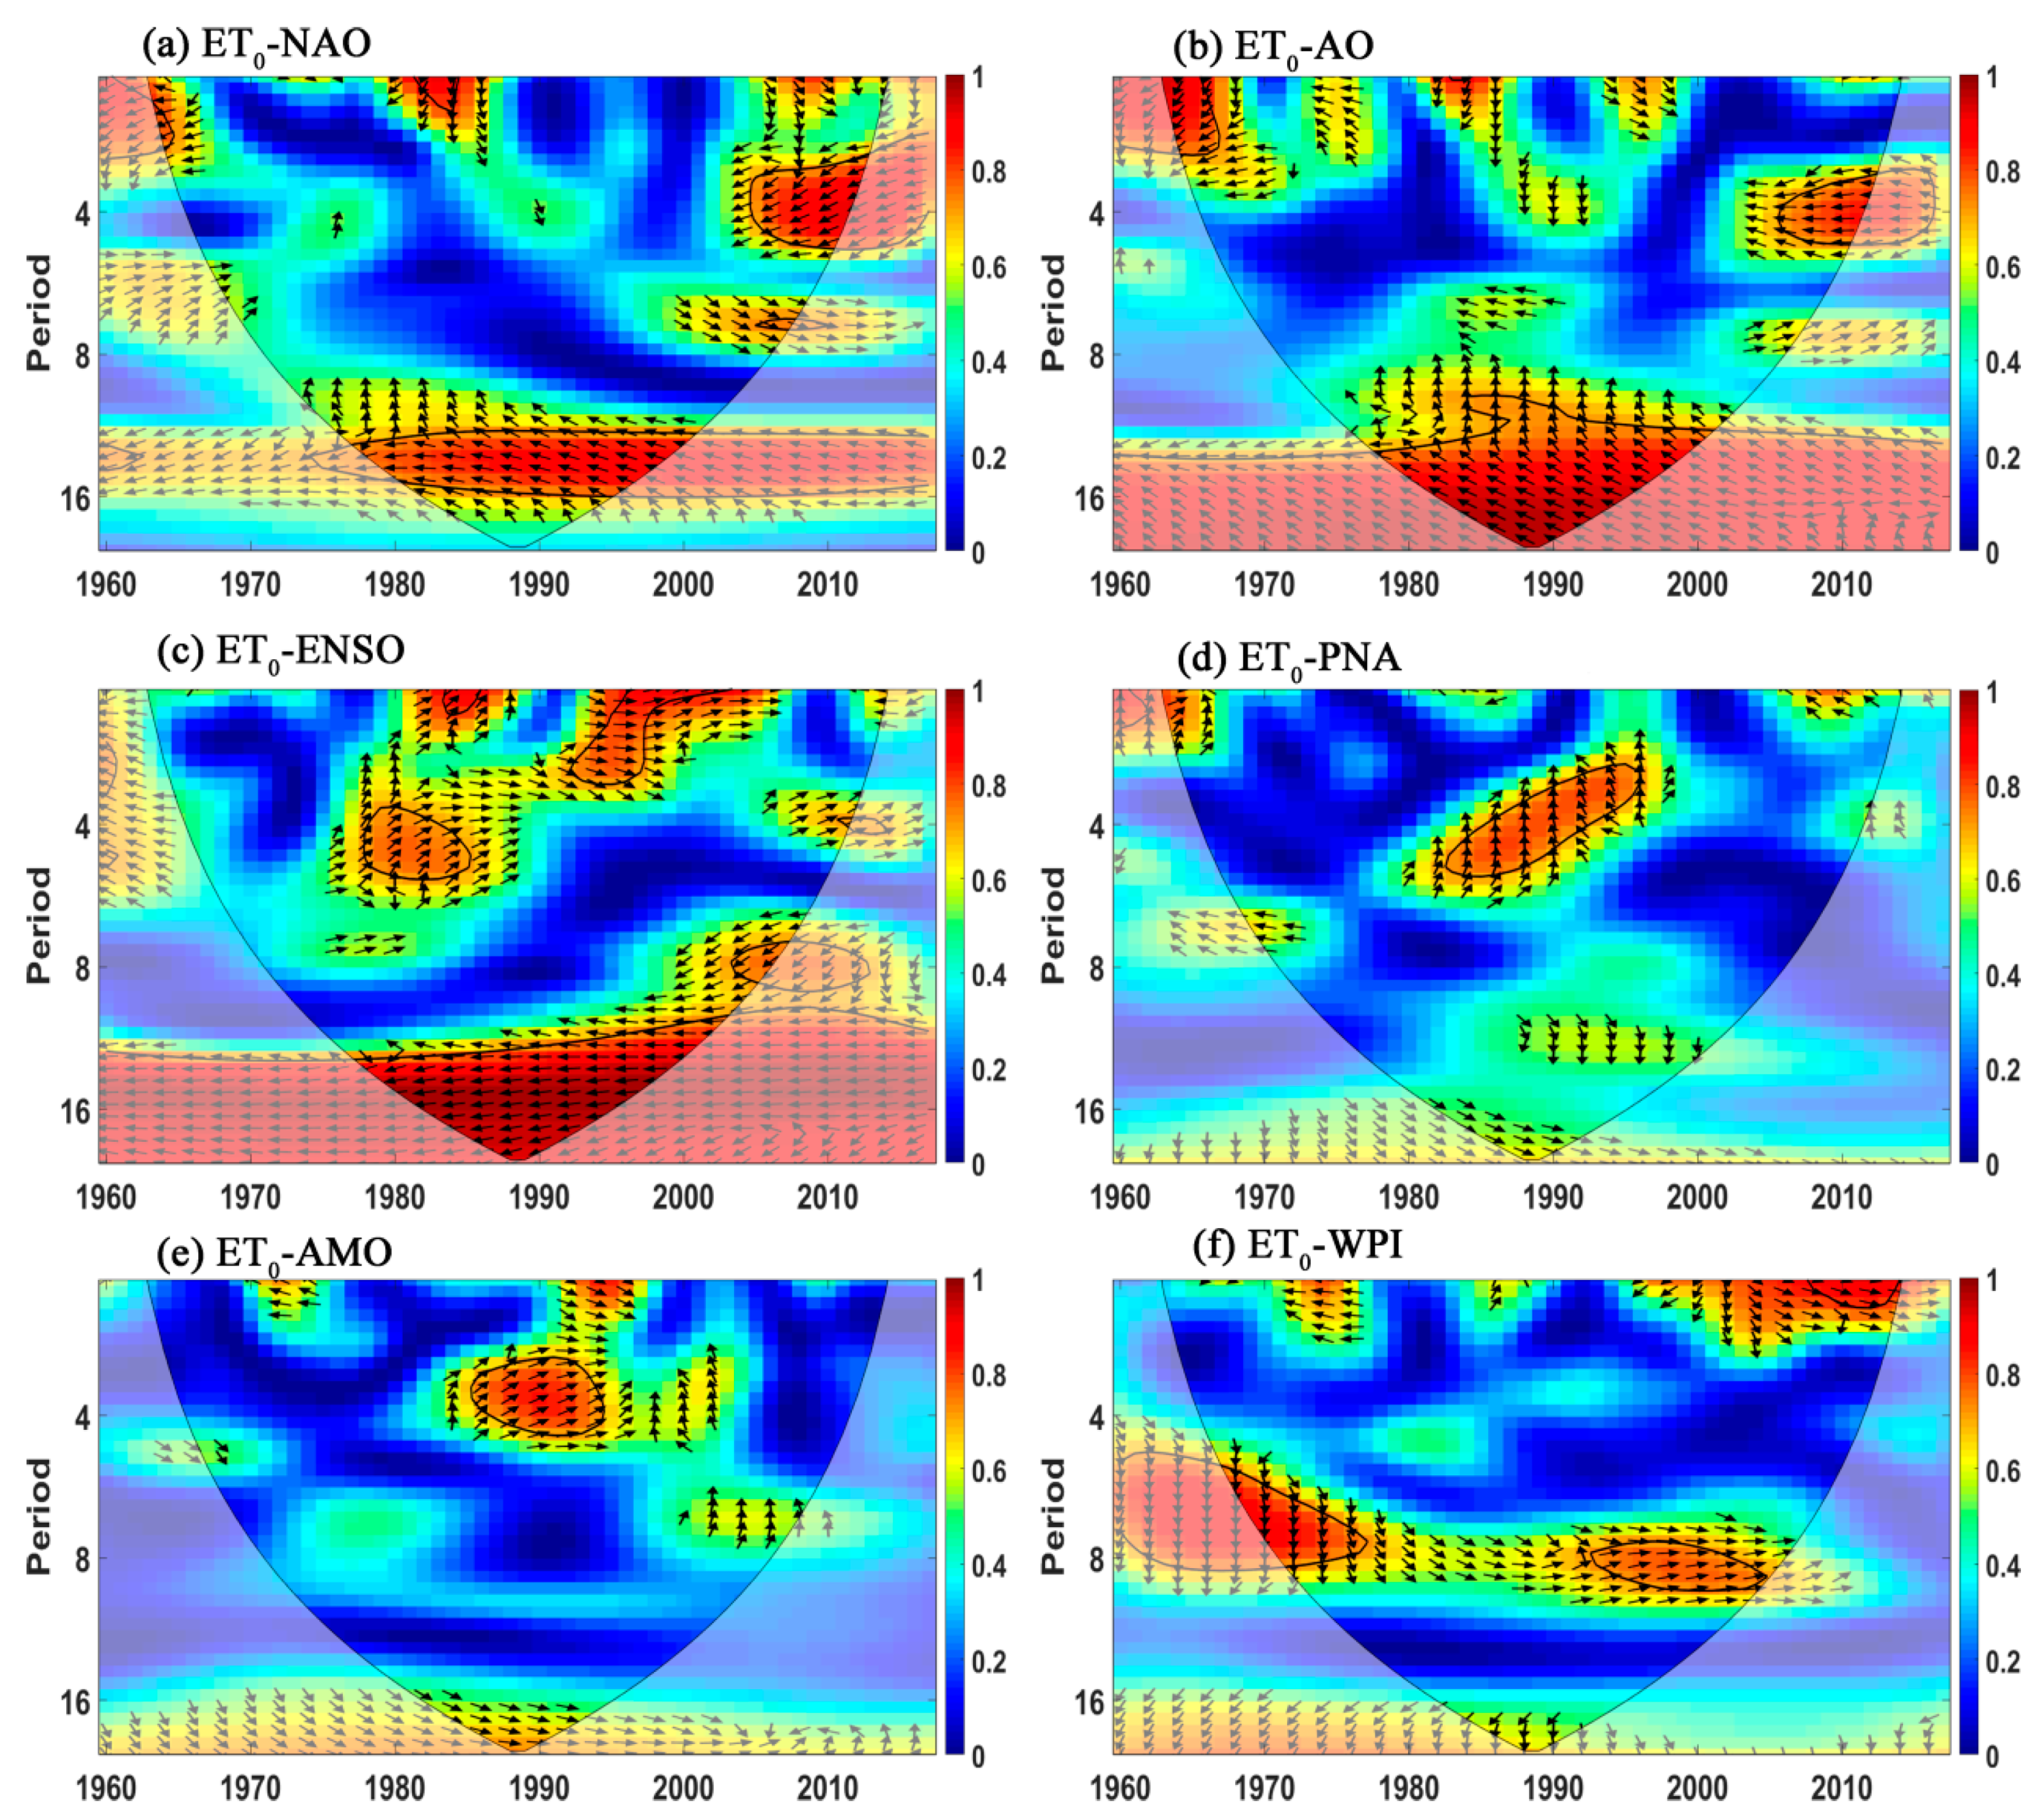
Figure 5 shows the wavelet transform coherence (WTC) results for the ET0 and the large-scale circulation patterns (for example, NAO, Atlantic Multidecadal Oscillation (AMO), Pacific–North American teleconnection (PNA), etc.). For ET0 (Figure 5a), the WTC with NAO had very good negative correlations in the periods of 1980–2000 and 2003–2009, which indicated it to have large interannual covariance at scales of 12–16 and 3–5 a, respectively. In the resonance period of 3–5 a, its coherence phase angle was 160°, and its coherence phase angle was 210° in the resonance period of 12–16 a. The resonance period of ET0 and AO in the high-energy region was mainly distributed in the resonance period of approximately 3–6 a in around 2008, and in the resonance period of 10–20 a in 1980–2000 (Figure 5b). Figure 5c shows that in the cone of influence (COI) region, the resonance period of ET0 and El Niño–Southern Oscillation (ENSO) passing the 95% red noise test was 3–6 a; there was a significant resonance relationship at this frequency band, and the oscillation cohesion was the strongest. The coherence phase angle between ET0 and ENSO was −60°, showing the ENSO lags behind the ET0 by around 0.5–1 year band between 1978 and 1984. This phase change was relatively stable. There was significant coherence power and a consistent phase angle for the period 1983–1993 associated with signals in the 2–6 years band, and in this period the phase angle was 360°, which indicated the ET0 lags about 2–6 a behind PNA (Figure 5d). Similar to the PNA, a significant coherence power and consistent phase appeared in the period 1985–1994 associated with signals in the 2–5 years band and the coherence phase angle of ET0 and AMO was −45°, which means that AMO lags behind ET0 by around 0.25–0.63 a. The ET0 and WPI showed significant resonance relationships between 6 and 8 years in 1968–1976, reflecting that the ET0 was ahead of WPI; another significant resonance relationship was 7–10 a, and the coherence phase angle of ET0 and WPI was 10°, indicating that ET0 lags behind WPI by around 0.19–0.28 a (Figure 5f).
4. Discussion
4.1. Relationships between Regional Et0 and Climatic Factors
Table 2 shows the correlation coefficients between the ET0 and the meteorological parameters. In the CLP, the regional RH variation had a significant association with the variation of the ET0 (i.e., the correlation coefficient is 0.76). In addition, there is an obvious correlation between the variation of regional ET0 and Tmax/T. Regarding the three geomorphic regions, higher correlation coefficients between the regional ET0 variation and Tmax variation were observed at the MR (0.77) and VR (0.84) regions. For the HR region, the regional ET0 displayed the most remarkable (i.e., passed the 0.1 level test) association with the variation of RH, followed by the variations of Tmax and T. According to the results in Table 2, the main meteorological controlling parameters for the regional variation of ET0 in the CLP were RH, T, and Tmax, which indicated that regional ET0 is more sensitive to the variations in regional relative humidity and air temperature.
However, the influences of meteorological controlling parameters on regional ET0 variations have spatial variation among the three topographic regions. There is a remarkable correlation relationship between the variation of regional T and the regional ET0, and variations in regional RH and T may cause regional ET0 variability. Besides, the WS plays an important role in regional ET0 variation, whereas the SD has no significant association with the variation of regional ET0.
To assess the contributions of the main meteorological controlling parameters to the regional ET0 variation in the entire CLP, the contribution rates were analyzed using the method contribution rate analysis. The results (Table 3) show the T variation had the highest contribution rate (42%). The variations of RH, WS, and SD made smaller contributions to the ET0 in the CLP. As for the MR region, the largest contribution rate for the regional ET0 variation was T variation (40%), followed by variations of Tmax (26%), Tmin (26%), SD (4%), RH (4%), and WS (1%). As for the VR region, the contribution rate pattern had a similar order to that of the MR region. As for the ET0 variation in the HR region, the variation of Tmax displayed the highest contribution rate (39%). The contribution rates of the regional WS, SD, and RH were also relatively low. In short, we can conclude that the variation of regional ET0 in the CLP was mainly controlled by regional air temperature variations, while the influences of the regional WS, SD, and RH on regional ET0 variation were relatively weak.
4.2. Comparison with Other Study Areas
Recently, some researchers have paid increasing attention to assessing regional ET0 variations. Due to the different environments in various regions, temporal and spatial variations of the ET0 in different regions have been proven to have significant differences (Table 4). In a study of the ET0 for the whole of China, researchers found that the overall ET0 variations in China showed a downward trend [45]. This same variation was also found in the northwestern part of China [28]. However, in the southwestern part of China [46], the Wei River basin [47], and the Yangtze River [48], the ET0 had increasing trends. The trend of the CLP is the opposite to the trend of the whole of China. Comparing the ET0 trend in the three topographic regions (MR, HR, and VR), the trend of the ET0 in the VR (1.49 mm/a) was larger than in the MR (1.28 mm/a) and HR (1.09 mm/a).
5. Conclusions
During the period of 1960–2017, the mean annual ET0 of the CLP was 1074 mm, and the maximum and minimum values were 1181 mm and 987 mm, respectively. The trends of ET0 in three different topographies were generally the same, however, the ET0 values differed. The ET0 in the HR was the highest of the three regions, followed by the VR, and the ET0 in the MR was the lowest. The magnitude of the ET0 varied in different seasons; in spring, summer, and autumn, the magnitudes of the ET0 were consistent with the annual ET0 variation, which was the largest in the HR, the second-largest in the VR, and the smallest in the MR. In winter, the ET0 values of the HR and MR were very similar, while the ET0 of the VR was the smallest.
The spatial distribution of the annual ET0 in the study area varied in different topographies. The ET0 value in the MR decreased from west to east, and the distribution of the ET0 in the HR was consistent with the MR. The larger ET0 values in the VR were mainly concentrated in the eastern CLP, and the rest were mostly distributed in Inner Mongolia. In the four seasons of comparative analysis, the larger values of the MR were distributed in the western region, and the ET0 distributions in the HR and VR differed. The annual mean ET0 series of the majority of stations displayed increasing trends during 1960–2017. Approximately 93% of stations exhibited a statistically significant increasing trend for the annual mean ET0 series. The annual ET0 of the HR regions had a stronger significant increasing trend than that of the VR and MR regions.
The wavelet transform coherence results of ET0 and large-scale circulation factors showed that ET0 had significant correlation with ENSO, PNA, and AMO. The resonance period of ET0 and ENSO was 3–6 a, mainly in 1976–1985. The resonance period of ET0 and PNA was mainly in 1983–1993; the average coherence phase angle was close to 360°, indicating that the ET0 lags behind the PNA by about 2–6 a; ET0 had a very good positive correlation with AMO, and its significant resonance period was 2–5 a.
The RH, T, and Tmax are important meteorological parameters for the variation of control of regional ET0. In the CLP, RH is the main influencing parameter of the ET0 variation; however, in the MR and VR, the correlation coefficients of Tmax were the largest (0.77 and 0.84, respectively). The correlation coefficient of the RH in the HR was 0.71, which is the main controlling parameter. The temperature variation had the highest contribution rate (42%) for the regional ET0 variation in the entire CLP. As an important controlling factor for the regional energy balance, temporal–spatial variation of evaporation usually resulted in the regional water cycle rate increasing and further affected the regional water–heat balance and ecological security. We should pay more attention to the variation of evaporation under climate change, especially temperature change.
Author Contributions
Conceptualization, C.S.; methodology, Z.Z. and Y.W.; resources, C.S.; writing, original draft preparation, C.S. and Z.Z.; writing, review and editing, C.S. and W.C.; supervision, W.C.; funding acquisition, C.S. All authors have read and agreed to the published version of the manuscript.
Funding
This research was funded by “National Natural Science Foundation of China (Grant No. 41901022 and 41601317)” and “the Foundation for Applied Basic Research Program, Shanxi Province, China(201901D211388)”.
Acknowledgments
We are grateful for editor and anonymous reviewers for their constructive comments and suggestions.
Conflicts of Interest
The authors declare no conflict of interest.
References
- Han, M.W.; Zhao, G.J.; Mu, X.M.; An, Z.F.; Gao, P.; Sun, W.Y. Spatial and temporal variations of potential evapotranspiration on the Loess Plateau during 1959–2015. Arid Reg. Geogr. 2017, 40, 997–1004. (In Chinese) [Google Scholar]
- Liu, W.; Cao, M.M.; Qiu, H.J.; Guo, S.; Li, R. Spatial and temporal change of the potential evapotranspiration in Weihe River Basin: A case study in Guanzhong Area. Sci. Geogr. Sin. 2014, 34, 1145–1152. [Google Scholar] [CrossRef] [Green Version]
- Bowen, G.J. A faster water cycle. Science 2011, 332, 430–431. [Google Scholar] [CrossRef]
- Yang, Z.S.; Zhang, Q.; Hao, X.C.E. Characteristics of surface evapotranspiration and its response to precipitation in Loess Plateau from 1982 to 2013. In Proceedings of the Annual Meeting of the China Meteorological Society Arid Land Surface Processes and Climate Change in S5, Tianjin, China, 18 May 2015. [Google Scholar]
- Durack, P.J.; Wijffecs, S.E.; Matear, R.J. Ocean salinities reveal strong global water cycle intensification during 1950 to 2000. Science 2012, 336, 455–458. [Google Scholar] [CrossRef] [Green Version]
- Keisling, B.A.; Castañeda, I.S.; Brighamgrette, J. Hydrological and temperature change in Arctic Siberia during the intensification of Northern Hemisphere Glaciation. Earth PlanetaryScienceLetters. 2017, 457, 136–148. [Google Scholar] [CrossRef] [Green Version]
- Arnell, N.W.; Lowe, J.A.; Challinor, A.J.; Osborn, T.J. Global and regional impacts of climate change at different levels of global temperature increase. Clim. Chang. 2019, 155, 377–391. [Google Scholar] [CrossRef] [Green Version]
- Qiu, G.Y.; Li, H.Y.; Zhang, Q.T.; Chen, W.; Liang, X.J.; Li, X.Z. Effects of evapotranspiration on mitigation of urban temperature by vegetation and urban agriculture. J. Integr. Agric. 2013, 12, 1307–1315. [Google Scholar] [CrossRef]
- Gentilucci, M.; Barbieri, M.; Burt, P. Climate and Territorial Suitability for the Vineyards Developed Using GIS Techniques. In Exploring the Nexus of Geoecology, Geography, Geoarcheology and Geotourism: Advances and Applications for Sustainable Development in Environmental Sciences and Agroforestry Research; Springer: Cham, Switzerland, 2019; pp. 11–13. [Google Scholar]
- Song, N.; Sun, J.S.; Wang, J.L.; Chen, Z.F.; Qiang, X.M.; Liu, Z.G. Analysis of difference in crop coefficients based on modified Penman and Penman-Monteith equations. Trans. Chin. Soc. Agric.Eng. 2012, 29, 88–97. [Google Scholar]
- Berti, A.; Tardivo, G.; Chiaudani, A.; Rech, F.; Borin, M. Assessing reference evapotranspiration by the Hargreaves method in north-eastern Italy. Agric. Water Manag. 2014, 140, 20–25. [Google Scholar] [CrossRef]
- Zhao, L.L.; Wang, Z.G.; Xia, J.; Chen, X.; Qin, N.X. Improved Priestley-Taylor Method and its application in complementary relationship evapotranspiration model. Prog. Geogr. 2011, 30, 805–810. [Google Scholar]
- Allen, R.G.; Pereira, L.S.; Raes, D.; Smith, M. Crop Evapotranspiration: Guidelines for Computing Crop Water Requirements; Irrigation and Drainage Paper 56; Food and Agricultural Organization: Rome, Italy, 1998. [Google Scholar]
- Sun, S.L.; Chen, H.S.; Sun, G.; Ju, W.M.; Wang, G.J.; Li, X.; Yan, G.X.; Gao, C.J.; Huang, J.; Zhang, F.M. Attributing the changes in reference evapotranspiration in Southwestern China using a new separation method. J. Hydrometeorol. 2017, 18, 777–798. [Google Scholar] [CrossRef]
- Tang, R.L.; Li, Z.L.; Sun, X.M.; Bi, Y.Y. Temporal up scaling of instantaneous evapotranspiration on clear-sky days using the constant reference evaporative fraction method with fixed or variable surface resistances at two cropland sites. J. Geophys. Res. Atmos. 2017, 122, 784–801. [Google Scholar] [CrossRef]
- Abtew, W.; Obeysekera, J.; Iricanin, N. Pan evaporation and potential evapotranspiration trends in South Florida. Hydrol. Process. 2015, 25, 958–969. [Google Scholar] [CrossRef]
- Ye, H.; Zhang, T.B.; Yi, G.H.; Li, J.J.; Bie, X.J.; Liu, D.; Luo, L.L. Spatio-temporal characteristics of evapotranspiration and its relationship with climate factors in the source region of the Yellow River from 2000 to 2014. Acta Geogr. Sin. 2018, 73, 2117–2134. [Google Scholar]
- Zhou, B.R.; Li, F.X.; Xiao, H.B.; Hu, A.J.; Yan, L.D. Characteristics and climate explanation of spatial distribution and temporal variation of potential evapotranspiration in Headwaters of the Three Rivers. J. Nat. Resour. 2014, 29, 2068–2077. [Google Scholar]
- Piticar, A.; Mihăilă, D.; Lazurca, L.G.; Bistricean, P.I.; Puţuntică, A.; Briciu, A.E. Spatiotemporal distribution of reference evapotranspiration in the Republic of Moldova. Theor. Appl. Climatol. 2016, 124, 1133–1144. [Google Scholar] [CrossRef]
- Danlu, G.; Seth, W.; Maier, H.R. Sensitivity of potential evapotranspiration to changes in climate variables for different Australian climatic zones. Hydrol. Earth Syst. Sci. 2017, 21, 2107–2126. [Google Scholar]
- Mohammad, V. Analysis of potential evapotranspiration using limited weather data. Appl. Water Sci. 2017, 7, 187–197. [Google Scholar]
- Swapnil, S.V.; Rahul, N.; Bimal, K.B.; Prashant, K. Development of real-time reference evapotranspiration at the regional scale using satellite-based observations. Int. J. Remote Sens. 2016, 37, 6108–6126. [Google Scholar]
- Liu, P.X.; Zhuoma, L.C. Spatial and temporal variation of potential evapotranspiration in Gansu province from 1960 to 2008 and its influencing factors. J. Nat. Resour. 2012, 27, 1561–1571. [Google Scholar]
- Zhu, G.F.; He, Y.Q.; Pu, T.; Li, Z.X.; Wang, X.F.; Jia, W.X.; Xin, H.J. Spatial distribution and temporal trends in potential evapotranspiration over Hengduan Mountains region from 1960 to 2009. Acta Geogr. Sin. 2012, 66, 905–916. [Google Scholar] [CrossRef]
- Zhang, L.X.; Zhang, W.X.; Zhou, T.J.; Wu, B.E. Assessment of the decadal prediction skill on global land summer monsoon precipitation in the coupled models of Ensembles. Adv. Earth Sci. 2017, 32, 409–419. [Google Scholar]
- Gao, G.; Chen, D.L.; Ren, G.Y.; Chen, Y.; Liao, Y.M.E. Spatial and temporal variations and controlling factors of potential evapotranspiration in China: 1956–2000. J. Geogr. Sci. 2006, 16, 3–12. [Google Scholar] [CrossRef]
- Tang, J.; Cao, H.Q.; Chen, J. Changes of hydro-meteorological factors and the relationships with large-scale circulation factors in the source region of the Yangtze River. J. Nat. Resour. 2018, 33, 122–134. [Google Scholar]
- Wang, T.T.; Sun, F.B.; Zhang, J.; Liu, W.B.; Wang, H. Anew method to attribute changes of pan evaporation: The experimental detrending approach. Acta Geogr. Sin. 2018, 73, 2064–2074. [Google Scholar]
- Gong, D.E.; Wang, S.W. Influence of atmospheric oscillations on northern hemispheric temperature. Geogr. Res. 1999, 18, 31–38. [Google Scholar]
- Li, P.; Huang, S.Z.; Huang, Q.; Ma, L.; Wu, H.S.; Luan, J.K. Study on the evolution characteristics and driving forces of rainfall structure in Datong River Basin. J. Nat. Resour. 2018, 33, 1588–1598. [Google Scholar]
- Yao, Y.J.; Zhao, S.H.; Zhang, Y.H.; Jia, K.; Liu, M. Spatial and decadal variations in potential evapotranspiration of China based on reanalysis datasets during 1982–2010. Atmosphere. 2014, 5, 737–754. [Google Scholar] [CrossRef] [Green Version]
- Wang, Y.M.; Zhang, B.; Dai, S.P.; Wang, H.J.; Guo, L.X.; Kang, S.Y. Analysis of spatial distributions and temporal trends in potential evaporation over Hexi Areas from1960 to2008. Resour. Sci. 2010, 32, 139–148. [Google Scholar]
- Zhou, B.R.; Li, F.X.; Xaio, H.B.; Hu, A.J.; Yan, L.D. Spatial and temporal differentiation and climatic attribution of potential evapotranspiration in sanjiangyuan area. J. Nat. Resour. 2014, 29, 2068–2077. [Google Scholar]
- Zhao, Y.F.; Zou, X.Q.; Zhang, J.X.; Cao, L.G.; Xu, X.W.H.; Zhang, K.X.; Chen, Y.Y. Spatio-temporal variation of reference evapotranspiration and aridity index in the Loess Plateau Region of China, during 1961–2012. Quat. Int. 2014, 349. [Google Scholar] [CrossRef]
- Tingting, N.; Li, Z.; Liu, W.Z.; Han, X.Y. Evolution of potential evapotranspiration in the northern Loess Plateau of China: Recent trends and climatic drivers. Int. J. Climatol. 2016, 36, 4019–4028. [Google Scholar]
- Zhang, X.P.; Li, Z.Q.; Wang, M.B.; Wang, X.G. Classification and ordination of grassland landscape in the Shanxi Plateau. Acta Ecol. Sin. 2014, 34, 3386–3395. [Google Scholar]
- Cheng, P. Vegetation Coverage Variations and Its Mechanism Based on Remotely Sensed Technology on Shanxi Plateau; Taiyuan University of Technology: Taiyuan, China, 2016. [Google Scholar]
- Fu, B.J.; Liu, Y.; Lv, Y.H.; He, C.S.; Zeng, Y.A.; Wu, B.F. Assessing the soil erosion control service of ecosystems change in the Loess Plateau of China. Ecol. Complex. 2011, 8, 284–293. [Google Scholar] [CrossRef]
- Hamed, K.H. Trend detection in hydrologic data: The Mann-Kendall trend test under the scaling hypothesis. J Hydrol. 2008, 349, 350–363. [Google Scholar] [CrossRef]
- Sun, S.K.; Wu, P.; Wang, Y.B.; Zhao, X.N.; Liu, J.; Zhang, X.H. Impacts of climate change on water footprint of spring wheat production: The case of an irrigation district in China. Span. J. Agric. Res. 2012, 10, N4. [Google Scholar] [CrossRef] [Green Version]
- Wei, G.H.; Deng, L.J. Analysis on precipitation trend in arid regions based on nonparametric verification methods of Mann-Kendall and spearman’s rho. Northwest Hydropower 2014, 4, 1–4. [Google Scholar]
- Yu, D.D.; Zhang, R.; Hong, M.; Liu, K.F.; Wang, H.Z. Correcation analysis between the west Pacific subtropical high and the east Asian summer monsoon system based on cross wavelet and wavelet coherence. J. Nanjing Inst. Meteorol. 2007, 30, 755–769. [Google Scholar]
- Hudgins, L.; Friehe, C.; Mayer, M. Wavelet transforms and atmospheric turbulence. APS Phys. Rev. 1993, 71, 3279–3282. [Google Scholar]
- Labat, D.; Rachid, A.; Mangin, A. Wavelet analysis in Karstic hydrology. 2nd part: Rainfall-runoff cross wavelet analysis. C. R. Acad. Sci. Ser. IIA Earth Planet. Sci. 1999, 329, 881–887. [Google Scholar]
- Huang, H.P.; Han, Y.P.; Cao, M.M.; Song, J.X.; Xiao, H.; Cheng, W.L. Spatiotemporal characteristics of evapotranspiration paradox and impact factors in China in the period of 1960–2013. Adv. Meteorol. 2015, 1–10. [Google Scholar] [CrossRef] [Green Version]
- Li, Z.X.; Feng, Q.; Liu, W.; Wang, T.T.; Gao, Y.; Wang, Y.M.; Cheng, A.F.; Li, J.G.; Liu, L. Spatial and temporal trend of potential evapotranspiration and related driving forces in Southwestern China, during 1961–2009. Quat. Int. 2014, 336, 127–144. [Google Scholar]
- Zuo, D.P. Spatiotemporal variations and abrupt changes of potential evapotranspiration and its sensitivity to key meteorological variables in the Wei River basin, China. Hydrol. Process. 2012, 26, 1149–1160. [Google Scholar] [CrossRef]
- Wang, R.; Chen, A.J.; He, X.G. Analysis on spatiotemporal variability of monthly precipitation and its lag correlation with AO and NAO in Yangtze River Basin. J. Meteorol. Sci. 2018, 38, 730–738. [Google Scholar]
- Xu, Y.; Wu, Y.F.; Xu, G. Variation of reference evapotranspiration and its teleconnection with multiple large-scale climate oscillations in the Yangtze River Delta, China. Int. J. Climatol. 2019, 39, 2630–2645. [Google Scholar] [CrossRef]
Figure 1.
Topography and meteorological stations distribution map of the Loess Plateau; (a) meteorogical stations location information, (b) topography information, (c) soil map.
Figure 1.
Topography and meteorological stations distribution map of the Loess Plateau; (a) meteorogical stations location information, (b) topography information, (c) soil map.

Figure 2.
Annual and seasonal variation of ET0 during 1960–2017 in the Loess Plateau (mm); (a) annual (a1 CLP; a2 MR; a3 VR; a4 HR); (b) spring (b1 CLP; b2 MR; b3 VR; b4 HR); (c) summer (c1 CLP; c2 MR; c3 VR; c4 HR); (d) autumn (d1 CLP; d2 MR; d3 VR; d4 HR); (e) winter (e1 CLP; e2 MR; e3 VR; e4 HR).

Figure 3.
Spatial distribution of variation for annual and seasonal ET0 during 1960–2017.

Figure 4.
Spatial distribution of variation trends for annual and seasonal ET0 during 1960–2017.

Figure 5.
Wavelet transform coherence for ET0 and the large-scale circulation patterns. Thick contours denote 5% significance levels against red noise. Pale regions denote the Cone of Influence (COI) where edge effects might distort the results. Small arrows denote the relative phase relationship (in-phase, arrows point right; anti-phase, arrows point left).


Table 1.
Basic information of meteorological stations used in this study.
| Study Areas | Altitude (m) | T (°C) | RH (%) | SD | WS (m/s) | ET0 (mm) |
|---|---|---|---|---|---|---|
| CLP | 1224 | 8.76 | 58 | 7.12 | 2.99 | 1074.06 |
| MR region | 1970 | 5.88 | 61 | 6.98 | 2.67 | 936.86 |
| VR region | 891 | 9.99 | 58 | 7.04 | 2.16 | 1085.92 |
| HR region | 1098 | 9.33 | 56 | 7.32 | 2.46 | 1069.19 |
Table 2.
The correlation coefficient between potential evapotranspiration and climatic factors.
| WS | T | Tmax | Tmin | SD | RH | |
|---|---|---|---|---|---|---|
| CLP | −0.363 ** | 0.605 ** | 0.717 ** | 0.416 ** | 0.303 * | 0.757 ** |
| MR | −0.31 * | 0.69 ** | 0.773 ** | 0.603 ** | 0.175 | −0.69 ** |
| VR | −0.326 * | 0.749 ** | 0.84 ** | 0.579 ** | 0.08 | −0.709 ** |
| HR | −0.489 ** | 0.61 ** | 0.703 ** | 0.442 ** | 0.137 | −0.713 ** |
* Significantly correlated at the 0.05 level; ** Significantly correlated at the 0.1 level.
Table 3.
The contribution rate of climatic parameters to the variation of the ET0 (%).
| WS | T | Tmax | Tmin | SD | RH | |
|---|---|---|---|---|---|---|
| CLP | 7 | 42 | 13 | 23 | 7 | 8 |
| MR | 1 | 40 | 26 | 26 | 4 | 4 |
| VR | 7 | 39 | 10 | 28 | 1 | 15 |
| HR | 1 | 11 | 39 | 17 | 4 | 28 |
Table 4.
The information of the ET0 in other parts of China and the whole of China during the past decades.
Table 4.
The information of the ET0 in other parts of China and the whole of China during the past decades.
| Study Area | Time Period | Trends | Abrupt Change | Sources |
|---|---|---|---|---|
| Northwest China | 1958–2008 | decrease | 1978 | [32] |
| Southwest China | 1961–2009 | increase | 1985 | [46] |
| Wei River Basin, China | 1959–2008 | increase | 1993 | [47] |
| Yangtze River, China | 1960–2011 | increase | 2000 | [48,49] |
| Whole of China | 1960–2013 | decrease | 1993 | [45] |
| CLP, China | 1960–2017 | increase | 1997 | This study |
© 2020 by the authors. Licensee MDPI, Basel, Switzerland. This article is an open access article distributed under the terms and conditions of the Creative Commons Attribution (CC BY) license (http://creativecommons.org/licenses/by/4.0/).
Share and Cite
MDPI and ACS Style
Sun, C.; Zheng, Z.; Chen, W.; Wang, Y. Spatial and Temporal Variations of Potential Evapotranspiration in the Loess Plateau of China During 1960–2017. Sustainability 2020, 12, 354. https://0-doi-org.brum.beds.ac.uk/10.3390/su12010354
AMA Style
Sun C, Zheng Z, Chen W, Wang Y. Spatial and Temporal Variations of Potential Evapotranspiration in the Loess Plateau of China During 1960–2017. Sustainability. 2020; 12(1):354. https://0-doi-org.brum.beds.ac.uk/10.3390/su12010354
Chicago/Turabian StyleSun, Congjian, Zhenjing Zheng, Wei Chen, and Yuyang Wang. 2020. "Spatial and Temporal Variations of Potential Evapotranspiration in the Loess Plateau of China During 1960–2017" Sustainability 12, no. 1: 354. https://0-doi-org.brum.beds.ac.uk/10.3390/su12010354
Note that from the first issue of 2016, this journal uses article numbers instead of page numbers. See further details here.