Article

Experimental Study on the Effect of Advancing Speed and Stoping Time on the Energy Release of Overburden in an Upward Mining Coal Working Face with a Hard Roof

1
Energy School, Xi’an University of Science and Technology, Xi’an 710054, China
2
Key Laboratory of Western Mines and Hazard Prevention of China Ministry of Education, Xi’an 710054, China
3
Key Laboratory of Coal Resources Exploration and Comprehensive Utilization of Ministry of Land and Resources, Xi’an 710021, China
*
Author to whom correspondence should be addressed.
Submission received: 26 November 2019 / Revised: 15 December 2019 / Accepted: 17 December 2019 / Published: 19 December 2019

Abstract

:
In order to study the influence of advancing speed and stoping time of a coal face on the scale and frequency of rock burst, the energy release characteristics of an overburden fracture under six advancing speeds and four stoping times are studied by theoretical analysis and similar simulation experiments. The distribution characteristics of microseismic events before and after stoppage are compared, and the load/unload response ratio is introduced to analyze the relationship between the synergistic effect of advancing speed and stoping time and the characteristics of microseismic events in coal and rock mass. The mechanism of rock burst induced by the advancing speed and stoping time effect in the working face is studied, and the coordinated regulation and mitigation of advancing speed and stoping time are analyzed and completed. The results show that the effect of advancement speed and stoping time is very important to the energy release of overburden. The energy released by microseismic events during stoping is exponentially related to the advancing speed. The change of advancing speed causes the change of microseismic event characteristics, reflecting the evolution process of overburden structure and its energy. During stoping, the secondary microseismic events disturbed by mining occur frequently, leading to the significant difference of energy released by microseismic events during stoping. After stoping, the microseismic energy is more than four times higher than that during the stop period, and the risk of coal seam impact is high during the stope period. The synergetic change of advancement speed and stoping time changes the cycle of energy accumulation and release. The response ratio of loading and unloading considering the effect of advancement speed and stoping time is established by using the corresponding ratio of loading and unloading, and the impact risk of the coal seam is quantitatively analyzed. Based on the monitoring and analysis of microseismic events, the safety mining index of coordinated control with the energy of a single microseismic event of 180 J is established, and the best advancing speed of the working face is determined to be 4 m/d. According to the corresponding ratio of loading and unloading, the reasonable stoping time of different advancing speeds and the corresponding advancing speed of different stoping times after the resumption of mining are determined, so as to provide a reference for the safe and efficient mining of similar rock burst mines.

1. Introduction

Rock burst is one of the common dynamic disasters in the field of mining engineering in the coal industry. The randomness and destructiveness of rock burst have a serious impact on mine production and personnel safety. The causes of rock burst are very complex [1,2,3,4,5], which can be roughly divided into two aspects—engineering factors and production factors [6]. Engineering factors include geological structure, coal seam occurrence characteristics, and coal rock burst tendency. Production factors are mainly mining disturbance, including mining sequence, layout of working face, and advancing speed. Many scholars [7,8,9] have carried out a great deal of research on two aspects of inducing rock burst, of which the flexibility and variability of advancing speed are the most prominent among the production factors.
In view of the influence of mining speed on surrounding rock stress, stope pressure, and roof energy variation, scholars have carried out a large number of researches in theoretical analysis, numerical simulation, laboratory research [10] and field practice. In terms of theoretical analysis, Wang Jiachen et al. analyzed the conditions, mechanism, and influencing factors of the dynamic load impact effect on stope roof [11]. It was found that the faster the advancing speed is, the greater the initial kinetic energy associated with the fractured rock mass is when the main roof is fractured, and the more obvious the dynamic load impact effect on the working face support is. Zhao Tongbin et al. believed that, with the increase of mining speed, the energy released from the roof shows an exponential increase trend, and the essence of energy release is that the increased elasticity can cause the unstable dynamic balance of the coal rock system to be broken, thus inducing rock burst [12]. In terms of numerical simulation, Wang Jin’an and others found that with the increase of the advancing speed of a fully mechanized top-coal caving face, the area of the stress reduction area around the face decreases. Correspondingly, the scope of the rock mass destruction area around the working face decreases, and the mining rate affects the integrity of the stress transfer process of surrounding rock [13]. Lei Wang et al. revealed the law of influence of fully mechanized working face advancing speed on coal and rock dynamic disasters. Excessive advancing speed is not conducive to the prevention and control of dynamic disasters such as rock burst, coal, and gas outburst [14]. In the laboratory, Yang Shengli et al. found that the coal and rock disasters in high-intensity working face have impact characteristics, the surrounding rock of stope is difficult to control, the roof dynamic disturbance makes the coal body bear dynamic and static combined loading forms at the same time, the strain energy density in the surrounding rock and the peak value of variable energy in the coal seam increase, the probability of dynamic disasters in the surrounding rock increases, and the degree of damage increases [15]. In field practice, Dou Linming and others applied microseismic and geoacoustic monitoring equipment to realize comprehensive monitoring and early warning technology for coal rock impact dynamic disasters [16,17,18]. He Xueqiu et al. introduced the generation mechanism of electromagnetic radiation during deformation and fracturing and its application in dynamic phenomena of coal and rock [19]. Liu Jinhai and others believed that the risk of rock burst in the working face is related to the stope push mining mode and speed, among which high-speed push mining and non-uniform push mining can easily induce rock burst [20]. Chen Tong and others believed that increasing the advancing speed of the working face can effectively prolong the periodic weighting interval of the working face, reduce the weighting times, and minimize the hazards of weighting to safety in production [21]. Brodny proposed a new measurement system suitable for hydraulic support. The test results can be used in the study of roof support under the influence of dynamic load [22]. Szurgacz et al. studied the field support problem of the roof under the influence of dynamic load in the process of coal mining. The proposed section geometry test method strengthened the support effect of the working face and ensured the safe mining problem of the working face under the influence of the dynamic load of the overburden [23]. Szurgacz carried out the test of the hydraulic support under the impact of dynamic load; the results broadened the research field of the hydraulic support in the pillar under the action of dynamic load and improved the effect of the support stability of the working face under the roof movement [24].
The above advancing speed has a certain understanding of the surrounding rock stress and mine pressure research, which broadens the thinking for this research and lays a foundation for further studies. However, there are few studies on the impact of the stopping on the surrounding rock microseismic events. We define the phenomenon of rock burst induced by the unilateral or comprehensive influence of the stope advancing speed and stopping time as the advancing speed–stoping time effect. In this paper, we deduce the theoretical calculation formula of the key stratum fracture angle and study the fracture situation of the key stratum of the overburden in the mining process of the working face [25]. Then, the method of combining microseismic monitoring technology with similar simulation experiments is used, and only the influence of the advancing speed–stoping time effect on the characteristics of microseismic events is considered, thus revealing the mechanism of rock burst induced by the advancing speed–stoping time effect of the working face. Based on the analysis of microseismic data, a method of coordinated control of the advancing speed and stoping time of the working face is proposed, which provides guidance for the safe and efficient mining of similar rock burst mines.

2. Experimental Design

2.1. Engineering Background
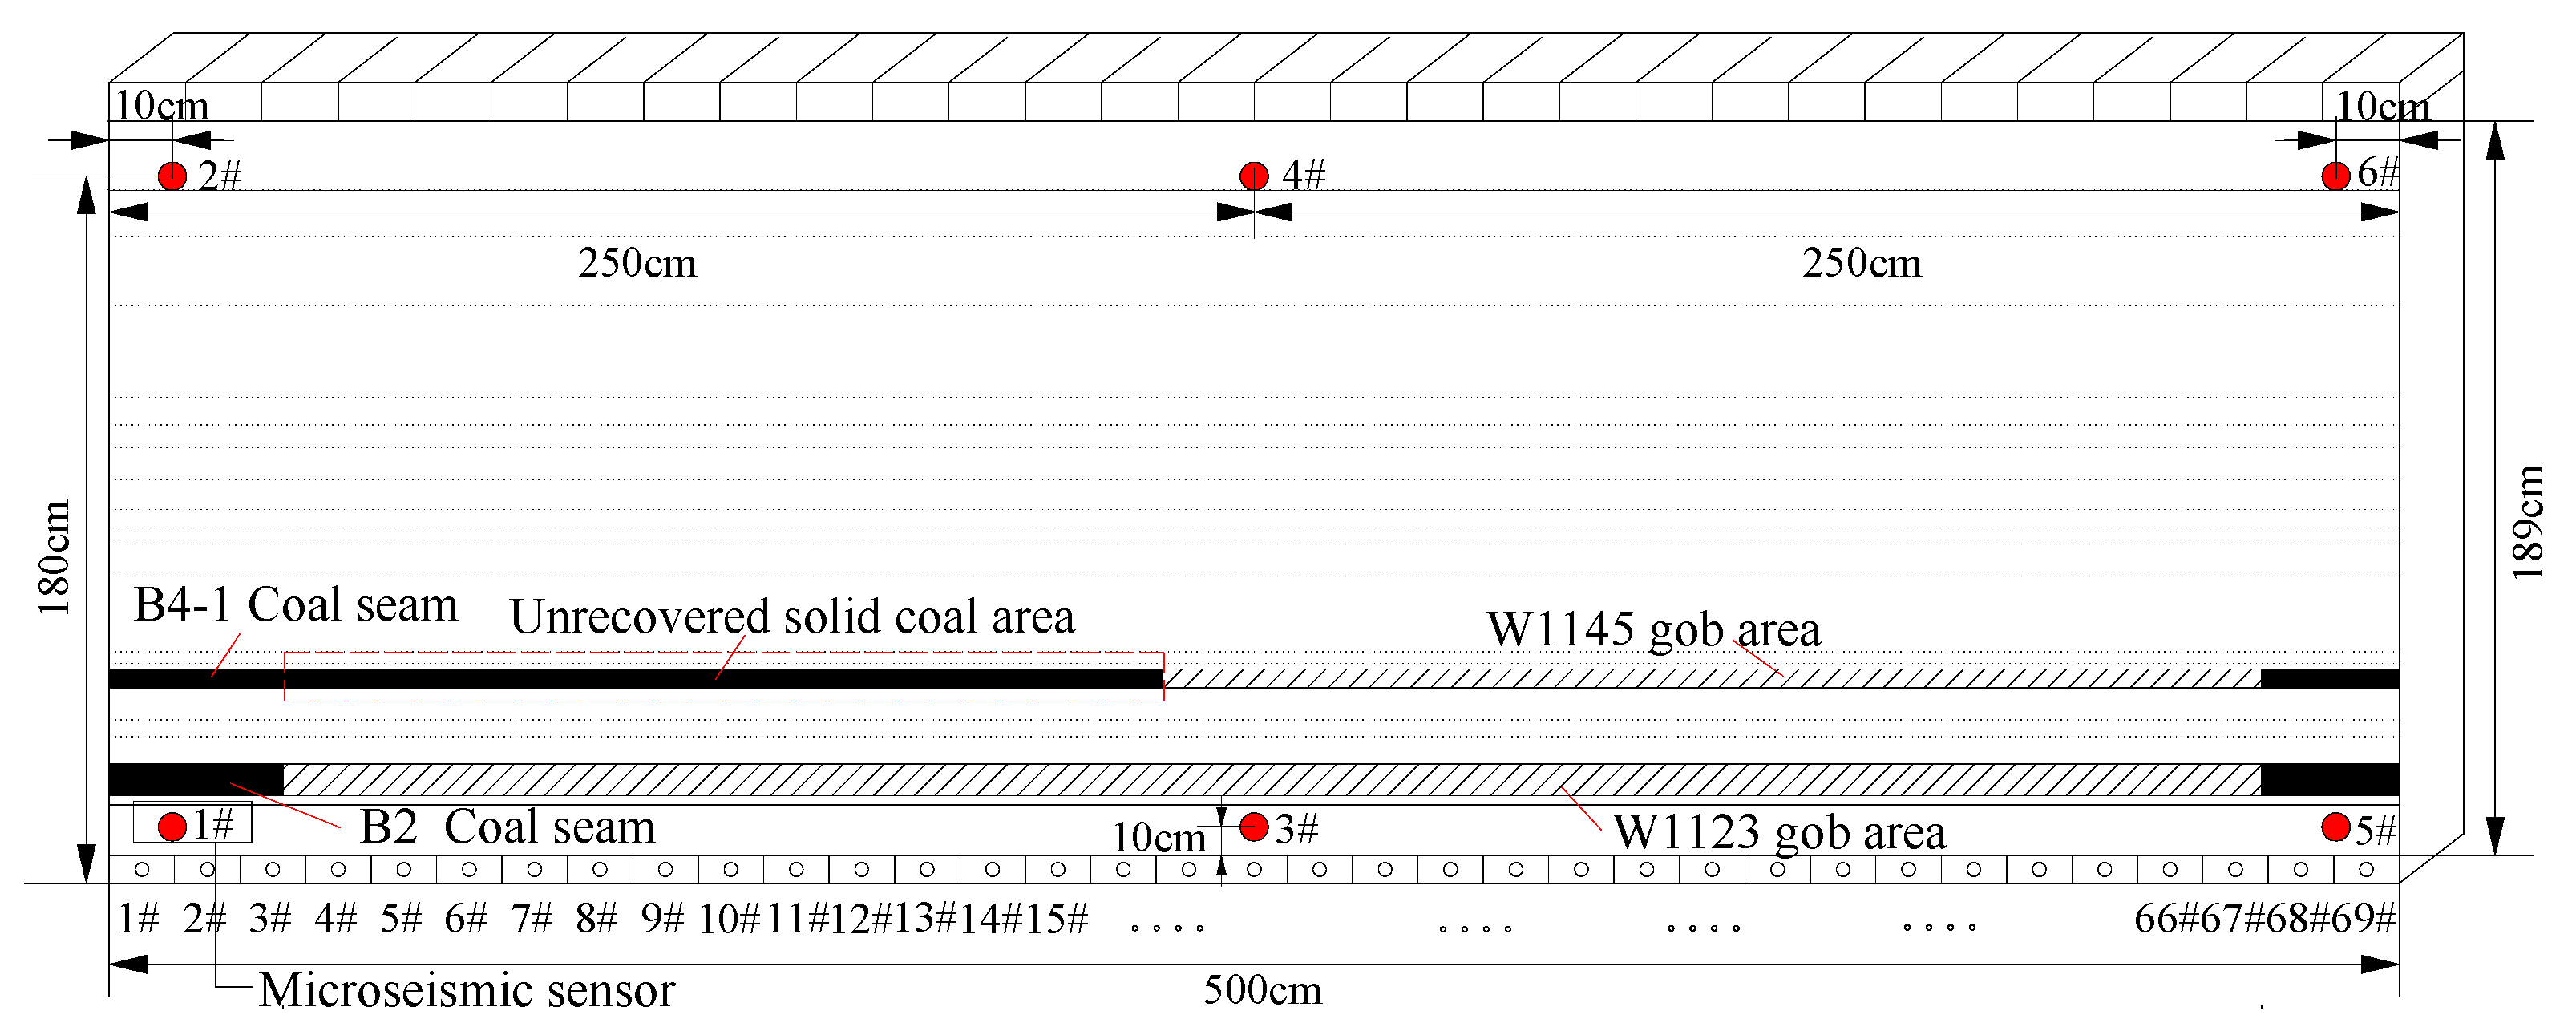
The Kuangou Coal Mine is located 70 km southwest of Hutubi County, with seven main minable seams and two local minable seams. The mine is mainly mining the B4-1 coal seam and B2 coal seam. The B2 coal seam is currently mining the W1123 working face, and the fissures and joints of the coal seam and roof are not developed and have an impact tendency. The upper part of the roadway 745 m west of the lower gateway of W1123 working face is a solid coal area, and the upper part of the eastern roadway is a mined-out area (i.e. the W1145 working face has been stoped). The B2 coal seam is about 50 m on average from the overlying B4-1 coal seam. At present, no solid coal has been mined in B4-1 coal seam. The mining depth is about 342 m, the coal seam dip angle is 12–14 degrees, and the average thickness of the coal seam is 3 m. The fully mechanized mining method of full height mining at one time is adopted. The top plate is argillaceous siltstone, with developed joints and fissures, locally broken, and the bottom plate is medium coarse sandstone. The specific arrangement of the working face is shown in Figure 1.
By monitoring the microseismic activity during the mining of the solid coal, the influence of the change of the advancing speed and the stopping time of the working face on the energy release rule of overburden movement is analyzed.

2.2. Model Desgin

In this experiment, a physical similar material simulation model is built based on the geological conditions of the B4-1 coal seam in the Kuangou Coal Mine, which does not mine solid coal. A 5.0 m × 0.3 m × 2 m (length × width × height) plane strain model frame was used in the experiment. The geometric similarity ratio (prototype model) of the simulation experiment was 200. The paving size of a similar simulation experiment model is 5.0 m × 0.3 m × 1.89 m. Considering that the depth of B4-1 coal seam is 342 m, the overburden height is 302 m and 40 m bedrock is not paved in the experiment. A layer of iron brick is loaded on the top of the model, which is equivalent to 40 m thick overburden, and the loading stress is 0.8 MPa. Based on the actual overlying rock lithology of the mine, a similar material ratio is calculated. The materials used in the process of model paving are river sand, white powder, plaster of Paris, and water, among which fly ash should be added when matching coal seams. In this experiment, the composition and strength of similar materials are little different from the actual ones, which can better simulate the actual rock formation. At the time of mining, the working face is monitored by microseisms to analyze the law of rock strata breaking and the characteristics of energy release.
The specific arrangement of the microseismic monitoring system is shown in Figure 2. Six microseismic sensors are installed in the model (red circles indicate a total of six speed sensors, numbered 1, 2, 3, 4, 5, and 6). After completing the mining of the W1123 working face and waiting for the overlying strata to collapse and stabilize, we cut a hole 38 cm from the left boundary of the model to start the mining of the B4-1 coal seam solid coal, with a total of 192 cm.

2.3. Experimental Scheme

This experiment mainly studies the characteristics of microseismic events in working face under six advancing speeds and four stoping times during upward mining. The model is designed to mine 192 cm, divided into six areas, where each area is about 32 cm, a total of 127 times. Considering the depth of the drum is 0.8 m, the recommended speed should be a multiple of 0.8, and six advancement speed gradients are set: 1.6 m/d, 2.4 m/d, 3.2 m/d, 4.0 m/d, 4.8 m/d, and 5.6 m/d. The maximum time for a holiday stipulated by the state is seven days, and the time gradient for stopping production is set to be 1, 3, 5, and 7 days. The specific experimental scheme is shown in Table 1.

3. Advancing Speed of Energy Release from Upward Mining Overlying Rocks and Effect of Stoping Time

From a macro point of view, the mechanical properties of rock mass are mainly affected by geological factors and human factors. Geological factors mainly include the natural state of rock mass and its occurrence conditions. Human factors mainly refer to the influence of mining activities and the change of natural state of rock mass caused by construction. According to the energy criterion theory [26], the sudden failure of coal and rock mass is often due to the stress transfer of surrounding rock caused by underground mining disturbance, resulting in the uneven release of energy. Under field conditions, the movement and deformation of coal and rock mass are unknown and difficult to control, while the deformation of coal and rock mass is mainly caused by human factors, and the human factors are controllable. The key to study the energy release characteristics of coal during mining lies in the variability of loading and unloading rates of coal and rock mass. Further research found that different advancing speed and stoping time of working face lead to different energy release due to different loading and unloading degree of surrounding rock.

3.1. Evolution Law of Microseisms between Regions with Different Advance Speed

In this similar simulation experiment, a microseismic monitoring system was used to monitor the microseismic events of overlying strata during mining in six areas divided by the undrawn solid coal in the B4-1 coal seam. In order to study the evolution law of microseismic events at different advancing speeds among different areas, the changes of energy and frequency of microseismic events are plotted in Figure 3.
As can be seen from Figure 3, when the advancement speed is 2.4 m/d, the energy of the microseismic event reaches 17 KJ, and the frequency is 303 times. At this time, all indexes of the microseismic event reach their peak value. This is because the frequency of microseismic events increases as the direct roof collapses with mining. With the increase of advancement speed, the energy and frequency of microseismic events show a decreasing trend. When the advancement speed is 4.8 m/d, the energy and frequency of microseismic events fall to the trough with the same characteristics as the microseismic events with the advancement speed of 1.6 m/d. When the advancement speed is 5.6 m/d, the energy and frequency of microseismic events show an increasing trend. Therefore, the characteristics of microseismic events are closely related to the advancing speed of the working face. The above is only used to study the characteristics of microseismic events with different advancement speeds from a macro perspective. In order to eliminate the influence of frequency on the energy release of microseismic events, we take the energy of single microseismic events from a micro perspective as the research object and count and fit the energy values of single microseismic events with different advancement speeds in various regions (Figure 4). The fitting function relationship is as follows: (in the Equation, E represents the energy of microseismic events, j; V represents advancement speed, m/d).
E = 7.244 e v 0.156 + 38.668
As can be seen from Figure 4, the microseismic energy is not a simple linear relationship with the advancement speed but an exponential function relationship with a curve fitting degree of 0.82327. When the advancing speed of the working face increases from 1.6 m/d to 4.0 m/d, the energy fluctuation of microseismic events is small. However, when the advancement speed is 4.8 m/d, the energy decreases to the trough, and when the advancement speed increases to 5.6 m/d, the energy suddenly increases to the maximum. During the whole mining of the working face, the energy release is significantly reduced when the advancing speed changes at 4.8 m/d. The relationship between microseismic characteristics and advancement speed has been studied from macro and micro perspectives. The change of advancing speed during mining causes the change of microseismic event characteristics, thus reflecting the evolution process of overburden structure and its energy. Due to the stoping of the W1123 working face in the B2 coal seam, the overlying strata will break and fall apart in the horizontal direction, and longitudinal cracks will appear in the vertical direction, thus cutting the direct roof and the main roof into blocks to make them fall down more easily. When the coal seam is mined, the rock strata are broken to generate corresponding fissures, and the new fissures and the generated fissures show a dynamic change mode.
The 28.8 m coal seam before mining was not affected by the mining of the lower layered working face, and the roof and coal seam remained intact. Then, mining continued, and the lower layer mining led to the overall bending and subsidence of the overlying strata. In the second part of the mining area, the direct roof of the previous separation gradually closed. Under the combined action of slow mining speed and lower layer mining, the caving step distance of the roof changed, resulting in the roof caving with mining (Figure 5). It is attributed to two aspects—first, the roof with slow mining speed is supported by the support, and the loading and unloading times are increased compared with the lower layer. Second, the broken roof is more broken and prone to caving under the repeated support of the bracket. Therefore, the secondary microseismic events in the mining area are increased, and the released energy reaches the maximum value.
Four periodic weighting occurs in the four areas before mining, with an average weighting interval of about 20 m. After stoping, the two areas will undergo three periods of weighting, with an average weighting interval of about 60 m. The first three areas are fully collapsed in the mined-out area after mining, and the gangue in the mined-out area is gradually compacted as the working face advances. Starting from area 4, with the increase of advancing speed, the roof falls behind, and the periodic weighting interval is prolonged, resulting in the slow sinking of the direct roof gradually contacting with the floor of the coal seam. At the same time, the broken main roof makes the broken blocks orderly arranged and mutually squeezed to form a certain beam structure due to the dilatancy effect (Figure 6).
In this process, the movement of the overburden is mainly hinge dislocation between the blocks and the overall subsidence along with the advancing of the working face, without large-area caving, which leads to the reduction of the activity range of the overburden and the significant reduction of the energy and frequency of microseismic events during the mining of the fifth area. Therefore, it can be seen that different mining speeds lead to different steps of overburden failure and collapse and eventually lead to differences in energy release.

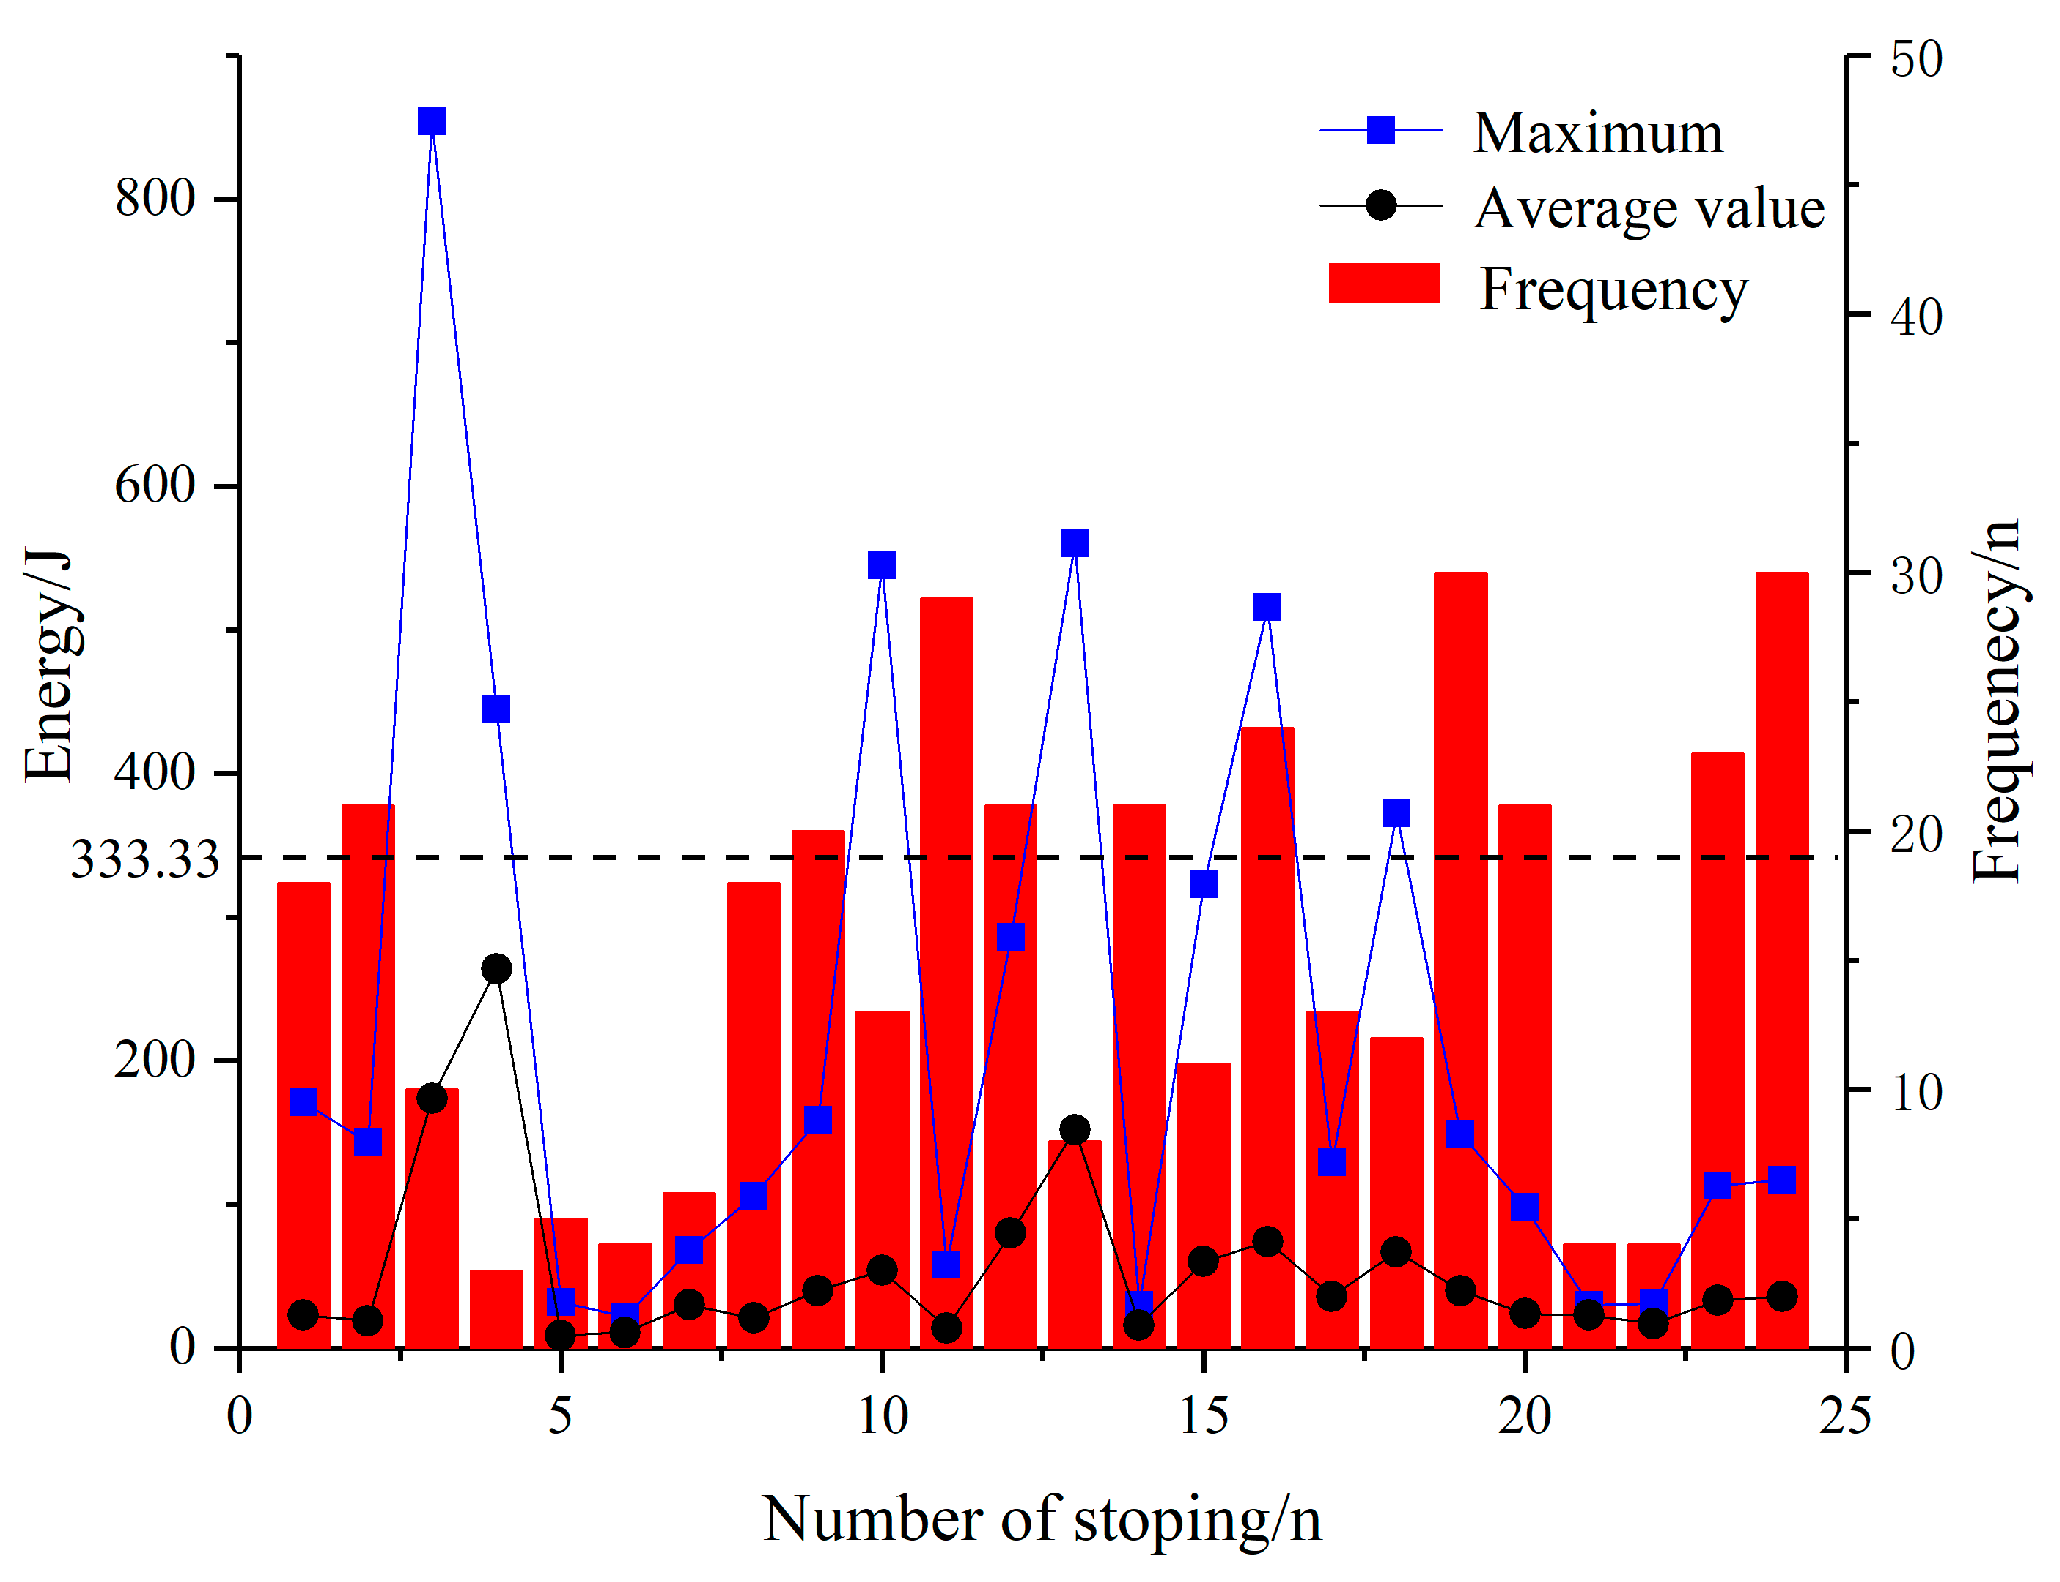
3.2. Microseismic Evolution Law under the Same Advancement Speed and Different Stoping Times

Figure 7 shows the variation trend of microseismic energy at different advance speeds during stoping. As can be seen from Figure 7, the advancing speed is 1.6 m/d, and the microseismic energy gradually increases with the prolongation of the stopping time, reaching the maximum value on the fifth day. The advancement speed is 2.4 m/d, and the energy gradually increases with the prolongation of stopping time. The microseismic energy fluctuated greatly when the advancement speed was 3.2 m/d and reached the peak value three days after the stoping. When the advancement speed is 4.0 m/d, the microseismic energy tends to decrease. When the advancement speed is 4.8 m/d, the microseismic energy reaches its peak value after three days of stoping and then gradually decreases. When the advancement speed is 5.6 m/d, the microseismic energy gradually increases with the prolongation of stopping time.
In order to study the evolution law of microseisms at different stopping times at different advancement speeds, the microseismic data at different stopping times in 6 regions are now statistically analyzed, and the microseismic characteristics of each advancement speed are fitted as shown in Figure 8 and Figure 9. As can be seen from Figure 8, the relationship between microseismic energy and stoping time conforms to a single exponential function growth model, with fitting degrees of 0.97441, 0.81472, 0.94285, 0.80621, 0.99997, and 0.91264, respectively. The fitting relationship is as follows: the advancement speed is 1.6 m/d, and the relation between stoping time and microseismic energy (where, e represents microseismic energy, j; T means stoping time, d) is
E = 157.198 e t 3.581 + 1719.557
The advancement speed is 2.4 m/d, and the relation between stoping time and microseismic energy is
E = 6040.773 e t 3.887 + 6933.525
The advancement speed is 3.2 m/d, and the relation between stoping time and microseismic energy is
E = 12288.067 e t 1.182 + 896.593
The advancement speed is 4.0 m/d, and the relation between stoping time and microseismic energy is
E = 3.373 e t 1.319 + 1670.44
The advancement speed is 4.8 m/d, and the relation between stoping time and microseismic energy is
E = 14.121 e t 2.491
The advancement speed is 5.6 m/d, and the relation between stoping time and microseismic energy is
E = 1493.306 e t 7.618 599.375
The change of the advancement speed from 1.6 m/d to 4.0 m/d with the stopping time has a great fluctuation in the energy release of overlying strata. The energy of microseismic events in the first four regions presents a sudden change with the increase of stopping events. The microseismic energy decreases with the increase of stopping time when the advancement speed is 3.2 m/d and 4.0 m/d, while the energy decreases rapidly when the speed is 3.2 m/d. The advancement speed is 4.8 m/d and 5.6 m/d. The energy of microseismic events gradually increases with the extension of stopping time, and the energy increases rapidly at 5.6 m/d. According to the above analysis, the relationship between stopping time and microseismic energy satisfies the exponential function model,
E = A e t B + C
where A, B, C are constants related to the advancement speed.
As can be seen from Figure 9, the microseismic frequency and stoping time conform to a single exponential function growth model, with fitting degrees of 0.8744, 0.9937, 0.99529, 0.99526, 0.99942, and 0.99621, respectively. The fitting relation is as follows: (in the equation, N represents the microseismic frequency, n; t means stopping time, d)
The advancement speed is 1.6 m/d, and the relation between stoping time and microseismic frequency is
N = 1.493 e t 2.656 + 60.368
The advancement speed is 2.4 m/d, and the relation between stoping time and microseismic frequency is
N = 33.735 e t 5.056 + 4.109
The advancement speed is 3.2 m/d, and the relation between stoping time and microseismic frequency is
N = 345.378 e t 0.821 + 36.74
The advancement speed is 4.0 m/d, and the relation between stoping time and microseismic frequency is
N = 8173.52 e t 0.175 + 23.667
The advancement speed is 4.8 m/d, and the relation between stoping time and microseismic frequency:
N = 2.66 e t 3.97 + 19.501
The advancement speed is 5.6 m/d, and the relation between stoping time and microseismic frequency:
N = 2.491 e t 0.346 + 24.318
The curve fitting degree of 6 recovery stages is close to 1, which indicates that the fitting effect is better. When the advancement speed is 3.2 m/d and 4.0 m/d, the frequency of microseismic events is consistent with the energy change trend, showing a decreasing trend. The advancement speed is 4.8 m/d and 5.6 m/d. The frequency of microseismic events continues to increase with the extension of stopping time, but the increase is slow. It can be seen that the frequency of microseismic events decreases with the increase of stoping time when the advancement speed is lower than 4.0 m/d; When the speed is 4.8 m/d and 5.6 m/d, the frequency increases with the increase of time, and when the speed is 5.6 m/d, the frequency changes sharply after seven days of stoping.
According to Figure 8 and Figure 9, the energy and frequency of microseismic events show an exponential trend during the stoping period. This shows that the microseismic energy is likely to mutate with the change of stoping time, and the accumulation energy of overburden rock will surge to cause the occurrence of large-energy microseismic events.
The high-energy microseismic event indicates that the accumulated elastic energy of coal and rock mass reaches the yield limit, the energy level of the high-energy microseismic event indicates the amount of accumulated elastic energy of coal and rock mass, and the frequency indicates the intensity of activity. We deduced the equation of energy similarity ratio, from which the energy value of large events in the laboratory was 333.33 J [27]. The energy release methods of microseismic events are also different due to the different stoping times at different advancement speeds. The microseismic characteristics at different stoping times are analyzed and summarized by plotting the changes of microseismic event energy and frequency during stoping (Figure 10).
As can be seen from Figure 10, a total of six large-energy microseismic events occurred during the stopping period, mainly distributed in areas 1, 3, 4, and 5. The maximum value of the energy released by the microseismic event during the stopping period is much higher than the average value during this period, which indicates that the imbalance of energy release is significant. The frequency of microseismic events that stopped production in the first three times is obviously higher than that in the next three times. The frequency of microseismic events gradually increases in the second stage of the region, and the energy correspondingly starts to increase. From the third stage of the region, the energy and frequency of microseismic events fluctuate significantly. The analysis shows that the mining disturbance has changed the original stress state of the surrounding rock from static equilibrium to dynamic equilibrium adjustment. The existence of advanced bearing pressure increases the local stress of the coal and rock mass, and the accumulated energy in the coal and rock mass is also increasing. When the dynamic balance tends to be stable, the energy and frequency of microseismic events change linearly. After the basic roof fracture of the first weighting in the three stages of the region, the rock fissures expand and extend upward, and weighting is frequent, resulting in frequent overburden movement and significant energy and frequency changes due to the increase of microseismic secondary events. Secondary microseismic events disturbed by mining occur frequently during the stopping period, resulting in unbalanced energy release.

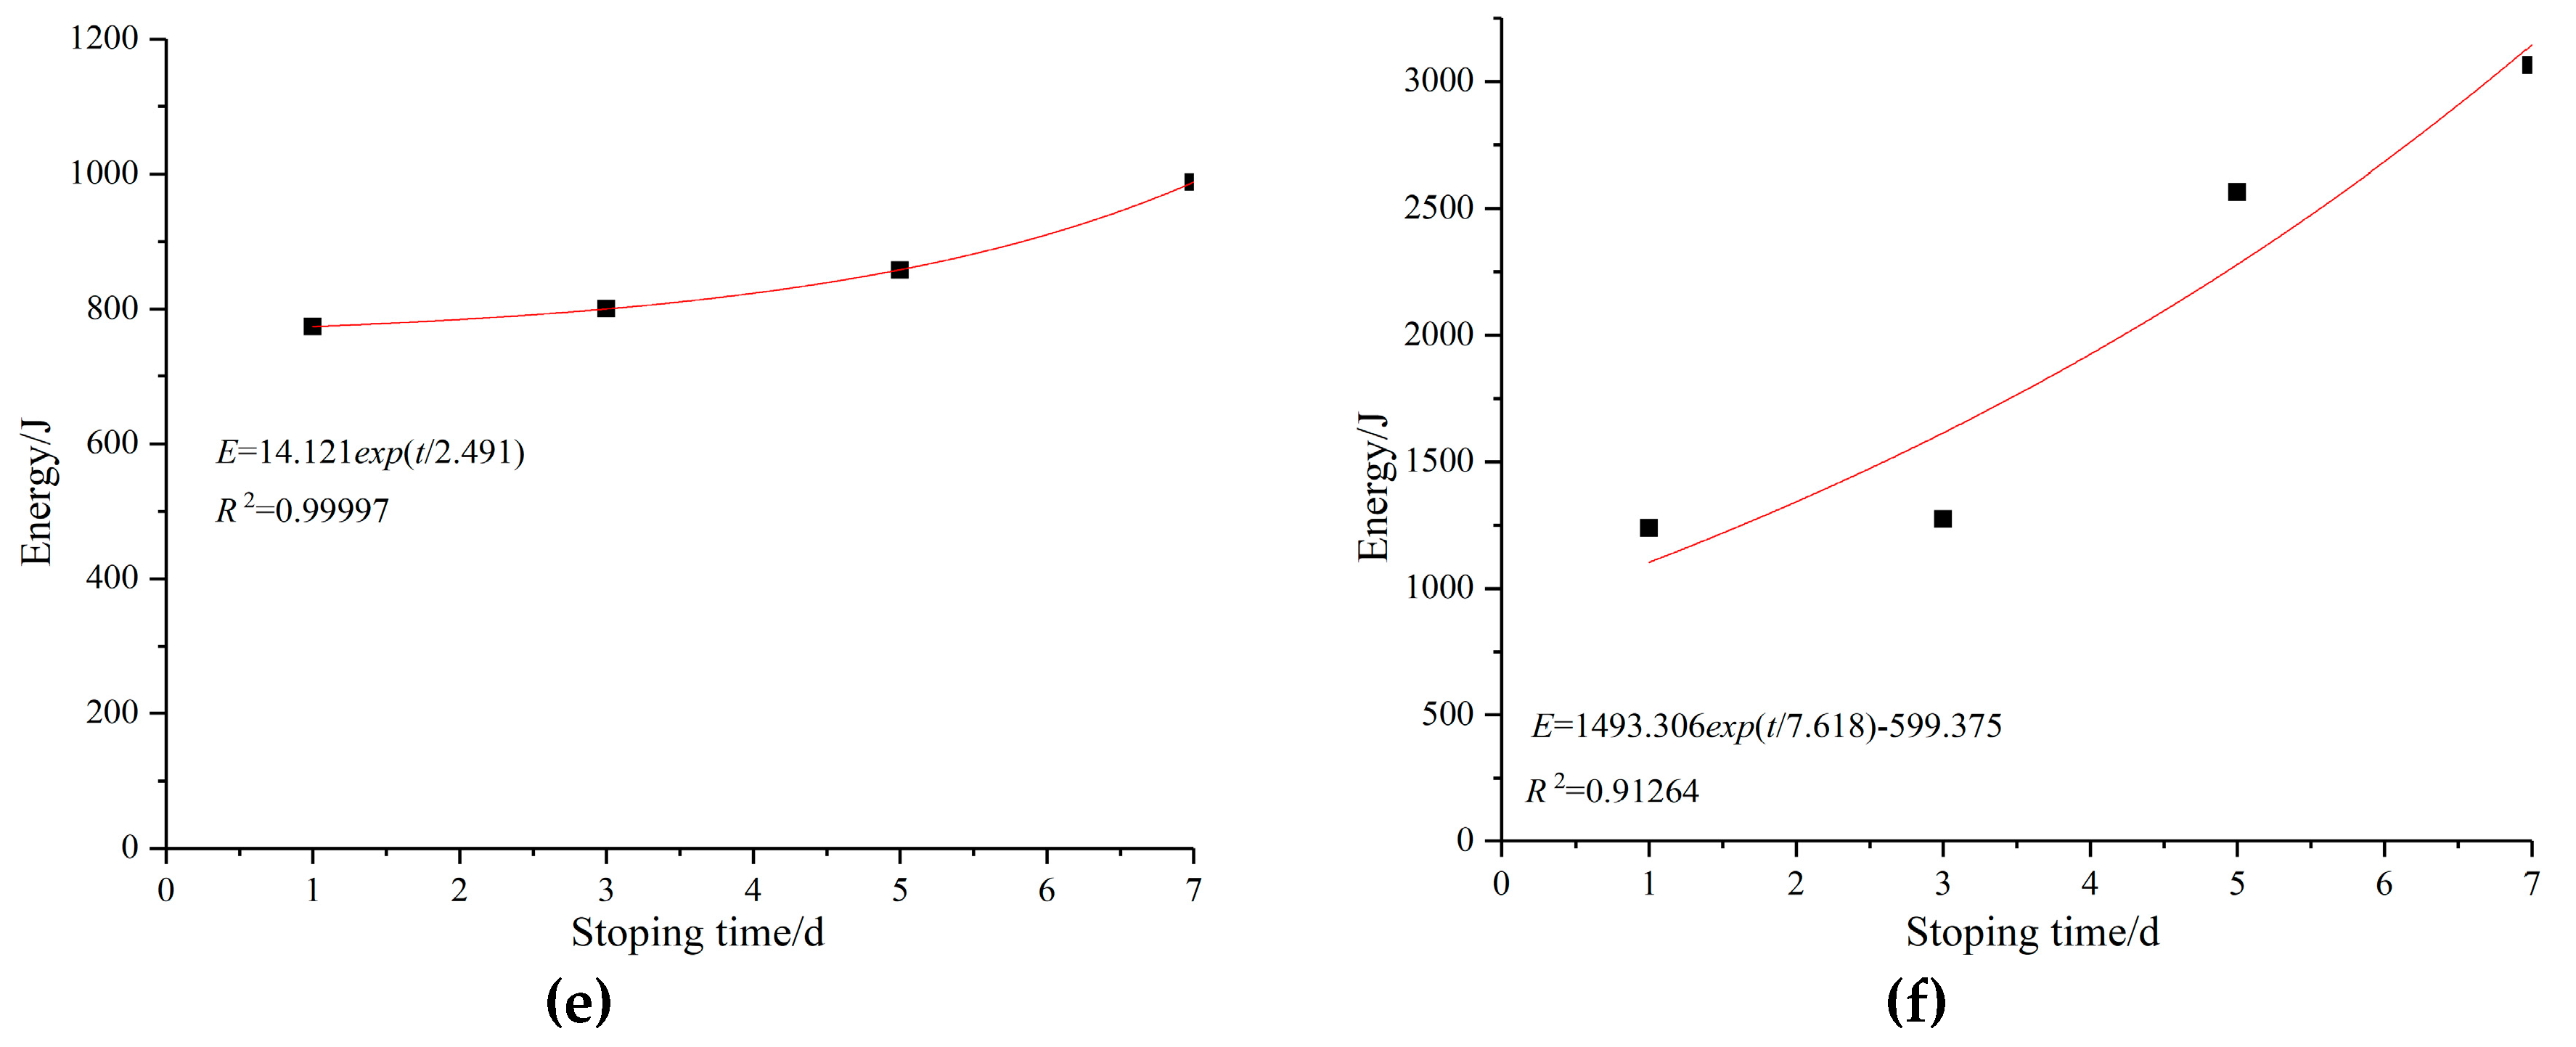
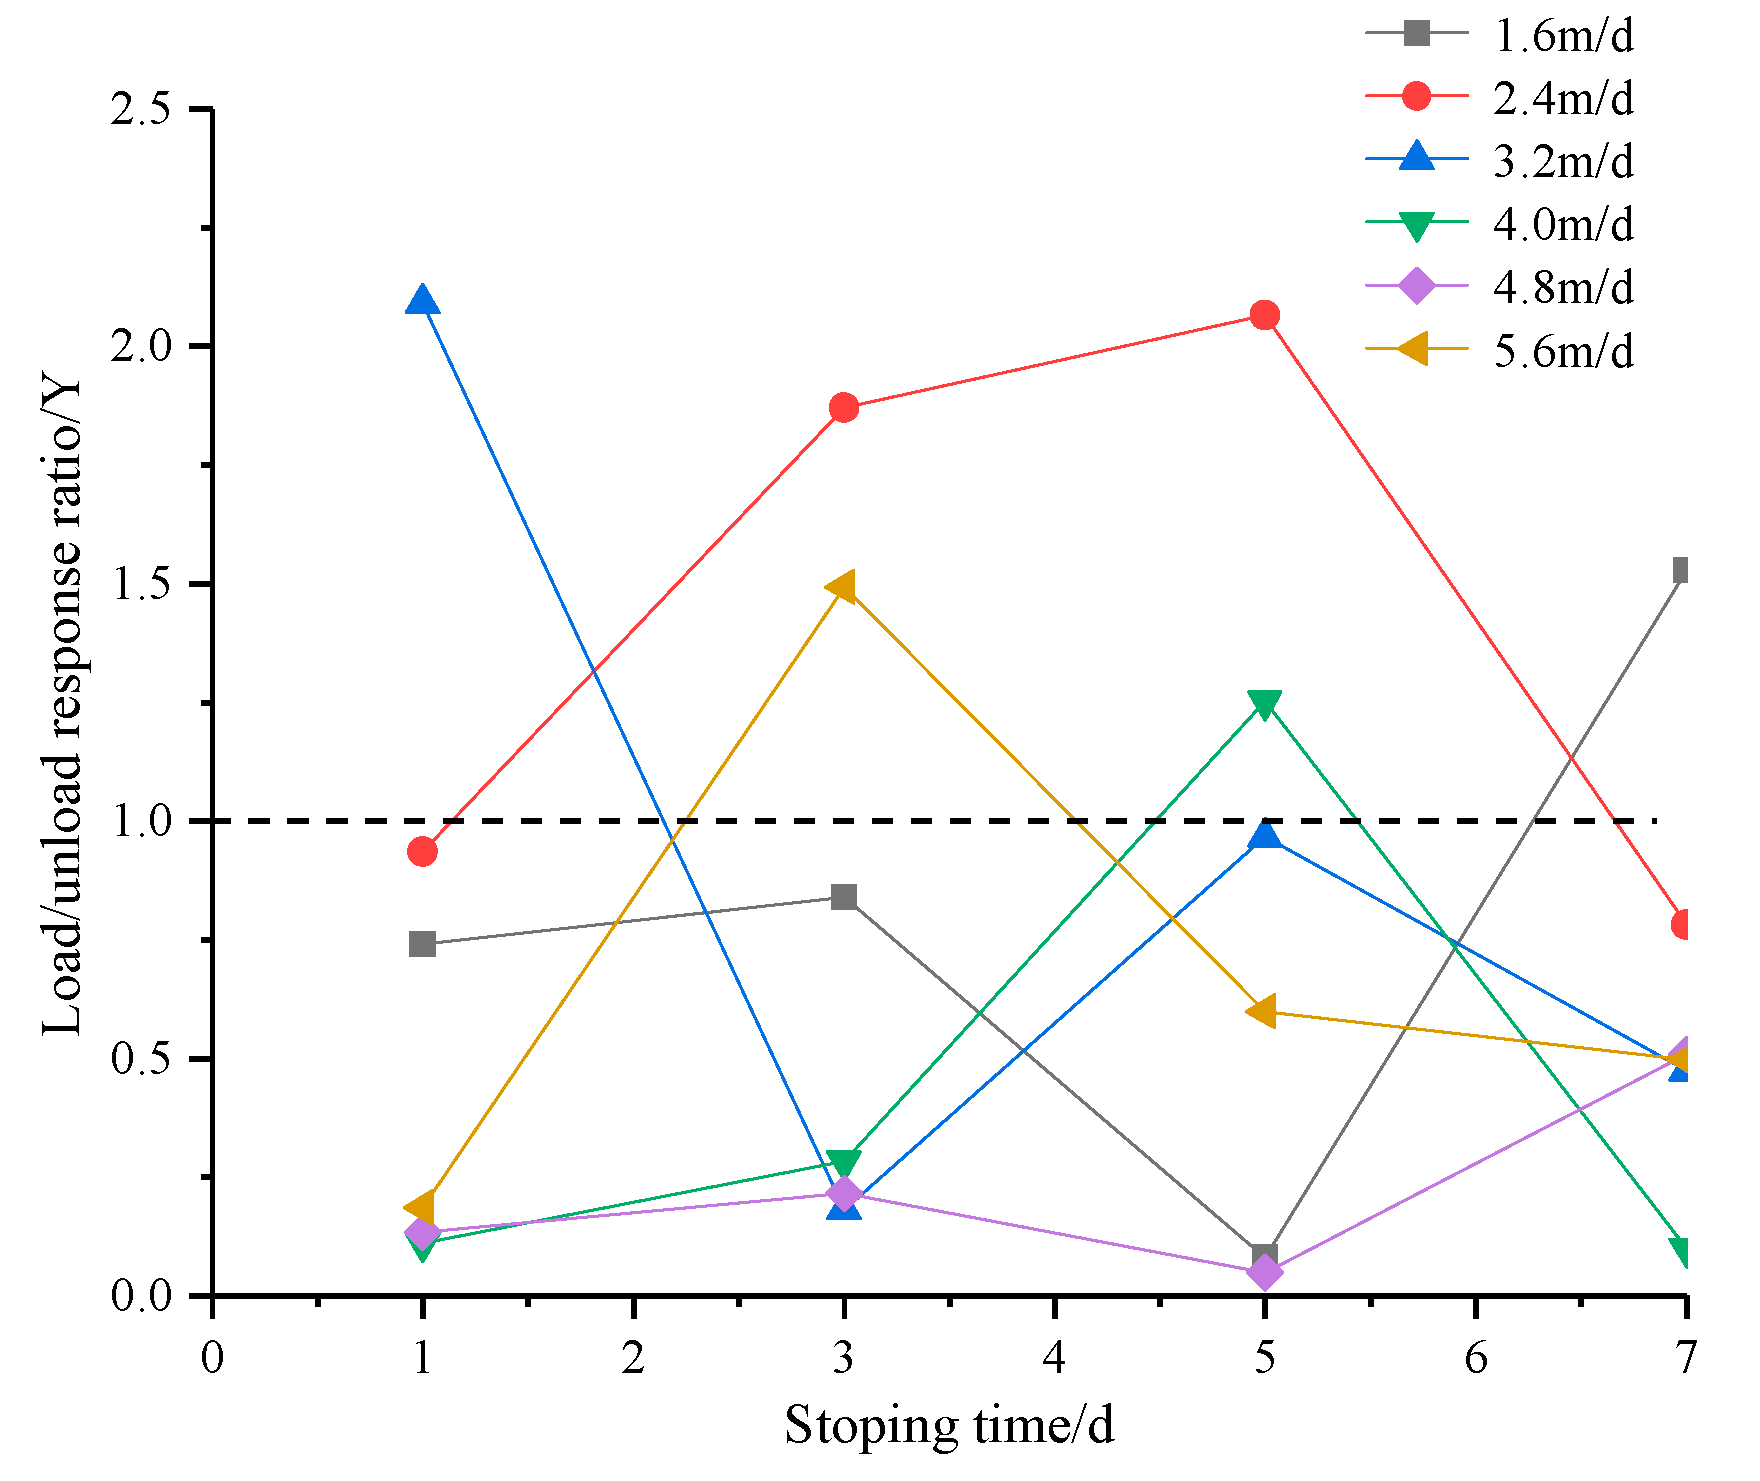
3.3. Time Effect of Stoping Production and Resuming Mining at Different Advancing Speed

Figure 11 shows the characteristics of microseismic events of normal mining, stoping, and recovery of the working face at different advancing speeds. At the initial mining stage of the working face, the energy of micro-seismic events with the degree of overburden movement deformation is low and stable, and the fluctuation range is small. The energy of micro-seismic events increases sharply after five days of stoping, which is about four times as much as that of normal mining. When the advancement speed is 2.4 m/d, the energy during recovery increases gradually and is higher than that during stoping. When the speed is 3.2 m/d and 4.0 m/d, the energy of the microseismic event that stopped production for seven days suddenly increases to about 1600 J, which is 1.6 times higher than the average energy during the previous three stops. The speed continues to increase to 5.6 m/d, and the energy after one day and three days of stoping is about 11.8 and 9.3 times of the stoping period, respectively. The stopping is extremely different from that of the resumption microseismic event. This is also the reason why the Detailed Rules for Prevention and Control of Rock Burst in Coal Mines stipulates that professional personnel should evaluate the risk degree of rock burst before resuming production in working face with rock burst hazard that has been suspended for three days or more.
Theoretical research and practice show that the advancing speed of fully mechanized top-coal caving face is one of the main factors affecting the redistribution of surrounding rock stress. The advancing speed of the working face causes the change of mining depth per unit time, thus reflecting the different loading and unloading degrees of surrounding rocks per unit time. The time effect of stoping production and resuming mining can be analyzed from the angle of surrounding rock loading and unloading. The loading and unloading of surrounding rock have different effects on the strength, deformation, creep, and other mechanical properties of surrounding rock, and the energy release of surrounding rock is different under the influence of creep. In other words, the advancing speed affects the results of stress redistribution and deformation failure of surrounding rock in the working face. The stress will cause the energy transfer and release of surrounding rock in the process of redistribution, and the energy transfer and release is a periodic process in mining activities. In the process of advancing the working face forward, the energy in the surrounding rock is continuously accumulated and released, and the advancing speed changes the period of energy accumulation and release of the surrounding rock, which leads to the difference in energy release during stopping and recovery, as shown in Figure 11.
Change trend of microseismic energy at different production stop times under different advancing speeds after recovery (Figure 12). As can be seen from Figure 12, the advancement speed is relatively low after one day of stoping, the energy fluctuation of microseismic events is relatively small and the energy is relatively low, and the advancement speed increases suddenly at 5.6 m/d; After three days of stoping, with the increase of the advancement speed, the energy fluctuation obviously showed an overall increasing trend. The energy distribution is U-shaped with the increase of the advancement speed after five days of stoping. When it is around 4.8 m/d, the energy drops to the lowest point and then starts to increase. The energy increased to a peak value at 2.4 m/d after seven days of stoping, then the energy decreased as the advancement speed increased and reached a maximum value at 4.8 m/d.

4. Mechanism of Rock Burst Caused by the Effect of Working Face Advancing Speed and Stoping Time

At present, there are many studies on rock burst. It is well known that rock deformation and failure involve energy accumulation and release. Rock burst occurs when the energy released by the surrounding rock system is greater than the accumulated energy. In other words, the occurrence of rock burst is closely related to the accumulation and release of energy.

4.1. Mechanism of Rock Burst Caused by Change of Advancing Speed

In mining activities, the variability of the advancing speed of the working face determines the changes of the advanced supporting pressure, the direct roof sinking speed and the periodic fracture of the basic roof. Due to the stoping of the W1123 working face in the B2 coal seam, the overlying strata will be broken, and the direct roof and the main roof will be cut into blocks to make them more prone to collapse. When the coal seam is mined, the rock strata are broken to generate corresponding fissures, and the new fissures and the generated fissures show a dynamic change mode.
During the low-speed mining stage of the working face, the repeated supporting action of the support causes the fractured roof to be more broken, resulting in direct roof caving along with mining during the advancing process of the working face. Four periodic weighting occurs in the four areas before mining, with an average weighting interval of about 20 m. After stoping, the two areas will undergo three periods of weighting, with an average weighting interval of about 60 m. It can be seen that the advancing speed of the working face is slow, the periodic weighting interval of the roof is small, and the weighting times are large. The advancing speed of the working face is fast, the periodic weighting interval of the roof is large, and the weighting times are few. As shown in Figure 13, the peak distance X1 (X1 is the distance from the working face to the peak bearing pressure under low-speed propulsion.) from the working face to the support pressure under low-speed propulsion is greater than the high-speed propulsion distance X2 (X2 is the distance from the working face to the peak bearing pressure under high-speed propulsion.), the peak value k1q0 (k1 is the stress concentration factor; q0 is geostress) of the front support pressure under low-speed propulsion is smaller than the peak value k2q0 (k2 is the stress concentration factor; q0 is geostress) of high-speed propulsion, and the basic bursting length L1 (L1 is the fracture length of the main roof) under low-speed propulsion is smaller than the high-speed propulsion change L2. At the same time, with the acceleration of the advancement speed, the peak value kq0 of the support pressure in front of the working face increases, and the distance X0 from the working face to the peak value of the support pressure shortens [13]. Therefore, the accumulated elastic strain energy of the top plate can move into the working face and the risk of rock burst increases.
The influence of mining activities has changed the distribution of stress field in surrounding rock. Every roof periodic weighting will cause the stress in front of the coal wall to increase, resulting in the formation of stress difference in surrounding rock, causing the stress in surrounding rock to shift from a high stress area to a low stress area. Under the influence of excavation, the front of the working face is a high stress area, which transfers to the surrounding coal and rock mass. The stress transfer of the surrounding rock causes the elastic strain energy in the roof to change. The difference of periodic weighting intervals changes the period of roof energy accumulation and release. The occurrence of microseismic events reflects the changes of overlying rock activities and roof energy. The more elastic strain energy accumulated in the period of roof energy release, the greater the impact risk. In a word, the coal seam impact risk depends on how much elastic strain energy stored in the roof is released, and the energy released by the impact risk is related to the microseismic energy and its conversion rate.
The relationship between microseismic energy and advancement speed conforms to exponential function, namely Equation (1). The energy of microseismic events is mainly the energy released by coal seam impact hazard, and the rest energy is dissipated in the form of heat energy. Assuming that the convErsion rate of microseismic energy into coal seam impact hazard release energy is f, the relationship between coal seam impact hazard release energy Er and microseismic energy E is as follows:
E r = E × f
Bring Equation (1) into Equation (15):
E r = E × f = f ( 7.244 e v 0.156 + 38.668 )
Therefore, it can be seen that the energy released by coal seam impact hazard and the advancement speed meet the exponential function relation. When the advancing speed is accelerated, the roof movement decreases when the weighting step is prolonged, and the microseismic energy is mainly converted into energy released by coal seam impact hazard. However, the energy accumulation and release of the surrounding rock microseismic events are periodic, which makes the energy of the microseismic events keep a low trend and accumulate continuously in the early mining period, and the energy is released centrally at the end of the area. In the subsequent mining, the energy accumulation and release period of surrounding rock in the working face is continuously shortened. When the accumulated strain energy in the surrounding rock exceeds its storage limit, the excess energy will be released. Different energy release results in different damage degrees to the surrounding rock, and partial energy release results in plastic deformation of surrounding rock (mainly leads to intensified deformation of roadway). If all the energy is released, rock ejection or coal outburst will be caused in areas with weak compressive strength to induce rock burst.

4.2. Impact Ground Pressure Caused by Coordinated Change of Advancement Speed and Stoping Time

The change of mechanical properties of surrounding rock caused by mining activities is extended to a microscopic angle. The failure modes of coal and rock samples are different under different loading rates. Under the condition of a low loading rate in uniaxial compression test, many main cracks appear in coal rock specimens in a closed state with a high penetration degree. Under the condition of high loading rate, the number of main cracks of coal and rock samples decreases and the failure time becomes shorter [15].
From the angle of work application, the specimen is in the elastic deformation stage with the application of external force under a low loading rate, and the work applied to the specimen is converted into elastic deformation energy, which is stored in the specimen, and static damage occurs when the specimen is transferred to the surface with the penetration of cracks. The loading rate increases, the rock deformation is small, the yield stage is short, the deformation speed is faster than the elastic stage, and the process from yield point to peak value is almost completed in an instant. After the peak value, the rock burst and catapulted from static failure to dynamic failure [28].
Different loading rates have effects on the deformation and damage of rock, which is an irreversible process. Therefore, from a microscopic point of view, loading and unloading changes the destruction form of rocks. From a macro point of view, different mining speeds at the working face affect the loading process of coal and rock mass. Low-speed mining is a low-speed loading process for coal and rock mass. High speed mining corresponds to high speed loading. On the other hand, the disturbance of coal and rock mass caused by working face stoping disappears during the stoping period, which is an unloading process for the coal and rock mass under load. In short, the effect of the advancing speed of the working face and the stoping time is the loading and unloading process for the coal and rock mass. Yin Xiangchu defines the loading and unloading response ratio (LURR) by using the rock stress-strain curve [29], which is a new parameter that can quantitatively reflect the instability degree of the nonlinear system. It is defined as follows:
Y = X + X
In Equation (17), X+ and X respectively represent the response rates of rocks during loading and unloading periods.
When the rock is in elastic state, the Y value fluctuates at 1. When the rock is damaged, the response rate in the loading period is greater than that in the unloading period, i.e. Y > 1. With the increase of load, the damage degree of rock also increases, and the Y value will increase to be significantly greater than 1.
Yin Xiangchu used LURR theory to predict mine earthquakes [30]. According to the definition in seismology that seismic energy U and its related quantities are often used as response quantities, the loading and unloading response ratio Y can be defined as follows:
Y = U + U
In Equation (18), U+ represents the seismic wave energy radiated by the earthquake occurred in the loading period; U represents the seismic wave energy radiated by the earthquake occurred in the unloading period.
According to Equation (18), in this paper, if the energy of microseismic event in the mining process of similar simulation experimental working face is taken as the response quantity to evaluate the impact risk, then the load/unload response ratio Y is defined as follows:
Y = E + E
In Equation (18), E+ represents the energy of microseismic events during mining. E indicates the energy of microseismic events during stopping.
Substituting Equations (1) and (8) into Equation (19),
Y = E + E = 7.244 e v 0.156 + 38.668 A e t B + C
From Equation (20), it can be seen that the loading/unloading response ratio is related to the advancing speed of the working face and the stopping time, which also confirms that the synergistic change of advancing speed and stopping time causes rock burst.
Statistical analysis of the characteristics of microseismic events under normal mining, stopping and repeated mining at the working face is carried out, and the curve shown in Figure 14 is drawn. As can be seen from Figure 14, the change trend of loading and unloading response ratio for normal mining and repeated mining is basically the same. In area 2, the loading and unloading response ratio is much larger than 1 due to frequent overburden activities. In the low-speed mining stage during normal mining, the response of loading and unloading is relatively low due to short stopping time. With the prolongation of stopping time, the value of the loading and unloading response ratio Y gradually increases. The energy accumulated in the process of loading surrounding rock is greater than that released by unloading. Cracks develop in the surrounding rock, the deformation speed of surrounding rock accelerates, and the degree of impact hazard increases. In the high-speed mining stage, the response of loading and unloading is relatively high due to short stopping time, and the risk of impact is relatively high. When mining again, in the low-speed mining stage, the loading-unloading response ratio gradually increases with the prolongation of the stopping time, but the Y value remains below 1. High-speed stoping has a short stoping time, low creep degree of rock, no time to release accumulated energy, and the working face has been pushed into the next loading cycle, resulting in an increase in loading–unloading response ratio and sudden release of energy leading to rock burst.
Statistics are made on the loading/unloading ratio of the synergistic effect of the advancing speed and the stopping time under normal mining and repeated mining respectively, as shown in Table 2. It can be found that normal mining and recovery have high impact risk when the Y value corresponding to long low-speed stopping time and short high-speed stopping time is high. The loading–unloading response ratio is high, and the essence of rock burst is the sudden release of elastic strain energy stored in coal and rock mass, converted into kinetic energy to destroy coal and rock mass.

5. Coordinated Control and Disaster Reduction of Advancement Speed and Stoping Time

5.1. Determination of Safety Mining Indicators

The advancing speed and stopping time of the working face are one of the main factors that affect the redistribution of stress in the surrounding rock of the working face. For rock burst mines, the effect of advancing speed and stopping time on energy release is crucial. In order to effectively prevent the working face from being affected by the effect of pushing and mining speed and stopping time to induce rock burst, it is necessary to establish a cooperative control method of advancing speed and stopping time, and the key of cooperative control is to obtain a safe and workable index value. The index value of safe mining is actually the reasonable value of microseismic energy. In normal mining, the release of energy through microseismic monitoring can make the mine safe and efficient mining within a reasonable range. Through the monitoring and analysis of microseismic events, the energy of a single microseismic event is taken as the basis for coordinated control. Using the method of mathematical statistics, the monitored data are divided into 11 intervals at intervals of 20 J/n to analyze and obtain safe and workable index values. Statistics on the frequency and percentage of single stoping microseismic events are shown in Figure 15.
According to the same interval division method, the energy released by a single mining microseismic event and its percentage are counted, as shown in Figure 16. As can be seen from Figure 16, 160 J/n and 180 J/n are critical values. (0–160 J/n) is taken as the confidence interval, and the corresponding confidence level is 96.42%; Taking (0–180 J/n) as the confidence interval, the corresponding confidence level is 99.84%. Therefore, the 180 J/n confidence level accuracy is higher and closer to the actual situation. Therefore, the 180 J/n energy released by a single microseismic event is taken as the basis for coordinated control of the advancement speed and stoping time effect.
127 times of normal mining and 6 velocity gradients were set in the working face. On the premise of determining the basis of coordinated control, the relationship between the maximum value of microseismic energy of each mining and the advancement speed is analyzed and the curve shown in Figure 17 is drawn by fitting. The relationship between the fitted microseismic energy and the advancement speed satisfies Equation (21).
E = 4.569 e v 25.263 + 5.777
It can be seen from Figure 17 that the relationship between microseismic energy and advancement speed is not simple linear, and the overall trend of the curve is monotonous increasing through fitting. In the third stage of the fourth mining area, the index value 180 J/n of coordinated control intersects with the fitting curve, and the advancing speed is 4 m/d. The advance speed is a critical value at 4.0 m/d, so in this similar simulation experiment, the advance speed of 4 m/d is the best advance speed for safe mining.

5.2. Coordinated Control During Production Suspension and Recovery

The characteristics of coal seam impact risk can be evaluated by using the load unload response ratio, and the characteristics of load unload response ratio of different advancing speed and stopping time during mining shown in Figure 18 are drawn. It can be seen from Figure 18 that when the advancement speed is 1.6 m/d, the corresponding ratio of loading and unloading when the stopping time is less than 5 days is lower than the critical value; when the advancement speed is 2.4 m/d, the corresponding ratio of loading and unloading when the stoping time is more than three days is lower than the critical value; when the advancement speed is 4.0 m/d, the corresponding ratio of loading and unloading when the stopping time is more than five days is higher than the critical value; when the advancement speed is 4.8 m/d. The y value is far lower than the critical value in the whole stoping time; at 5.6 m/d, the y value of the stopping time exceeds the critical value on the third day. It can be seen that the y value is lower than the critical value within three days in low-speed mining, and the y value is lower than the critical value within 5–7 days in high-speed mining.
Similarly, the characteristics of loading and unloading response ratio of different stopping time under different advancement speed after recovery are drawn (Figure 19). It can be seen from Figure 19 that the y value is always lower than the critical value when the advancement speed is 1.6 m/d; when the production is stopped for one day, the y value is far lower than the critical value when the advancement speed is 3.2–4.8 m/d; when the production is stopped for three days, the y value of 2.4 m/d and 4.0 m/d exceeds the critical value; when the production is stopped for five days, the advancement speed is lower than the critical value when it is 3.2–5.6 m/d; when the production is stopped for seven days, the advancement speed is lower than the critical value when it is 3.2–4.0 m/d.
To sum up, according to the characteristics of microseismic events in mining, the safety index of coordinated control is determined as the single microseismic energy is lower than 180 J, and the best advance speed of normal mining safety is 4 m/d. If the energy of microseismic event is more than 180 J for five consecutive times in mining, the advancement speed will be gradually restored to the normal range when the microseismic response is restored to the safe state; the advancement speed will be adjusted according to the different stoping time after recovery so as to ensure the safe and efficient mining of the mine and guide the safe and efficient mining of similar rock burst mine.

6. Conclusions

(1) For a rock burst mine, the effect of advancing speed and stopping time on energy release is very important. The advancing speed changes the period of energy accumulation and release of surrounding rock, which leads to the difference of energy release between stoping and stoping; The relationship between the energy released by microseismic events and the advancing speed is an exponential function during mining with the extension of stoping time, the energy of low-speed mining microseismic event presents a mutation type, while the energy of high-speed mining microseismic event presents a gradual growth type.
(2) Mining disturbance is the premise of stress transfer, and the occurrence of microseismic events during stoping time is the result of stress transfer. Affected by the advancement speed, if the energy transfer speed in the coal body is less than the accumulation speed, the energy concentration in the coal body exceeds its bearing capacity and is suddenly released, resulting in the occurrence of rock burst. During the stoping time, the overburden disturbed by mining moved frequently, the energy and frequency of the secondary events increased significantly, and the unbalanced release of energy led to the occurrence of rock burst.
(3) The risk of coal seam impact depends on the amount of elastic strain energy released from the roof, and the energy released from the risk of impact is related to the microseismic energy and its conversion rate. It is found that the relationship between the energy released by coal seam impact and the advancing speed satisfies the exponential function. By using the load unload response ratio, the relationship between the synergistic effect of advancement speed stoping time and the characteristics of coal and rock microseismic events is analyzed. The mechanism of rock burst induced by the effect of working face advancement speed stopping time is studied, and the load unload response ratio considering the effect of advancement speed stoping time is deduced.
(4) Based on the safety mining index of coordinated control constructed by single microseismic event energy lower than 180 J, the best advance speed of normal mining safety mining is determined to be 4 m/d; the coordinated control range during stoping and recovery mining is determined by the corresponding ratio of loading and unloading. In the actual production of the mine, the corresponding pressure relief measures are formulated according to the cooperative change law of microseismic events with the effect of advancement speed and stoping time, which are well applied in the actual production of the mine. The Kuangou Coal Mine can produce safely and efficiently, and at the same time, it can also provide guidance for safe and efficient mining of similar rock burst coal mines.

Author Contributions

Conceived, designed and analyzed the results, F.C.; performed the experiments and wrote the manuscript, Y.Y.; C.J. and P.S.; supervised the research work, X.L. Both the authors reviseed and proofread the manuscript. All authors have read and agreed to the published version of the manuscript.

Funding

This work is sponsored by the National Natural Science Foundation of China (No.51874231, 51504184), which is part of the Shaanxi Natural Science Fundamental Research Program Enterprise United Fund (2019JLZ-04). The “Special Support Program” of Shanxi Province in 2017 and Shaanxi Innovation Team Program (No. 2018TD-038) are gratefully acknowledged. The authors wish to acknowledge the financial support of the Outstanding Youth Science Fund of the Xi’an University of Science and Technology (2019YQ2-16).

Conflicts of Interest

The authors declare no conflict of interest.

References

  1. Jiang, Y.D.; Zao, Y.X. State of the art: Investigation on mechanism forecast and control of coal bumps in China. Chin. J. Rock Mech. Eng. 2015, 34, 2188–2204. [Google Scholar]
  2. Pan, Y.S.; Li, Z.H.; Zhang, M.T. Distribution, type, mechanism and prevention of rock burst in China. Chin. J. Rock Mech. Eng. 2003, 22, 1844–1851. [Google Scholar]
  3. Dou, L.M.; He, X.Q.; He, H.; He, J.; Fan, J. Spatial structure evolution of overlying strata and inducing mechanism of rock burst in coal mine. Trans. Nonferrous Met. Soc. China 2014, 24, 1255–1261. [Google Scholar] [CrossRef]
  4. Shan, P.F.; Lai, X.P. Numerical Simulation of the Fluid-Solid Coupling Process During the Failure of a Fractured Coal-Rock Mass Based on the Regional Geostress Characteristics. J. Transp. Porous Media 2018, 124, 1061–1079. [Google Scholar] [CrossRef]
  5. Shan, P.F.; Lai, X.P. Influence of CT scanning parameters on rock and soil images. J. Vis. Commun. Image Represent. 2019, 58, 642–650. [Google Scholar] [CrossRef]
  6. Dou, L.M.; He, X.Q. Technique of classification forecasting rock burst in coal mines. J. China Univ. Min. Technol. 2007, 36, 717–722. [Google Scholar]
  7. Cai, M.F.; Ji, H.G.; Wang, J.A. Study of the time-spacestrength relation for mining seismicity at Laohutai coal mine and its prediction. Int. J. Rock Mech. Min. Sci. 2005, 42, 145–151. [Google Scholar] [CrossRef]
  8. Simser, B.P. Rock burst management in Canadian hard rock mines. J. Rock Mech. Geotech. Eng. 2019, 11, 1036–1043. [Google Scholar] [CrossRef]
  9. Dou, L.M.; Lu, C.P.; Mu, Z.L.; Gao, M.S. Prevention and forecasting of rock burst hazards in coal mines. Min. Sci. Technol. 2009, 19, 585–591. [Google Scholar] [CrossRef]
  10. Li, H.T.; Song, L.; Zhou, H.W.; Jiang, Y.D.; Wang, H.W. Evaluation method and application of coal burst performance under the effect of loading rate. J. China Coal Soc. 2015, 40, 2763–2771. [Google Scholar]
  11. Wang, J.C.; Wang, Z.H. Impact effect of dynamic load induced byhard roof in high intensity working face. Chin. J. Rock Mech. Eng. 2015, 34, 1844–1851. [Google Scholar]
  12. Zhao, T.B.; Guo, W.Y.; Han, F.; Gu, S.T. Analysis on energy accumulation and release of roofunder influence of mining speed. Coal Sci. Technol. 2018, 46, 37–44. [Google Scholar]
  13. Wang, J.N.; Jiao, S.H.; Xie, G.X. Study on influence of mining rate on stress environment in surrounding rock of mechanized top caving working face. Chin. J. Rock Mech. Eng. 2006, 25, 1118–1124. [Google Scholar]
  14. Wang, L.; Xie, G.X. Influence of Mining Velocity on Dynamic Disasters in the Coal and Rock Mass at a Fully Mechanized Working face. J. China Univ. Min. Technol. 2010, 39, 70–74. [Google Scholar]
  15. Yang, S.L.; Wang, Z.H.; Jiang, W.; Yang, J.H. Advancing rate effect on rock and coal failure format in high-intensity working face. J. China Coal Soc. 2016, 41, 586–594. [Google Scholar]
  16. Dou, L.M.; Jiang, Y.D.; Cao, A.Y.; Liu, H.S.; Gong, S.F.; Cai, W.; Zhu, G.A. Monitoringand pre-warning of rock burst hazard with technology of stress fieldand wave field in underground coalmines. Chin. J. Rock 2017, 36, 803–811. [Google Scholar]
  17. Dou, L.M.; Mu, Z.L.; Li, Z.L.; Cao, A.Y.; Gong, S.Y. Research progress of monitoring, forecasting, andprevention of rock burst in underground coal mining in China. Int. J. Coal Sci. Technol. 2014, 1, 278–288. [Google Scholar] [CrossRef] [Green Version]
  18. Dou, L.M.; Chen, T.J.; Gong, S.Y.; He, H.; Zhang, S.B. Rock burst hazard determination by using computed tomography technology in deep workface. Saf. Sci. 2012, 50, 736–740. [Google Scholar] [CrossRef]
  19. He, X.Q.; Chen, W.X.; Nie, B.S.; Mitri, H. Electromagnetic emission theory and its application to dynamic phenomena in coal-rock. Int. J. Rock Mech. Min. Sci. 2011, 48, 1352–1358. [Google Scholar] [CrossRef]
  20. Liu, J.H.; Sun, H.; Tian, Z.J.; Jiang, F.X.; Li, D.; Wang, Y.; Zhu, Q.J. Effect of advance speed on rock burst in coal mines and its dynamic control method. J. China Coal Soc. 2018, 43, 1858–1865. [Google Scholar]
  21. Chen, T. Analysis of the relationship between advancing speed and periodical weighting span in fully mechanized working face. Coal Min. Technol. 1999, 34, 33–35. [Google Scholar]
  22. Brodny, J. Tests of friction joints in mining yielding supports under dynamic load. Arch. Min. Sci. 2011, 56, 303–318. [Google Scholar]
  23. Szurgacz, D.; Brodny, J. Tests of Geometry of the Powered Roof Support Section. Energies 2019, 12, 3945. [Google Scholar] [CrossRef] [Green Version]
  24. Szurgacz, D.; Brodny, J. Analysis of the Influence of Dynamic Load on the Work Parameters of a Powered Roof Support’s Hydraulic Leg. Sustainability 2019, 11, 2570. [Google Scholar] [CrossRef] [Green Version]
  25. Cui, F.; Zhang, T.H.; Lai, X.P.; Cao, J.T.; Shan, P.F. Study on the evolution law of overburden breaking angle under repeated mining and the application of roof pressure relief. Energies 2019, 12, 4513. [Google Scholar] [CrossRef] [Green Version]
  26. Li, Y.S. Rock burst mechanism and its preliminary application. China Coll. Min. Technol. 1985, 3, 42–48. [Google Scholar]
  27. Cui, F.; Yang, Y.B.; Lai, X.P.; Cao, J.T. Similar material simulation experimental study on rock bursts induced by keystratum breaking based on microseismic monitoring. Chin. J. Rock Mech. Eng. 2019, 38, 803–814. [Google Scholar]
  28. Guo, Z. The relativity between testing condition and mechanical characteristics of rocks. Hydrogeol. Eng. Geol. 1995, 1, 15–19. [Google Scholar]
  29. Yin, X.C.; Yin, X.F.; Yu, H.Z.; Zhang, H.H.; Yan, D.Y. Preliminary study on mining induced earthquake prediction in terms of loading-unloading response ratio. Earthquake 2004, 24, 25–30. [Google Scholar]
  30. Yin, X.C.; Liu, Y. Load-unload response ratio-An interplay between earthquake prediction and mechanics. Adv. Mech. 2013, 43, 555–580. [Google Scholar]
Figure 1. B4-1 coal seam sidoning solid coal workface layout.
Sustainability 12 00037 g001
Figure 2. Microseismic monitoring system arrangement.
Sustainability 12 00037 g002
Figure 3. Microseismic event characteristics of different advance speeds on the working face.
Sustainability 12 00037 g003
Figure 4. Single microseismic event energy.
Sustainability 12 00037 g004
Figure 5. Area two roof caving.
Sustainability 12 00037 g005
Figure 6. Area four roof caving.
Sustainability 12 00037 g006
Figure 7. Microseismic characteristics of advance speeds at different stoping times.
Sustainability 12 00037 g007
Figure 8. Microseismic energy characteristics of each advance speed under different stoping times. (a) Advance speed is 1.6 m/d; (b) advance speed is 2.4 m/d; (c) advance speed is 3.2 m/d; (d) advance speed is 4.0 m/d; (e) advance speed is 4.8 m/d; and (f) advance speed is 5.6 m/d.
Sustainability 12 00037 g008aSustainability 12 00037 g008b
Figure 9. Frequency characteristics of microseismic waves of different advance speeds under different stoping times. (a) Advance speed is 1.6 m/d; (b) advance speed is 2.4 m/d; (c) advance speed is 3.2 m/d; (d) advance speed is 4.0 m/d; (e) advance speed is 4.8 m/d; and (f) advance speed is 5.6 m/d.
Sustainability 12 00037 g009
Figure 10. Characteristics of microseismic events during stoping.
Sustainability 12 00037 g010
Figure 11. The characteristics of the microseismic event of normal mining, stope time, and recovery.
Sustainability 12 00037 g011
Figure 12. Microseismic characteristics after recovery.
Sustainability 12 00037 g012
Figure 13. Roof load distribution of different advance speeds. (a) Roof load distribution of low advance speed and (b) roof load distribution of high advance speed.
Sustainability 12 00037 g013
Figure 14. Load/unload response ratio of normal mining and recovery.
Sustainability 12 00037 g014
Figure 15. Frequency statistics of single recovery microseismic.
Sustainability 12 00037 g015
Figure 16. Energy statistics of single recovery.
Sustainability 12 00037 g016
Figure 17. Relationship between advance speed and microseismic energy.
Sustainability 12 00037 g017
Figure 18. Load/unload response ratio of stoping time.
Sustainability 12 00037 g018
Figure 19. Load/unload response ratio of recovery.
Sustainability 12 00037 g019
Table 1. Experimental design.
Mining AreaArea 1Area 2Area 3Area 4Area 5Area 6
Specific range (cm)0–3232–63.263.2–95.295.2–127.2127.2–158.4158.4–192
Daily advancement (m/d)1.62.43.244.85.6
Advance speed (cm/d)0.81.21.622.42.8
Number of mining per stage (n)402620161312
production pause time (d)1/3/5/71/3/5/71/3/5/71/3/5/71/3/5/71/3/5/7
Number of times of recovery (n)Stage 11–1011–611–511–411–311–31
Stage 211–2037–1336–1035–834–634–63
Stage 321–30514–20511–1559–1257–957–95
Stage 431–40721–26716–20713–16710–13710–127
Table 2. Load/unload response ratio of statistical synergy.
Working FaceAdvance SpeedShort Stopping TimeLong Stopping Time
normal mininglow speedY value is lowY value increases
high speedY value is higherY value decreases
repeated mininglow speedY value is lowY value increases
high speedY value is higherY value decreases

