Optimization of Airport Capacity Efficiency by Selecting Optimal Aircraft and Airline Business Model


1
Airport Operations and Maintenance Supervision Department, Zagreb Airport Ltd., Rudolfa Fizira 1, 10410 Velika Gorica, Croatia
2
Department of Air Transport, University of Zagreb, Faculty of Transport and Traffic Sciences, Vukeliceva 4, 10000 Zagreb, Croatia
3
Integrated management system and Consulting Department, Zagreb Airport Ltd. Rudolfa Fizira 1, 10410 Velika Gorica, Croatia
4
Department of Logistics and Sustainable Mobility, University North, 48000 Koprivnica, Croatia
*
Author to whom correspondence should be addressed.
Sustainability 2020, 12(10), 3988; https://0-doi-org.brum.beds.ac.uk/10.3390/su12103988
Submission received: 21 March 2020
/
Revised: 5 May 2020
/
Accepted: 8 May 2020
/
Published: 13 May 2020
(This article belongs to the Special Issue Toward Sustainability: Airport Risk Assessment)
Abstract
:This paper analyses the impact of airline business models on airport infrastructure and operational capacity and answers the question how to optimize capacity in order to achieve maximum efficiency and profitability as well as how to maintain an adequate level of service quality. As part of the research, a new model was created as an integral part of the Airport Management Strategy Software (AMSS) application. The purpose of the application is to enable the airport management to review and optimize operations in terms of maximum technical and technological capacity utilization. In addition, the application can be used to fill the available slots according to the specifics of the airline’s business model without compromising the security, flexibility, and profitability of airport operations. The validation of the application was conducted at Zagreb Airport, which generated traffic of 3.4 million passengers in 2019. The result of the research is a model which, based on the calculation of the existing capacity of the airport infrastructure and ground handling equipment, enables the simulation of new airline business models and aircraft type implementation. Furthermore, the model also analyses their impact on the utilization of the airport infrastructure and equipment. The research demonstrated the interdependence between airport capacity optimization and optimal slot allocation, and the specifics of airline business models and aircraft types in their fleets. By adopting this model, airport managers can prevent mistakes that arise during negotiations with airlines, which can result in the under capacity of the infrastructure, equipment, and human resources as well as cause lower levels of security, numerous delays, reduced quality of service and, ultimately, negative financial effects.
1. Introduction
Air transport is one of the most capital-intensive industries in the world. It is characterized as the fastest and safest traffic branch option for the transportation of people and goods, and the one which significantly contributes to the development of the global economy, political stability, and increase in social values. The business strategy of all air traffic stakeholders has been significantly changed since its beginnings.
New types of airline business models have been developed. A large number of airports have been privatized through various forms of concessions and the development of secondary commercial activities changed the primary business model of airports.
Air traffic control has increased the level of automation, upgraded technology through the Single European Sky ATM Research (SESAR) and NextGen projects (SESAR Joint Undertaking (EU body or agency), United States. Federal Aviation Administration, NextGen - SESAR, State of harmonisation, Published: 2017–01–12 and liberalized the European market for services in the Terminal Airspace.
Long-term disruptions of air traffic operations started in 2007 when the global economic crisis caused the collapse of the financial system [1,2,3,4,5]. A large number of airlines went bankrupt and a large number of airports reported significant losses [6]. The decline in demand for air transport and negative financial results forced airlines to change their destination management strategies and pricing policies, regardless of their business model, which had a direct impact on airport operations [7,8,9]. After emerging from the global economic crisis, the air transport market is recovering rapidly but disproportionately between airlines and airports especially in countries with a significant impact of tourism on air traffic development.
Unlike airlines that relocate their aircraft to more profitable routes, airports require an immediate increase in capacity and significantly higher capital investments. The only short-term option for airports is to optimize the existing infrastructure and operational capacity.
At most airports, the practice has been to bring in as many airlines as possible or to increase aircraft frequencies, often at peak hours, without considering the available infrastructure and ground handling equipment capacity. In most cases, the result was a decrease in the level of service quality or, in the worst case, long delays.
Document developed by EUROCONTROL and FAA [10] describes the high-level comparison of ATM comparable performance indicators, which relate to the measurement of quality of service, whereas authors note that “airport operations depend upon a number of factors as well as on interactions between them, which all affect runway capacity to some degree.” Authors note that, for physical constraints, such as airport layout, there are “strategic” factors such as airport scheduling and “tactical” factors that include, inter alia, the sequencing of aircraft and the sustainability of throughput during a specific weather condition. In terms of scheduling, the authors have identified four main categories of delay that are affecting the air transport performance: Airline + Local turnaround, Extreme Weather, Late arriving aircraft (or reactionary delay), Security, and the ATM system. The ATM system delay results from not only en-route and airport capacity shortfalls (ATFCM delays) but also, among others, include weather effects and aircraft operations (IMC approaches, convective weather). This paper does not consider the ATFCM related delays imposed by the ATC and Traffic Management Initiatives (i.e., slot allocation, sequencing, load balancing, flow restrictions, etc.) implemented through the various phases of flight.
In books [11,12] and papers [13,14,15], the authors analyse the trend of development and adaptation of airline business models to new market conditions. The authors of this paper did not find any literature that analyses the ability of airports to maximize the utilization of their infrastructure, optimize terminal capacity, and use equipment more efficiently without jeopardizing their operations in terms of providing a satisfactory level of service and operating without delays. The segments that are not the subject of the previously mentioned research were investigated and discussed in this paper.
In Reference [16], the authors analysed the controllers that respond to the complexity of a traffic scenario in the terminal airspace. The scenarios have been classified into four standard categories (basic, intermediate, advanced, and consolidation-exam) to enable the complexity analysis. The authors identified three families of factors that affect the air complexity in terminal airspace: aircraft counts, weather effect/ and complexity interactions/complexity index. This paper does not take into account the complexity factors and their effect on the operation of the airports and airlines. Our model has a built-in flight delay parameter that is mainly determined by the delay influencing factors generated at the airport.
The authors have developed a model that analyses the availability of airport operational and infrastructure capacity and enables airport management to control the available capacity as part of a newly developed application called Airport Management Strategy Software (AMSS). In addition, the model makes it possible to determine which aircraft would be optimal for reaching the airport’s infrastructure and operational capacity maximum, according to the specific requirements of the airlines’ business models without disrupting the airport’s existing operational and financial operations.
Accordingly, the following hypothesis was raised. It is possible to increase airport efficiency and maximize financial and operational results by optimizing the share of airline business models. The hypothesis is supported by the fact that airports do not have an application system that would define which additional aircraft can be accepted by taking into account the specifics of the airline operations without jeopardizing existing traffic.
The aim of the research is to optimize airport capacity by systematically monitoring the traffic data of the airlines and the specifics of their business models. The results confirmed the hypothesis and the research goal was achieved. In order to achieve the goal and verify the model, a simulation method was applied to a case study of Zagreb Airport.
After the application that determines the level of airport capacity usability was developed, testing was conducted to analyse the impact of the introduction of a new aircraft on the airport’s infrastructure and operational capacity in accordance with a specific airline business model.
For the first time, a new approach and a new model can be presented within the AMSS application. By using this application, the airport management obtains a unique new tool during negotiations with the airlines. The management can use this tool to verify the validity of their decisions when introducing new aircraft primarily at peak hours in order to analyse possible consequences of such decisions on the infrastructure and operational capacity.
Section 2 (Methodology) briefly describes several of the most used methods in this paper. The emphasis in this section is put on a detailed explanation of the new developed AMMS application. Section 3 (Results) provides a precise description of the experimental results through AMMS application, their interpretation, and the experimental conclusions. The functionality of the model was verified in the case study of Zagreb Airport. Section 4 (Discussion) shows the results of the comparative analysis of the airport management responses and the results obtained by the AMSS application. This section also includes limitations of the research and gives recommendations for future research. The conclusion sublimates the main research findings in this paper.
2. Methodology
Several scientific methods were used in the research as follows. The descriptive method is applicable in all parts of the paper, but it is especially present in the initial part describing an overview of the current research on this topic and where changes in the business strategy of major stakeholders in aviation were described. Furthermore, this method is also present in the part where the paper describes structure, phasing, and functionality of the model and the AMSS application. The historical, mathematical, and the statistical method were used when major stakeholders’ business was analysed (airport, airline, and air traffic management) with the aim to provide precise data and information for the model inputs. Those methods were also used as part of the activity for defining airport infrastructural and operational capacity (peak hours) as well as for collecting data from the case study airport (Zagreb Airport). The comparison, analysis, and synthesis methods were used in the segment where airline business models’, its uniqueness, and specialties were compared. Most of those methods were also used during testing the functionality of the model and AMSS application. It has a significant role when comparing results from three different aircraft/scenarios and when deciding which aircraft to choose for the specified time of the day. The interviewing and questionnaire method were used when defining the airport infrastructure, equipment, and operational capacity problems. Management-level employees were interviewed with the aim to see their perspective on the problem regarding editing new aircraft into the flight schedule without knowing airport capacity limits and a previous discussion with the operation department that will handle the new aircraft. To collect experience from different aviation stakeholders, the questionnaire was prepared and was sent to more than 50 stakeholders (airports, airlines, air traffic management, and aviation organization) worldwide. The case study method was used with the aim to test the model and AMSS application. The chosen airport for testing was Zagreb Airport. All the data (traffic, economic, infrastructure, and operational was collected from Zagreb Airport and its stakeholders) and were used for testing the model.
In addition to the previously mentioned methods, primary and secondary data sources were used. Primary data is information collected through original or first-hand research, while secondary is information that has been developed or collected in the past by someone else.
The primary sources include the following analyses:
- the processing time of passengers in traffic flows at Zagreb Airport was measured and the capacities of each primary technical and technological segments in the traffic flows were calculated
- a survey of air traffic stakeholders was conducted. The completed questionnaire was obtained from 31 airport management boards and ground handling providers, 19 airlines, and seven international aviation organizations, and their business strategies and needs were analysed.
- controlled observations were carried out–a recording of the movement of passengers and the activities of the personnel at Zagreb Airport was made in order to see the problems caused by congestion at peak hours.
- consultations were conducted with airport and airline personnel - consultations were conducted with experts working at Zagreb Airport operational services, the national airline Croatia Airlines, and representatives of foreign airlines: Turkish Airlines, Lufthansa, Austrian Airlines, and Air France.
The secondary data used in this paper were: airports’ and airlines’ business reports, and the databases of specialized airline consulting companies, as follows:
- Zagreb Airport internal data–the internal airport traffic databases, the price list of basic ground handling services, the incentive program, the annual financial reports, and the Development Department’s internal documents related to capacity.
- Scientific and professional papers of other authors–domestic and foreign literature (relevant books, scientific, and professional papers)
- Airlines’ annual reports–the annual reports of 13 airlines were obtained from the official websites, analysed, and used to compare airlines’ business performance as well as test the AMSS application.
- Aviation databases–Center for Aviation (CAPA) database, CH-Aviation, Anna Aero–traffic statistics for airports and airlines in Europe.
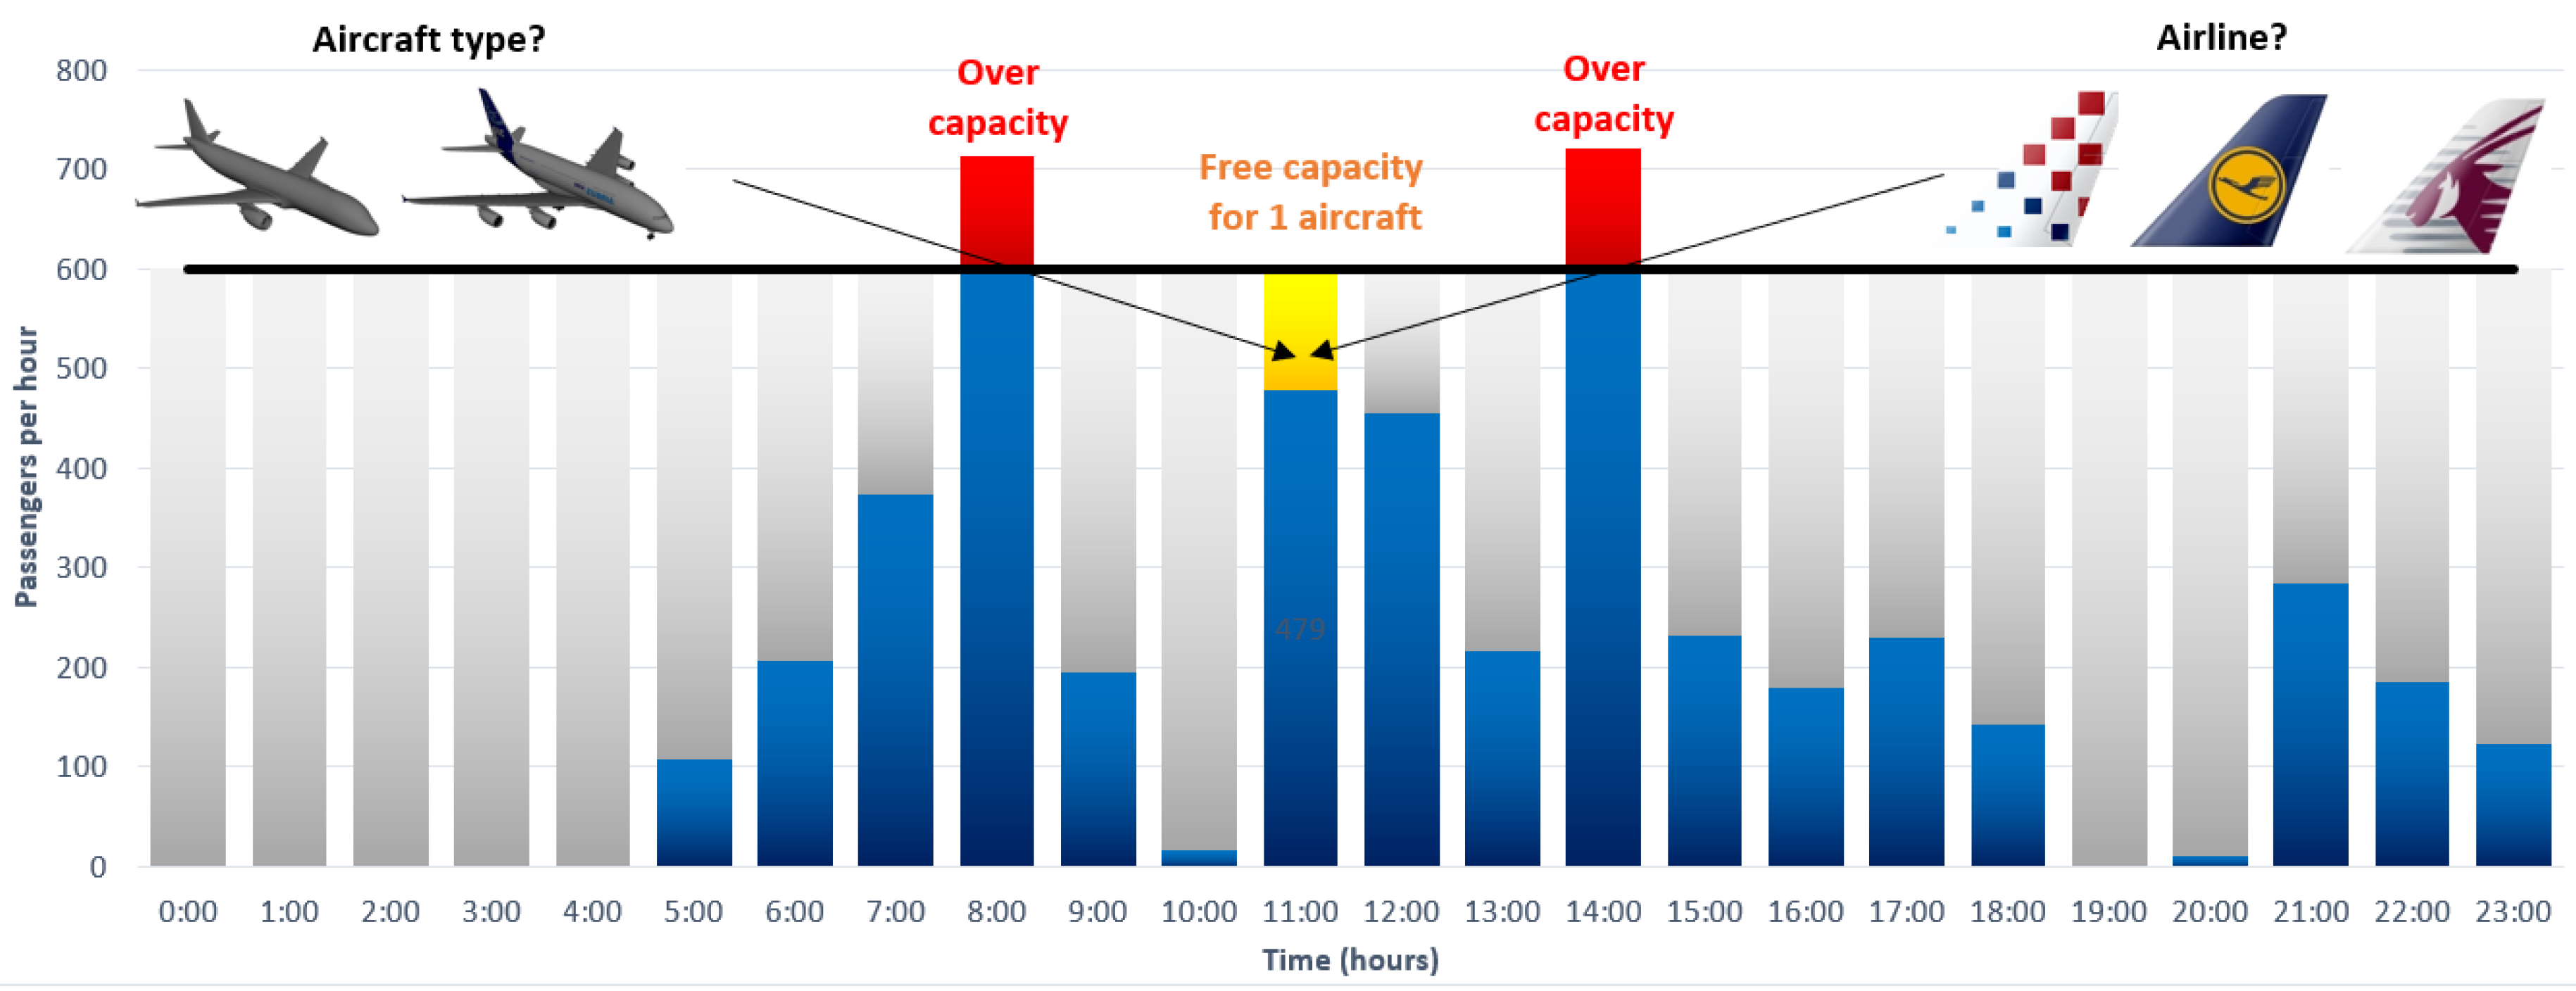
By analysing available research, the absence of a unique model or application that will assist the airport management in accurately selecting aircraft of preferred airlines according to the specifics of their business model and present the impact of such a selection on airport infrastructure. Necessary ground handling equipment was determined. The biggest benefit of AMSS application is the determination of the aircraft model and the business model that will fill the spare capacity at the airport without disrupting existing traffic. An example of available capacity for one day is shown in Figure 1.
Four main postulates have been considered with the aim of developing the model, determining the success of the business models in the past, and determining the specifics of a future airport development strategy.
- Historical overview of airport development–previous development and existing infrastructure of Zagreb Airport
- Zagreb Airport geo-traffic characteristics–geo-traffic position, region specificity, and catchment area, share of existing airline business models, structure of airlines, and route network development.
- Zagreb Airport operational capacities–selection of peak hours for passenger terminal capacity analysis, determination of existing capacities of the apron, the passenger terminal, the passenger processing time at the departure and arrival, analysis of waiting areas at departure, analysis of availability, and usability of ground handling equipment.
- Economic parameters for attracting airlines–determining the level of airport’s competitiveness in the region focusing primarily on the level of aeronautical and non-aeronautical charges as the main source of revenue.
In addition to these postulates, there are several other parameters shown in Table 1, that need to be analysed in order to gain quality insight into business results and airport development strategies, as shown below.
2.1. Structure and Functionality of the Model
The model for determination and selection of the preferred aircraft according to the specificities of the airline is integrated into the AMSS application and is composed of several mathematical, analytical, and logical functions. The application performs logic and algorithm functions as follows.
- Determines the existing capacity status of the airport, namely, the apron and the passenger terminal capacity as well as the availability of ground handling equipment.
- Determines the preferred aircraft according to its cabin dimensions and capacity that can be served within a period of increased daily capacitive loads in order to maximize airport efficiency.
- Based on the choice of the preferred aircraft, the model tests a selection of similar types of aircraft and suggests the type and business model of the airline that would be acceptable.
- Based on the determination of the aircraft size limit and the most acceptable business model, the application ascertains the number of new aircraft that can be accepted in the selected period in order to maximize airport capacity.
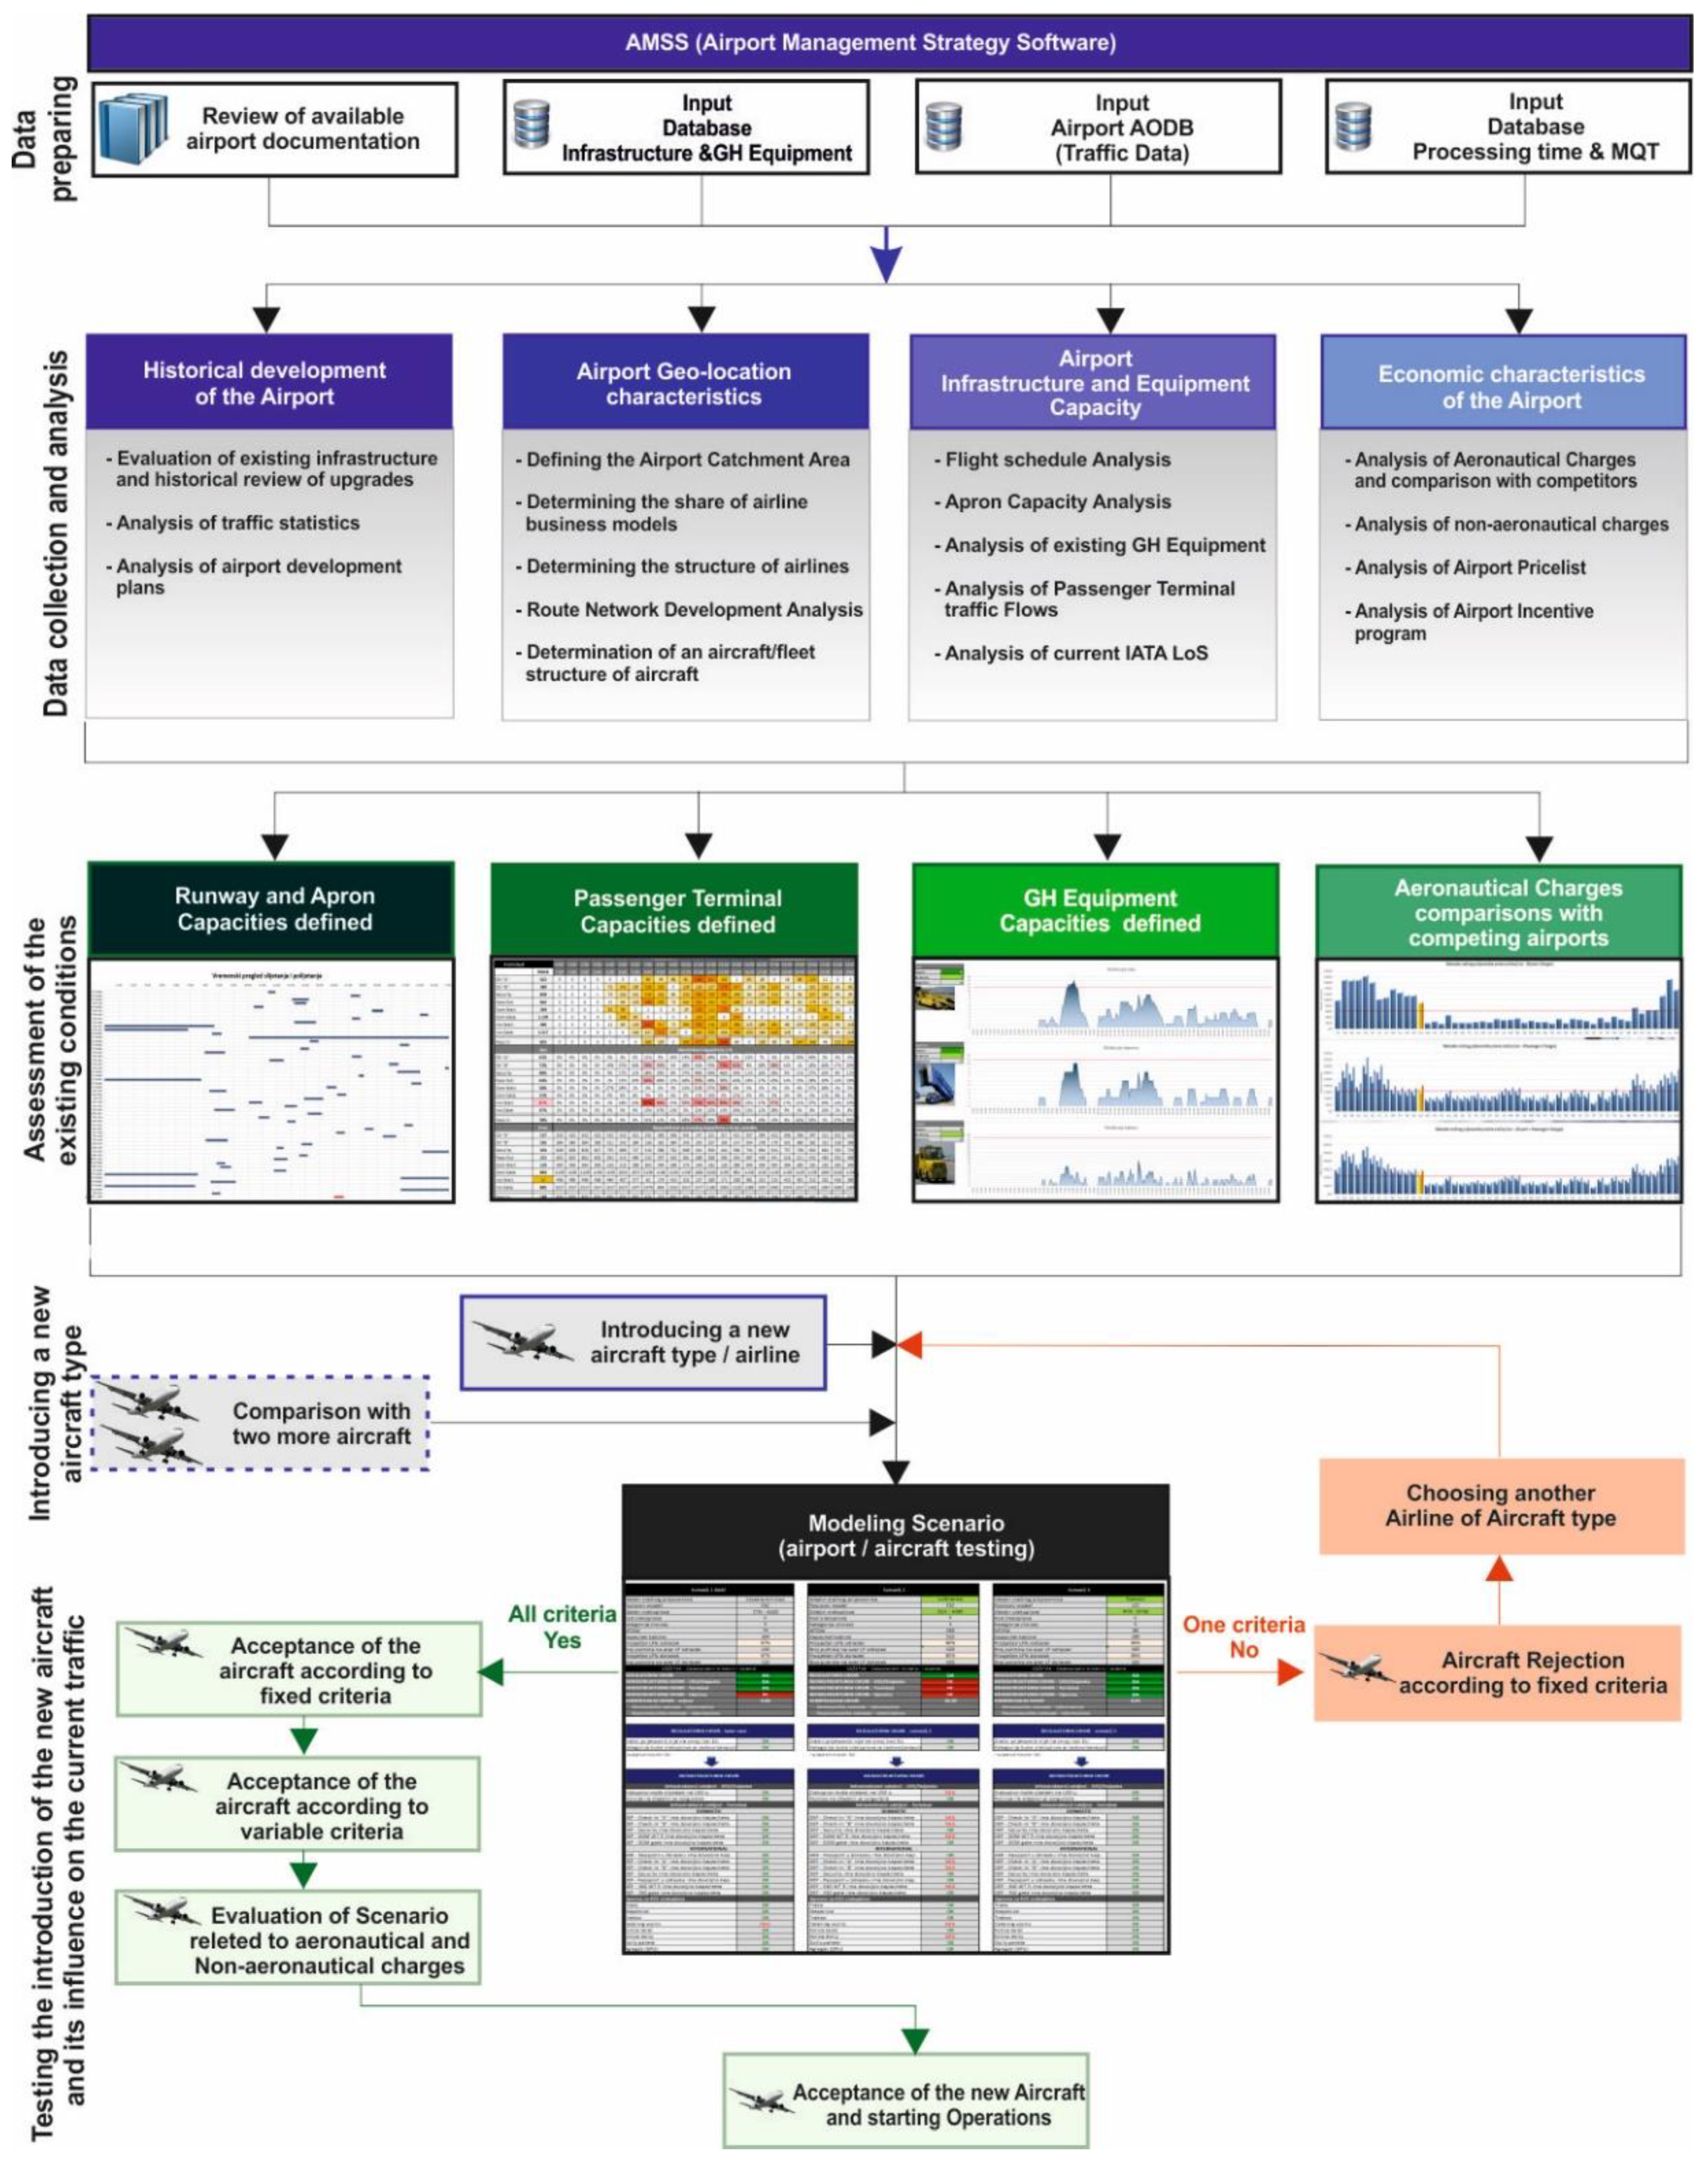
Figure 2 shows a scheme of the model for determining a new aircraft in accordance with the specifics of the airlines’ business models. The first segment of the model relates to data collection and analysis. The second segment identifies the existing state of infrastructure and the airport’s operationality whereby the model shows a visual display of the utilized and available capacities in the apron, the passenger terminal (all areas of traffic flows), and the ground handling equipment. The third segment consists of the input of the new aircraft and the specifics of the airline business model with the possibility of comparative analysis of the new aircraft with two additional aircraft to determine whether the suggested aircraft is the optimal choice. The fourth segment relates to the automated revision of regulatory criteria for introducing the new aircraft and testing infrastructure and operational capacity in order to determine their availability for the operations of the new aircraft and the financial benefits of its introduction. Lastly, a summary of the results is presented with the purpose of creating the basis for the airport management’s choice to deploy the preferred aircraft in accordance with the specifics of the airline’s business model. Figure 2 shows the scheme of the model levels in the AMSS application.
The three main phases of the model’s functionality are described below.
2.2. Phase 1. Data Input
The first phase, "Data input," refers to the collection, analysis, and systematic preparation of data from the available sources and databases of the airport and the airlines. The airlines used for the validation of the model are shown in Table 2 and are classified according to the airline business models and aircraft types.
2.3. Phase 2. Data Processing (Modelling)
The second phase is related to the modelling process, i.e., the collected data is entered into a model that is an integral part of the AMSS application. The purpose of this phase is to determine whether the preferred type of aircraft is suitable for deployment over a given period, in accordance with the availability of infrastructure and equipment capacity and the implications on existing traffic in terms of disruption, which reduces the quality of service or creates delays for other aircraft.
Previous research showed that it is often possible to introduce just one more aircraft in peak hours in the immediate proximity of maximum infrastructural and operational constraints. The problem is that several airlines are interested in introducing their aircraft in that particular hour. In such a situation, airport management makes the decision to accept any aircraft, most often without insight into the availability of infrastructure and operational capacity, which, thereby, directly, albeit unknowingly, causes disruption to existing traffic and reduces the quality of service.
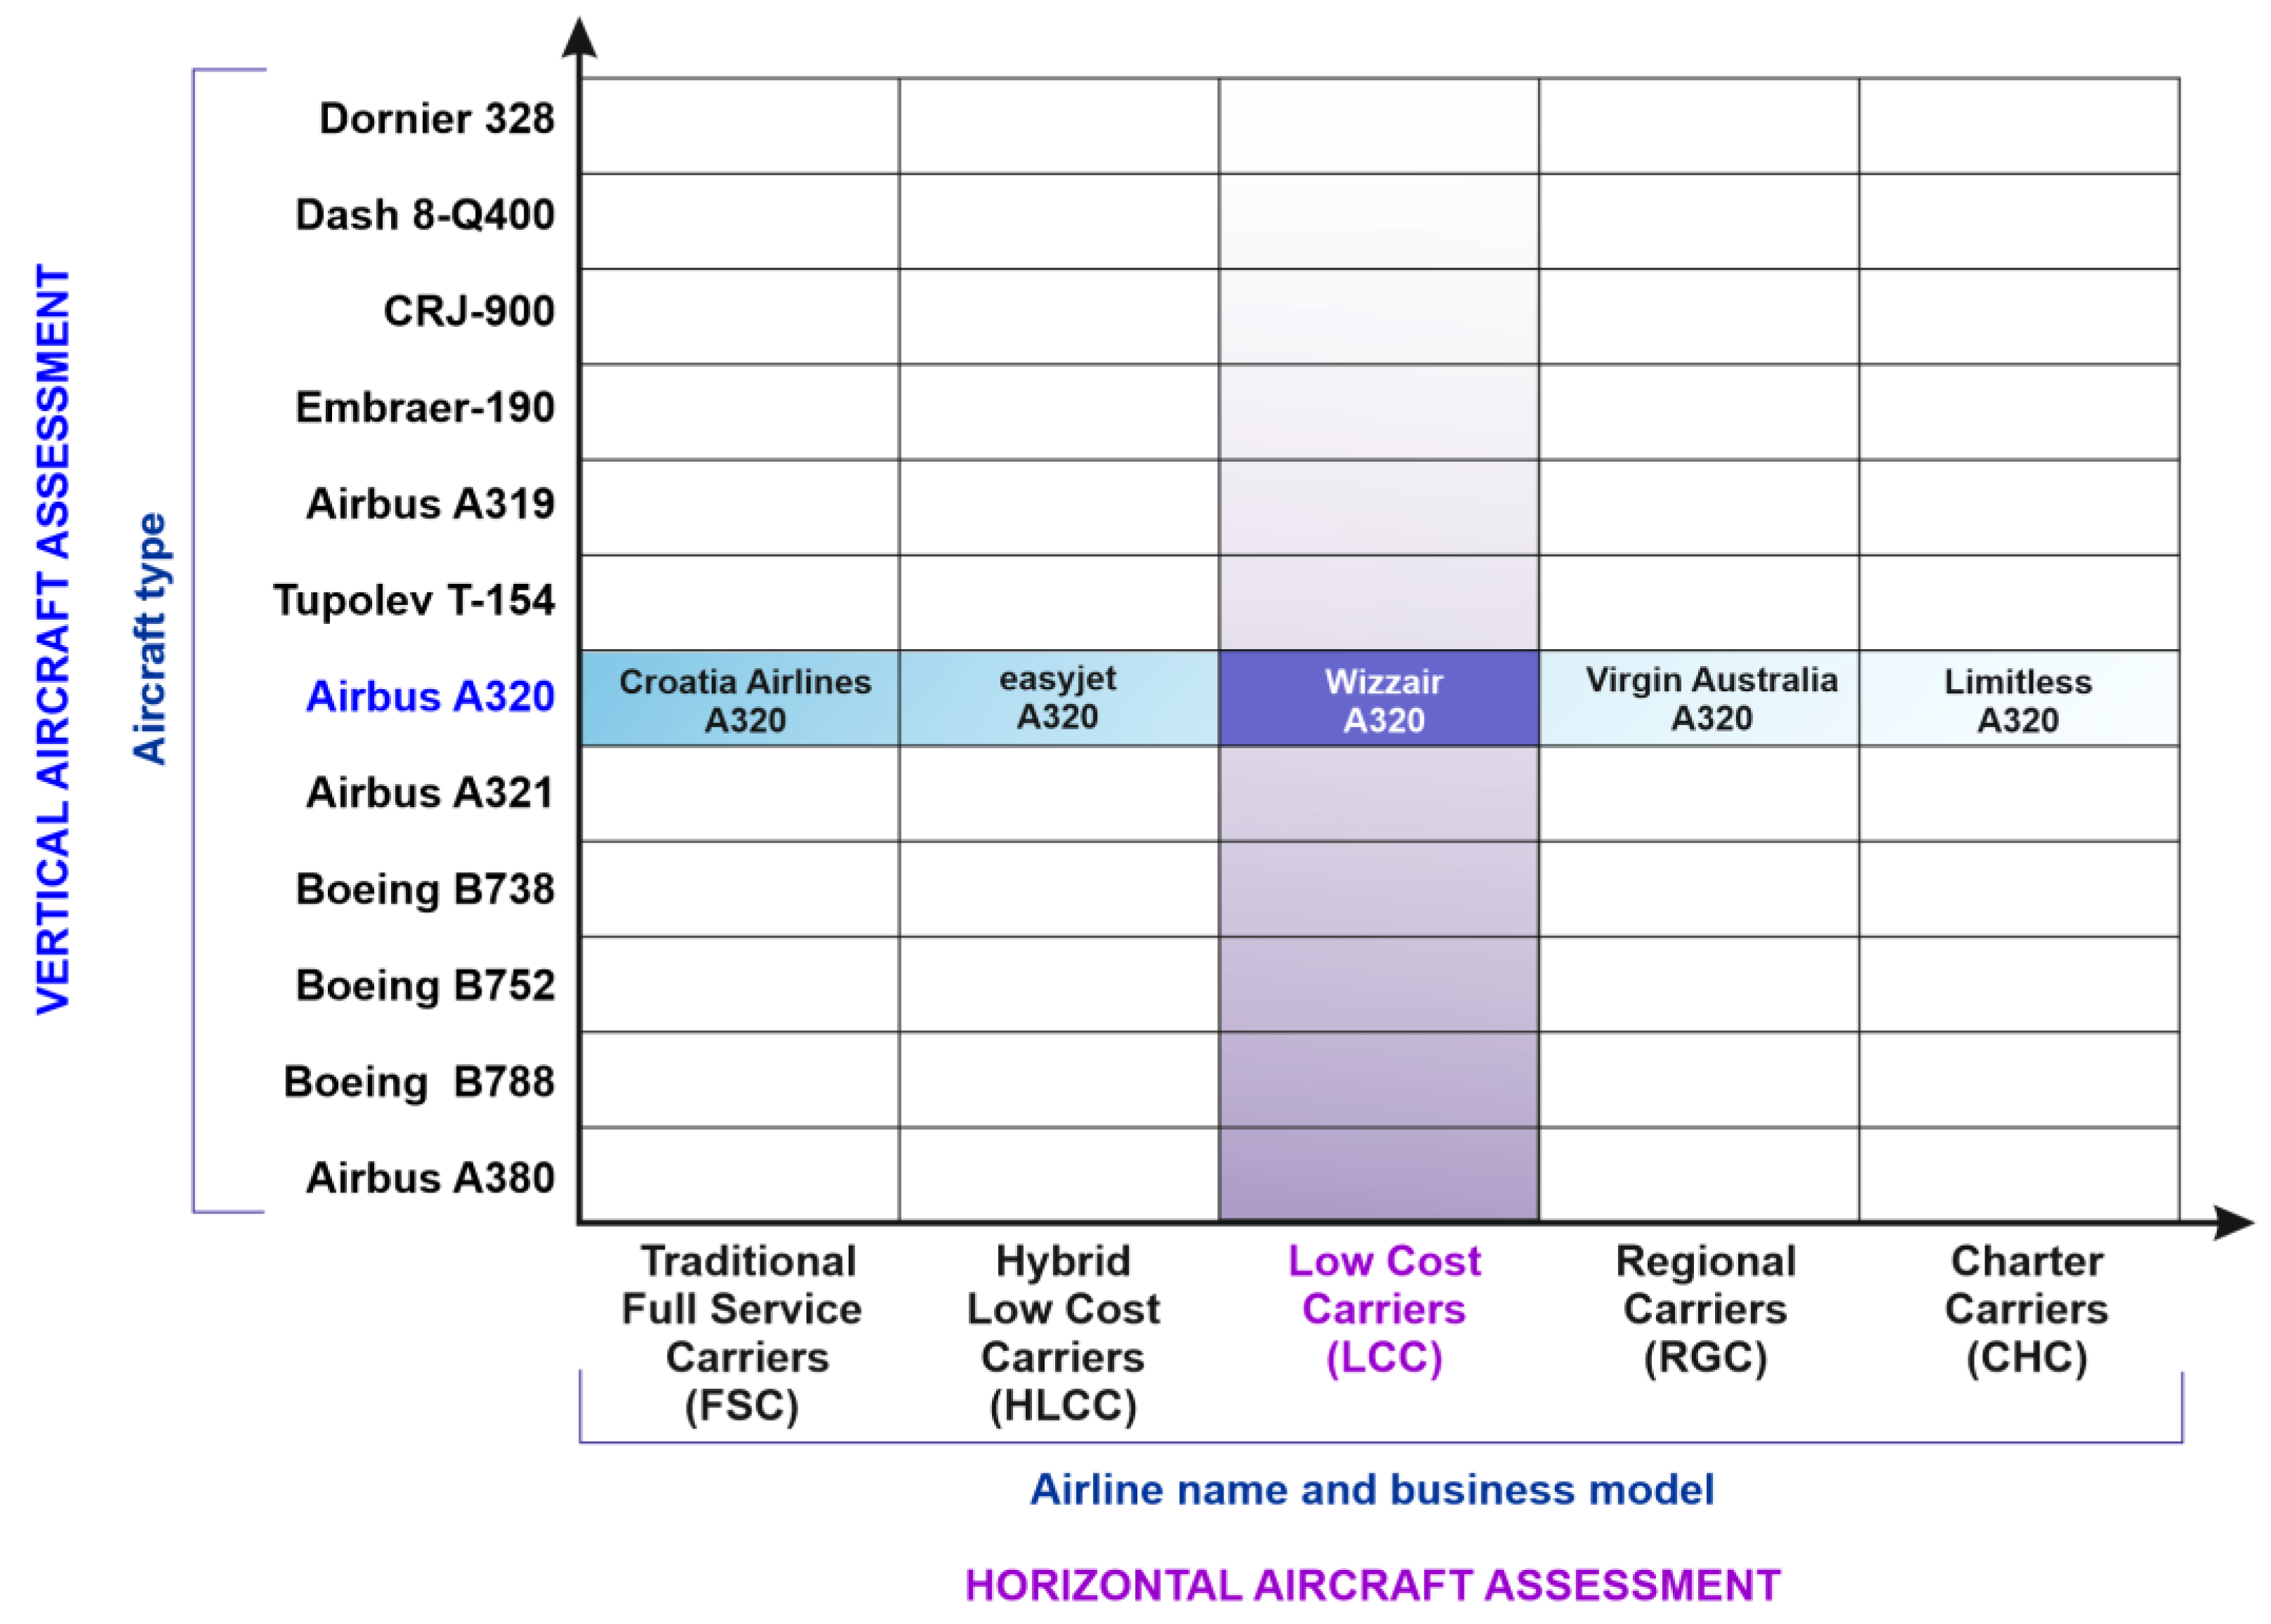
The method of aircraft selection is done through vertical and horizontal assessment of the specificity of the airlines’ business model and the type of aircraft in their fleet.
Vertical assessment refers to verifying the introduction of a particular type of aircraft according to predefined criteria in accordance with the availability of airport infrastructure and ground handling equipment capacity. In the process of vertical assessment, the model analyses fixed criteria and all the parameters must be met, which means there is no interference with the introduction of a particular type of aircraft under regulatory framework, airport infrastructure, or ground handling equipment. After performing the vertical assessment, the model performs the next level, which is the horizontal assessment.
The horizontal assessment includes variable criteria and relates to the selection of an airline business model, which depends on weight factors.
Figure 3 shows the relationship between vertical and horizontal assessment.
- Vertical assessment (fixed criteria) analyses the criteria, which must be fully met without exceptions. This means that all logic functions within the model have to produce a positive answer (in this model – “OK”/”YES”). If just one of the answers turns out negative (“NEG”/”NO”), this is an indication that introduction of a new airline with a new aircraft type could result in the disturbance of existing traffic mainly in the ground-handling segment. The main categories that are observed and analysed within the ”vertical assessment” and the requirements that need to be fulfilled are described below.
- Regulatory framework: the airline has to satisfy the two most important criteria in the model. The first one is that the airline cannot be on the European Union’s “blacklist” and the second is that the aircraft has to have noise levels defined by Section 3 or higher according to ICAO Annex 16.
- Runway/apron–the aircraft’s specifications have to satisfy all the airport’s criteria defined in the model relating to the runway and the apron. The model analyses if the runway is adequate for take–off and landing and if the parking position is ensured without disturbing current traffic. If the aircraft type cannot satisfy the pre-defined criteria, the model automatically excludes it and asks for a new aircraft type to be defined.
- Passenger terminal–introduction of a new aircraft will generate an additional number of new passengers. The role of this segment is to examine the current capacities of the passenger terminal through traffic flows.
- Ground-handling equipment–a new aircraft will cause additional burden of the ground-handling equipment usability. This segment analyses the usability of the ground-handling equipment during the day and examines if there is adequate equipment available after the new aircraft lands to provide ground-handling services in the analysed hour.
Table 3 lists the questions used for the vertical assessment and replies that are validated through the model when introducing a new aircraft.
- 2.
- Horizontal assessment (variable criteria) is based on multi-criteria analysis and assessment of different segments/indicators based on the “weight factors.” The assessment is mainly based on Key Performance Indicators (KPIs). The most commonly used KPI’s are assessed – the ones used for evaluating airports and airlines, which are recognized by internationally renowned consultancy houses [17,18,19,20]. In order to validate the correctness of identified criteria, the authors consulted aviation experts working for “AI-MS Aviation Infrastructure Management Systems GmbH“ and “International Air Transport Association (IATA).“ The definition and the correctness of the KPIs and assigned “weight factors” have been validated and approved by the previously mentioned experts. It is important to emphasize that the definition of the criteria and the ”weight factors” are defined from the perspective of airport operations and not from the airline’s perspective. The main categories were evaluated based on their significance for the airport and were assigned different “weigh factors” in percentages (maximum of 100 percent). The subcategories were assigned marks 1 to 5 with 5 being the best rating and 1 being the lowest. The main categories with the assigned questions are presented in Table 4. The result of the horizontal assessment is based on the following calculation: each segment is assigned a rating based on the sum of individual ratings on business specificities of each airline, financial indicators, quality of service, and operational requirements.
2.4. Results Overview (Output)
The third phase describes the analysis of the results. The model has to clearly present the results and check if all the requirements of the vertical assessment are met. If only one requirement/question is not met with a positive answer (Figure 4–scenarios 2 and 3), then the airline and the aircraft are rejected and the airport management received a recommendation to look for an alternative solution. If all the criteria of the vertical assessment are fulfilled (Figure 4–scenario 1), the assessment is continued at the next level, horizontal validation, which presents a commercial framework made from numerous variable criteria.
In the case study presented in Figure 4, verifications of A319, B788, and A380 aircrafts are presented. The results show it is possible to introduce the A319 aircraft in the specified period of time since it achieves all “green indications” and, at the same time, does not generate congestion of current capacities or additional delay. In addition, Figure 4 presents detailed results of a vertical assessment for all three aircrafts among which only the A319 aircraft does not have any restrictions in either the infrastructure or operational segment.
3. Results
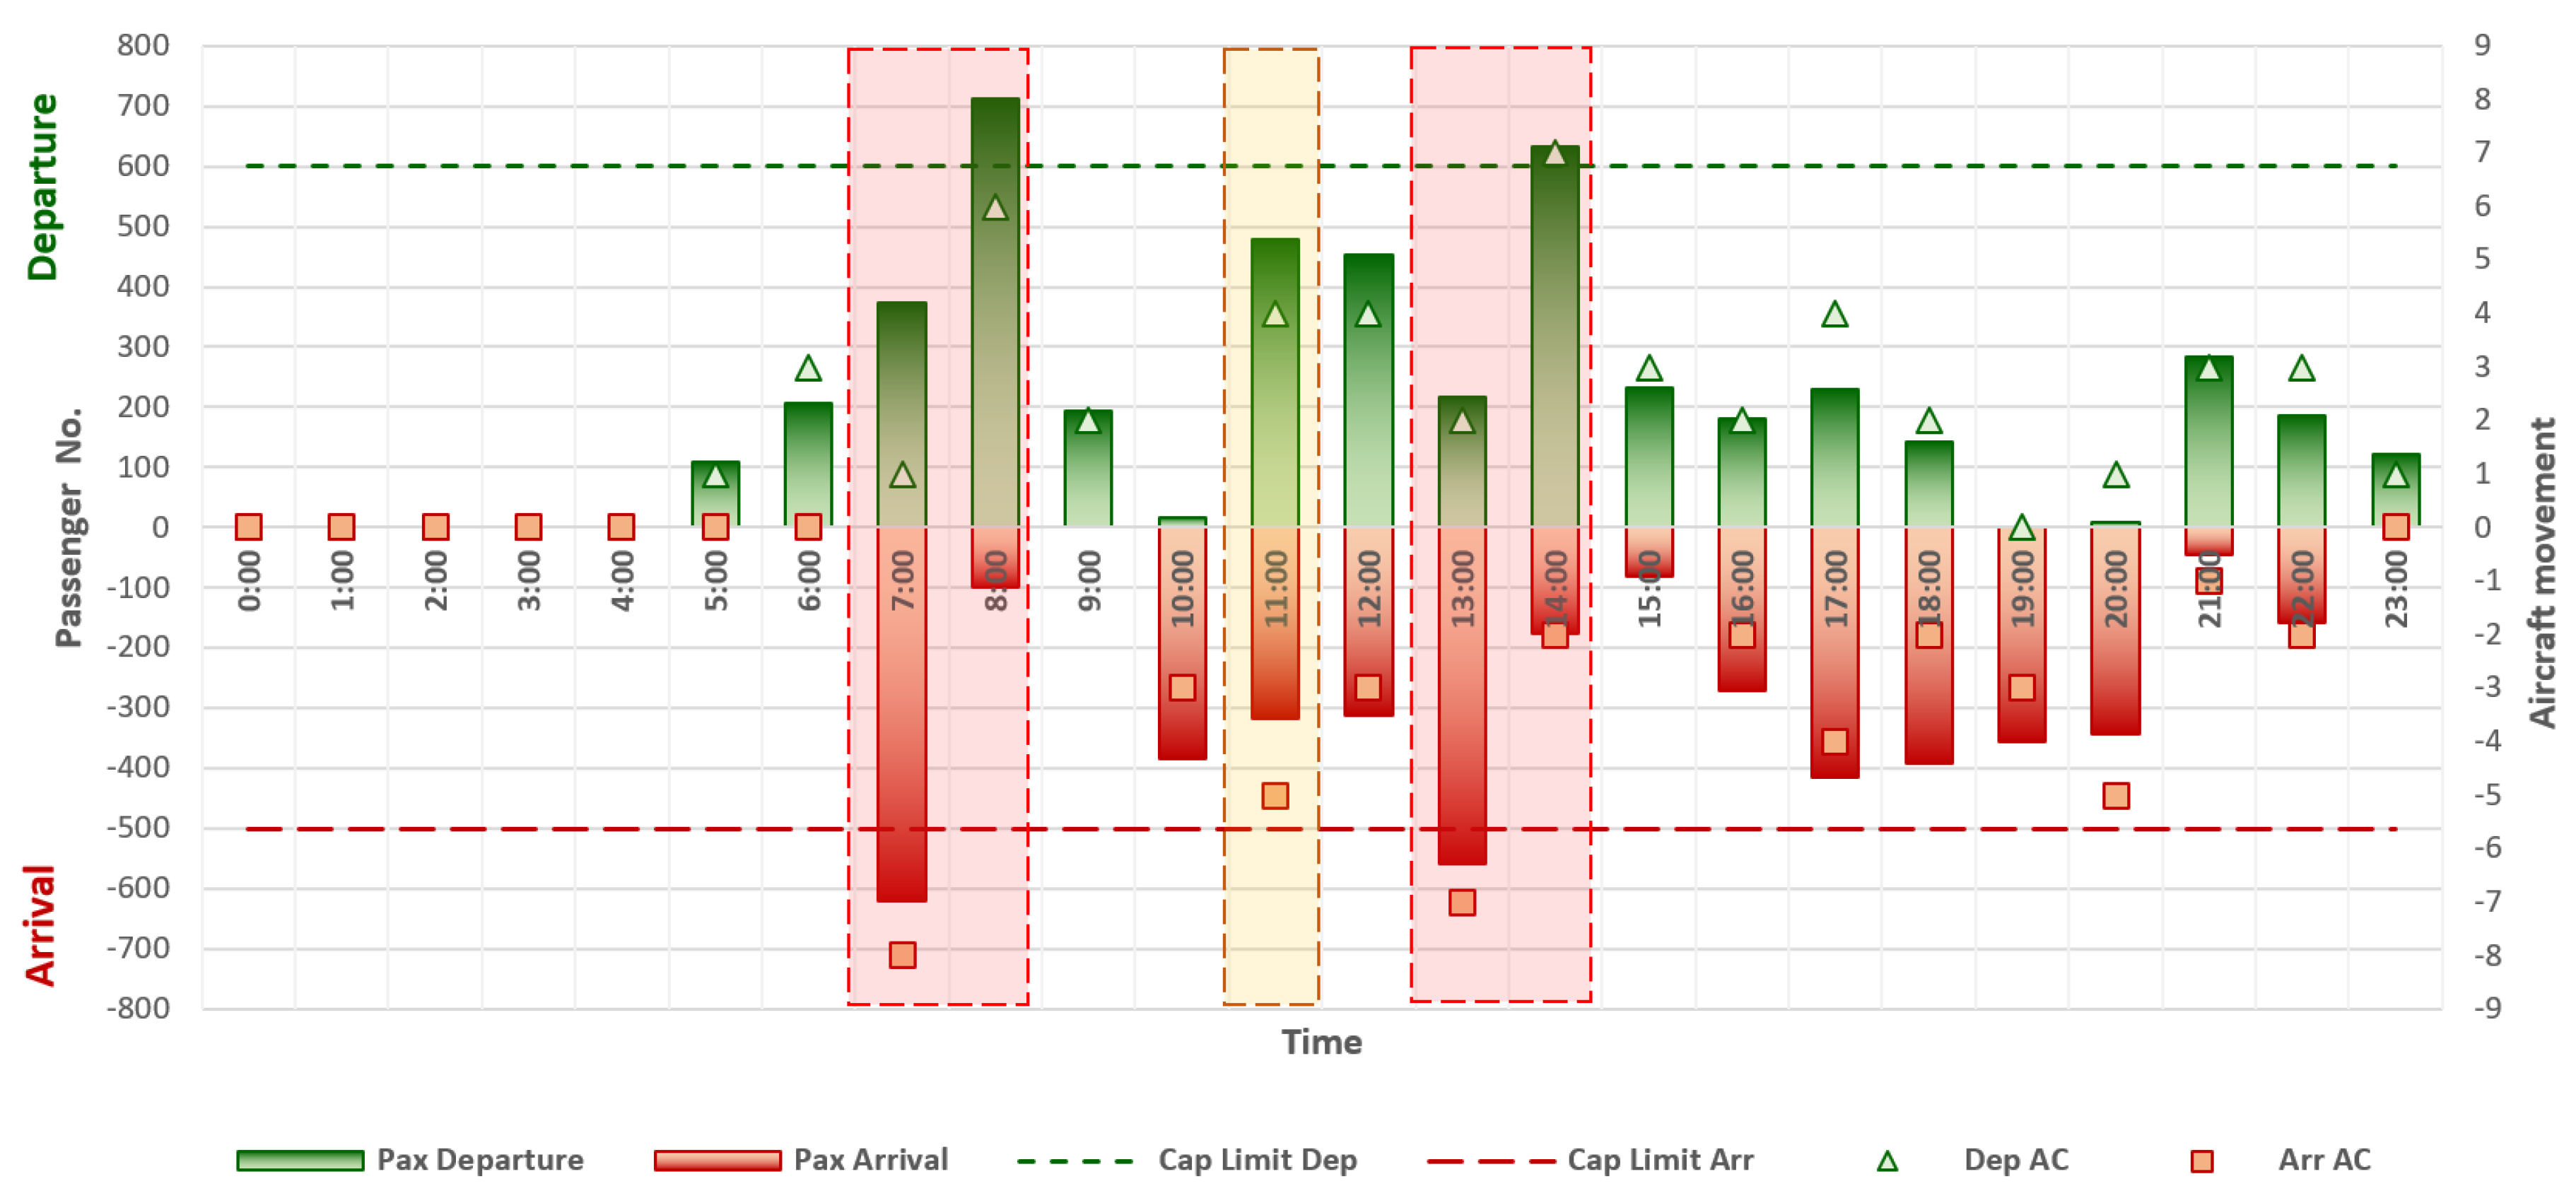
The model was verified in the case study of Zagreb Airport during a typical busy day in 2017. The same methodology can be applied on any day and time during the year. The traffic structure of arrivals and departures during a typical busy day is presented in Figure 5. Two traffic peaks are visible: the morning peak between 7.00 a.m. and 9.00 a.m. and the afternoon peak between 1.00 p.m. and 3.00 p.m., during which infrastructure and operational capacity utilization is at its maximum (marked red in Figure 5). In order to identify the first free hour, the application examined the period of the entire busy day and identified the period between 11.00 a.m. and 11.59 a.m. (marked yellow). Due to the fact that the airport almost reached its maximum capacities in that exact hour (in terms of the number of passengers and aircraft cabin capacities), it was important to determine the type of aircraft and airline’s business model, which could be introduced without causing disruptions and delays in current traffic.
In order to verify the model and determine more precise and realistic conditions specific to the Zagreb Airport, the aircraft fleet that operates there daily constituted the majority of analysed aircraft. In addition, several aircrafts were inserted into the model with the aim of deliberately identifying non-compliance. For this purpose, Tupolev Tu-154 (elimination based on noise levels) and Airbus A380 (elimination based on dimension and Ground Handling Equipment) were used. Even though A380 can actually land at Zagreb Airport, it was assumed it could not, in order to test the AMSS’s elimination segments. The following types of aircraft were assessed in the model: D328, CRJ7, Dash 8-Q400, CRJ-900, E-190, A319, T-154, A320, A321, B738, B752, B788, and A380.
3.1. Results of the Vertical Assessment–The Case Study of Zagreb Airport
Input parameters for the vertical assessment related to aircraft dimensions, cabin capacity, ground handling equipment, and ecological specificities. Until now, airport management negotiated with airlines based on experience alone, without analysing infrastructure and operational constraints, especially in the area of apron and terminal capacity, or ground handling equipment availability. The right approach should be to analyse the airport infrastructure and equipment availability for every aircraft type and determine possible constraints for their introduction. Following this, negotiations with airlines may begin. Results of the vertical assessment for Zagreb Airport are presented in Figure 6.
The red squares in Figure 6 represent constraints in one of the four segments (regulatory framework, infrastructure runway and apron, passenger terminal, and ground handling equipment). The AMMS suggests to management that the new (proposed) aircraft should not be accepted at the selected time if its introduction affects the airport’s infrastructure or operational constraints and causes delay in the existing traffic. The yellow squares suggest there is an option to accept and dispatch the aircraft but only for certain airline business models in accordance with their specific use of airport infrastructure and equipment. The grey squares suggest there are no restrictions on the introduction of the new aircraft. The assessment of the restrictions on the introduction of a new aircraft was performed for each of the 13 proposed aircrafts for 24 h of a typical busy day (312 total tests).
3.2. Horizontal Assessment According to the Airlines Business Models–The Case Study of Zagreb Airport
After performing the vertical assessment and selecting the preferred type of aircraft, or a group of similar aircraft, the second level of analysis is performed - horizontal assessment. The horizontal assessment identifies the preferred aircraft type among several similar aircraft (e.g., A319, A320, B737–800, B737–900) and the preferred airline with a specific business model operating the aircraft.
The main criteria for the horizontal assessment are related to the specificity of the airline’s business models, their strategies in doing business with airports, and the quality of service they provide. The verification of horizontal assessment was conducted at Zagreb Airport during a typical business day between 11.00 a.m. and 11.59 a.m.
When the selected aircraft types and their operators are input, the AMSS retrieves specific information from the database for each airline, conducts a multi-criteria analysis, considers the “weight factors” explained in the previous section, and shows side-by-side comparison of the overall results for each aircraft and its operator.
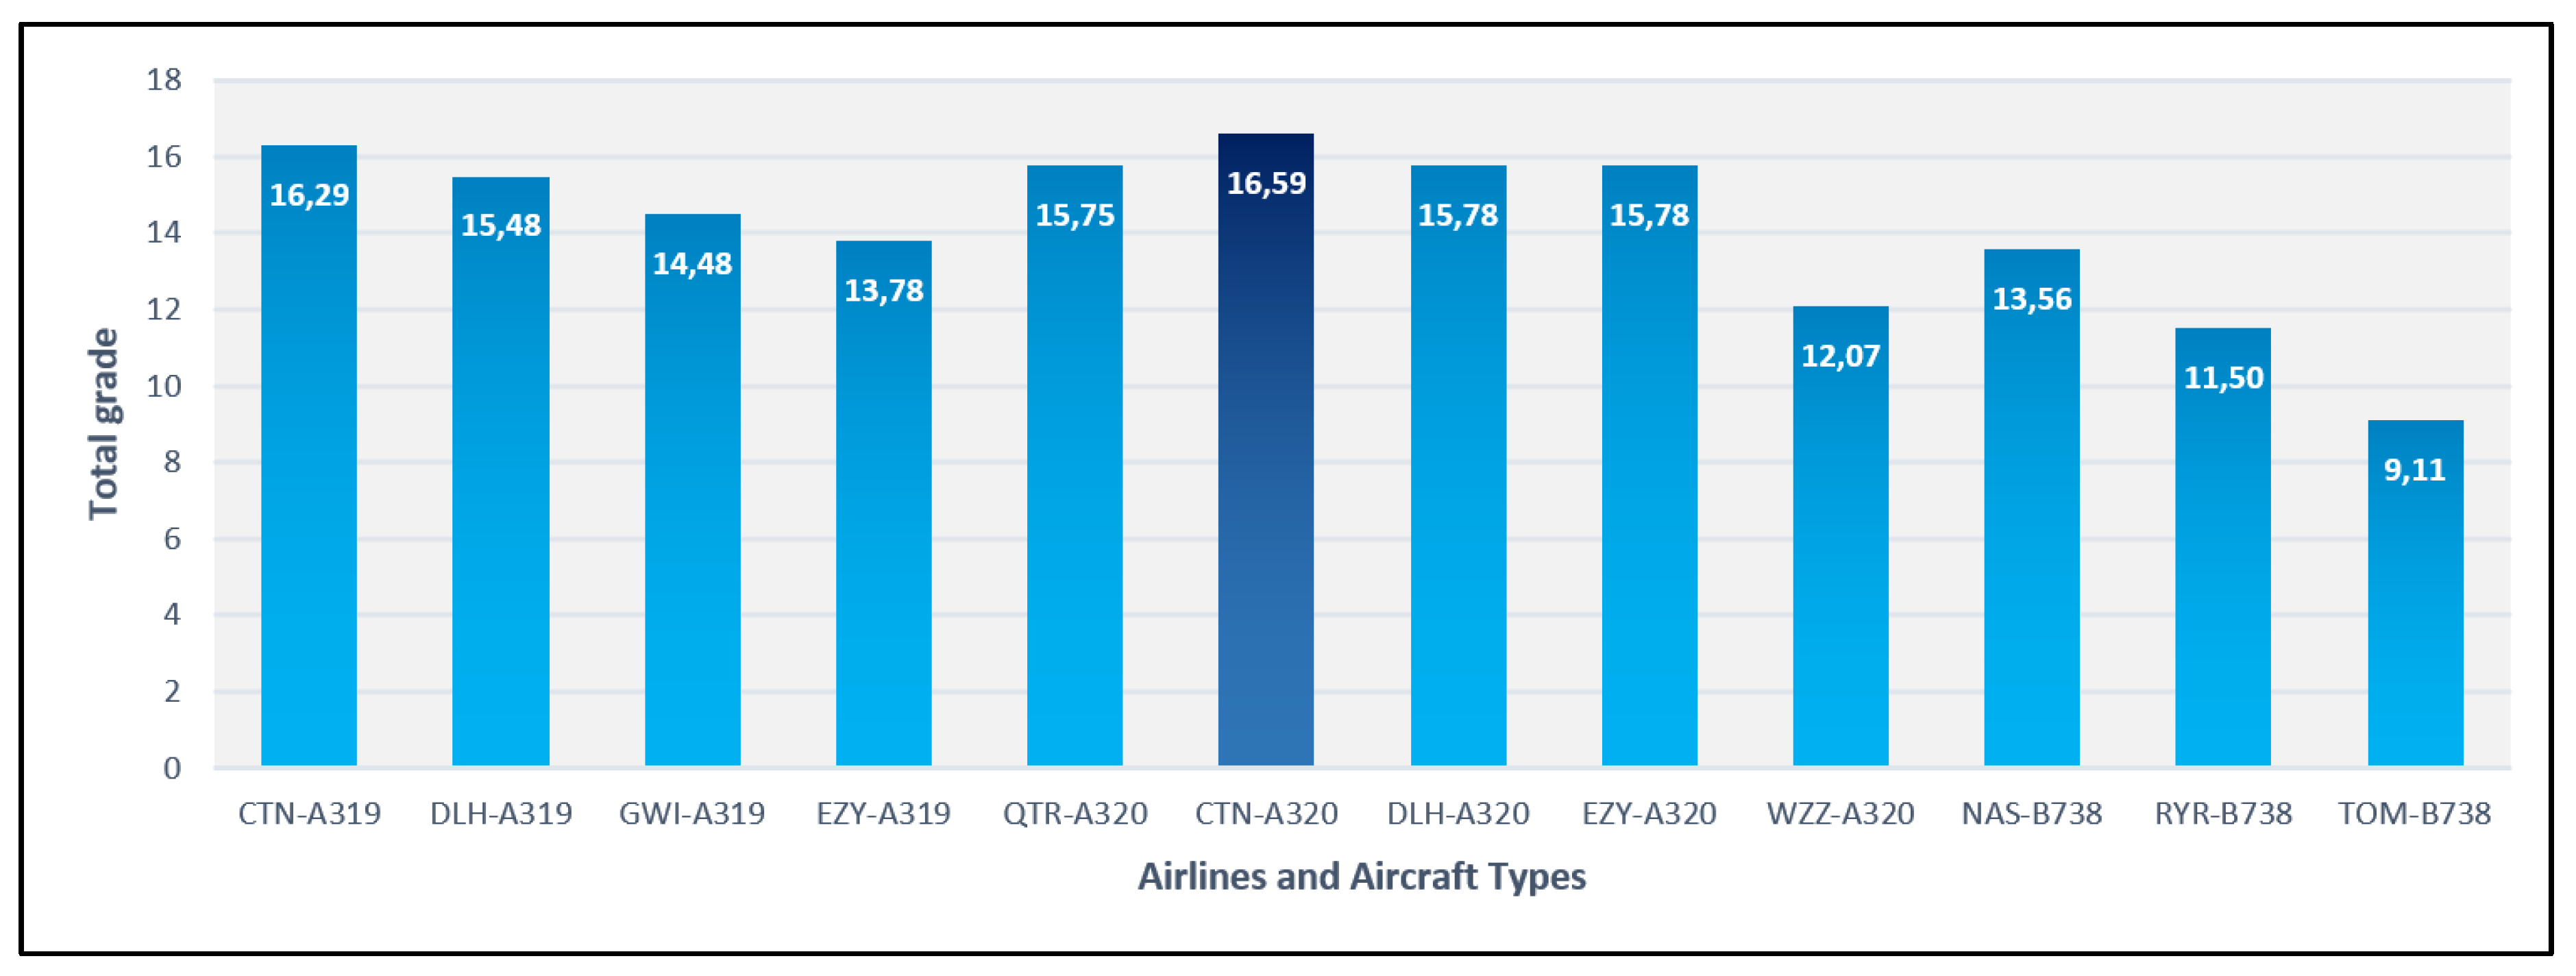
Figure 7 shows the results of the multi-criteria analysis of 12 aircraft where Croatia Airlines A320 aircraft received the highest rating of 16.59, which was followed by Croatia Airlines A319 aircraft with a rating of 16.29. Since Zagreb Airport is the base airport of the national airline Croatia Airlines, this segment certainly influenced such high ratings. Furthermore, Figure 7 shows that the two network airlines, Lufthansa and Qatar Airways, and one low cost airline, easyJet A320 aircraft, which fit in with the airport’s strategy, follow the first two Croatia Airlines aircraft. Based on the ratings shown for each aircraft, the airport management would introduce any aircraft for the selected period from 11:00 to 11:59 without further analyses. This means they would not consider whether the introduction of any of the previously mentioned aircraft, solely on the specificity of the airline’s business model, could influence the smooth flow of existing traffic.
Following the vertical and horizontal assessment, the correlation of results, and considering all the limitations, the final results of acceptance or rejection of the proposed airlines and their aircraft during the period in question were identified (Figure 8). The results obtained through the AMSS indicate that, although these 12 aircraft are very similar, the introduction of any of them could cause delays in the existing traffic. Delays would be caused by the lack of airport infrastructure capacity or the ground handling equipment availability needed by certain airlines’ business models. For example, problems may arise from the high occupancy rate on low-cost flights and insufficient capacity of the passenger terminal, or from adequate equipment not being provided for handling network airlines’ aircraft.
Figure 8 shows that nine out of 12 aircrafts are marked red, which means that following the horizontal and vertical assessment for the specific hour (from 11.00 a.m. to 11.59 a.m.), the introduction of any of these aircrafts would result in additional traffic disruptions due to insufficient infrastructure capacity or availability of ground handling equipment. The remaining three aircrafts, deemed acceptable by the AMSS for meeting all the criteria, can be considered for scheduling between 11.00 a.m. and 11.59 a.m.. They are Croatia Airlines A319 (rating 16.29), Qatar Airways A320 (rating 15.75), and Lufthansa A319 (rating 15.48).
After determining the order of airlines or aircrafts to be included in the flight schedule, it is necessary to consider both the aeronautical and non-aeronautical revenues that the airport will generate from the new aircraft. In this case, according to the AMSS calculation, the total aeronautical and non-aeronautical fees received from Croatia Airlines A319 would be EUR 2,639.48 from Qatar Airways A320 EUR 2,935.97 and from Lufthansa A319 EUR 2,772.09.
The airport revenue analysis reveals that Qatar Airways, which came second in the overall rating, generates the highest revenue. After narrowing down the choice, it is up to the airport management to decide which airline to introduce into the flight schedule.
Since the goal of Zagreb Airport is to position itself as the regional hub with increasing share of transfer and transit traffic, the introduction of the new Croatia Airlines A319 flight is considered the best option partly because it is the national airline. By introducing this additional aircraft in the flight schedule, the network of destinations from Zagreb will expand and additional transfer possibilities via Zagreb Airport, especially toward European airports, will be realized.
4. Discussion
As previously mentioned, the case study of Zagreb Airport was conducted for the purpose of testing the AMSS model’s functionality and writing this paper. Experience shows that initial contacts between Zagreb Airport representatives and airline representatives were most often made at the specialized international “Routes Conference.” Additional bilateral meetings were held with potential airlines in order to present the region’s potential and airport infrastructure as well as discuss potential flight schedules and framework of commercial conditions. If both parties agreed on the conditions, the procedure was continued by signing the SGHA and SLA contracts, which was followed by the first flights. If the procedure was successfully completed from the aspect of the negotiating team, and, if a new flight or a new airline was brought to Zagreb Airport, the negotiating team considers it a job well done.
A problem may arise if the negotiating team causes operational damage to the airport because they were not informed about the limitations of the airport infrastructure capacity, GH equipment, and personnel. If the preparation is not done well and in coordination with the Traffic Department is insufficient, then the first invisible problem may appear relating to the issue of whether the airport has sufficient infrastructure or operational capacity to accept and handle the additional aircraft on the days and times proposed by the airline.
Due to the fact that the SLA contract also includes penalty clauses, if any of the agreed activities required by the airline are not performed by the airport, these clauses may be activated to compensate for the loss suffered by the airline. Few such activations will not significantly affect the airport’s budget, but if the exact arrival and departure of the aircraft is specified and the airport performs poorly on several occasions, it will cast a negative image on the airport, which can lead to the termination of the contract between the airline and the airport.
As one method of validating the functionality of the AMSS application, interviews were conducted with the airport negotiation team. They were provided with information about the aircrafts that were input into the scenario and asked if they would accept them at the Zagreb Airport in the specific schedule requested by the airlines.
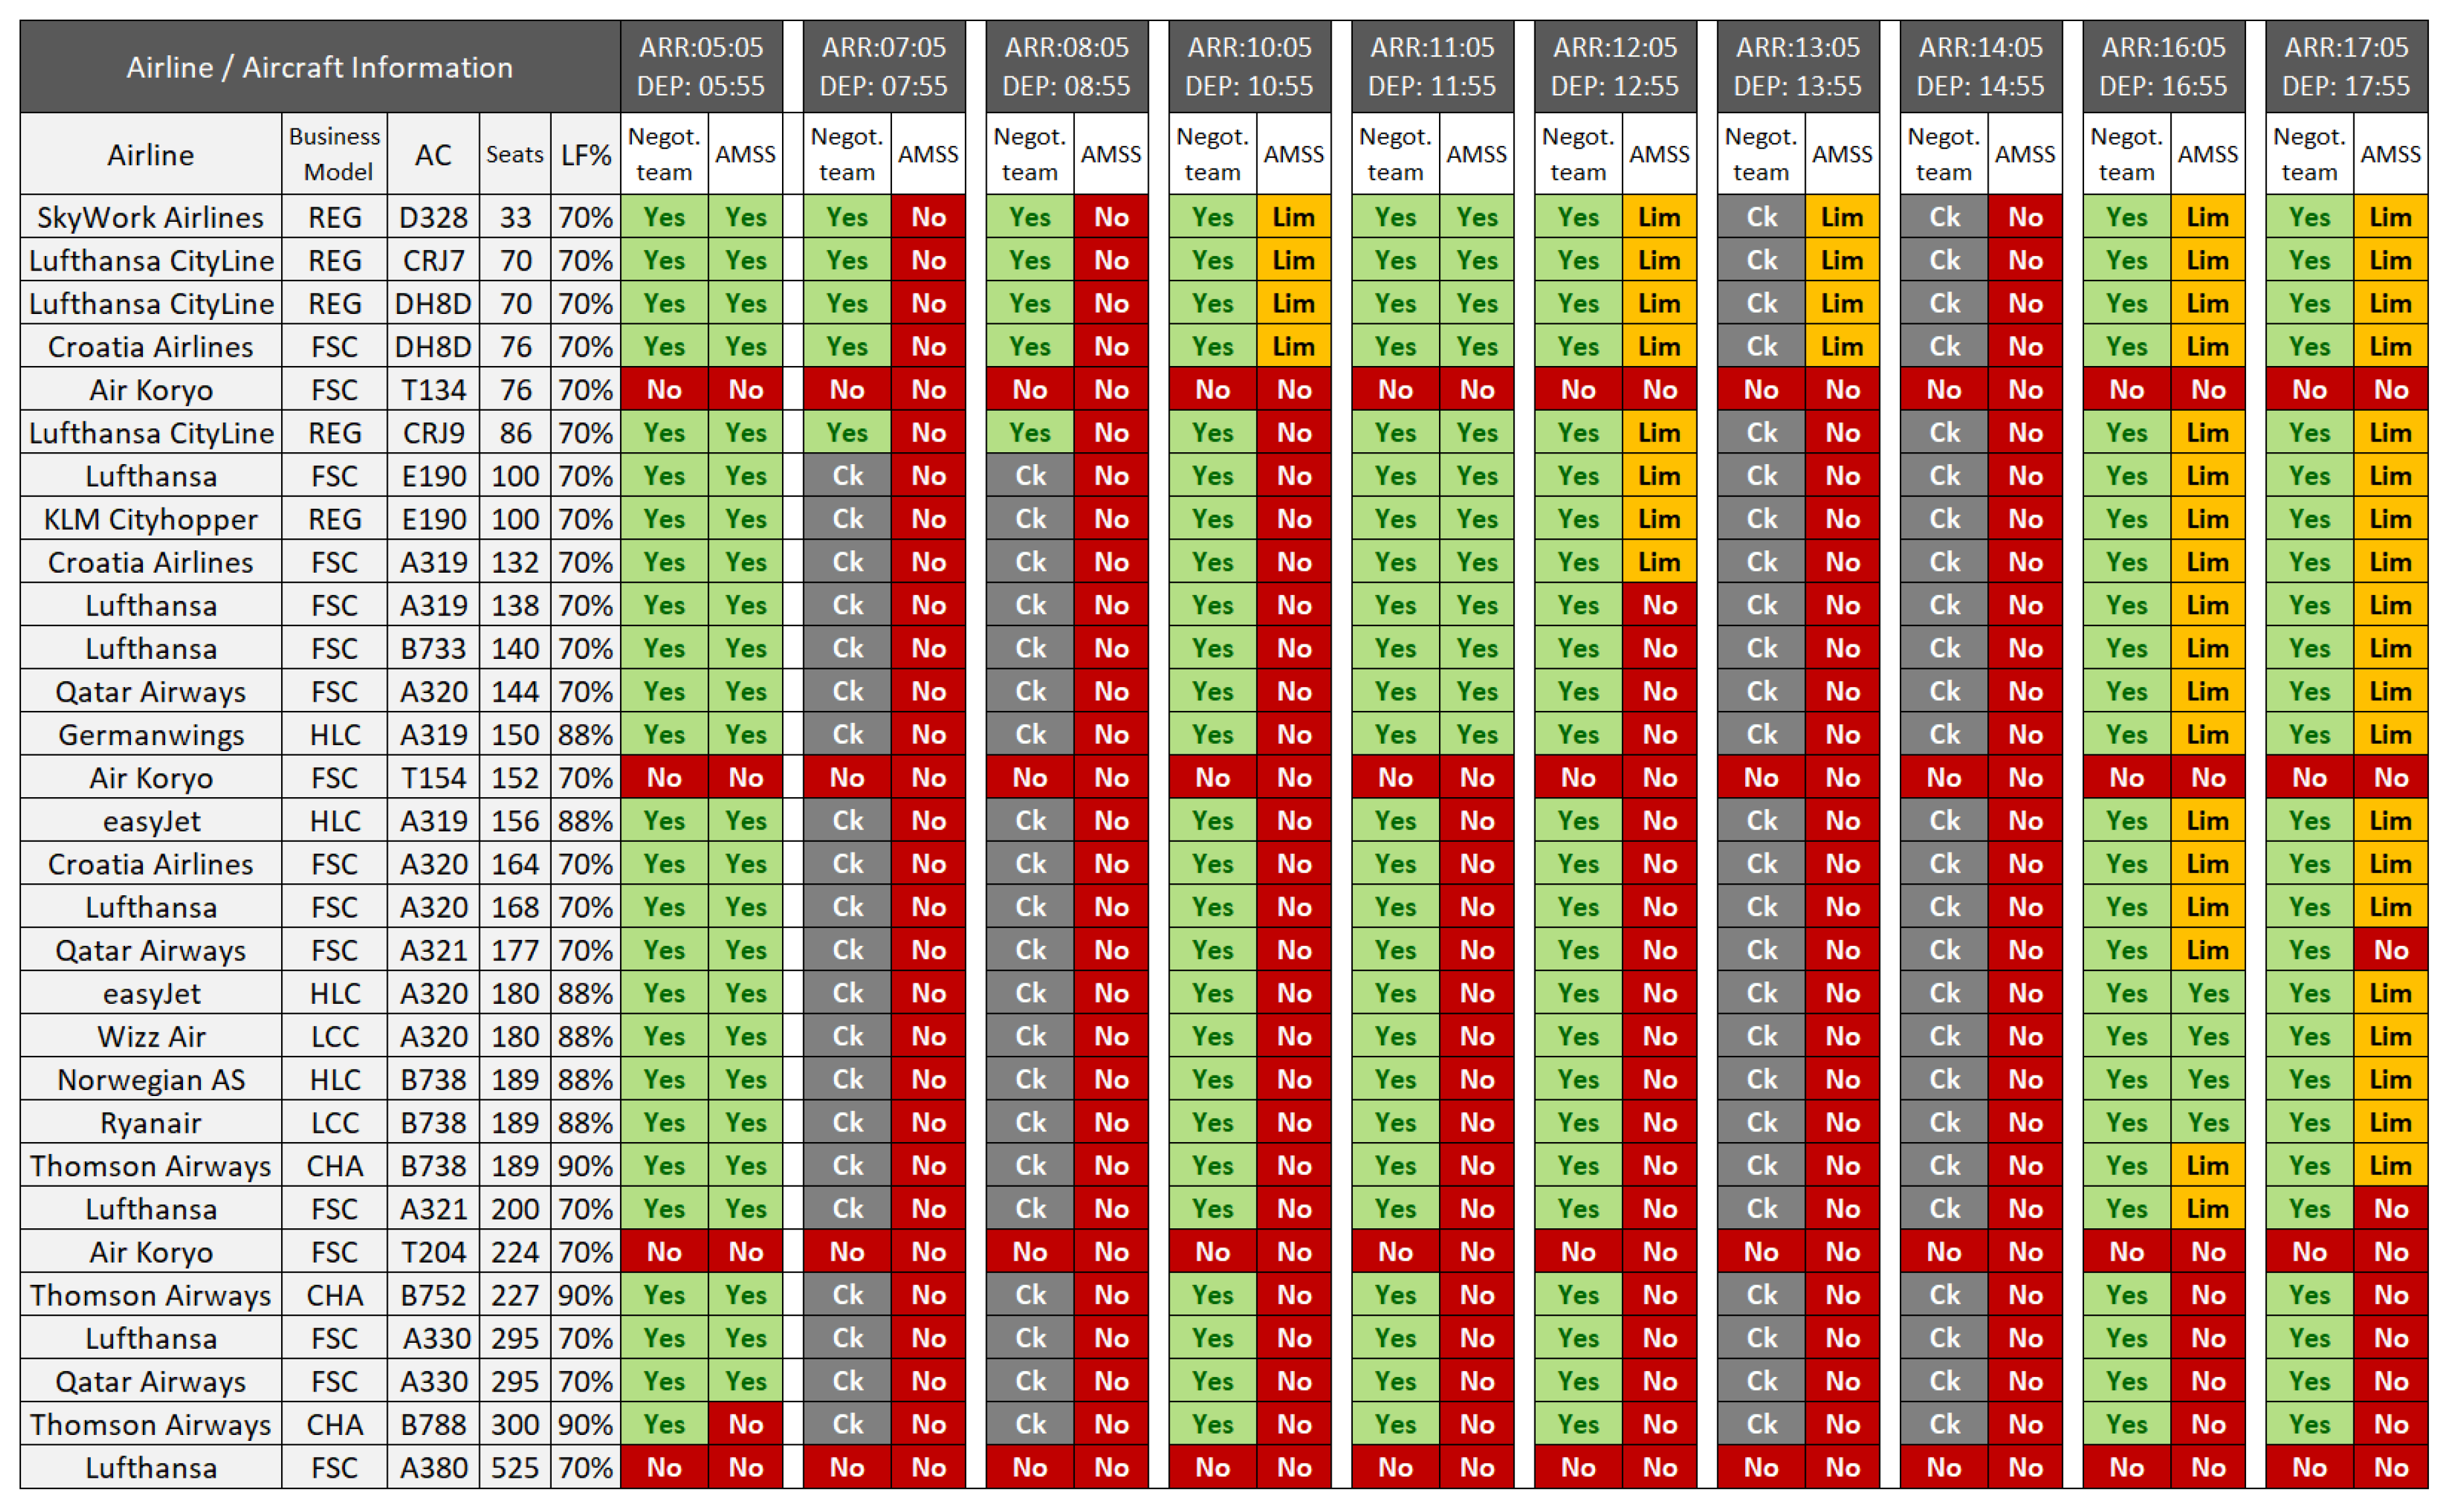
The results of the comparative analysis of the negotiation team’s responses and the results obtained by the AMSS application are shown in Figure 9.
During 24 h of a typical day, the following hours critical to the infrastructure and equipment were analysed 05:00–05:59/07:00–07:59/08:00–08:59/10:00–10:59/11:00–11:59/12:00–12:59/13:00– 13:59/14:00–14:59/16:00–16:59 and 17:00–17:59.
The first column for each hour, in Figure 9, represents the responses of the negotiating team and the second column represents the responses of the AMSS system based on the vertical and horizontal assessment of the specificity of the airline business model and the requirements of each aircraft separately. The available answers were: “Yes” if the aircraft is accepted, “Ck” if additional verification is required, “No” if the aircraft is not accepted, or “Lim” when it is possible to approve the aircraft if it uses a low-cost business model (e.g., no catering, business passengers, etc.).
Figure 9 shows that the negotiating team answered with caution, i.e., they said they will check the possibility of the aircraft’s entry and its impact on existing traffic. The answers marked “No” were primarily obtained for the Tu-134, Tu-154, Tu-204, and A380 aircraft. For the Tu-134, Tu-154, and Tu-204 aircraft, the negotiating team recognized they are in the ICAO Noise Level Chapter 2, which means that such aircrafts are banned from landing in EU countries (including Croatia). In addition, the answer "No" was given for the landing of the A380 aircraft due to possible infrastructure and operational constraints. In all other cells where the answer was “Yes,” the negotiating team would approve the landing of the aircraft in question and proceed with commercial terms negotiations.
After analysing the answers obtained from the interview with the airport negotiating team and the results obtained through the AMSS application, it can be concluded that there are significant differences between the number of aircrafts the negotiating team would add at a specified hour and the number the AMSS application proposed. The application shows there are large limitations in most of the proposed time intervals and aircrafts should not be added in order not to significantly disrupt the current traffic. This certainly proves the precision of the AMSS system in relation to the decisions of the negotiating team. Furthermore, it demonstrates that, with an application such as the AMSS, a negotiating team can make accurate, timely, quality decisions about the airline in negotiations in order to avoid disruption to existing traffic caused by the entry of a new aircraft into the current flight schedule.
The disadvantage in the negotiations that is visible as the result of this research relates to the fact that the negotiating team did not have information on the actual capacity utilization and the exact operation congestion times nor the proposals for which hours to consider and how the introduction of a new aircraft affects existing traffic. They had prepared basic traffic parameters related to destination coverage as well as basic information about the airport infrastructure and its equipment. However, such simplified analyses may lead to disruptions of the infrastructure and operational functionality of the airport when new flights are introduced.
The limitation of the research relates to the unavailability of parts of the data regarding airlines’ operations due to its confidential nature. Such data primarily consists of certain internal indicator values used by airlines in monitoring the stability and profitability of routes. In addition, information about obtaining commercial discounts in the negotiations between the airport and the airlines were restricted for publication. Lastly, certain airlines and airports answered "confidential" to questions related to the negotiations and route development strategy in the questionnaire.
Recommendations for future research on this topic are given below, as this has not been fully analysed in this paper.
- Applying the model and the AMSS application to the overall Total Airport Management System
- Using the applied model to expand the research of cargo terminal optimization according to the specificities of the airlines
- Investigating the impact of optimization of airline business models on airport capacity with a focus on tourism development
- Developing airport risk management models for sudden abandonment or bankruptcy of dominant airlines
- A more detailed research of the key performance indicators and their results on airline operations and stability
- Monitoring of KPI and airport business stability from the airlines’ perspective
5. Conclusions
Although the main focus of the aviation business today is profit, it is necessary to find the optimal balance between infrastructure and operational capacity requirements that the airport can provide. When the airport management introduces new flights, it is important that the airport has all the available facilities and operational capacities for adding them to the existing flight schedule in such a way that its new operations will not affect and jeopardize the punctuality of the existing traffic.
Currently, due to strong competition, most airports are focused on attracting airlines without examining the availability of their capacities in which a lack is noticed only after the contract has been signed and the first flights become operational. After this point, there is a potential risk that many delays will occur due to the lack of capacity and the passenger Level of Service will not be adequate, which can influence the airport brand.
With the new model and the application Airport Management Strategy Software (AMSS) described in this paper, it is now possible to optimize the airport infrastructure capacity and operations by maintaining the adequate level of service and conducting airport business without causing any delays.
This model uses vertical and horizontal validation by calculating a large number of parameters and KPI’s with the aim of determining which airline is appropriate for entering into the free airport slots, according to its business model and aircraft type.
The case study presented in this paper has proved that using the described new model and the AMSS application enables the airport management to have more accurate data and reports when negotiating with the airlines than their own negotiation team can provide based only on simplified analyses and experiences.
The aim of this approach is to precisely determine the potential free capacity of an airport infrastructure and operations, the aircraft that can be added in order to increase and maximize the efficiency of the airport, and to choose the exact airline business model, which is appropriate for a given period and in line with the airport strategy. With this approach, the collapse of the available capacity of the airport can be avoided and the possibility of defining the most appropriate aircrafts and airline business models is increased.
Author Contributions
Conceptualisation, I.Š. and A.V. Methodology, I.Š. and A.V. Software, I.Š. Validation, I.Š., A.V., T.M., and M.D. Formal analysis, I.Š. Investigation, I.Š. and A.V. Resources, I.Š., A.V., T.M., and M.D. Data curation, I.Š. Writing—original draft preparation, I.Š., A.V., T.M., and M.D. Writing—review and editing, I.Š., A.V., T.M., and M.D. Visualisation, I.Š. Supervision, A.V. Project administration, I.Š. and A.V. All authors have read and agreed to the published version of the manuscript.
Funding
This research received no external funding.
Acknowledgments
No additional support or contribution was made in this paper except authors.
Conflicts of Interest
The authors declare no conflict of interest.
References
- Oprea, M. The Effects of Global Economic Crisis on the Air Transport of Passengers in Europe and in Romania. Geo. J. Tour. Geosites 2010, 5, 52–61. [Google Scholar]
- Rothengatter, W. Economic Crisis and Consequences for the Transport Sector, Transportation Research; Springer: New York, NY, USA, 2011; pp. 9–28. [Google Scholar]
- De la Fuente, L. Economic Crisis Stops Air Transport Growth; Eurostat: Luxembourg, 2009. [Google Scholar]
- Štimac, I.; Vince, D.; Vidović, A. Effect of Economic Crisis on the Changes of Low-Cost Carriers Business Models. In Proceedings of the 15th International Conference on Transport Science ICTS 2012, Portorož, Slovenia, May 2012. [Google Scholar]
- Deutsches Zentrum für Luft und Raumfahrt (DLR). Analyses of the European Air Transport Market, Air Transport and Airport Research; German Aerospace Center: Köln, Germany, 2008. [Google Scholar]
- European Parliament The impact of the Economic Crisis on the EU Air Transport Sector. Structural and Cohesion Policies, Transport and Tourism; European Parliament The impact of the Economic Crisis on the EU Air Transport Sector: Bruxelles, Belgium, 2009. [Google Scholar]
- Brass, J. Market Share of Low Fares Airlines in Europe; Final Report; European Low Fares Airline Association: Bruxelles, Belgium, 2011. [Google Scholar]
- Doganis, R. Flying off Course–The Economics of International Airlines, 3rd ed.; Routledge: London, UK, 2002. [Google Scholar]
- García, T.A. Analysis of Global Airline Alliances as a Strategy for International Network Development; Massachusetts Institute of Technology: Cambridge, MA, USA, 2012. [Google Scholar]
- EUROCONTROL. U.S./Europe Comparison of Air Traffic Management-Related Operational Performance for 2017; EUROCONTROL: Brussels, Belgium, 2019. [Google Scholar]
- Ashford, N.; Stanton, H.; Moore, C.; Coutu, P.; Beasley, J. Airport Operations, 3rd ed.; McGraw-Hill Companies Inc.: New York, NY, USA, 2013. [Google Scholar]
- Doganis, R. The Airline Business, 2nd ed.; Routledge: London, UK, 2006. [Google Scholar]
- Bilotkach, V.; Gorodnichenko, Y.; Talavera, O. Are Airlines’ Price-setting Strategies Different? J. Air Transp. Manag. 2010, 16, 1–6. [Google Scholar] [CrossRef] [Green Version]
- Pearcea, B. The State of Air Transport Markets and the Airline Industry after the Great Recession. J. Air Transp. Manag. 2012, 21, 3–9. [Google Scholar] [CrossRef]
- Dobruszkes, F. An Analysis of European Low-Cost Airlines and their Networks. J. Transp. Geogr. 2006, 14, 249–264. [Google Scholar] [CrossRef]
- Malakis, S.; Psaros, P.; Kontogiannis, T.; Malaki, C. Classification of air traffic control scenarios using decision trees: Insights from a field study in terminal approach radar environment. Cogn Tech Work 2020, 22, 159–179. [Google Scholar] [CrossRef]
- Consultancy, J. Jacobs Consultancy Airport Performance Indicators 2015; Jacobs Consultancy: London, UK, 2010. [Google Scholar]
- Air Transport Research Society (ATRS). Airport Benchmarking Report 2013. In Global Standards for Airport Excellence; Air Transport Research Society (ATRS): Vancouver, BC, Canada, 2013. [Google Scholar]
- Marr, B. Key Performance Indicators–The 75 Measures Every Manager needs to Know; FT Publishing: Harlow, UK, 2012. [Google Scholar]
- Tatalović, M.; Mišetić, I.; Bajić, J. Menadžment Zrakoplovne Kompanije; Mate d.o.o.: Zagreb, Croatia, 2012. [Google Scholar]
Figure 1.
Available capacity to introduce a new aircraft during the observed day.

Figure 2.
A simplified scheme of the model levels in the AMSS application.

Figure 3.
A simplified horizontal and vertical model structure for determining the strategic guidelines of an airport when selecting airlines.
Figure 3.
A simplified horizontal and vertical model structure for determining the strategic guidelines of an airport when selecting airlines.

Figure 4.
Visualization of output solutions for vertical assessment of infrastructure and equipment availability from AMSS-Airport Management Strategy Software.
Figure 4.
Visualization of output solutions for vertical assessment of infrastructure and equipment availability from AMSS-Airport Management Strategy Software.

Figure 5.
Overview of the number of passengers and aircrafts throughout a typical busy day.

Figure 6.
Overview of the results of possibly introducing a new aircraft through a vertical assessment.
Figure 6.
Overview of the results of possibly introducing a new aircraft through a vertical assessment.

Figure 7.
Overview of the overall ratings results of the selected aircraft and airlines after conducting a horizontal assessment at Zagreb Airport in the period between 11:00 and 11:59.
Figure 7.
Overview of the overall ratings results of the selected aircraft and airlines after conducting a horizontal assessment at Zagreb Airport in the period between 11:00 and 11:59.

Figure 8.
Restrictions on airlines and aircraft not recommended for arrival in the period from 11:00 a.m. to 11:59 a.m. during a typical busy day due to the lack of airport infrastructure capacity and aircraft ground handling equipment.
Figure 8.
Restrictions on airlines and aircraft not recommended for arrival in the period from 11:00 a.m. to 11:59 a.m. during a typical busy day due to the lack of airport infrastructure capacity and aircraft ground handling equipment.

Figure 9.
Overview of comparing the response of the negotiating team and the AMSS application to aircraft acceptance at Zagreb Airport.
Figure 9.
Overview of comparing the response of the negotiating team and the AMSS application to aircraft acceptance at Zagreb Airport.


Table 1.
The parameters that need to be addressed when analysing an airport’s business and strategy.
Table 1.
The parameters that need to be addressed when analysing an airport’s business and strategy.
| Airport Traffic Database | Other Relevant Data from Airport Business |
|
|
| International Aviation Traffic Database | Airline and Airport Financial Reports |
|
|
| Legal Restrictions for Airlines Flying to the Republic of Croatia | Recommendation of International Governmental and Non-Governmental Organizations |
|
|
Table 2.
Airline business models and aircraft types for which the model has been verified.
| Airline Business Model | Airline | Aircraft Type |
|---|---|---|
| Full-Service Carrier/Airline (FSC) |
| DH8D, A319, A320, A321, B733, E190, A330, A380, T134, T154, T204 |
| Hybrid Low-Cost Carrier/Airline (HLCC) |
| A319, A320, B738, A319 |
| Low-Cost Carrier/Airline (LCC) |
| B738, A320 |
| Regional Carrier/Airline (REG) |
| DH8D, CRJ7, CRJ9, D328 |
| Charter Carrier/Airline (CHA) |
| B738, B752, B788 |
Table 3.
Vertical assessment questions (fixed criteria).
| Category | Question |
|---|---|
| Regulatory framework |
|
| Infrastructure framework (Runway/Apron) |
|
| Infrastructure framework (Passenger Terminal) |
|
| Infrastructure framework (Ground Handling Equipment) |
|
Table 4.
Horizontal validation parameters (variable criteria).
| Category | Questions for Determining Horizontal Estimation | WF (%) | ∑ mark |
|---|---|---|---|
| Business stability and financial risk of the airline |
| 10% | 35 |
| Airline operability |
| 2% | 15 |
| Airline quality level according to passengers |
| 5% | 5 |
| The quality level of the airline towards the airport |
| 40% | 30 |
| Airport profitabilityincome from airline |
| 30% | 10 |
| Airport strategy in relation to the airline business |
| 13% | 5 |
| Total | 100% | 100 | |
© 2020 by the authors. Licensee MDPI, Basel, Switzerland. This article is an open access article distributed under the terms and conditions of the Creative Commons Attribution (CC BY) license (http://creativecommons.org/licenses/by/4.0/).
Share and Cite
MDPI and ACS Style
Štimac, I.; Vidović, A.; Mihetec, T.; Drljača, M. Optimization of Airport Capacity Efficiency by Selecting Optimal Aircraft and Airline Business Model. Sustainability 2020, 12, 3988. https://0-doi-org.brum.beds.ac.uk/10.3390/su12103988
AMA Style
Štimac I, Vidović A, Mihetec T, Drljača M. Optimization of Airport Capacity Efficiency by Selecting Optimal Aircraft and Airline Business Model. Sustainability. 2020; 12(10):3988. https://0-doi-org.brum.beds.ac.uk/10.3390/su12103988
Chicago/Turabian StyleŠtimac, Igor, Andrija Vidović, Tomislav Mihetec, and Miroslav Drljača. 2020. "Optimization of Airport Capacity Efficiency by Selecting Optimal Aircraft and Airline Business Model" Sustainability 12, no. 10: 3988. https://0-doi-org.brum.beds.ac.uk/10.3390/su12103988
Note that from the first issue of 2016, this journal uses article numbers instead of page numbers. See further details here.