Location Based Business Recommendation Using Spatial Demand
by
 , , , ,
Ashok Kumar P
1,† ,
,
Shiva Shankar G
1,† ,
,
Praveen Kumar Reddy Maddikunta
2,†,
Thippa Reddy Gadekallu
2,*,
Abdulrahman Al-Ahmari
3,† and 
Mustufa Haider Abidi
3,*
1
School of Computer Science and Engineering, VIT-Vellore, Tamil Nadu 632014, India
2
School of Information Technology and Engineering, VIT-Vellore, Tamil Nadu 632014, India
3
Raytheon Chair for Systems Engineering (RCSE), Advanced Manufacturing Institute, King Saud University, Riyadh 11421, Saudi Arabia
*
Authors to whom correspondence should be addressed.
†
These authors contributed equally to this work.
Sustainability 2020, 12(10), 4124; https://0-doi-org.brum.beds.ac.uk/10.3390/su12104124
Submission received: 14 April 2020
/
Revised: 12 May 2020
/
Accepted: 12 May 2020
/
Published: 18 May 2020
(This article belongs to the Special Issue Innovative Knowledge-Based Methods for Business Success: Analysing User Generated Content)
Abstract
:Business locations is most important factor to consider before starting a business because the best location attracts more number of people. With the help of web search engines, the customers can search the nearest business location before visiting the business. For example, if a customer need to buy some jewel, he makes use of search engines to find the nearest jewellery shop. If some entrepreneur wants to start a new jewellery shop, he needs to find a best area where there is no jewellery shop nearby and there are more customers in need of jewel. In this paper, we propose an algorithm to find the best place to start a business where there is high demand and no (or very few supply). We measure the quality of recommendation in terms of average service time, customer-business ratio of our new algorithm by implementing in benchmark datasets and the results prove that our algorithm is more efficient than the existing kNN algorithm.
1. Introduction
Starting a business helps in lots of ways like more employment, better economy, increased GDP, more opportunities and so on. Event there are Internet users are increasing day by day, it is estimated that there are about 3.58 billion users worldwide that use internet [1]. Whenever a customer wants a service, he might search the internet for finding the nearest business that offer his service of interest, for example, if a customer wish to go to a restaurant, he may issue a search request to the search engine like ‘find the restaurants near me’. The search engine then lists few restaurants which are near to the user location. Three types of informations can be obtained from this search result, the first one is the customer location, the second one is the customer keyword (ex: restaurants) and the last one is the locations of business which are offering the keywords of customer search. The locations can be found using lots of ways like GPS [2], Wi-Fi [3], Mobile Networks [4], ad-hoc networks [5,6] and so on. With the help of these three informations, a best area recommendation can be found. An area (a closed polygon, with set of points) is said to be a best area for a business where there are lots of demand (the customer search) and there is no enough business to provide the service. People always like to stay in a place where all their needs are within a acceptable range, but in practical, it is very difficult to find a place where all the needs are within acceptable range. A proper mechanism should be there to detect the missing needs in an area [7,8,9]. This motivates us to develop an algorithm to find a best place. The best place is one which has lots of customer demand for a particular service and there is no (or few) business that provides the required service.
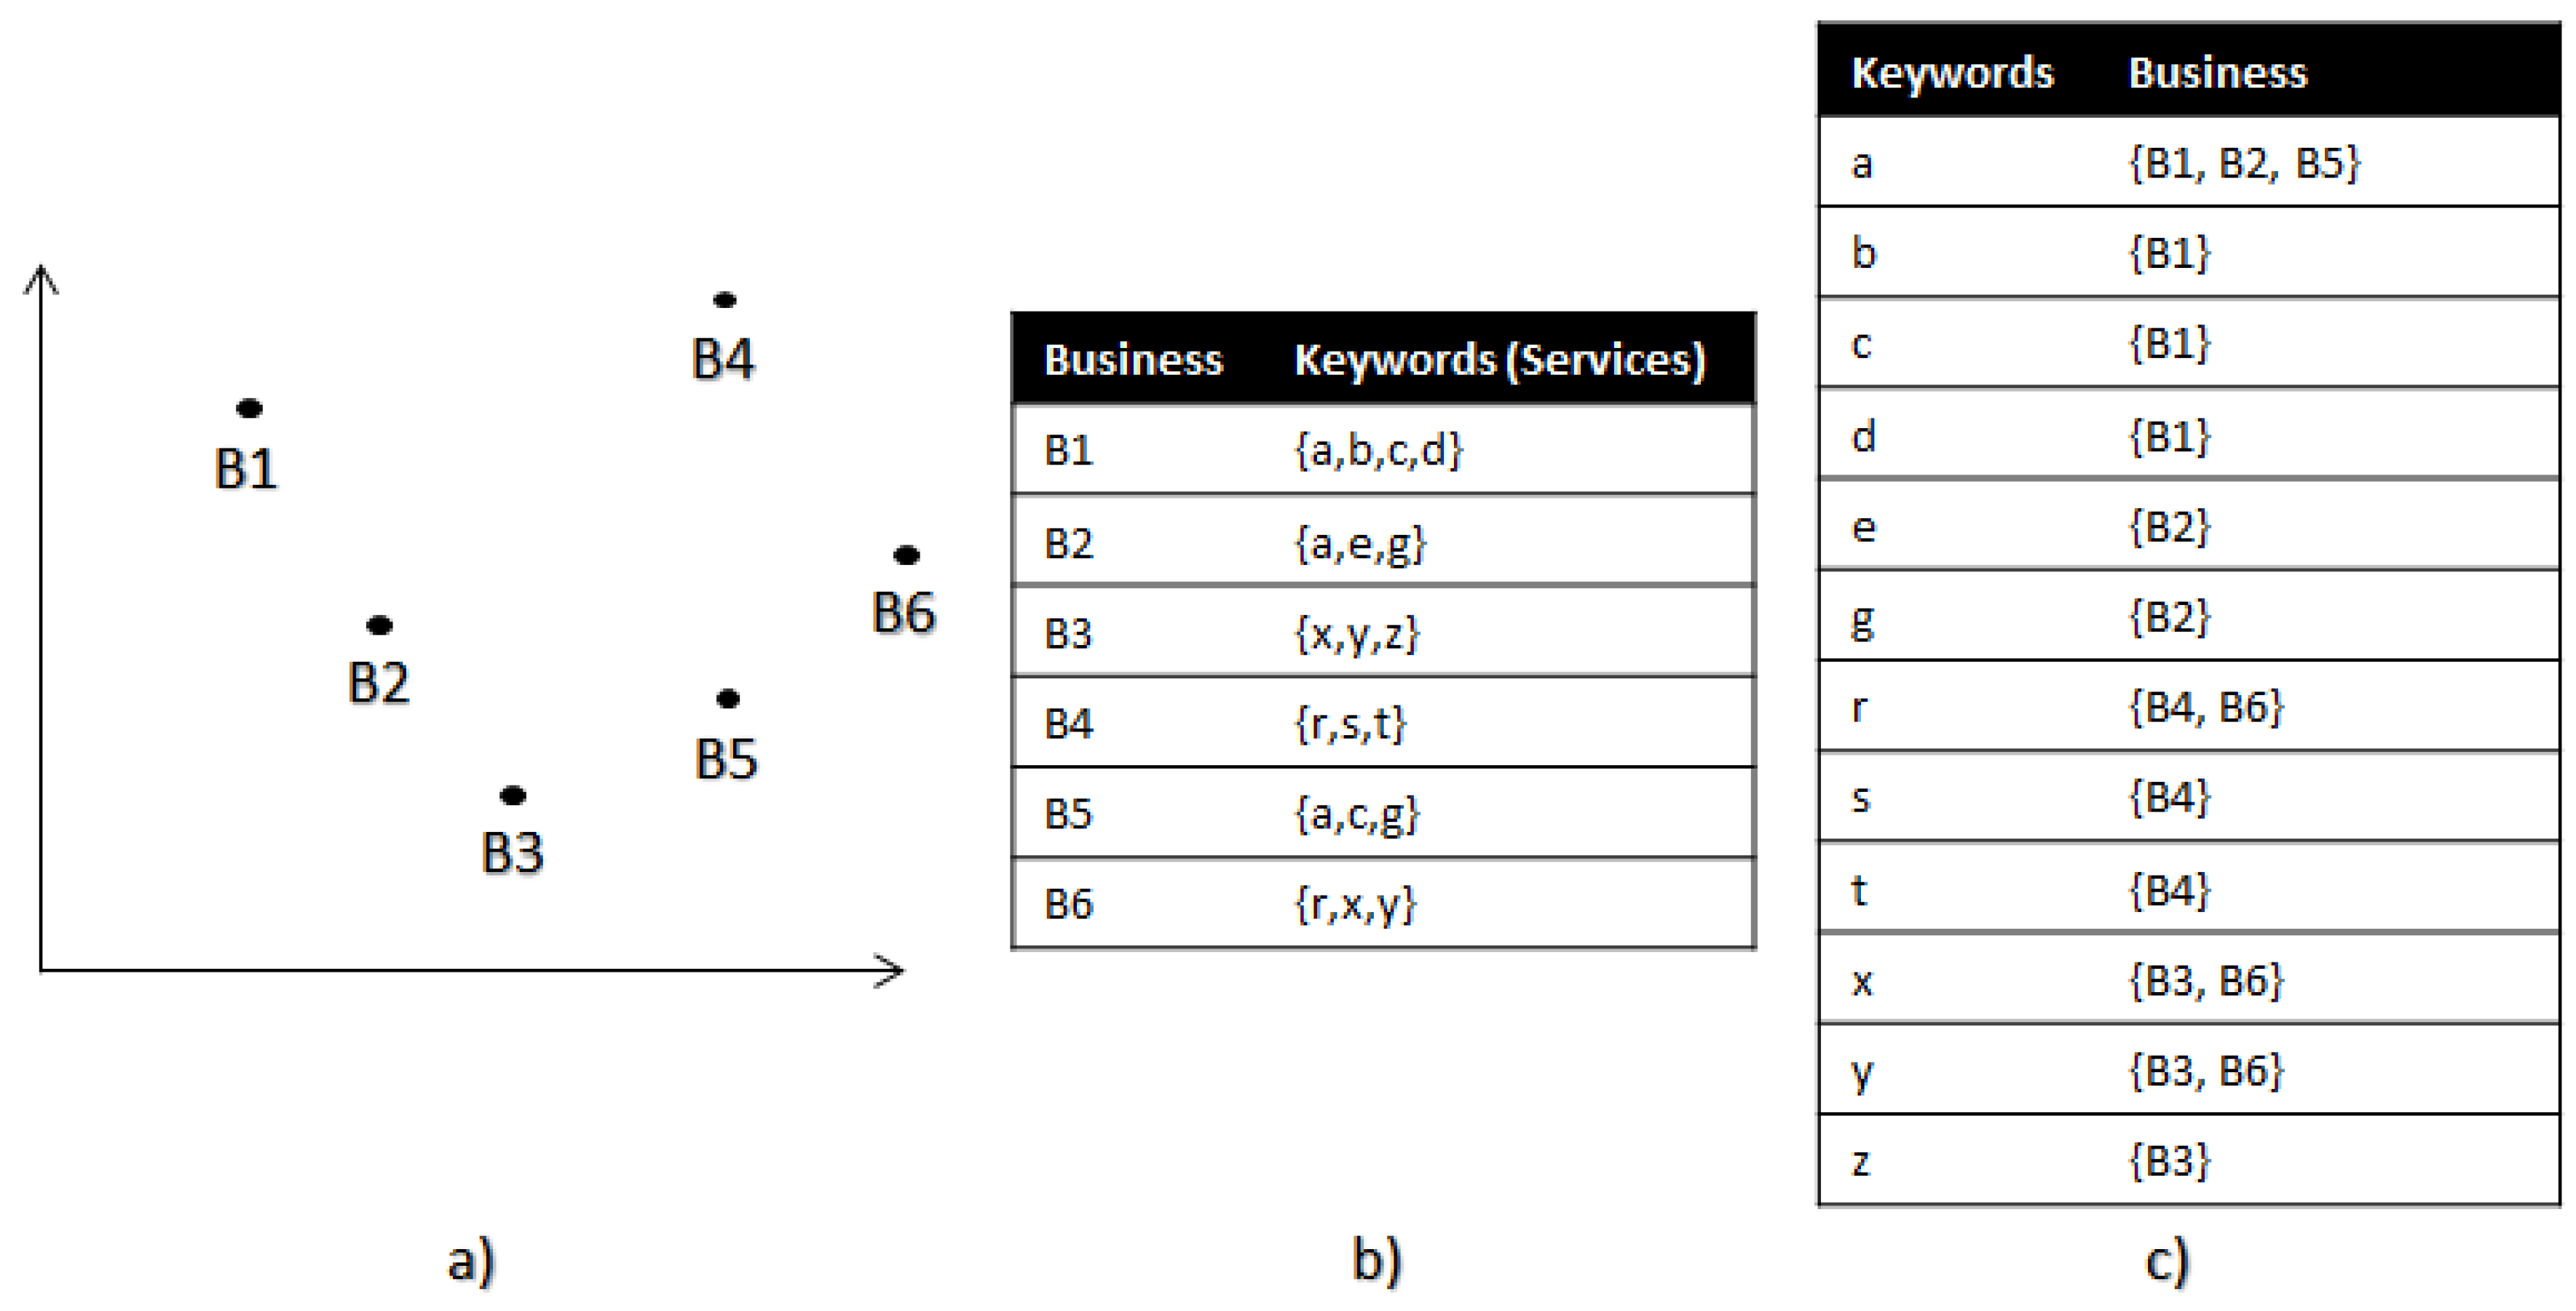
A keyword may not be only a business, it can be a specific service also, for example the keywords related to stationary may be pencil, highlighter and so on. Hence, the recommendation system should be able to predict both a business as well as individual services. Most of the spatial databases support this type of keyword-business storage, thus it is very easy to recommend a best location based on keyword or business. Figure 1 visualizes various business and their keywords.
In the recent years, the advancement of internet shopping forces people to choose many services online making the local business to lose most of their customers [10]. Till now, many businesses spend enormous amount of money in marketing such as advertising, affiliate marketing and so on for preventing customers to go online and for finding new customers. Many medium-scale businesses and small-scale businesses skips the customer-area demand analysis because of the complexity and more work effort in analysis, this omission activity causes massive customer count. However, a business started at best location not only helps in marketing cost cut but also in increased customer count [4]. Various algorithms [11,12,13,14] are developed to recommend a location for a business, but there is still room for improvement because the customer need data are not fully utilized for analysis. In this paper, we propose a new machine-learning [15,16,17,18] based algorithm for giving a solution for finding a best place for a business using customer demand and competitor datas. The frequent algorithm used for solving the location-recommendation system is reverse nearest neighbour search(RNN) [19], in this paper, we prove that our proposed algorithm is better than RNN. The contributions of this paper are summarized as follows
- The proposed method recommends a best location for starting a business where there is high customer demand and less competitors.
- The proposed method also predicts the correlation among the search keywords to cluster them.
- The results prove our work is better than existing algorithms for recommending business in terms of average service time and customer-business ratio.
There are two reasons in which the existing algorithms such as kNN fails. The first one is, the kNN can’t learn the interrelationship among the services and the business, hence it recommends lots of businesses. For example, consider the services Chair, Table, Mobile Charger, Mobile Battery. If the relationship among the services are considered, it is enough to recommend only two businesses (Furniture and Mobile Showroom). Since kNN can’t detect these relationship, it recommends four businesses, one for each service. Travel time consideration is the second major issue that the kNN model faces. In many cases, the decision should be made whether a business should be recommended on current area or at neighboring area based on the travel time, kNN can’t distinguish the location as it has no ability to work on travel time. In the proposed method is designed to overcome the two problems.
The rest of the paper is as follows, Section 2 describes the related works done in the field of business visualization, Section 3 explains the problem definition, the solutions to the problems are addressed in the Section 4. Section 5 tells how to merge the keywords to business and finally Section 6 shows the experinment results and proves our algorithm recommends good location to start a business.
2. Related Works
Social media dominate internet nowadays, the users have a habit of sharing their locations of check-ins in social media. Ref [14] makes use of this information to recommend business without any domain-specific user intervention. Apart from the user location data, many other additional data like social, economical, environmental and cultureal factors can be used for making the business recommendation stronger. Twitter is one of the famous social media with more than 336 million active users, hashtags can be used to extact those additional information [20]. As the data grows exponentially in various social networks, social networks services (SNS) are designed to operate on these rapidly increasing data [21].
A set of parameters like price, quality, brand name and so on are considered to construct a group decision making matrix [22] to recommend a restaurant at a particular area. Decision making matrix are also used as a good parameter to decide whether to start a business in a particular area, it is used in many other works such as in [23] where both vertical and horizontal pair wise parameters are considered to construct the decision making matrix. Creation and distribution of user-generated content (UGC) has made a strong impact on trong impact on consumers, media suppliers, and marketing professionals for the group decision making matrixs, and the research work by [24], aim to find the relationship between the various actors on the role of decision making. Despite of various actors play on UGC, a proper analysis leads a significant positive results in terms of decision making. In the research work [25], the key differences among the actors are exploited based on page joining decisions and the timing differences in them. These strategies help in efficient decision process.
Many works are done for finding a competitor based on keywords. Ref [22] explains how to retrieve set of competitors based on location (X-Y coordinates). Ref [23] adds the keyword (text to describe the business services) to retrieve set of competitors. IR2 is a very good example for fetching the competitors based on both location (nearest) and keyword, however there is a problem of false hit which is eliminated by set based theory as introduced in [26].
The modern recommendation systems does the recommendation process by discovering the user‘s preferences [27] such as age, gender [28] and even via previous histories [29]. Users generally posts their check in updates on many social media such as Facebook, Twitter, the comment along with his post is considered for mining the GPS location and the sentiments of that particular shop. Sometimes, it is difficult to mine the sentiments of the customers as the current mood of the customers varies over time [30]. Combining social media with the recommendation process has many advantages such as the sentiments of a person is strongly connected with the sentiments of his/her friends [31,32]. Hence when a person likes a particular service, it is more likely that his/her friends do like the service [33]. Few recommendation considers to extract topics from the tweets or posts present in the social media for recommending places [34].
3. Problem Definition
Let denote an area (a city, a town or any predefined size region) which has set of customers and list of businesses , , , …, each business b ∈ has set of textual keywords represented as . Our aim is to find a set of businesses , where ∉ and having high search keywords. In this paper, we aim to provide solutions for two problems as shown below:
Problem 1: To count the customers in Area searching for keyword , recommend a set of business B, which are not present in .
Problem 2: Given set of keywords , , , …, recommend a minimum set of business which covers all the keywords.
4. The Business Recommendation Model
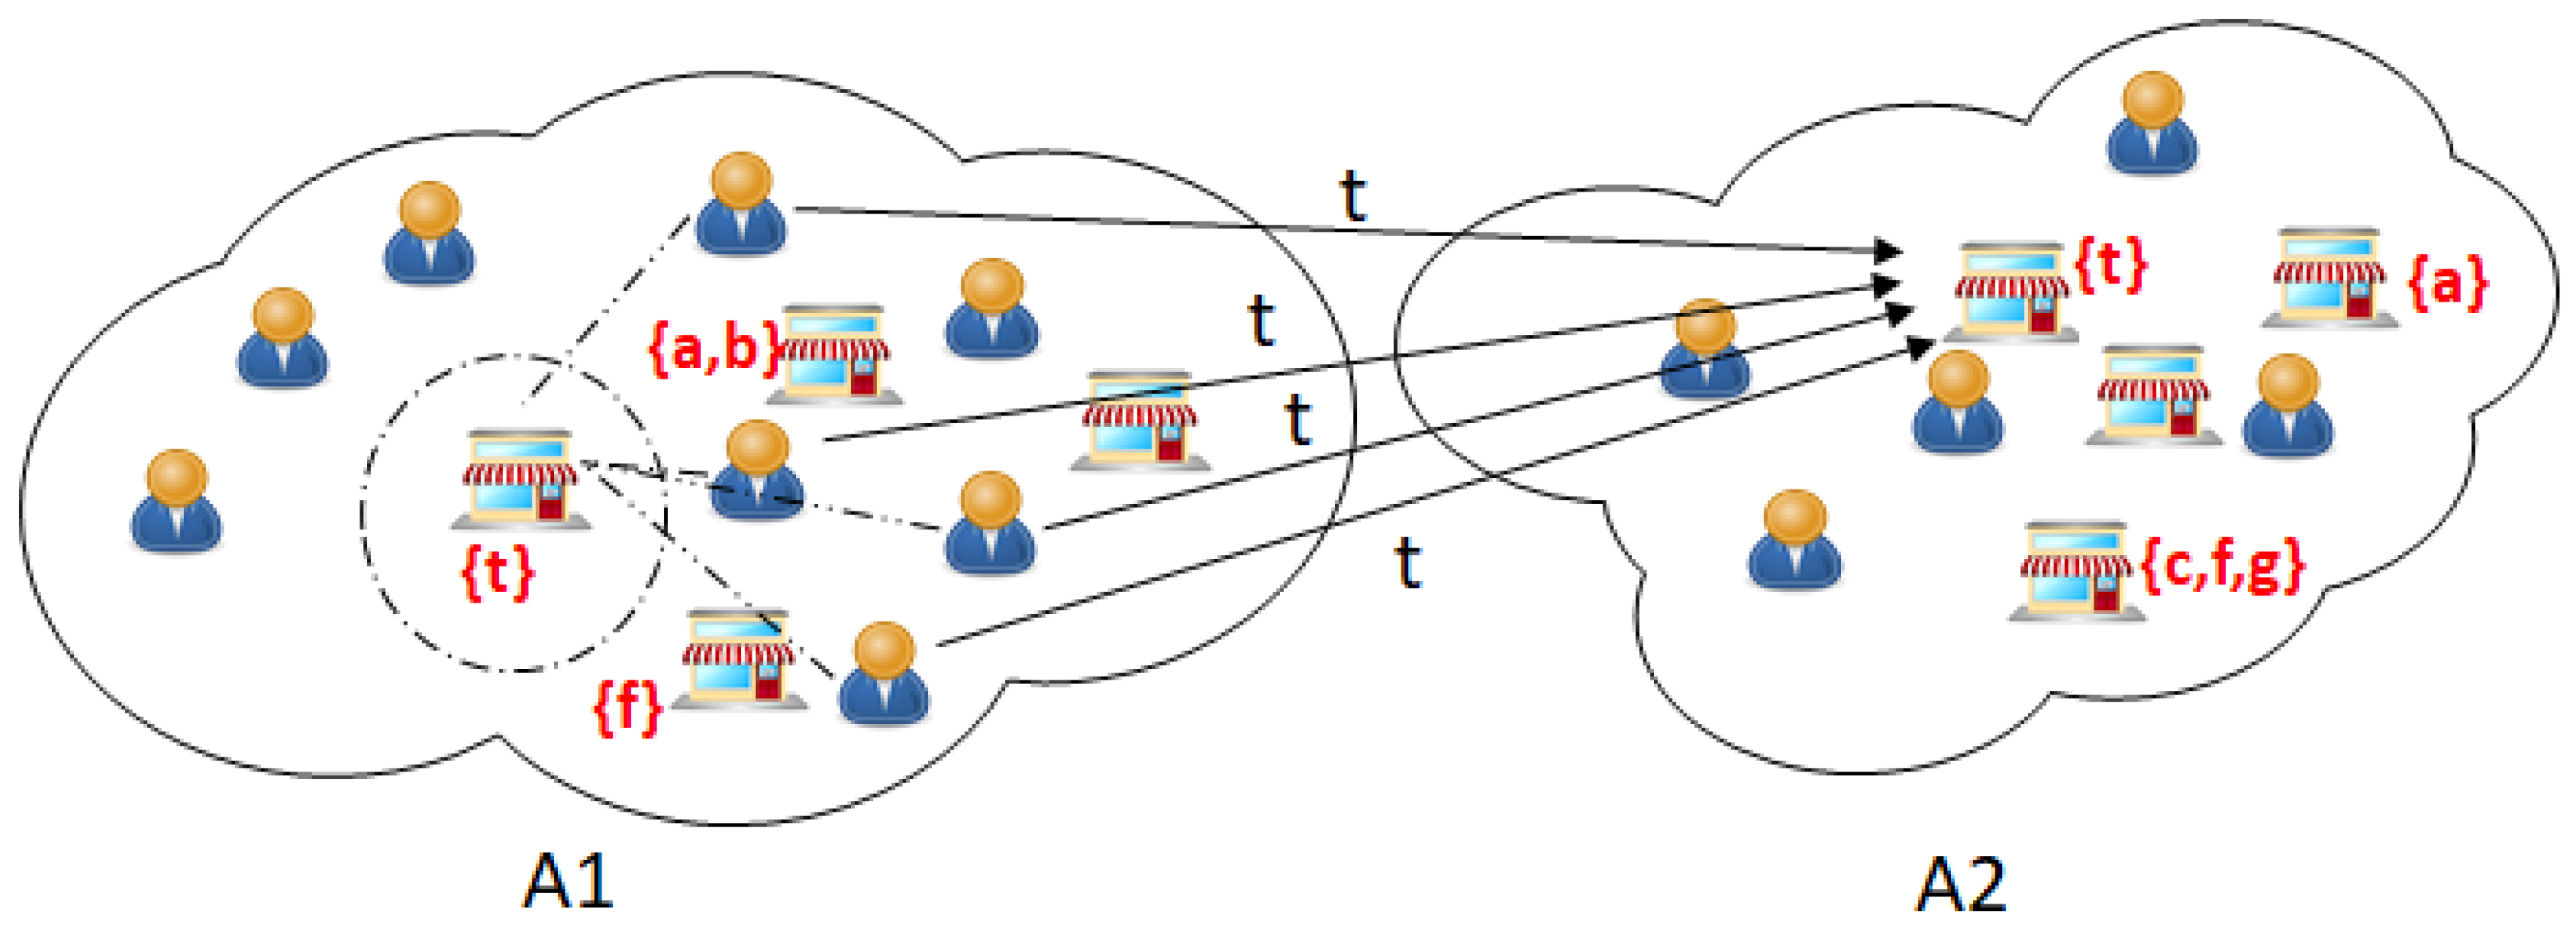
Figure 2 A typical example of keyword search and business scope visualization from two areas A1 and A2. Texts inside curve brackets represents the services each business is offering. The directed arrows show that customers are redirected to go to a business based on their needed service.
In this section, we explain the working FindKeywordMissing Algorithm and how it is used to find the missing high-searched keywords in an area. Figure 2 shows the sample diagram where there are two areas A1 and A2, each area having set of businesses, the diagram shows that the keyword ‘t’ is searched by more customers and there is no business in A1 to provide ‘t’, instead the area A2 has a business which offers ‘t’, so the customers from A1 has to travel to A2 to avail the service ‘t’. the dotted circle in A1 is a recommendation given by our algorithm where there is one scope for a business to offer service ‘t’.
Our recommendation model works by using SI-Index based search [37] for detecting the most searched services in a particular area. The SI-Index based search accepts services as input and outputs the nearest K businesses which provide those services. The algorithm first builds the two-column inverted table as shown in Figure 1c, where one column refers the available services and the next column lists the business shops which offers the respective service. The locations of the business shop are stored in a R-Tree, which is used to return nearest K neighbours. Given a set of services S, the SI-Index based search produces a set of businesses B which provides S as per the following equation.
Whenever a customer search is made for a service ‘t’ at area Ai, the SI lists few businesses B belong to B1, B2, …, where B provides ‘t’. (B,Ai) will return true if equation 1 holds. (B,Ai) tells whether any business in placed within Ai itself. If (B,Ai) is false, then it z that there is no business in Ai that is providing ‘t’, therefore the customer has to travel to another area to get the service. Counter called ‘missing’ is incremented each time when is false, this helps the algorithm to keep track of number of customers travelling to another location. A threshold value TH, a function of population count in entire domain of areas, is used as an alert to recommend a business to provide the service ‘t’. Algorithm 1 explains the whole concept of FindKeywordMissing().
| Algorithm 1: Find Missing Keywords |
 |
Proof.
Our Algorithm results in less time for a customer to get a required service. Let be the total time taken by a customer to enter a business in foreign area and represent the total time taken by a customer to enter a business in home area. Our model avoids the traffic details and other parameters related to travelling. Let be the average arrival rate of a customer and be the average service rate by a business, 1 be the time taken by a customer to travel from his home to business (at another area), 2 be the total time taken by a customer to travel from his home to business (at same area). The total time spend by a customer when the business is outside his area is given by Equation (3), Equation (4) represent the total time taken by customer to get served at a business shop when the shop is located at his own area. Obviously 2 ≤1, so our algorithm let the customers to spend less time to get the required service.
□
Eliminating Useless Business Visualization
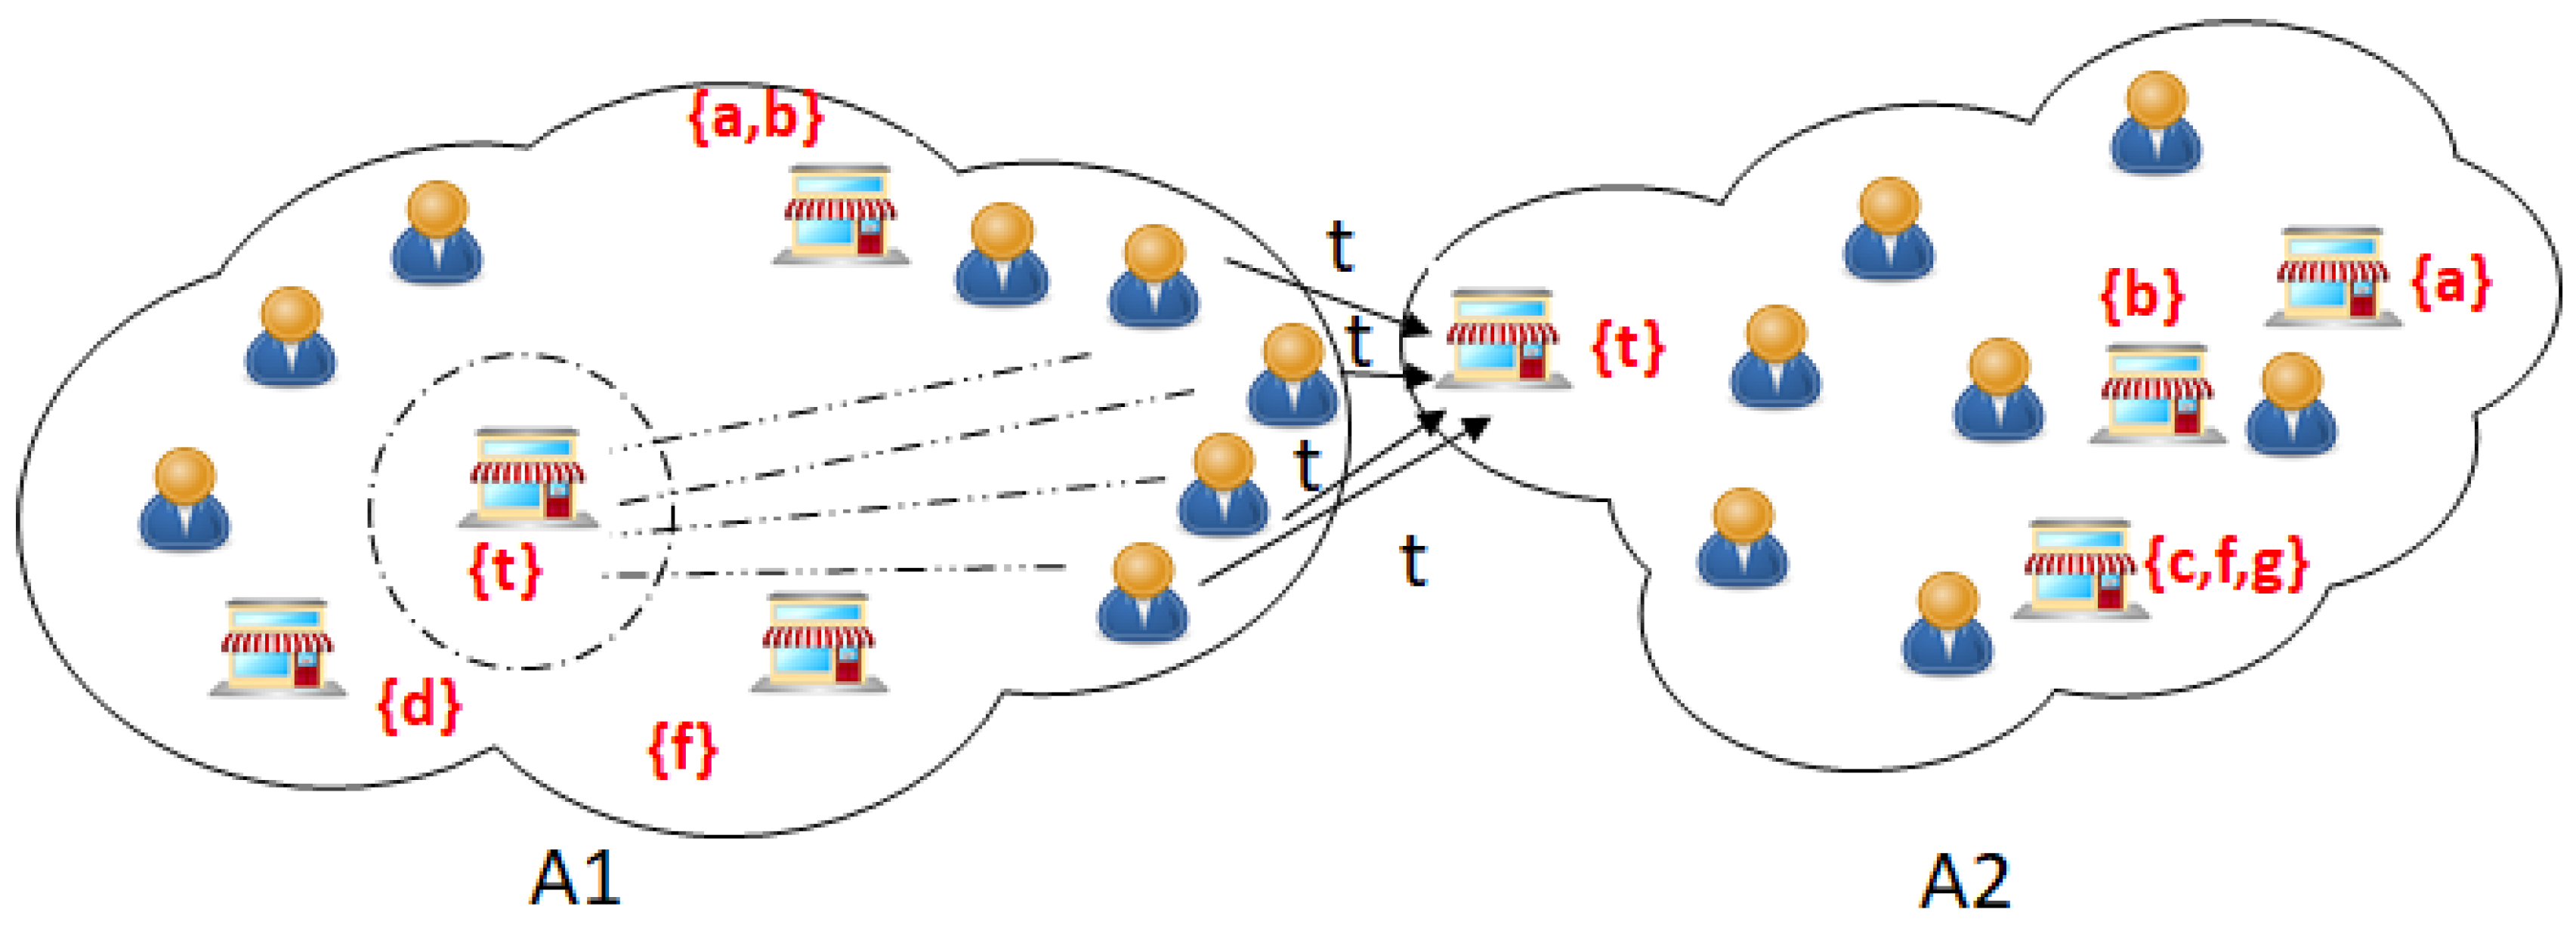
The Algorithm 1, recommends a business b for a service s inside an area Ai if there is high demand of s inside Ai and there is no business to provide s. The exact location of b is not recommended due to high complexity, so only visualization is done at area level rather than exact location level, but there is a chance of useless recommendation, that is for example, consider two adjacent area having customers in one area and business in another area, but both customers and business are placed nearby, then Algorithm 1 recommends a business inside the customer area which will be useless because the recommended business might not get enough customers due to large distance. Figure 3 shows this scenario.
Algorithm 2 considers the intra area distance and the ‘missing’ counter is incremented only if the distance between the customer and the midpoint of area is less than distance between customer and the business.
5. Business Coverage
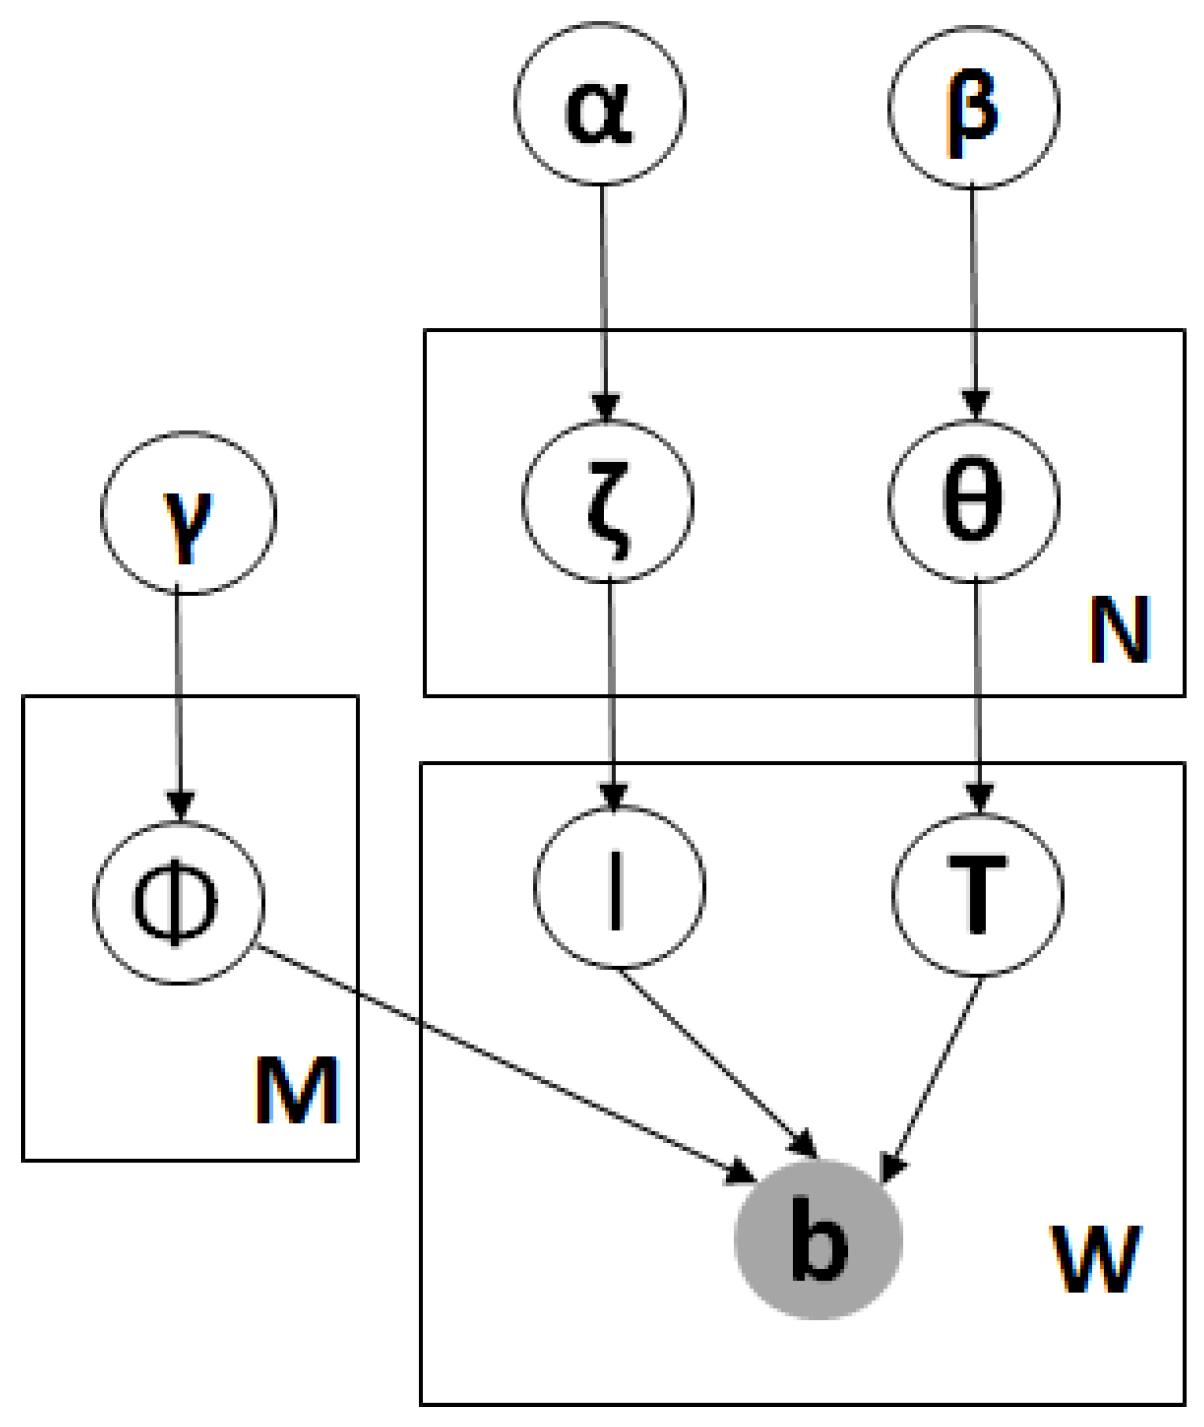
Algorithm 2 can efficiently mine the missing service in any area and visualizes them to recommend new business, but the goal of the recommendation will be efficient only when it visualizes as less number of businesses as possible to cover all the missing services. For example, if there are five missing services like ‘Apple iPhone 7’, ‘Google Pixel 2’, ‘Galaxy S9’, ‘T-Shirts’, ‘Jeans’, then our visualization should be good enough to recommend just two businesses ‘mobile shops’ and ‘fashion shops’ instead of recommending 5 different businesses. Sometimes, there might be a single coverage of non-corelated data also, for example, soaps and biscuits can be covered by a single departmental store even though soaps and biscuits are non-correlated. We create a new LDA [38] based algorithm called BC-LDA (Business Coverage-LDA), over the years, many research works [39] focus on LDA. Figure 4 shows the BC-LDA plate model for covering services into business, the symbol meanings are mentioned at Table 1, the process of BC-LDA is discussed here
- First choose a service s either from Dir(theta) or Dir(zeta)
- Choose a business B Dir(pie)
- For each service s in 1, 2, …, N
- –
- Draw an assignment b multinomial (s,B)
| Algorithm 2: Find Missing Keywords (Considering Inter Area Distance) |
 |
6. Experiments
In this section, we show that our implementation result outperforms the existing algorithms and thus we prove business visualization is done more accurately than other machine learning algorithms.
Comparison: We have done our comparison with kNN (with K = half of population in an area) to validate our results. kNN first checks the majority of service search that is missing in an area and recommends the respective service. The result of kNN is not acceptable for two reasons, first it is too time consuming process, second it fails to omit the useless business recommendation. We measure the efficiency of the algorithm with the following two factors
- Customer-Business-Area Ratio (CBA-Ratio): This represents the ratio of average number of customers search for a service and the availability of the service in a particular area. The more this value, the better recommendation is done, if there are too many useless businesses, the value goes down.
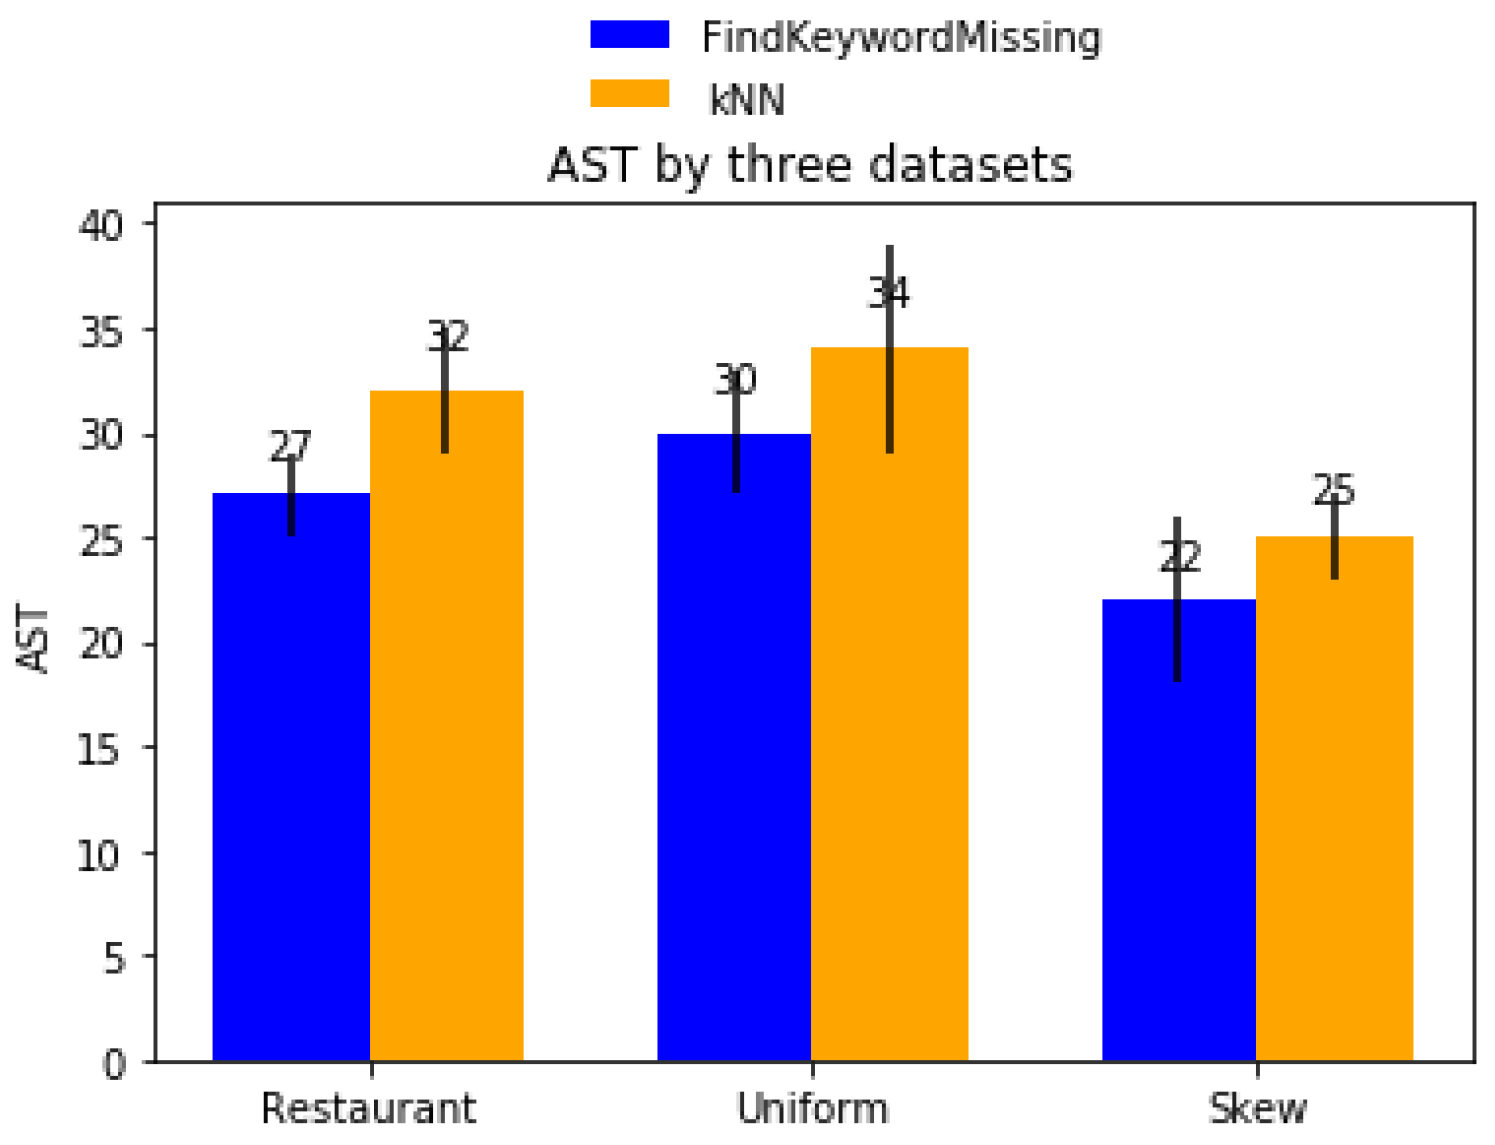
- Average Service Time (AST): This value represents the average time for a customer to visit the business (travelling time) plus the time needed for a customer to acquire the needed service (waiting time and service time). The less AST will give better recommendation.
Dataset: We have implemented our algorithms in both real as well as synthetic datasets. There are two synthetic dataset used, the first one is random dataset where the business locations and their services are placed randomly using uniform distribution. The second type of synthetic dataset used is skewed dataset, which contain similar business services near to each other. The real dataset used in our project is Restaurant Dataset [40]. The details of the datasets are listed below at Table 2.
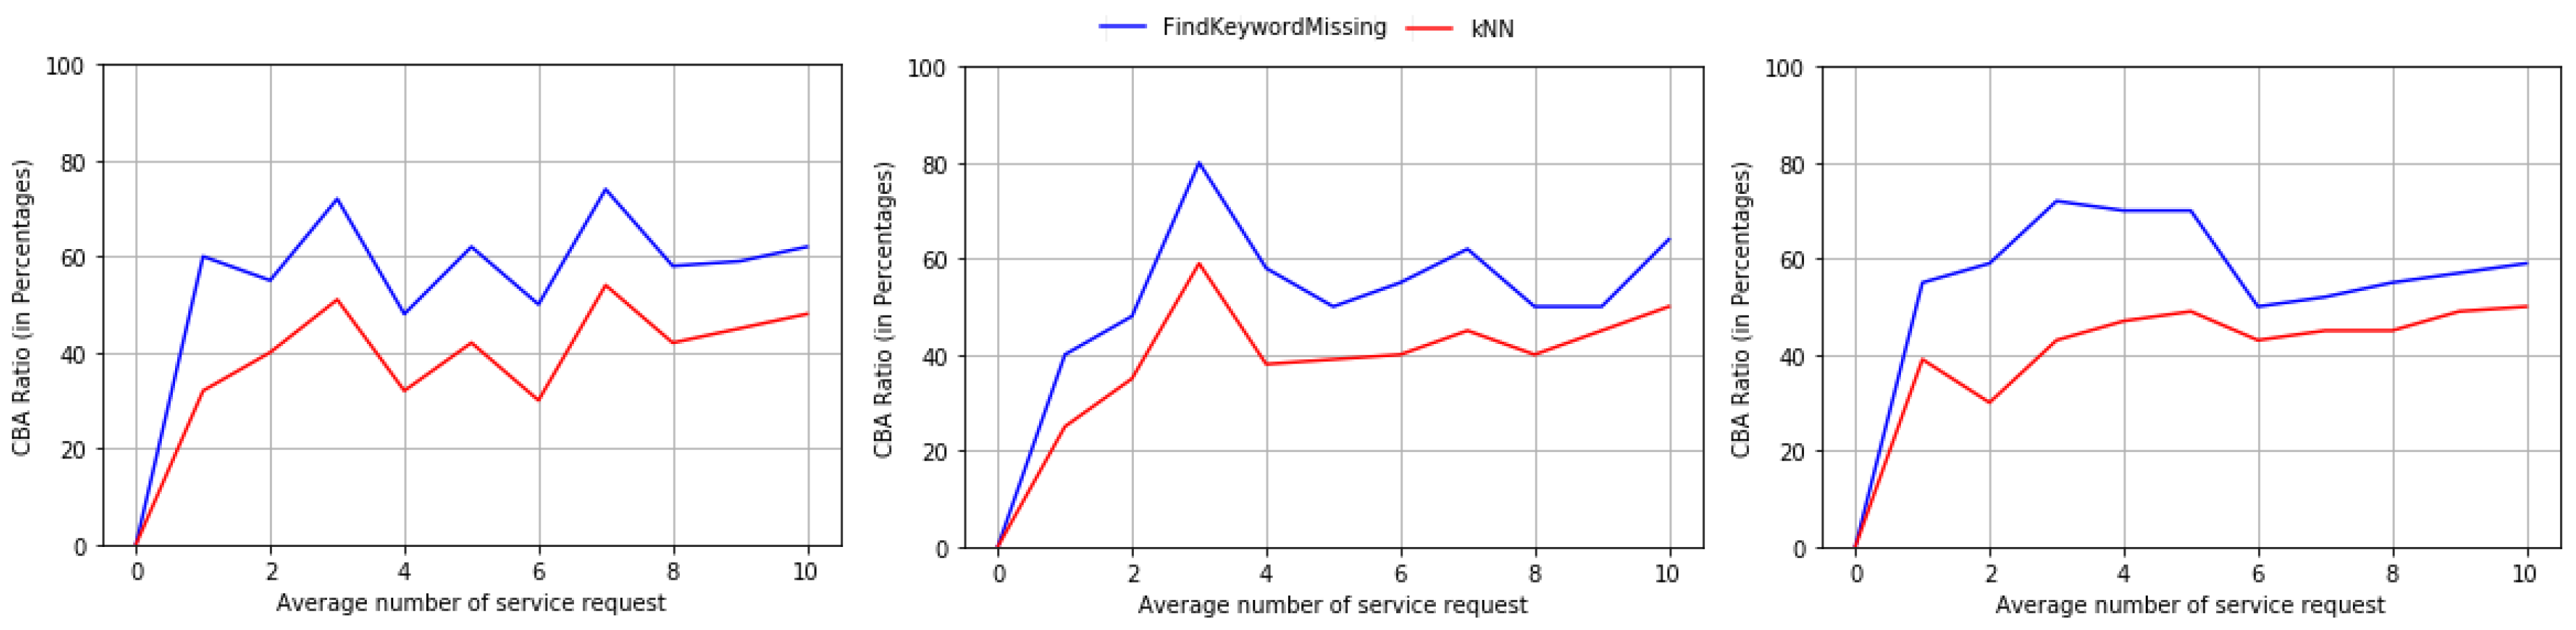
6.1. CBA-Ratio
CBA ratio tells more about business utilization rather than simply number of businesses per area. kNN always fails to give better CBA-Ratio because it has no ability to learn the useless businesses, more useless businesses will be visualized and a false recommendation will be created due to kNN. The graph at Figure 5 shows the CBA-Ratio and it tells that our algorithm utilizes the newly opened business very efficiently.
6.2. AST
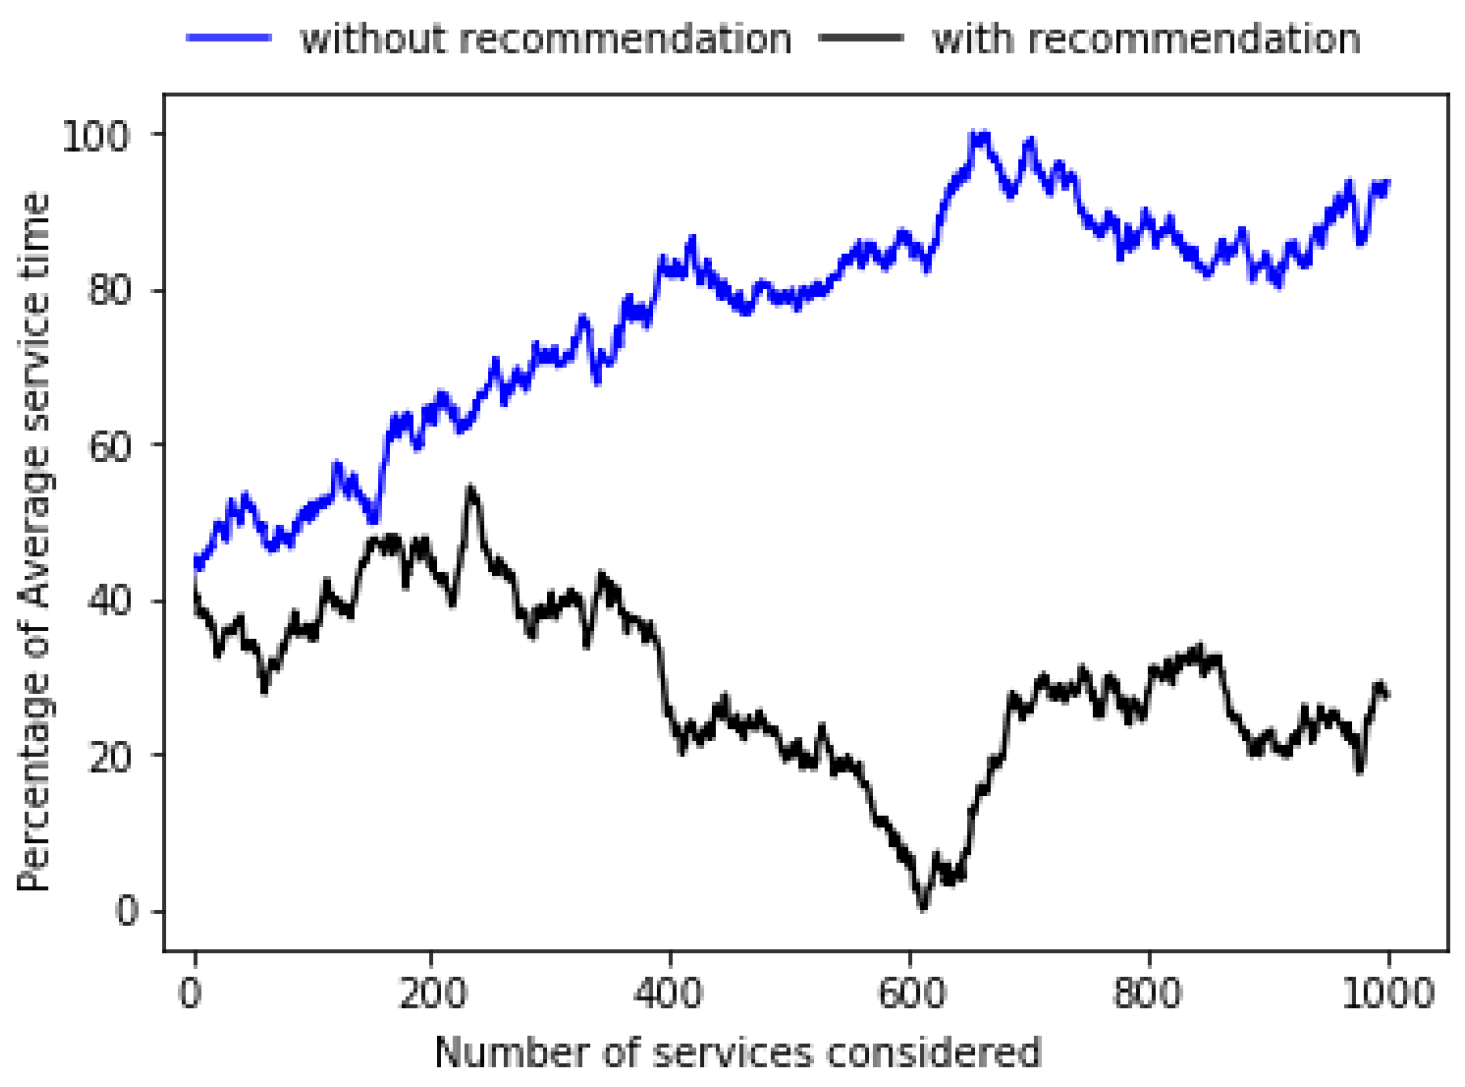
Average service time is one of the factors that affect the profitability of business, if the total time spend for a customer to avail a service is more than a tolerable time, then there is more chance for the business to loss a customer. Our algorithm reduces the average service time as it visualizes the missing business in area and helps entrepreneurs to start a new business to reduce the travelling time. Graph at Figure 6 shows that our algorithm has less service time than kNN because kNN generate more useless businesses. Figure 7 explains that average service time is reduced by acceptable duration when there a recommendation system.
6.3. Business Coverage
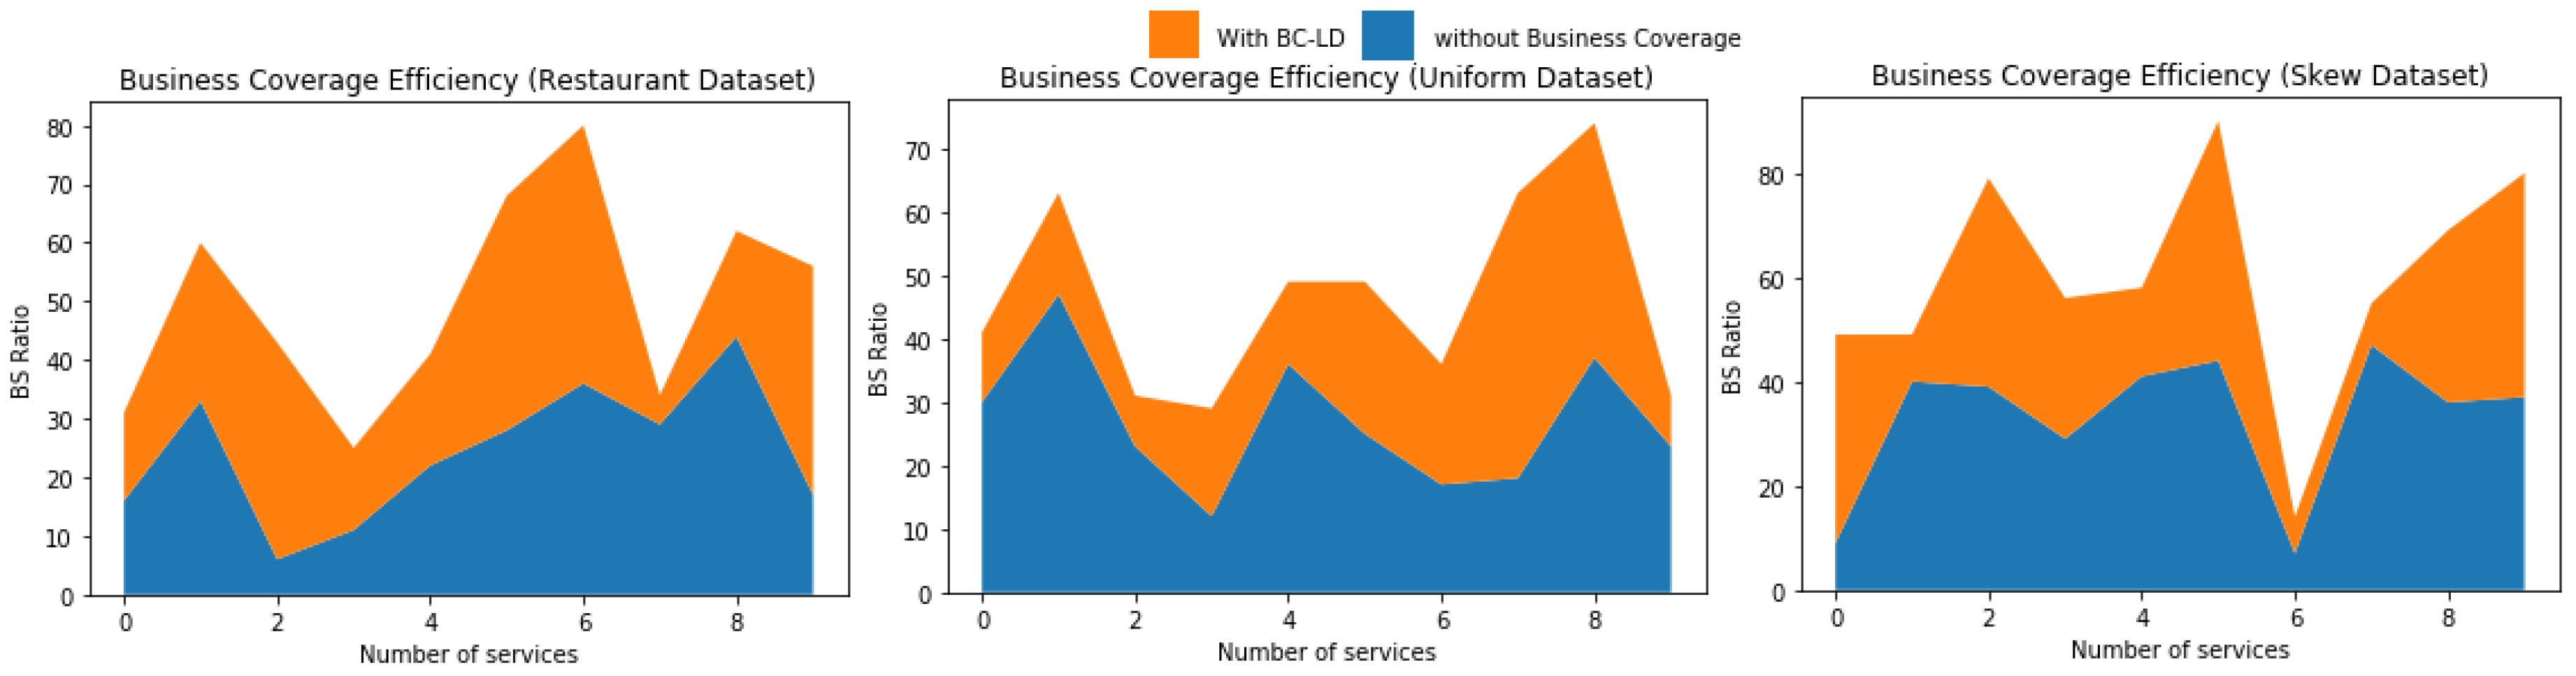
When there is more business then there is no proper utilization of resources, when there is only one business for providing one service, then the space occupied, transportation cost and many other parameters increases. A best solution for proper utilization is recommend as low number of business possible to cover the entire services. This is what done by the BC-LDA model, Figure 8 shows that the business utilization of BC-LDA is more than that of without doing any business coverage. Business utilization can be defined as per the Formula (5).
At the summary, the proposed method recommends the missing business keywords from each area. The recommended keywords are then analyzed into distinct unique topics where each topic is the collection of related keywords. The recommended topics are then considered for starting a business in the area so that the demand frequency is high and there is less competition.
7. Conclusions
Business is an important factor for a growth of a country, there are number of advantages in starting a business like more employment, increased GDP and so on. An area where there is high demand for a service and there is no business to provide the respective service is called as best place to start a business. In our work, we visualizes the best area to start a business and making it to run profitability. In this work, we consider two parameter to validate our results, the first one is CBA-Ratio—the business utilization by customers per area; the second one is AST—the average service time spend by the business for their customers. The traditional kNN algorithm is been compared with our proposed work and the results show that our proposed model is giving better results than existing works. We also introduced a modified LDA model to cover services into less number of business to utilize the resource effectively. The LDA combines the keywords into topics where each topic represents a business domain.
In future work, we plan to consider some legal issues, tax and rent information before visualization of business. This makes more refined recommendation system.
Author Contributions
Conceptualization, A.K.P. and S.S.G.; Data curation, A.K.P., S.S.G.; Formal analysis, P.K.R.M. and T.R.G.; Investigation, P.K.R.M. and T.R.G.; Methodology, A.K.P. and S.S.G.; Project administration, T.R.G., A.A.-A. and M.H.A; Resources, A.A.-A. and M.H.A; Software, P.K.R.M.; Validation, P.K.R.M. and M.H.A.; Visualization, P.K.R.M. and A.A.-A.; Writing—original draft, A.K.P. and S.S.G.; Writing—review and editing, T.R.G., P.K.R.M., A.A.-A. and M.H.A. All authors have read and agreed to the published version of the manuscript.
Funding
This research was funded by Raytheon Chair for Systems Engineering.
Acknowledgments
The authors are grateful to the Raytheon Chair for Systems Engineering for funding.
Conflicts of Interest
The authors declare no conflict of interest.
References
- Kim, D. A 2020 perspective on A dynamic model for the evolution of the next generation Internet Implications for network policies, Towards a balanced perpective on the Internet role in the 5G and Industry 4.0 era. Electron. Commer. Res. Appl. 2020, 41, 100966. [Google Scholar] [CrossRef]
- Ladle, A.; Galpern, P.; Doyle-Baker, P. Measuring the use of green space with urban resource selection functions: An application using smartphone GPS locations. Landsc. Urban Plan. 2018, 179, 107–115. [Google Scholar] [CrossRef]
- Traunmueller, M.W.; Johnson, N.; Malik, A.; Kontokosta, C.E. Digital footprints: Using WiFi probe and locational data to analyze human mobility trajectories in cities. Comput. Environ. Urban Syst. 2018, 72, 4–12. [Google Scholar] [CrossRef]
- Zhu, C.; Quan, K.; Han, G.; Rodrigues, J.J. A high-available and location predictive data gathering scheme with mobile sinks for wireless sensor networks. Comput. Netw. 2018, 145, 156–164. [Google Scholar] [CrossRef]
- Wang, K.; Meng, W.; Bian, J.; Li, S.; Yang, S. Spatial context-aware user mention behavior modeling for mentionee recommendation. Neural Netw. 2018, 106, 152–167. [Google Scholar] [CrossRef]
- Saleh, M. Secure Tilted-Rectangular-Shaped Request Zone Location-Aided Routing Protocol (STRS-RZLAR) for Vehicular Ad Hoc Networks. Procedia Comput. Sci. 2019, 160, 248–253. [Google Scholar] [CrossRef]
- Reddy, G.T.; Reddy, M.P.K.; Lakshmanna, K.; Kaluri, R.; Rajput, D.S.; Srivastava, G.; Baker, T. Analysis of Dimensionality Reduction Techniques on Big Data. IEEE Access 2020, 8, 54776–54788. [Google Scholar] [CrossRef]
- Iwendi, C.; Maddikunta, P.K.R.; Gadekallu, T.R.; Lakshmanna, K.; Bashir, A.K.; Piran, M.J. A metaheuristic optimization approach for energy efficiency in the IoT networks. Softw. Pract. Exp. 2020. [Google Scholar] [CrossRef]
- Reddy, G.T.; Reddy, M.P.K.; Lakshmanna, K.; Rajput, D.S.; Kaluri, R.; Srivastava, G. Hybrid genetic algorithm and a fuzzy logic classifier for heart disease diagnosis. Evol. Intell. 2019, 1–12. [Google Scholar] [CrossRef]
- Ashokkumar, P.; Arunkumar, N.; Don, S. Intelligent optimal route recommendation among heterogeneous objects with keywords. Comput. Electr. Eng. 2018, 68, 526–535. [Google Scholar] [CrossRef]
- Wei, Y.; Zhao, X.; Zou, J.; Herrera-Viedma, E. A complementing preference based method for location recommendation with cellular data. Knowl. Based Syst. 2019, 183, 104889. [Google Scholar] [CrossRef]
- Cai, W.; Wang, Y.; Lv, R.; Jin, Q. An efficient location recommendation scheme based on clustering and data fusion. Comput. Electr. Eng. 2019, 77, 289–299. [Google Scholar] [CrossRef]
- Patouillard, L.; Bulle, C.; Querleu, C.; Maxime, D.; Osset, P.; Margni, M. Critical review and practical recommendations to integrate the spatial dimension into life cycle assessment. J. Clean. Prod. 2018, 177, 398–412. [Google Scholar] [CrossRef] [Green Version]
- Zhang, F.; Zu, J.; Hu, M.; Zhu, D.; Kang, Y.; Gao, S.; Zhang, Y.; Huang, Z. Uncovering inconspicuous places using social media check-ins and street view images. Comput. Environ. Urban Syst. 2020, 81, 101478. [Google Scholar] [CrossRef]
- Reddy, G.T.; Bhattacharya, S.; Ramakrishnan, S.S.; Chowdhary, C.L.; Hakak, S.; Kaluri, R.; Reddy, M.P.K. An Ensemble based Machine Learning model for Diabetic Retinopathy Classification. In Proceedings of the 2020 International Conference on Emerging Trends in Information Technology and Engineering (ic-ETITE), Vellore, India, 24–25 February 2020; pp. 1–6. [Google Scholar]
- Patel, H.; Singh Rajput, D.; Thippa Reddy, G.; Iwendi, C.; Kashif Bashir, A.; Jo, O. A review on classification of imbalanced data for wireless sensor networks. Int. J. Distrib. Sens. Netw. 2020, 16, 1550147720916404. [Google Scholar] [CrossRef]
- Reddy, T.; RM, S.P.; Parimala, M.; Chowdhary, C.L.; Reddy, M.P.K.; Hakak, S.; Khan, W.Z. A deep neural networks based model for uninterrupted marine environment monitoring. Comput. Commun. 2020, 157, 64–75. [Google Scholar]
- Alazab, M.; Khan, S.; Krishnan, S.S.R.; Pham, Q.V.; Reddy, M.P.K.; Gadekallu, T.R. A Multidirectional LSTM Model for Predicting the Stability of a Smart Grid. IEEE Access 2020. [Google Scholar] [CrossRef]
- Sarwat, M.; Levandoski, J.J.; Eldawy, A.; Mokbel, M.F. LARS*: An Efficient and Scalable Location-Aware Recommender System. IEEE Trans. Knowl. Data Eng. 2014, 26, 1384–1399. [Google Scholar] [CrossRef] [Green Version]
- Reyes-Menendez, A.; Saura, J.R.; Alvarez-Alonso, C. Understanding #WorldEnvironmentDay User Opinions in Twitter: A Topic-Based Sentiment Analysis Approach. Int. J. Environ. Res. Public Health 2018, 15, 2537. [Google Scholar] [CrossRef] [Green Version]
- Saura, J.R.; Herraez, B.R.; Reyes-Menendez, A. Comparing a Traditional Approach for Financial Brand Communication Analysis With a Big Data Analytics Technique. IEEE Access 2019, 7, 37100–37108. [Google Scholar] [CrossRef]
- Tang, M.; Liao, H. From conventional group decision making to large-scale group decision making: What are the challenges and how to meet them in big data era? A state-of-the-art survey. Omega 2019, 102141. [Google Scholar] [CrossRef]
- Yu, C.; Matta, A.; Semeraro, Q. Group decision making in manufacturing systems: An approach using spatial preference information and indifference zone. J. Manuf. Syst. 2020, 55, 109–125. [Google Scholar] [CrossRef]
- Daugherty, T.; Eastin, M.S.; Bright, L. Exploring Consumer Motivations for Creating User-Generated Content. J. Interact. Advert. 2008, 8, 16–25. [Google Scholar] [CrossRef]
- Goh, K.Y.; Heng, C.S.; Lin, Z. Social Media Brand Community and Consumer Behavior: Quantifying the Relative Impact of User- and Marketer-Generated Content. Inf. Syst. Res. 2013, 24, 88–107. [Google Scholar] [CrossRef]
- Rocha-Junior, J.A.B.; Gkorgkas, O.; Jonassen, S.; Nørvåg, K. Efficient Processing of Top-k Spatial Keyword Queries. In Proceedings of the 12th International Conference on Advances in Spatial and Temporal Databases, Minneapolis, MN, USA, 24–26 August 2011; Springer: Berlin/Heidelberg, Germany, 2011; pp. 205–222. [Google Scholar]
- Yao, Z. Exploiting Human Mobility Patterns for Point-of-Interest Recommendation. In Proceedings of the Eleventh ACM International Conference on Web Search and Data Mining, Marina Del Rey, CA, USA, 5–9 February 2018; Association for Computing Machinery: New York, NY, USA, 2018; pp. 757–758. [Google Scholar] [CrossRef]
- Zhao, G.; Lou, P.; Qian, X.; Hou, X. Personalized location recommendation by fusing sentimental and spatial context. Knowl. Based Syst. 2020, 105849. [Google Scholar] [CrossRef]
- Xiao, X.; Zheng, Y.; Luo, Q.; Xie, X.; Ambient, J.; Comput, I.H.; Ambient, J.; Comput, I.H.; Xiao, X.; Zheng, Y.; et al. Inferring Social Ties between Users with Human Location History; Springer: Berlin/Heidelberg, Germany, 2011. [Google Scholar]
- Gao, H.; Tang, J.; Hu, X.; Liu, H. Exploring Temporal Effects for Location Recommendation on Location-Based Social Networks. In Proceedings of the 7th ACM Conference on Recommender Systems, Hong Kong, China, 12–16 October 2013; Association for Computing Machinery: New York, NY, USA, 2013; pp. 93–100. [Google Scholar] [CrossRef]
- Si, Y.; Zhang, F.; Liu, W. An adaptive point-of-interest recommendation method for location-based social networks based on user activity and spatial features. Knowl. Based Syst. 2019, 163, 267–282. [Google Scholar] [CrossRef]
- Gadekallu, T.; Soni, A.; Sarkar, D.; Kuruva, L. Application of Sentiment Analysis in Movie Reviews. In Sentiment Analysis and Knowledge Discovery in Contemporary Business; IGI Global: Hershey, PA, USA, 2019; pp. 77–90. [Google Scholar]
- Lian, D.; Xie, X.; Zheng, V.W.; Yuan, N.J.; Zhang, F.; Chen, E. CEPR: A Collaborative Exploration and Periodically Returning Model for Location Prediction. ACM Trans. Intell. Syst. Technol. 2015, 6, 1–27. [Google Scholar] [CrossRef]
- Lei, X.; Qian, X.; Zhao, G. Rating Prediction Based on Social Sentiment From Textual Reviews. IEEE Trans. Multimed. 2016, 18, 1910–1921. [Google Scholar] [CrossRef]
- Hu, Y.; Peng, Q.; Hu, X.; Yang, R. Time Aware and Data Sparsity Tolerant Web Service Recommendation Based on Improved Collaborative Filtering. IEEE Trans. Serv. Comput. 2015, 8, 782–794. [Google Scholar] [CrossRef]
- Qi, L.; Zhang, X.; Li, S.; Wan, S.; Wen, Y.; Gong, W. Spatial-temporal data-driven service recommendation with privacy-preservation. Inf. Sci. 2020, 515, 91–102. [Google Scholar] [CrossRef]
- Tao, Y.; Sheng, C. Fast Nearest Neighbor Search with Keywords. IEEE Trans. Knowl. Data Eng. 2014, 26, 878–888. [Google Scholar]
- Blei, D.M.; Ng, A.Y.; Jordan, M.I. Latent Dirichlet Allocation. J. Mach. Learn. Res. 2003, 3, 993–1022. [Google Scholar]
- Saura, J.R.; Bennett, D.R. A Three-Stage method for Data Text Mining: Using UGC in Business Intelligence Analysis. Symmetry 2019, 11, 519. [Google Scholar] [CrossRef] [Green Version]
- Kaggle. Jurk06. Restaurant Dataset. 2018. Available online: https://www.kaggle.com/jurk06/restaurant-dataset (accessed on 20 February 2020).
Figure 1.
Example of business locations (a), their service descriptions (b) and their inverted index (c).
Figure 1.
Example of business locations (a), their service descriptions (b) and their inverted index (c).

Figure 2.
A typical example of keyword search and business scope visualization from two areas A1 and A2. Texts inside curve brackets represents the services each business is offering. The directed arrows show that customers are redirected to go to a business based on their needed service.
Figure 2.
A typical example of keyword search and business scope visualization from two areas A1 and A2. Texts inside curve brackets represents the services each business is offering. The directed arrows show that customers are redirected to go to a business based on their needed service.

Figure 3.
A visualization of useless recommendation of business for ‘t’ in A1 because the neighbouring area A2 has a business to provide ‘t’ which is very near to the customers in A1, so the recommended business in A1 will have less scope.
Figure 3.
A visualization of useless recommendation of business for ‘t’ in A1 because the neighbouring area A2 has a business to provide ‘t’ which is very near to the customers in A1, so the recommended business in A1 will have less scope.

Figure 4.
Graphical Plate Model of BC-LDA.

Figure 5.
The CBA-Ratio comparision of our algorithm with kNN. The graph shows that our algorithm produces better CBA-Ratio in all three datasets.
Figure 5.
The CBA-Ratio comparision of our algorithm with kNN. The graph shows that our algorithm produces better CBA-Ratio in all three datasets.

Figure 6.
kNN generate more useless businesses and thus has increased AST in all three datasets while compared with our algorithm.
Figure 6.
kNN generate more useless businesses and thus has increased AST in all three datasets while compared with our algorithm.

Figure 7.
The AST increases when business recommendation is not done. The above graph explains how AST decreases when correct visualization is made.
Figure 7.
The AST increases when business recommendation is not done. The above graph explains how AST decreases when correct visualization is made.

Figure 8.
The fig explains that using business coverage, the number of business is less and gives better business coverage than without using BC-LDA.
Figure 8.
The fig explains that using business coverage, the number of business is less and gives better business coverage than without using BC-LDA.


Table 1.
Notations used in BC-LDA.
| Symbols | Meaning |
|---|---|
| , , | Dirichlet priors on Multinomial distributions |
| N | Number of services |
| M | Number of businesses |
| W | Represent each mapping of service and business |
| Represents the Non-correlated service-business distribution | |
| Represents the correlated service-service distribution | |
| I | Correlated business assignment for a service |
| T | Non-correlated business assignment for a service |
| Represents business distributions |
Table 2.
Dataset Description.
| Dataset | Total Business | Average Services per Business | Average Business per Area |
|---|---|---|---|
| Restaurant Dataset | 456,288 | 14 | 12 |
| Synthetic (uniform) | 100,000 | 15 | 10 |
| Synthetic (Skew) | 100,000 | 15 | 10 |
© 2020 by the authors. Licensee MDPI, Basel, Switzerland. This article is an open access article distributed under the terms and conditions of the Creative Commons Attribution (CC BY) license (http://creativecommons.org/licenses/by/4.0/).
Share and Cite
MDPI and ACS Style
P, A.K.; G, S.S.; Maddikunta, P.K.R.; Gadekallu, T.R.; Al-Ahmari, A.; Abidi, M.H. Location Based Business Recommendation Using Spatial Demand. Sustainability 2020, 12, 4124. https://0-doi-org.brum.beds.ac.uk/10.3390/su12104124
AMA Style
P AK, G SS, Maddikunta PKR, Gadekallu TR, Al-Ahmari A, Abidi MH. Location Based Business Recommendation Using Spatial Demand. Sustainability. 2020; 12(10):4124. https://0-doi-org.brum.beds.ac.uk/10.3390/su12104124
Chicago/Turabian StyleP, Ashok Kumar, Shiva Shankar G, Praveen Kumar Reddy Maddikunta, Thippa Reddy Gadekallu, Abdulrahman Al-Ahmari, and Mustufa Haider Abidi. 2020. "Location Based Business Recommendation Using Spatial Demand" Sustainability 12, no. 10: 4124. https://0-doi-org.brum.beds.ac.uk/10.3390/su12104124
Note that from the first issue of 2016, this journal uses article numbers instead of page numbers. See further details here.