Article

Flood Risk Assessment for the Long-Term Strategic Planning Considering the Placement of Industrial Parks in Slovakia

1
Department of Ecology and Environmental Sciences, Faculty of Natural Sciences, Constantine the Philosopher University in Nitra, 949 74 Nitra, Slovak Republic
2
Department of Landscape Planning and Land Consolidation, Faculty of Horticulture and Landscape Engineering, Slovak University of Agriculture in Nitra, 949 76 Nitra, Slovak Republic
3
Department of Landscape Planning and Design, Faculty of Ecology and Environmental Sciences, Technical University in Zvolen, 960 01 Zvolen, Slovak Republic
4
Department of Applied Ecology, Faculty of Ecology and Environmental Sciences, Technical University in Zvolen, 960 01 Zvolen, Slovak Republic
5
Department of Development and Environmental Studies, Faculty of Science, Palacký University Olomouc, 771 47 Olomouc, Czech Republic
*
Author to whom correspondence should be addressed.
Sustainability 2020, 12(10), 4144; https://0-doi-org.brum.beds.ac.uk/10.3390/su12104144
Submission received: 28 March 2020 / Revised: 13 May 2020 / Accepted: 14 May 2020 / Published: 19 May 2020
(This article belongs to the Special Issue Flood Risks, Vulnerability and Governance)

Abstract

:
The intention of the article is to demonstrate how data from historical maps might be applied in the process of flood risk assessment in peri-urban zones located in floodplains and be complementary datasets to the national flood maps. The research took place in two industrial parks near the rivers Žitava and Nitra in the town of Vráble (the oldest industrial park in Slovakia) and the city of Nitra (one of the largest industrial parks in Slovakia, which is still under construction concerning the Jaguar Land Rover facility). The historical maps from the latter half of the 18th and 19th centuries and from the 1950s of the 20th century, as well as the field data on floods gained with the GNSSS receiver in 2010 and the Q100 flood line of the national flood maps (2017), were superposed in geographic information systems. The flood map consists of water flow simulation by a mathematical hydrodynamic model which is valid only for the current watercourse. The comparison of historical datasets with current data indicated various transformations and shifts of the riverbanks over the last 250 years. The results proved that the industrial parks were built up on traditionally and extensively used meadows and pastures through which branched rivers flowed in the past. Recent industrial constructions intensified the use of both territories and led to the modifications of riverbeds and shortening of the watercourse length. Consequently, the river flow energy increased, and floods occurred during torrential events in 2010. If historical maps were respected in the creation of the flood maps, the planned construction of industrial parks in floodplains could be limited or forbidden in the spatial planning documentation. This study confirmed that the flood modelling using the Q100 flood lines does not provide sufficient arguments for investment development groups, and flood maps might be supplied with the data derived from historical maps. The proposed methodology represents a simple, low cost, and effective way of identifying possible flood-prone areas and preventing economic losses and other damages.

1. Introduction

In the past, urban areas were often built near rivers, but not so close as to be threatened by water [1] (Figure 1). Today, the increase of the population is constantly causing larger occupation of the landscape, especially of agricultural land. As a result of this trend, buildings and technical features are in many cases inappropriately placed in the landscape [2]. In flood-prone areas, high-quality agricultural lands are illogically occupied by industrial activities. The main problem of floods in industrial parks built up in peri-urban zones is the location of industrial properties in inundation areas which are highly vulnerable to regular or torrential floods. Industrial parks and their development are often forced in territorial plans by investment groups strongly affecting decision making processes with finances and political power [3]. In recent times, floods are the major natural hazards that cause loss of life and huge damage to infrastructure. These consequences are reflected in social, economic, and environmental spheres [4,5,6,7,8,9]. Their impact is increasing due to rapid urbanization [10,11,12,13,14].
The aim of our research is to find the possibilities of using historical maps in the process of flood risk assessment in peri-urban zones in floodplains.
There exist some methodical approaches [8] on flood risk assessment specifically intended to help industrial companies understand expected flood risk and consequential economic losses and social impact. Ryu et al. (2016) developed a method on the vulnerability of industrial parks to floods. The assessment indices included climatic factors, sensitivity, and adaptability of industrial parks to floods concerning preventive measures against the disaster [9]. Besides conceptual methodical approaches, Geographic Information System (GIS) hydraulic models are common for natural hazards—flood assessment [15,16], which resulted into the development of flood maps [17]. Currently, high-end technologies have become very popular, and machine learning has been involved in flood risk management and assessment [18].
However, the first indication of a flooded area can be simply adopted from historical maps and illustrations. Considering the uncertainty of historical data [19], only a conceptual framework of historical data application into strategic flood risk assessment is specified in the aim of the article. Processing of historical datasets in flood maps is described in detail in the methodology. Managing floods has a long tradition in the UK [20]. Local planning authorities in the UK have a responsibility to carry out a strategic flood risk assessment for their territories. Strategic flood risk assessment reports remind us that historical fluvial events have to be considered as a relevant factor in flood risk planning and management [21,22]. Historical maps from different time periods provide an insight into the extent of previously flooded areas. Such data have never been implemented into the long-term strategic planning documentation used for the assessment of the location of industrial parks in peri-urban zones in Slovakia. Alluvial plains, to which historically based information on floods is linked or which have often been used due to their natural conditions as waterlogged meadows, need to be identified. The ancestors gained knowledge and experience for several generations and managed waterlogged alluvial plains in a sustainable way. Therefore, inventory maps of historical floods constitute a dataset which enters into the processing of flood susceptibility maps, and machine learning methods are used in calculations of the spatial relationships between historical floods and influencing factors [23]. A rational placement of urban areas into the landscape is important because climate change is bringing more frequent and heavier storms, which will increase flood risks [24,25,26].

2. Flood Protection in the Slovak Republic and Building Industrial Parks in Peri-Urban Zones

Industrialized countries exhibited a pronounced movement of economic activities from the residential areas to industrial parks. Therefore, agricultural areas, which should act as buffer zones between built-up areas and the countryside, were transformed into industrial zones at a high rate [27]. A similar process was observed in the presented study areas—industrial parks in Nitra and Vráble.
Generally, flood maps are used for the flood risk assessment, and they are the ground material for strategic and territorial planning of urban and industrial zones. The Slovak Republic, as a European Union member state, is required to establish flood risk management plans in accordance with the documents of the European Union (such as Flood Risk Management Plans for the Danube River Basin District of 2015 until 2021 [28]—Table 1). The legislative framework of flood protection is based on Act no. 71/2015 Coll. [29], amending Act No. 7/2010 Coll. on protection against floods as amended by Act No. 180/2013 as a result of the transposition of Directive 2007/60/EC of the European Parliament and of the Council for the assessment and management of flood risks [30]. This Directive requires the Member States of the European Union to prepare for the preliminary flood risk assessment and the preparation and updating of flood maps.
The flood map concepts include flood hazard maps and flood risk maps. They are available to the public on the website of the Ministry of the Environment of the Slovak Republic, as well as on the website of the Slovak Water Management Enterprise, a state enterprise.
At the national level, there has been a binding document “Strategy for Flood Protection to 2020” since 2013 [31]. Planned projects of this strategy include measures on the river Žitava, because of the huge damage that occurred there due to the floods in 2010. Local water managers will help individual municipalities to maintain watercourses, for example, dredging the bottom or modifying the riverbanks.
Act No. 193/2001 Coll. [32] in support of the establishment of industrial parks defines an industrial park in the territory of the Slovak Republic as a territory delineated in a zoning plan of the municipality or the zone, on which industrial production or services of a single or several business entities are performed or are to be performed. Strategic documents of the Slovak Republic do not include predefined localization of industrial parks. On the other hand, the amount of unused space does not exclude the creation of new industrial parks in its area. The Slovak Spatial Development Perspective 2001, as amended by the Slovak Spatial Development Perspective 2011 does not specify a precise localization of industrial parks in the area, but proposes the arrangement and hierarchization of economic agglomerations in international and national contexts. It depends on the potential of the area [33].
At the regional level, the gestor of flood protection is the district office at the seat of a region. In the Nitra region, flood protection is in the hands of two departments. The strategic document of the Nitra region, “Program of the Economic and Social Development of the Nitra Self-Governing Region 2016–2022”, defines the implementation of preventive measures under Priority V: Environment—Measures to ensure the protection of the area against floods. This measure includes activities which limited the urbanization in floodplains [34].
It is necessary to provide updates of several development documents to consider landscape changes and its impact on the development of current human activities.

3. Materials and Methods

The methodology consists of the following steps:
-
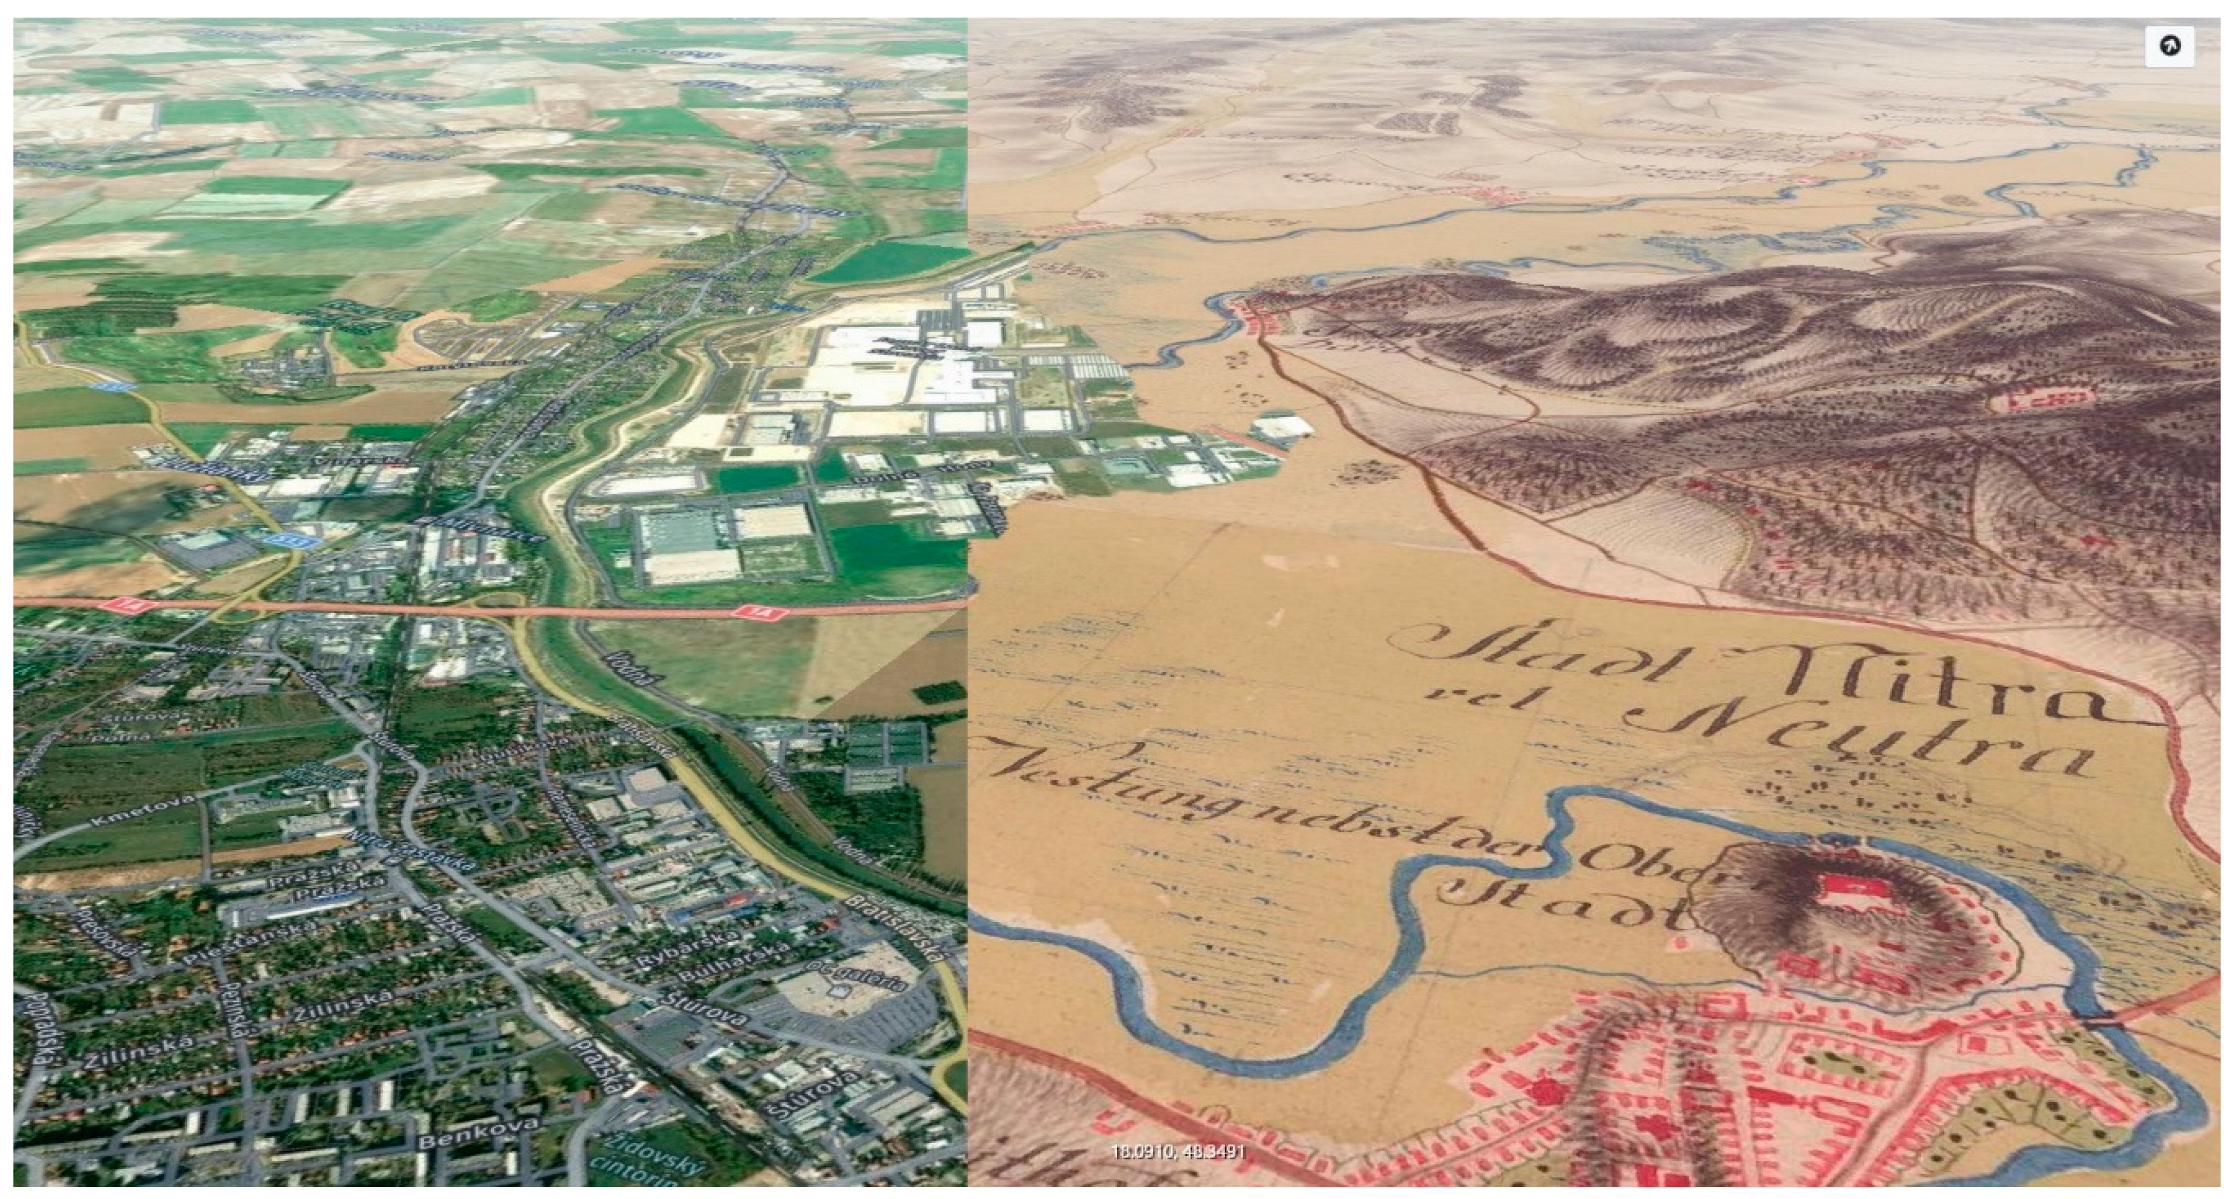
A multi-temporal analysis of watercourses from historical maps;
-
flood maps creation methodology; and
-
superposition of historical and current geodata on watercourses and extracted Q100 flood line from flood maps.

3.1. Historical Datasets

To determine the predisposition of a site related to a flood occurrence, a multi-temporal analysis of watercourses from historical maps was performed. In the article, maps created during the existence of the Austro-Hungarian Monarchy were used, particularly maps from the First Military Survey 1763–1787, the Second Military Survey 1806–1869, and the Third Military Survey 1869–1887 [35]. River banks and wetlands, which existed in the study sites during the latter half of the 18th century and the 19th century, were identified. We took into consideration the fact that the use of historical maps is restricted due to uncertain information in historical maps. Some historical objects can be hardly compared or cannot be compared with objects in actual maps due to significant changes in the study area over the last two centuries [19]. Orthophoto maps from 1950 were used to identify the riverbeds and levees of Nitra and Žitava rivers before extensive modifications of their watercourses.
Historical geodata were accessed through public Web Map Services (WMS), and the following raster geodata were applied in the study:
  • The historical orthorectified imagery (1950) was created within the project of the Center of Excellence for Support of Decision Making in Forest and Landscape, Technical University in Zvolen. Available at: http://mapy.tuzvo.sk [36].
  • The First (1763–1787), Second (1806–1869), and the Third Military (1869–1887) Surveys of the Hungarian part of the Habsburg Empire [37,38].
  • Historical orthoimagery (2010) © GEODIS SLOVAKIA, s.r.o. and Historical LMS © Topographical Institute of Banská Bystrica [36].
  • Orthophotomaps (2017) © EUROSENSE, s.r.o. and GEODIS SLOVAKIA, s.r.o. [39].

3.2. Flood Map Sources, Field Research (2010) and Methods

Concerning the industrial park in Nitra, the Q100 flood line was not drawn in the flood map because the state enterprise that ensures the creation of flood maps did not identify any flood risk in this location. An available DTM 5.0 (S-JTSK) model was created at a time when the foundations of the emerging industrial park had already been under construction, and the terrain indicating the occurrence of original watercourses was disturbed by building material which would not provide an adequate picture of the terrain condition before the construction of industrial park. A study carried out for the Slovak Water Management Enterprise was chosen to evaluate the state of flood protection of the area just before the construction of the strategic industrial park. The study was based on DTM with RMSExyz ≤ 0.25 m from 2013 under a proprietary license. The method of the flood map processing for the Slovak Republic consists of the use of steady uneven water flow simulation by a mathematical hydrodynamic model [40].
The flood observed in 2010 was used as an input model for the study of hydrological modeling. Based on this flood event, the data for the study site in the district of Nitra were drawn, and they were used to verify the assumption that the Q100 flood line was created within the state flood maps. [40]. It reflects the probable scenario of such an event in Vráble.
The extent of the flood in 2010 was identified directly by the field observation using the GNSS Receiver (Topcon GRS-1), and where no direct recording was made, photographic documentation from the relevant days was used.
In the flood map, ArcGIS Enterprise ver. 10.8 was used to show the flood extent for Q100 by using vector lines.
The construction of the strategic park began in 2016, and changes in the field were made in response to hydrological modelling from the 1st quarter of the same year. The DTM with a comparable accuracy, which was available for this study, is from 2017 and reflects the state of the area only after landscaping caused by heavy mechanisms. Therefore, it was not used. Weak points of flood control measures for the industrial park in Nitra were therefore selected from the hydrological model, which was developed for the Slovak Water Management Company, based on measurements of the transverse profile of the riverbed using sonar in 2015. The software tool MIKE 21 FM, version 2014 (MIKE by DHI), was used to compile the 2D model and model simulation. The output and result of MIKE 21 FM model are values of water level altitudes, water depths, and data on the speed and direction of water flow. The output from the model provides a realistic view of the hydraulic conditions of water flow in the Nitra riverbed. It provides information on the course of the flood level, water depth, distribution of velocities, and flow directions in the entire modelled area.

3.3. Superposition of Historical and Current Geodata on Watercourses and the Q100 Flood Line

Geodata were processed in the GIS application ArcGIS Enterprise 10, and maps were geo-rectified in the S-JTSK / Krovak East North coordinate system (EPSG 5514). A graphical editor GIMP 2.10.8. was used for non-spatial post-processing and minor graphic modifications.
The watercourse of the river Nitra and its channels was vectorized from the orthophoto maps (2017). Residential zones were vectorized from historical orthophoto maps (1950) and industrial zones were vectorized from historical (1950) and recent orthophoto maps (2010).
The Q100 flood line was adopted from the national flood maps and vectorized.
Superposition and visual comparison of historical geodata from historical maps (1763–1787, 1806–1869, 1869–1887, 1950), current geodata from orthophoto maps (2010, 2017), and the Q100 flood line were used to demonstrate historical transformations and shifts of the Nitra watercourse in the alluvial plain, particularly in the locality where the questioned industrial park was built-up. It was used to prove the existence of watercourse and the existence of water-logged areas in the study site as well.

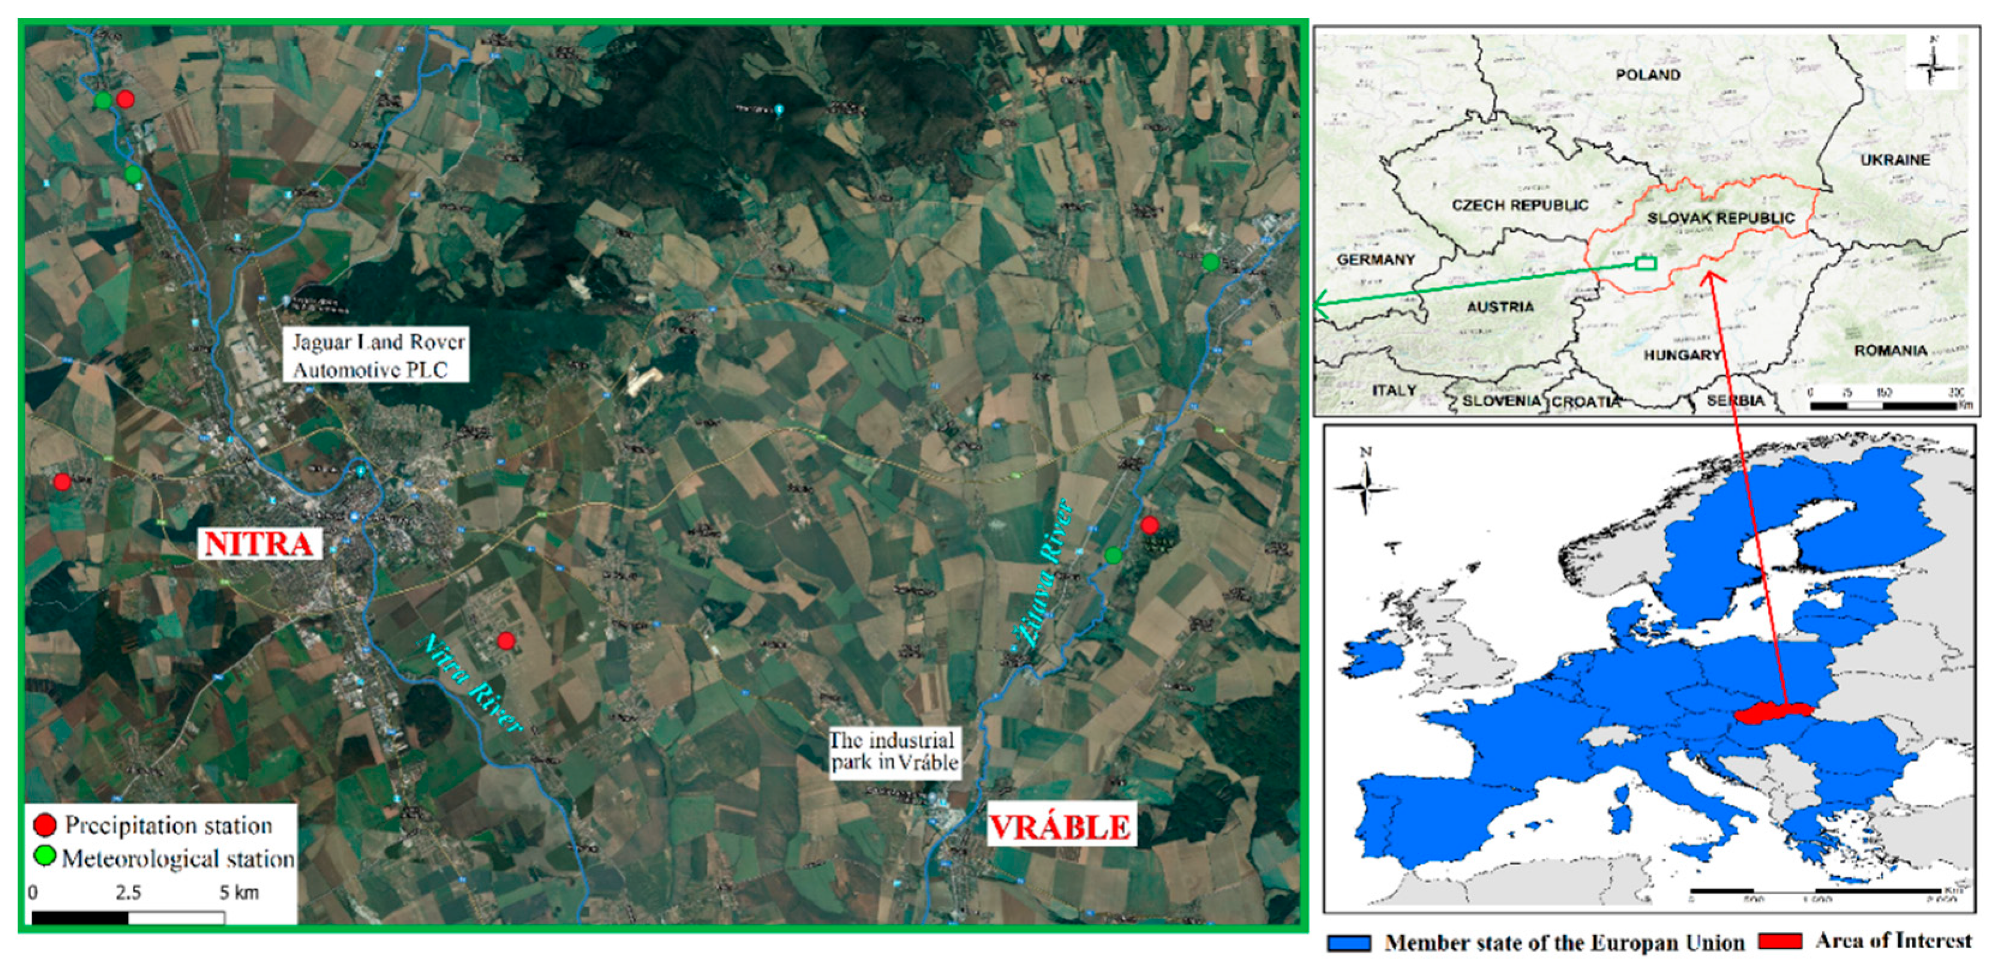
3.4. Case Study Sites

The industrial park in Nitra is situated not only in the city districts of Dražovce, Mlynárce, and Zobor, but also in cadastral areas of villages Lužianky and Čakajovce. In 2012, the mentioned locality was included in the landscape ecological classification of the contact zones of the city Nitra as a plane field type [41]. All the localities belong to the Nitra River Basin. The river Žitava flows through the town of Vráble. From a geomorphological point of view, the cadastral areas are located on the Danubian upland (subdivisions—the Nitrianska niva, the Nitrianska pahorkatina upland, and the Hronská pahorkatina upland), which has a major influence on the surface drainage regime. On the basis of the geological structure, these localities are situated on the subsoil formed in the Neogene, consisting predominantly of gray and varied clay, silts, sands, gravels, lignite, freshwater limestones, and tuffite horizons.
Nitra and Žitava rivers, which pass through the research localities, are characterized by a rainfall-snow drainage regime. This type of regime is typical for upland–lowland areas of Slovakia (lowlands, basins, and low mountains). The minimum flow of water is at the end of the summer in the dry season (September). The maximum flow of water is multiple snowfalls combined with rainfall at the end of winter (February). During dry summers, the transpiration capacity of soils is reduced. The floods that occurred in Slovakia in May and June 2010 were, from a hydrological point of view, exceptional due to their time and space distribution (Figure A1). Due to the meteorological situation and its development, the whole of Slovakia was gradually affected, and the flood situation was present in almost all the catchments. Such present occurrences of floods in different parts of Slovakia had not yet been recorded in the history of hydrological observation. The development of the meteorological situation in April and May caused the repeated occurrence of intense precipitation, which resulted in flood waves over a short period of time in individual river basins. Sudden and strong storms meant that compacted soils could not soak up water fast enough. It caused a disturbance of the natural cycle of water in the landscape. High levels of groundwater also caused great problems. The results of these processes were floods and inappropriate water accumulation in the landscape.
The research areas are in the Nitra River Basin, in the Nitra region (the southwest of Slovakia, Figure 2).
Two case studies of industrial parks presented in the article are in the peri-urban zones of the city Nitra and the town Vráble (the southwest of Slovakia). Both industrial parks are located in flood-prone areas, and both were flooded in the past decades. Significant flood waves occurred in 1931, 1941, 1960, 1977, 1986 [42], 2006, and 2010. Floods occur mainly in February-April and account for 55% of all peaks.
The industrial park in Vráble was flooded by the river Žitava in 2010. Despite the evidence of the floods that had occurred in the past, the government allowed the construction of the Jaguar Land Rover (JLR) plant in a similar flood-prone area in the city of Nitra. The construction of the strategic industrial park began in September 2016. Some facilities are still under construction, with announcements that the industrial park will expand to a significantly larger area as one of the biggest ever foreign direct investments in a Central European nation [43].
The District Office in Nitra and the Department of Environmental Care were competent authorities for the assessment of the impact of industrial parks on the environment. At the beginning of July 2015, the government of the Slovak Republic certified the entire area of the industrial zone in the Nitra North Strategic Park (an area of approximately 500 ha) as a Significant Investment Status for the Strategic Park [44]. This decision was confirmed by JLR because Slovakia has a premium automotive sector, which represents 43% of the country’s overall industry. It has more than 300 suppliers in proximity and an excellent logistics infrastructure [45]. The Significant Investment Status for the Strategic Park allows the Slovak Republic to aggressively expropriate land in cases where the owners refuse to sell it at a specified price.
As Conticelli and Tondelli (2014) observed, a similar argument of development was further accelerated by municipal policies aiming at developing many industrial areas through the zoning planning model in order to enrich their territory and local economy, as well as thanks for the enhancement of car transport for employees and customers and truck transport for goods. Consequently, the impacts of this kind of land use planning have been, and are today, sometimes alarming. Furthermore, such a development, though seemingly favorable for the enterprises in the short term, results in serious disadvantages for both the economy and the environment in the long term [46].
The selection of this area was also reiterated in the Automotive Nitra Project—Stage 2 of 2016 from EKOCONSULT—enviro s.r.o.: The manufacturing enterprise will be built in the territory that follows the Nitra—North Strategic Park Zone, which was designed for industrial construction and nowadays includes industrial and business enterprises [47].
These almost full-scale floods caused the breakage of dykes, subterranean roads, landslides, and bridge destruction, as well as home demolition or partial destruction. Moreover, it resulted in flooded cellars and underground spaces (garages), contaminated drinking water in wells, flooded tracks and farmland, and destroyed crops. Five people died, and more than sixty were injured [48].
The extent of the built-up areas and adjacent parts in the territory of the town is an important indicator of future progressive development. By looking at the built-up areas, we can see the extent of the urbanization process, which has been ongoing since the 1950s. All human activities tend to expand. In most of the monitored areas, it can be considered as very imprudent. This leads to an increase in tension between the natural potential of the territory and human intentions. To confirm this standpoint, the data of water and precipitation stations from SHMÚ (Slovak Hydrometeorological Institute) were used. Based on these data, it is possible to see indicators that led to the formation and course of floods in the locations of our interest. Precipitation station data consist of daily flows from the stations in Vieska nad Žitavou and Nitrianska Streda (2007–2016) and hourly flows (from 31 May to 5 July 2010). Other measuring stations were taken into account to understand broader contexts (Chynorany, Nadlice, Čáb-Sila, Zbehy, Andac, Obyce, Zlaté Moravce). During June 2010, several floods occurred in the Slovak Republic. The long-term rains in combination with heavy rainfalls were the main reasons for these floods. Two sites with predominant industrial activity as sample areas were chosen: Nitra—North Strategic Park, which extends in two urban areas and two adjacent municipalities, and the industrial park in Vráble. The Slovak Water Management Enterprise considered that measure to be sufficient for a long period of time. Despite that measure, there were unpredictable material damages during the floods. The main reason for this exacerbated situation was the intensive precipitation activity, followed by the drainage of water from the slopes of the Nitrianska pahorkatina upland. The information from the mayors of municipalities, inhabitants, and employees of local enterprises (Čakajovce-Dražovce agricultural cooperative) was used to analyze the extent of floods. The interpretation of the legislative and real situation in the field of flood protection presented in the introductory part of this article approximates the state of the flood problem solution in conditions of the Slovak Republic.
Floods in the industrial park in Vráble—On 1 June 2010, the heavy rain caused a significant rise of the water level of the river Žitava in Vráble. During the months of May (125.9 mm) and June (131.1 mm) in 2010, a rainfall intensity reached 257 mm at the meteorological station in Tesárske Mlyňany. According to Lapin et al. [49], this area is included in the warm climatic region with the mean annual precipitation totals of 550–600 mm [49,50]. In 2010, the total annual precipitation at this meteorological station was 920.8 mm. This was a really large number. The water level reached the first level of flood activity at 2:00. Two hours later, the river Žitava reached the third level of flood activity. The average annual water flow of the river Žitava (at the water station in Vieska nad Žitavou, located 10 km north of Vráble) represented values from 1 to 1.5 m3s−1 (Figure A2).
The flood culminated on 2 June 2010 at 6:00, when the height of the water level in the river Žitava rose up to 517 cm (Figure A3), with a flow of 51.7 m3s−1. This number was the highest measured value to date. A significant elevation of the river and subsequent spillage from the riverbed caused the flooding of agricultural fields, gardens, and residential and technical buildings. Flooding of the industrial park in Vráble stopped manufacturing in other factories, such as PSA Peugeot Citroën in the city of Trnava. The danger ceased on 6 May 2010 at 7:00, when the lowest level of flood activity (1st level) was abolished. The overflow of the river Žitava from the banks caused extensive economic and environmental damages. In Vráble, the damage cost 28,189.91 EUR (Figure 3). Flood damage data from individual companies in industrial parks could not be obtained. During this disaster, many roads and bridges were closed, and some houses were partially or completely destroyed.
The industrial park in Vráble (Figure 3a) is the oldest industrial park in Slovakia. It was built on a floodplain along the river Žitava. It was flooded due to heavy rainfall in 2010 (Figure 3b).
According to the representatives of Čakajovce and Dražovce granges, the groundwater even caused complications in the area where the Jaguar Land Rover industrial park is currently under construction. The damage caused to agricultural crops was estimated at around € 100,000 (Figure 4). The groundwater in the area is another problem for the developer.
The second location of interest is Drážovce industrial park in Nitra, whose construction is in progress. It is situated in the floodplain area of the river Nitra. Within this locality, no major flood events have yet occurred thanks to the measures that were taken in the past. As can be seen in Figure 4, this site is located in the alluvium of the river Nitra and is subject to a threat associated with excessive precipitation and subsequent floods in the Nitra River Basin.

4. Results

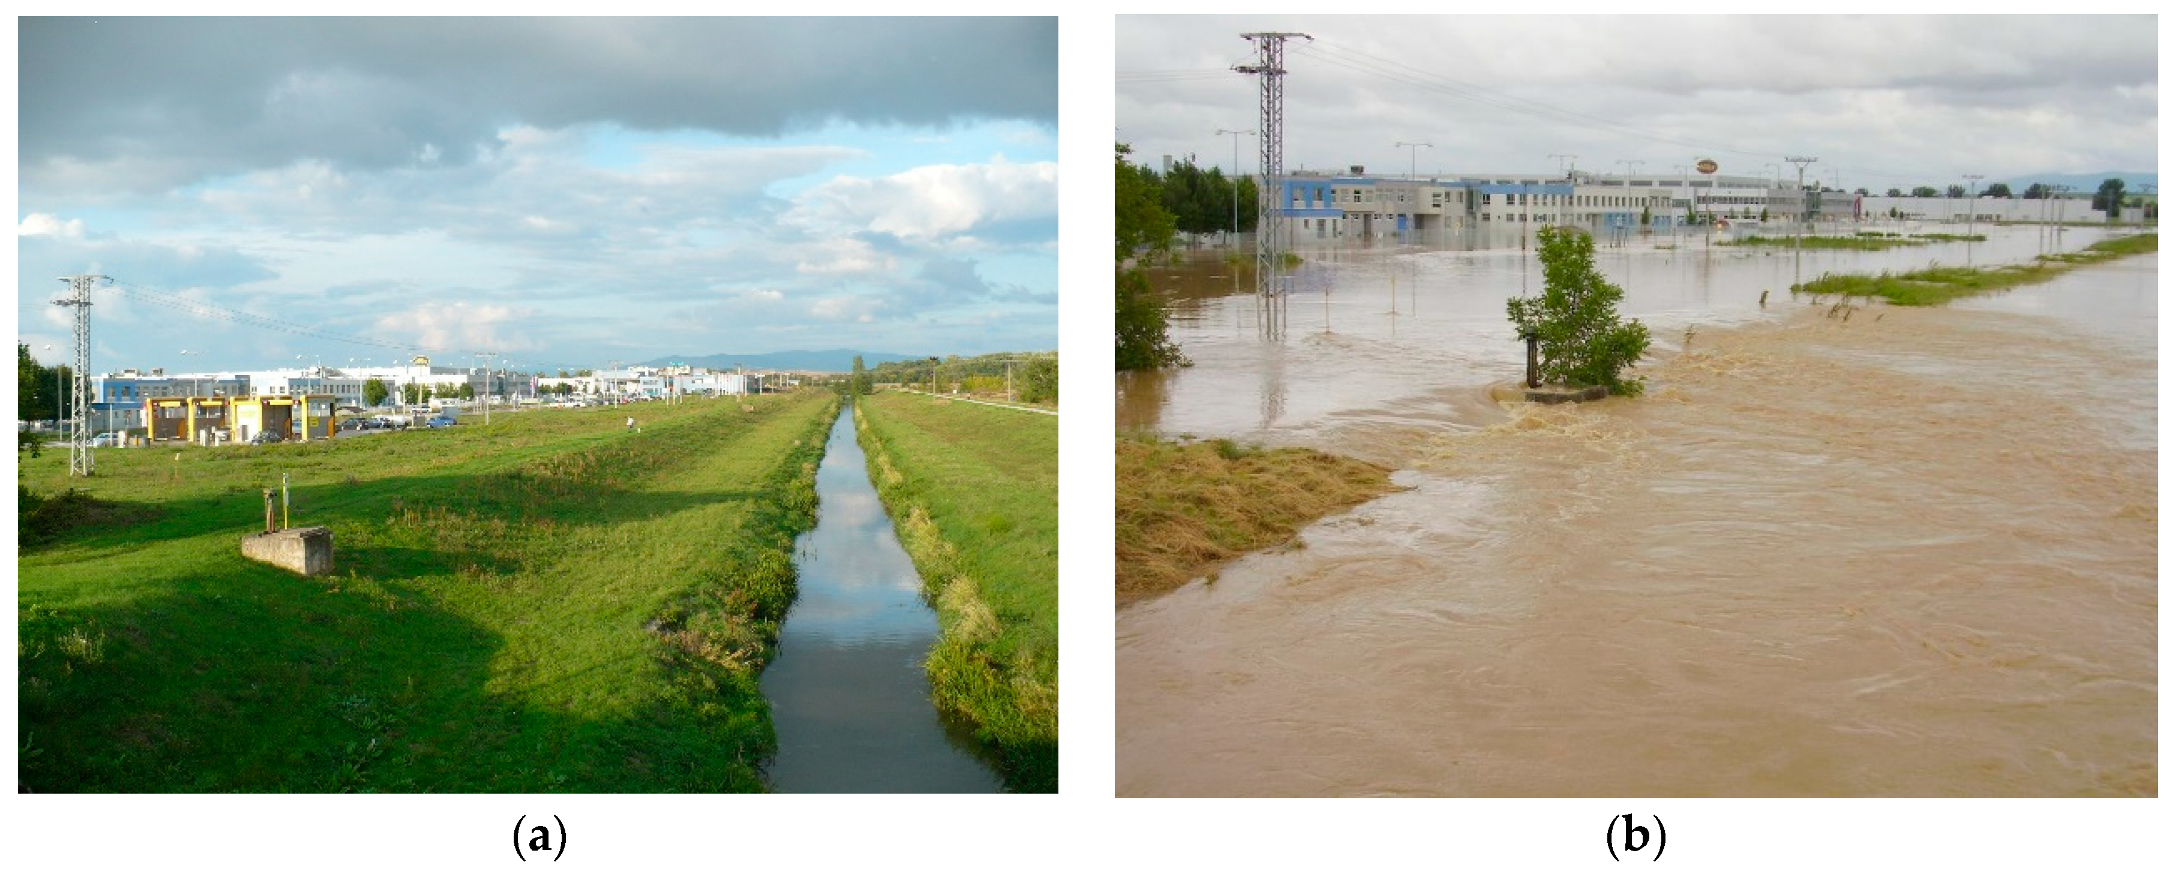
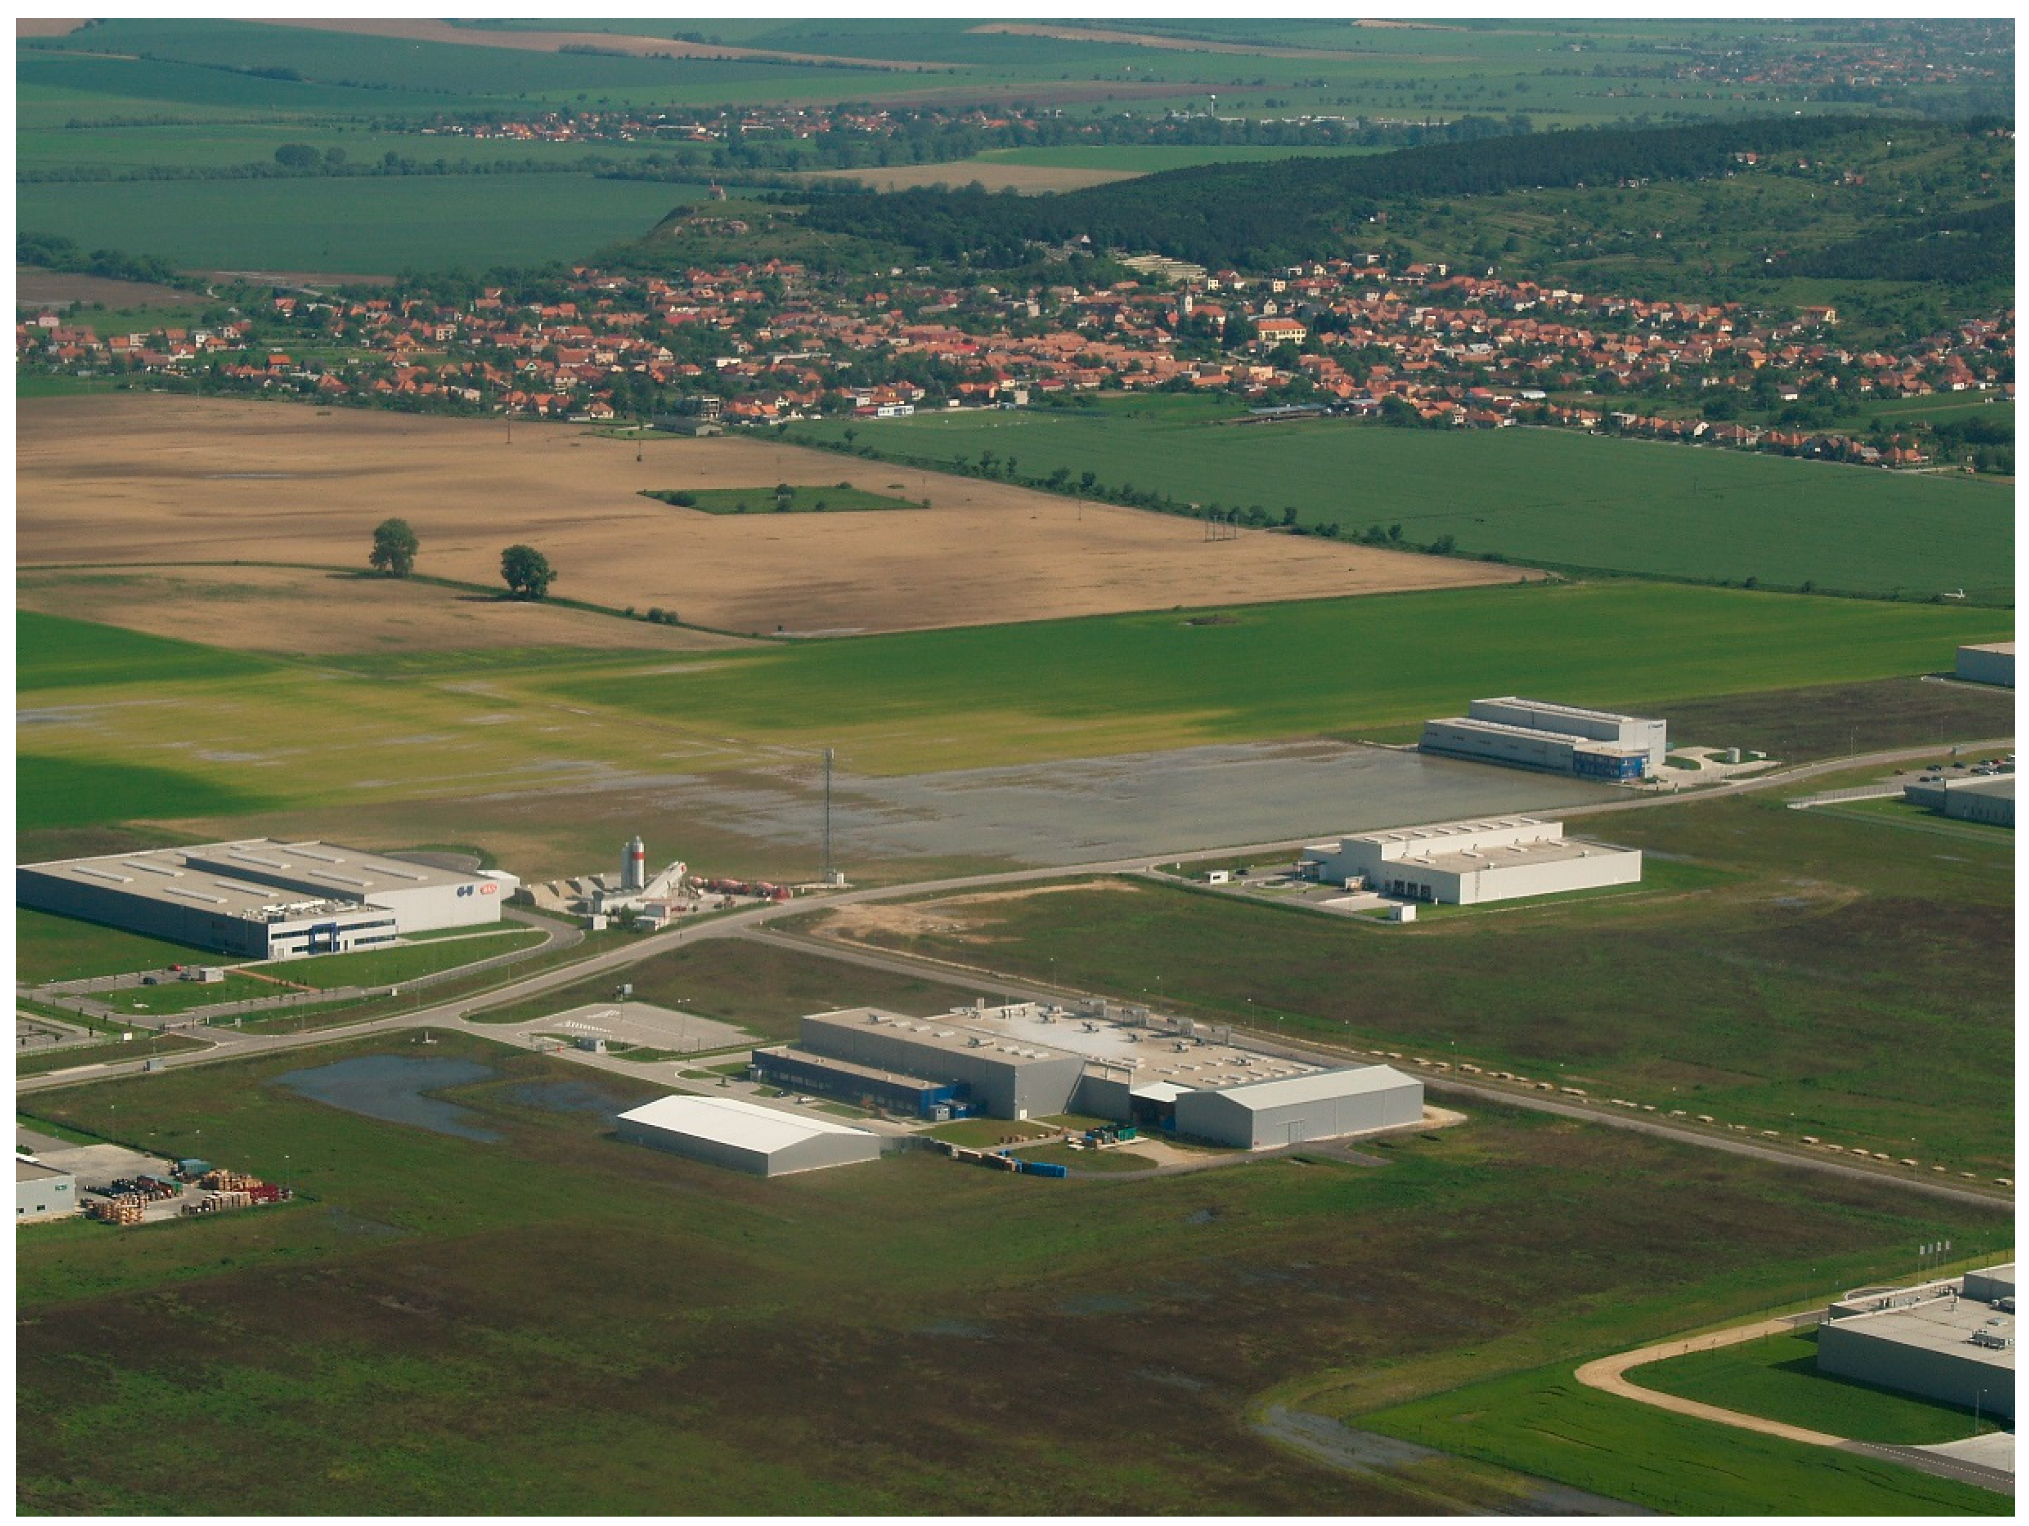
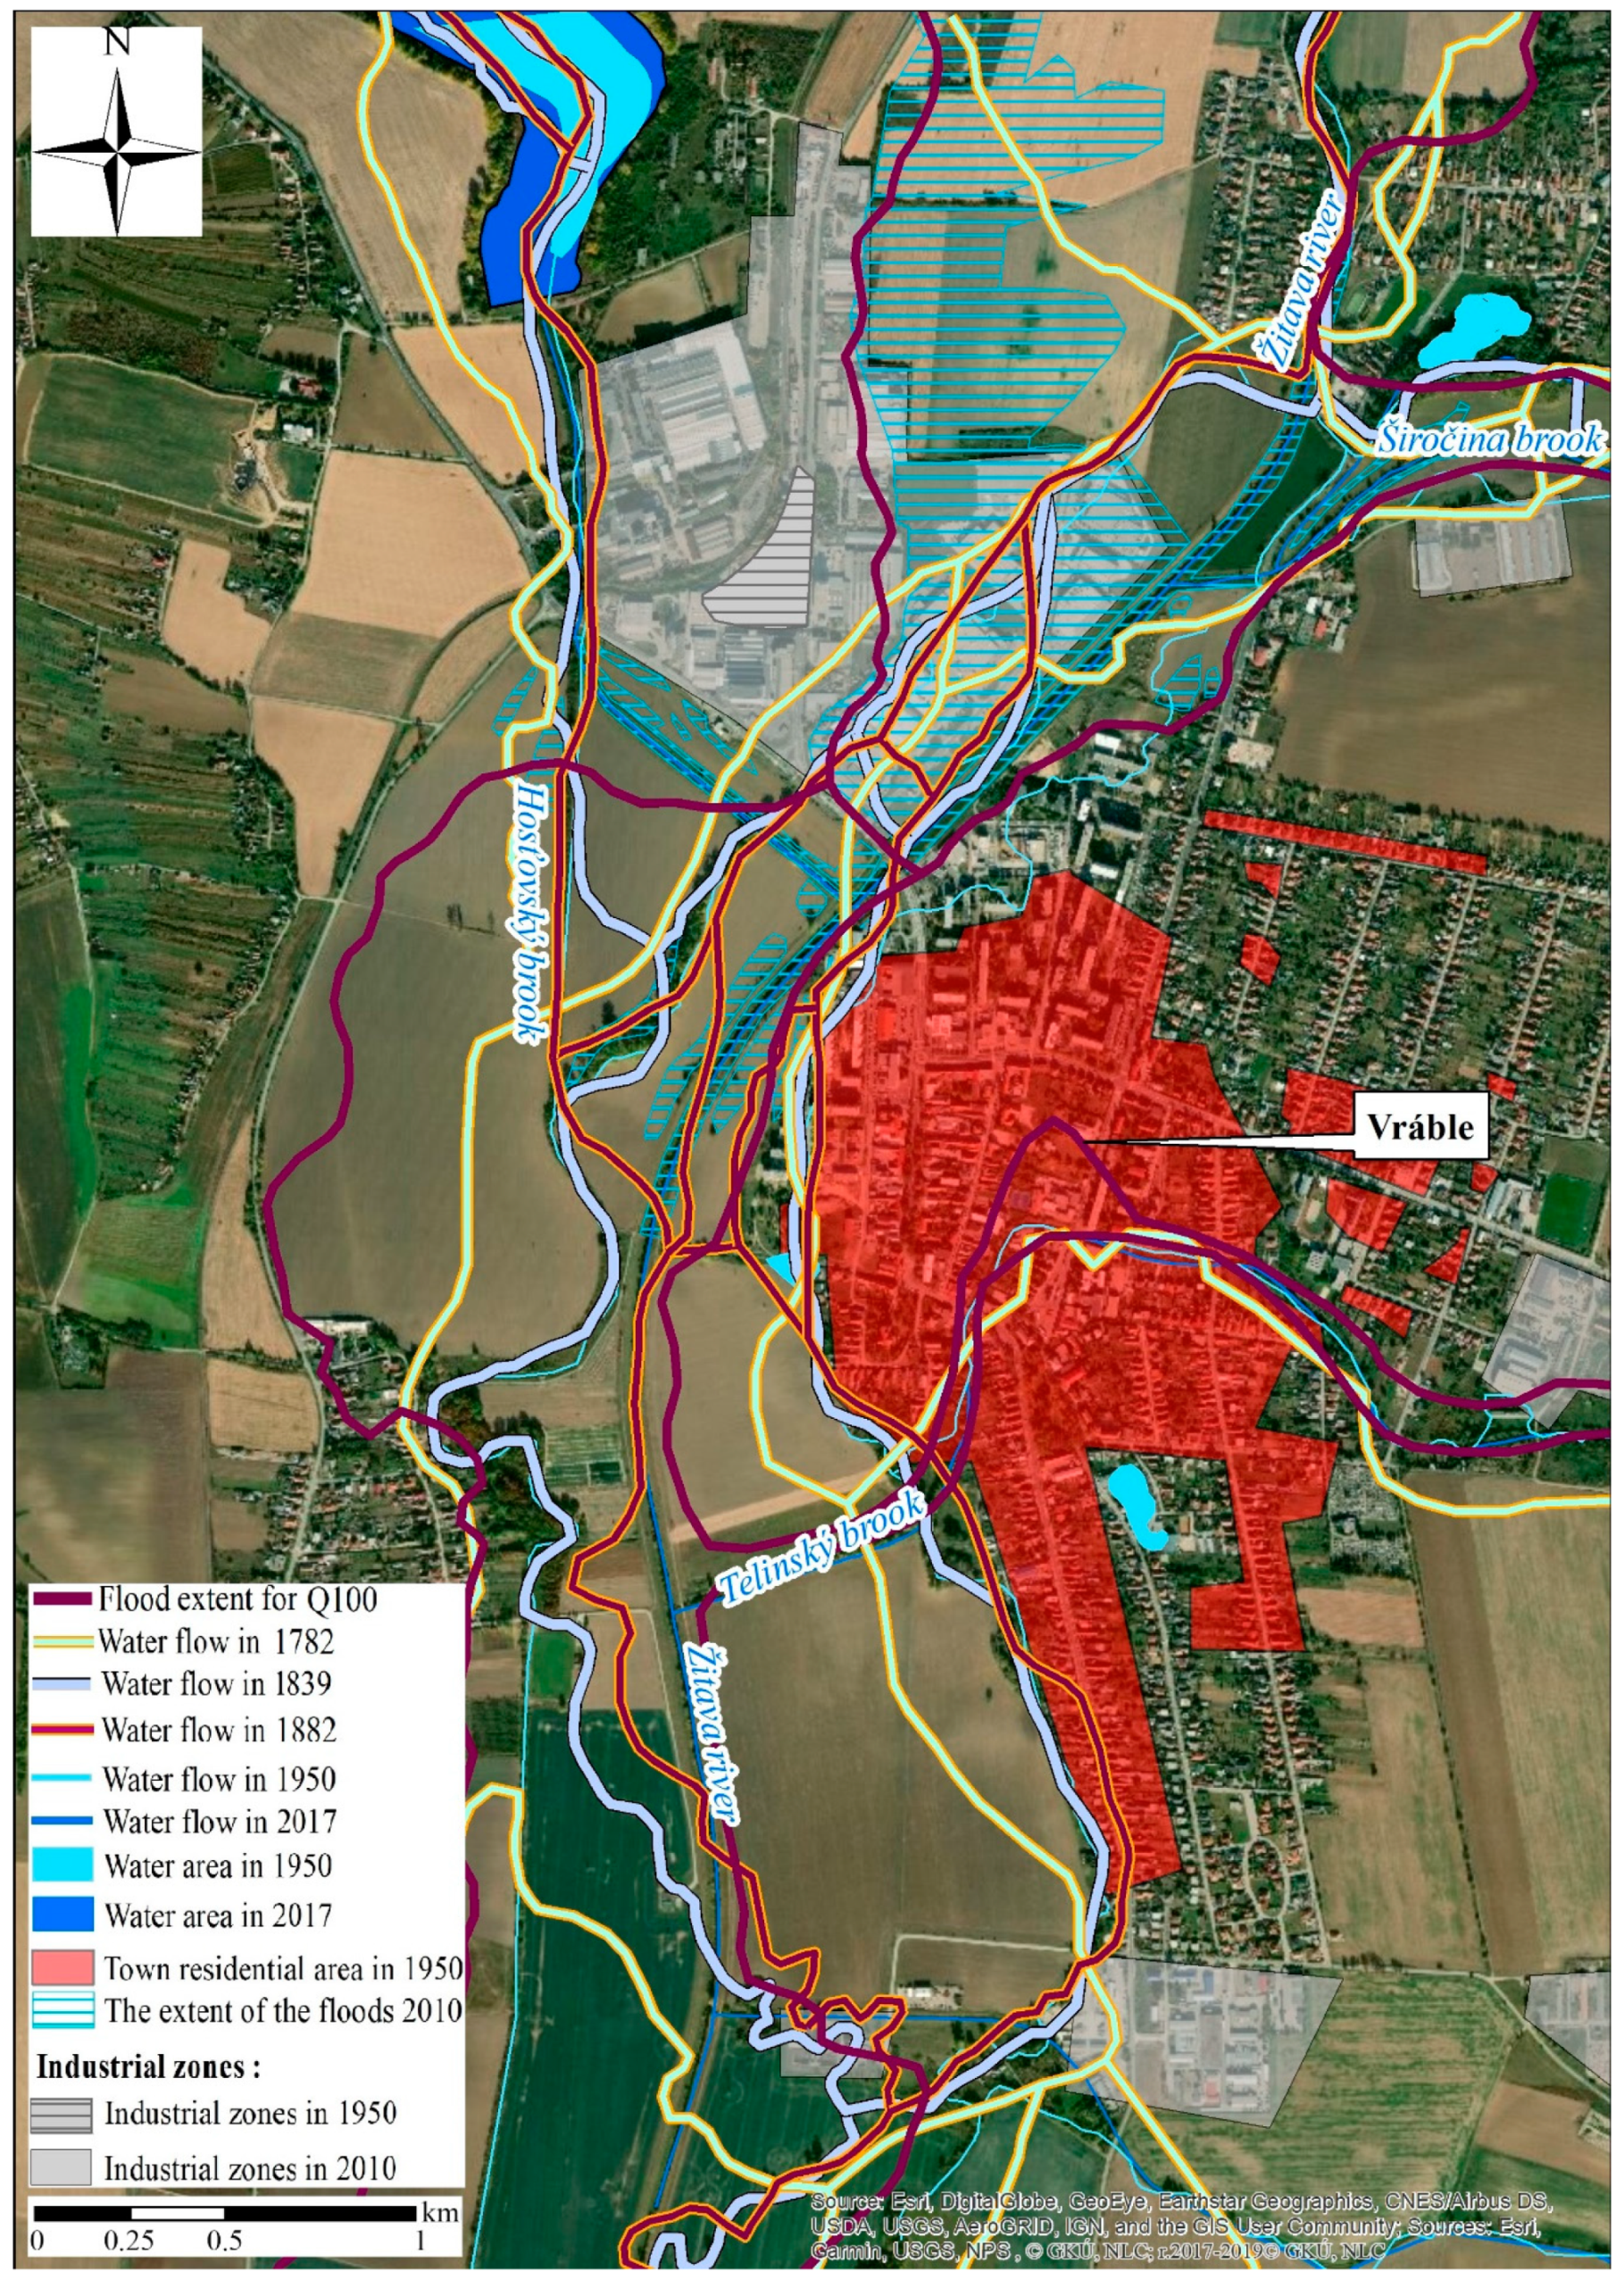
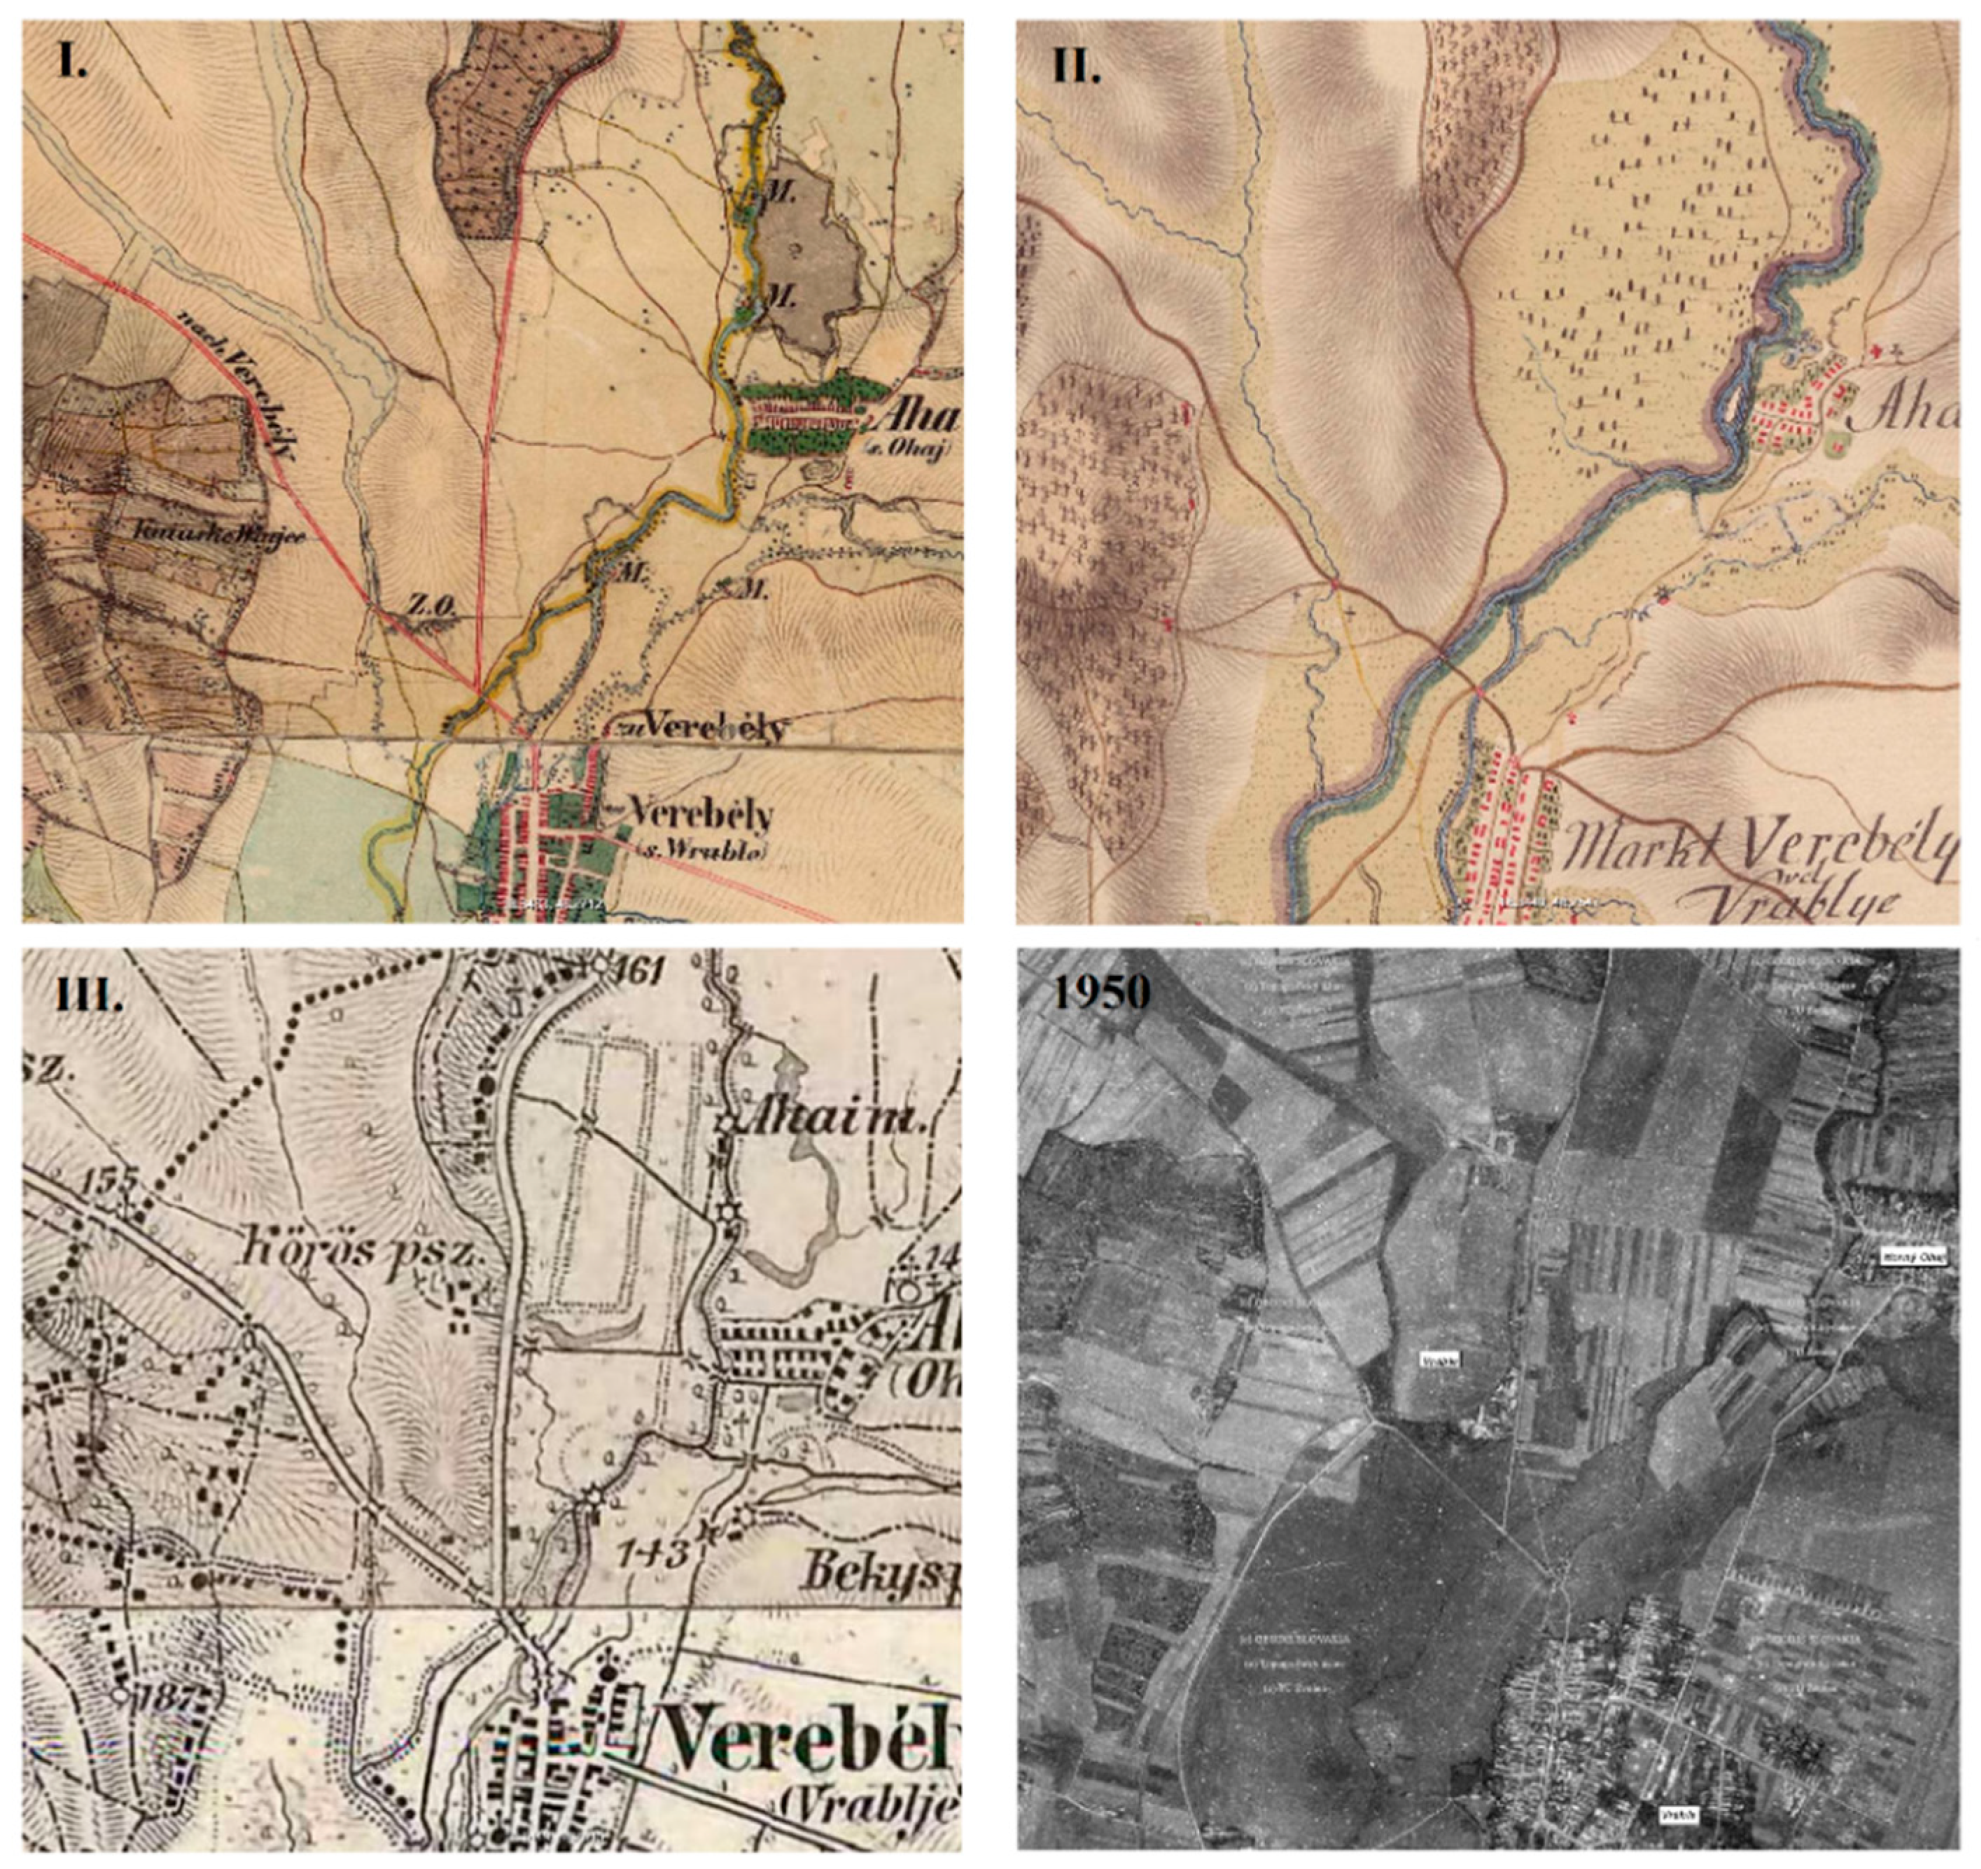
4.1. The Case Study of the Industrial Park in Vráble

Figure 5 shows the river Žitava together with its tributaries from the First Military Mapping (1763–1787) to 2017. The river regulations resulted in various changes to the Žitava riverbed. The most significant change was the shortening of the Žitava riverbed in relation to the straightening of the watercourse and the destruction of its meanders.
A visual comparison of the historical maps (Figure A4) and the Q100 flood line of the flood map (Figure 5) revealed that a large part of the industrial park in Vráble was built on the recent Žitava river branches. It is evident from the 18th century maps that the current riverbed of the river Žitava was, in fact, artificially created and served as a mill drive. The current riverbed is led by this branch, where industrial production is established. It was modified in the 20th century and, thus, is not a natural one. During floods, the river tends to approach its original bed. In the past, the land use management was in coincidence with natural predispositions, and floodplains were extensively used as meadows and pastures. This landscape character was preserved in the study site of the current industrial park until the period of Communist land reforms (until 1950) (Figure A4). The aim of the watercourse modifications during the reforms was to prevent economic damage. Due to the shortening of the watercourse length, the flow energy increased, and water found a space to escape from the riverbed. The intensification of land use and the reduction of space for water flow had the opposite effect, as can be seen from the map depicting the flood in 2010 and the Q100 flood line (Figure 5). A risk of floods still persists. During a possible flood event, more than half of the industrial park situated in the peri-urban zone would be flooded.

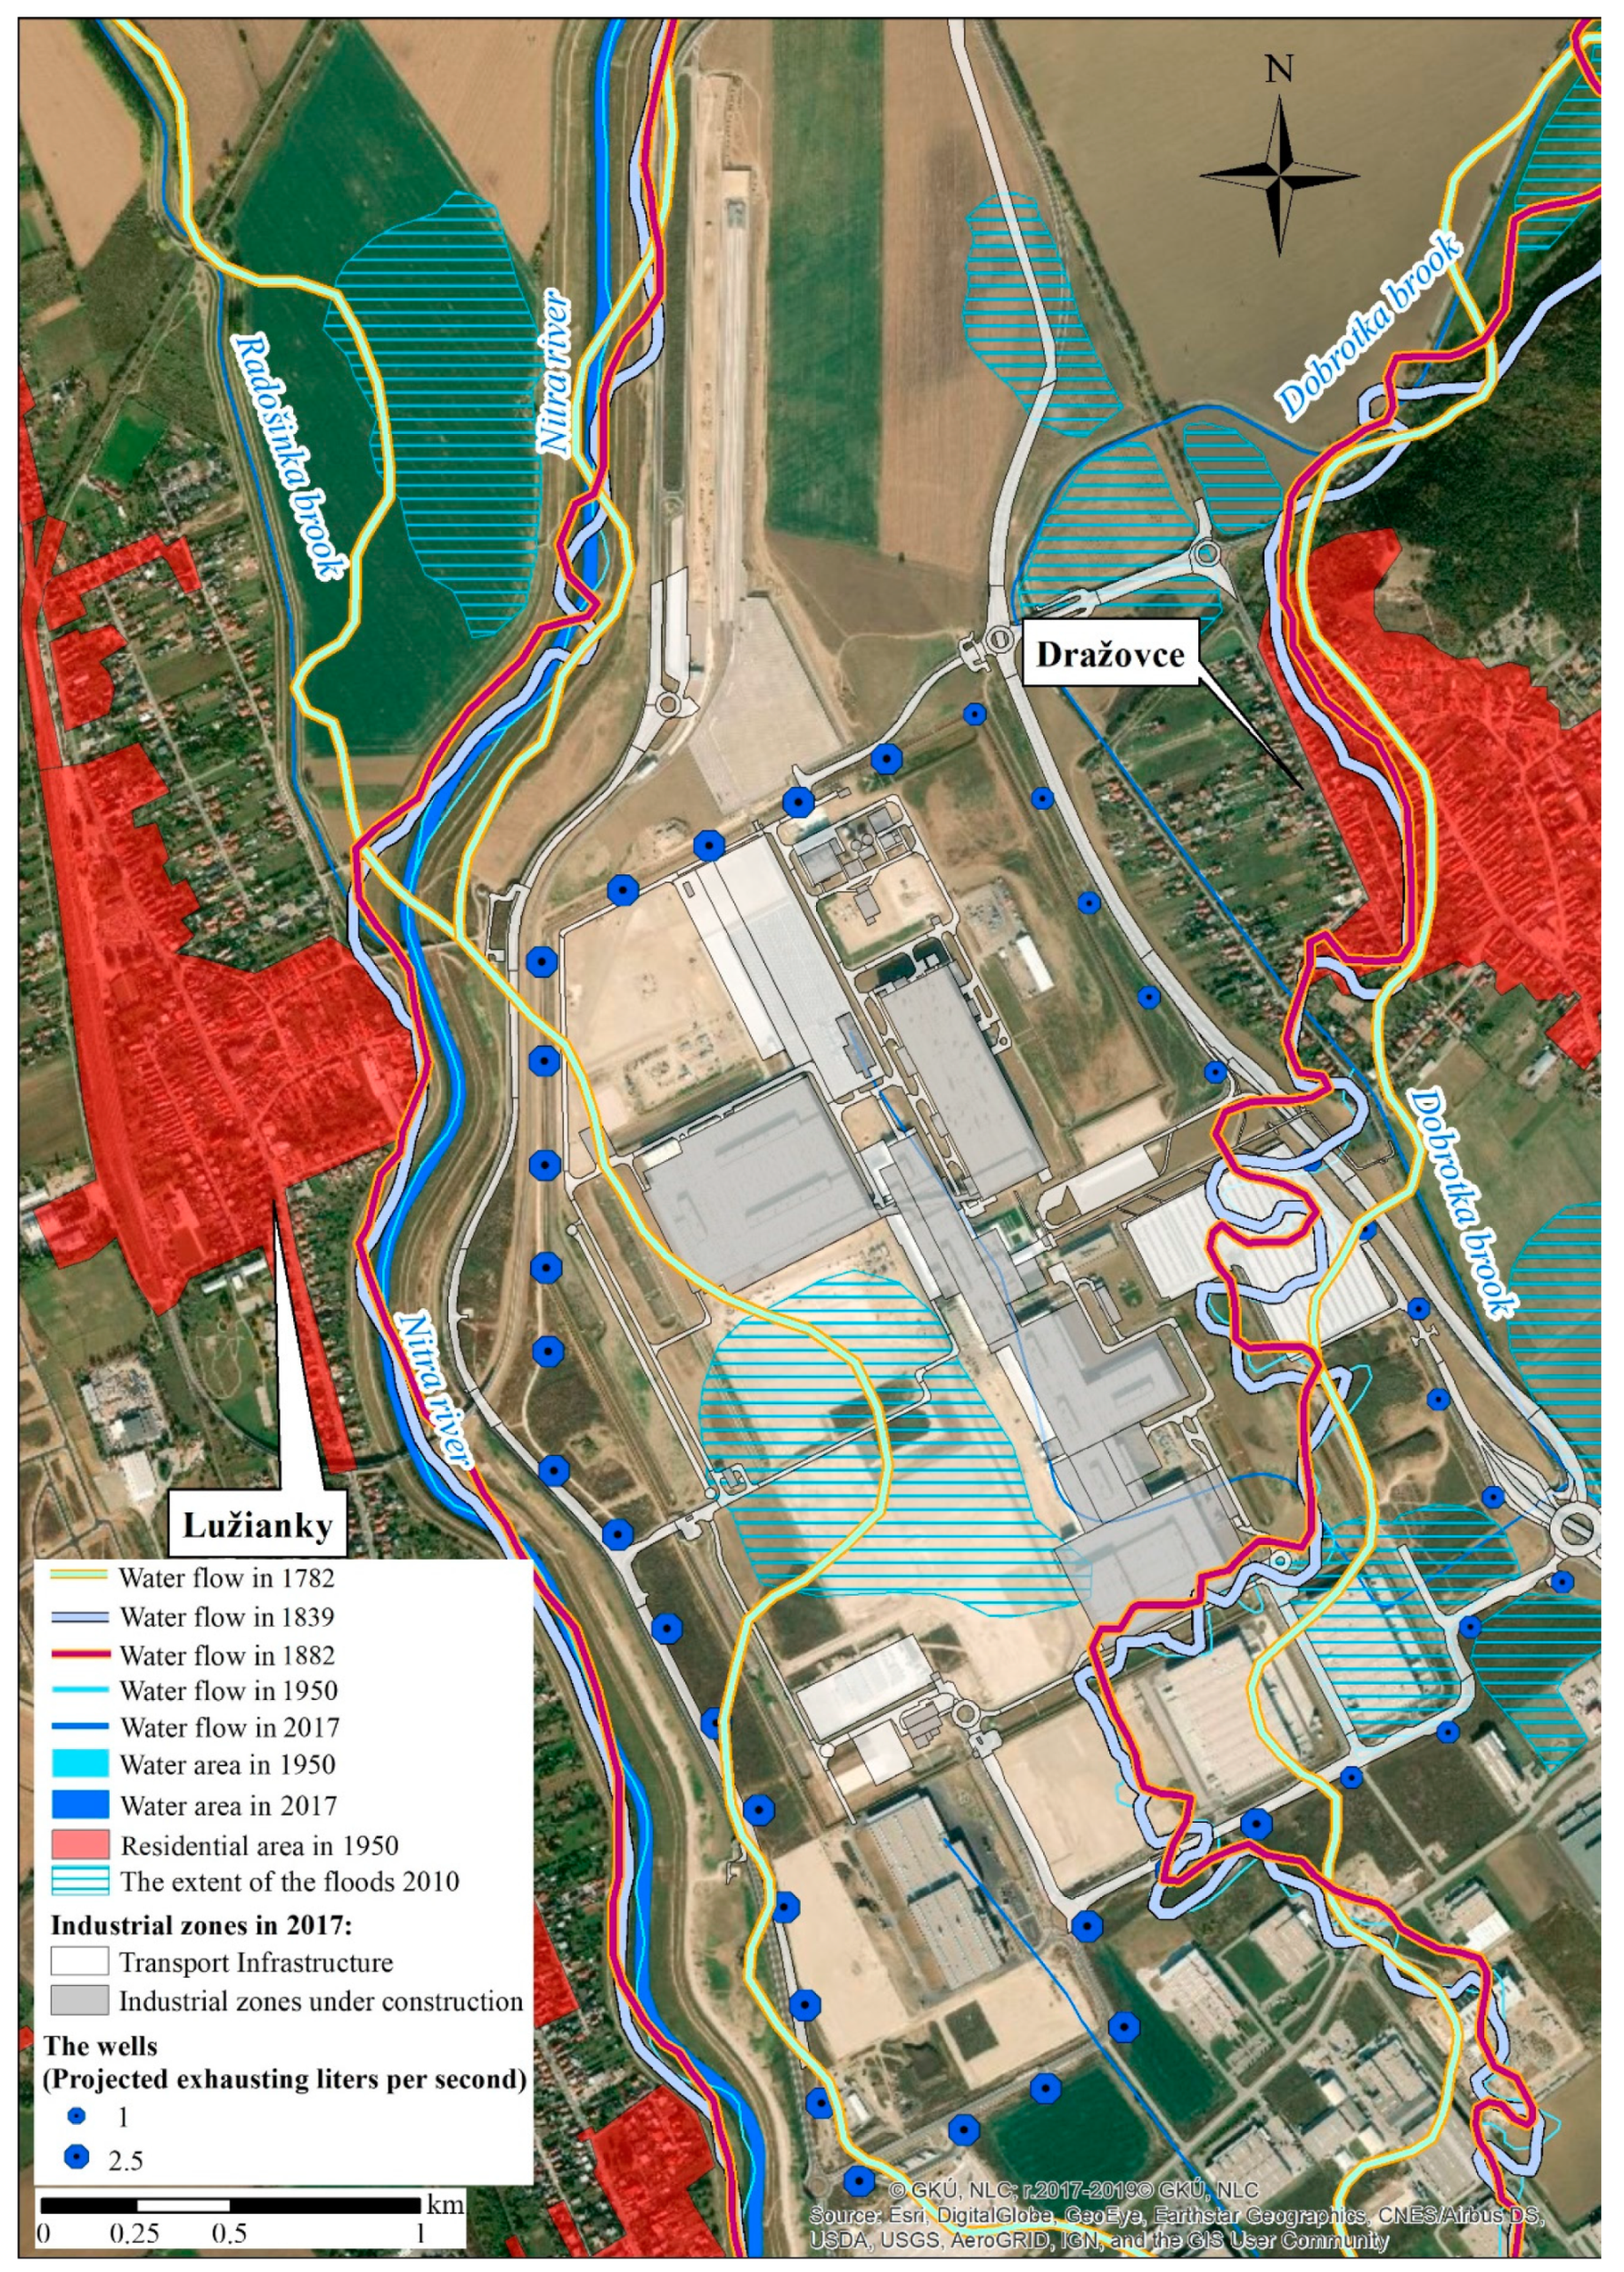
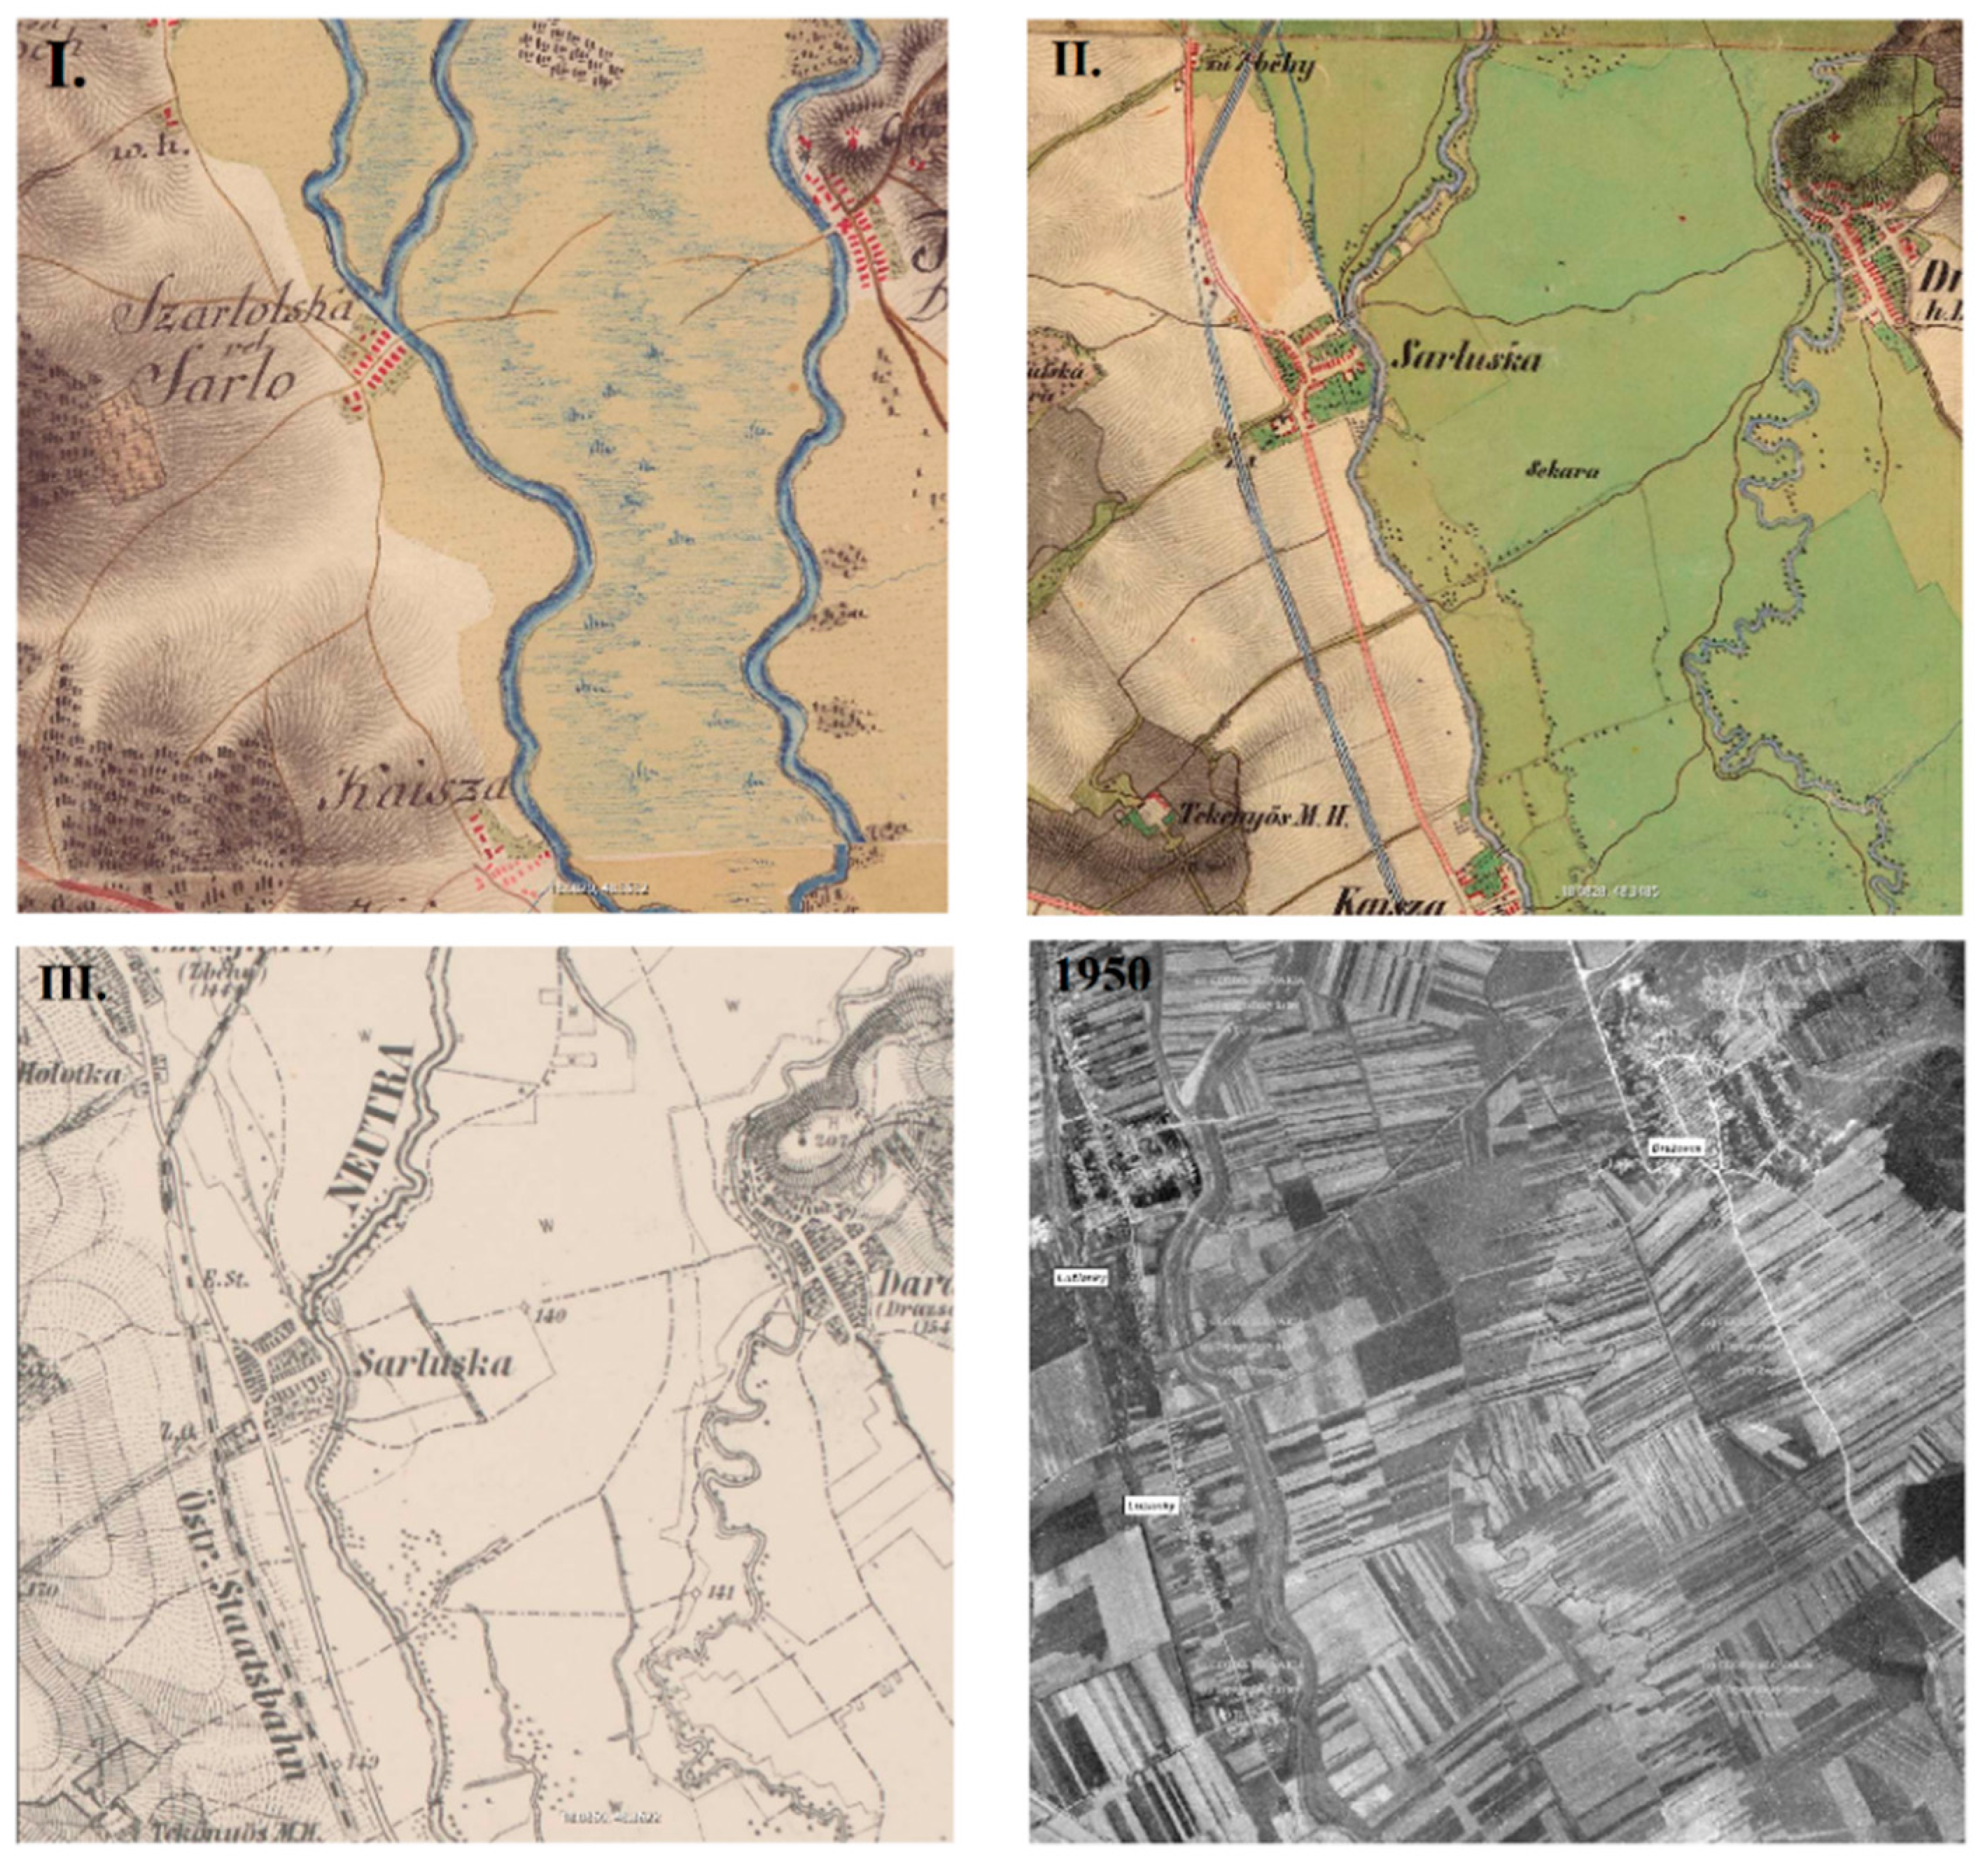
4.2. The Case Study of the Industrial Park in Nitra

The visual comparison of historical base maps (Figure A5) and the Q100 flood line from the flood maps (Figure 6) showed that the industrial park in Nitra has similar flood risk conditions as the industrial park in Vráble.
Historically, the land surrounding the Nitra river branches was used as meadows and pastures. The construction of the JLR, which is still ongoing, began in 2016 in areas that were used extensively. Furthermore, in the industrial park area, there exists a phenomenon of the underground water from the nearby Tribeč mountains. Pumping wells (38) were built to reduce the pressure of the groundwater level to 140 m a.s.l. Control boreholes located in the nearby villages Dražovce and Čakajovce should be used for this purpose, but this technology requires active mechanics, which can be a complication in case of an event related to a natural disaster. Moreover, the water from the wells should be pumped into the river if necessary. However, this is not functional if the river is poured into the floodplain.

5. Discussion

The state administration processes flood risk plans to identify flood-prone areas, which are unsuitable for urbanization. That is the cheapest tool to reduce the flood risk in urban areas. Flood risk plans may not be accepted when the government decides that the significant construction is in the public interest [50]. We note with concern that the government has the law to expropriate land and the process of Environmental Impact Assessment (EIA) has only a recommendation character.
Based on the analyses, the location of the JLR can be considered to be inappropriate. The development of technical measures has reduced the risk of flooding in the industrial area, but not in its vicinity. Spatial planning should be developed for longer-term horizons and, of course, plans should be respected. In the land-use planning documentation, this locality was recorded as an area for agricultural purposes. As the food self-sufficiency of the Slovak Republic is only about 50%, the fertile agricultural land might not be considered to be an optimal place for the development of industrial zones. Our inspiration could be countries which have a high tax for this procedure and industrial zones are built primarily in brownfields.
In 2015, the Association of Towns and Communities of Slovakia carried out a survey that mapped the approach of municipalities to flood control measures on a sample of 287 municipalities [51]. Flood protection measures were carried out by 56.6% of towns and municipalities (streams clean-up). Of them, 33.9% did not carry out protection measures, and the remaining 9.4% of municipalities said that the water stream does not flow through their residential area. Until now, the local government has mostly solved just the consequences of the floods. According to the territorial plan of the town of Vráble from 2017, a potential expansion of 12.66 ha of the industrial park is planned in the studied locality, which was hit by the flood in 2010 [52]. While low-magnitude events resulted in gradual yet variable community learning, the fundamental reorganization of the social response to flash floods and the reinforcement of participatory linkages among different institutional levels (including law-making efforts) typically occurred following high-magnitude flood events [53].
At present, the method of flood map processing for the Slovak Republic consists of the use of steady uneven water flow simulation by a mathematical hydrodynamic model. This method is not effective enough for every area [7], inter alia, because not all flood protection measures are maintained in a suitable condition. This is also proven by the floods in Vráble and Nitra in 2010. This method does not consider historical interrelationships, such as land use changes. On the other hand, historical maps (Figure A4 and Figure A5) give us a picture on historical land use and objects built up on watercourses (for instance, a mill drive). Based on these findings, it is possible to identify areas near rivers prone to floods. Historical maps should, therefore, be one of the sources of data in the development of flood maps for the Slovak Republic. The use of historical maps should be applied in the legislation of the Slovak Republic as one of the recommended steps in the process of preparation and evaluation of flood maps.
Concerning the flood maps (Figure 5 and Figure 6), it is evident that the rivers Nitra and Žitava were regulated due to the planned construction of industrial and social infrastructures. An extensive investment into infrastructure to minimize damage in the event of the floods reflects the fact that the area had very different conditions for land use—very heavy soils [54], which have the potential to retain water and nutrients and are easily compressible. The branched riverbeds in both cities were merged into one and then balanced. The purpose of this regulation was to reduce the risk of meandering on rivers in built-up areas or near the infrastructure. Without these modifications, the watercourse could cause erosion of the surrounding terrain and subsequently spill into the surrounding environment, which could cause several problems. Modifications of riverbeds were created to protect the population and property from possible floods. The flood in 2010 showed us that these measures were insufficient. The flood risk maps did not take into account the historical geodata presented in this study.
A startling fact for experts was that despite the flood in 2010, the JLR was built in a location with similar natural settings and historical genesis of the watercourse as the industrial park in Vráble. According to the calculation of the level regime on the river Nitra created by DHI Slovakia, s.r.o. before the decision to build an industrial park in Nitra, levees had not corresponded to the level of the flood wave with a steady flow of Q100. The originally projected states on both rivers were set to the flow capacity Q100. Concerning the results of the model, it can be calculated that the deficiencies were found in 34.58% of Nitra river levees in the neighborhood of the industrial park, with the largest difference in water level above the levees equal to 0.47m. The levees clearly did not meet the Q1000 values [55]. The model is favorable for the designed modifications in the case of Q100. For Q1000, many sections are still insufficient despite improved flood protection measures. In case of the river Žitava, the result of the same assessment is even worse, and the probable extent of the floods can be seen in Figure 5.
Unlike the industrial park in Vráble, pumping wells were built around the JLR to reduce the groundwater level. However, the natural conditions of the area were not considered again in the flood-risk maps and in the process of environmental impact assessment.
Any properly set up incentives and any exactly designed flood maps can be inadequately implemented into practice by competent authorities whose decisions are used to be manipulated with money-making investment groups co-operating with policy and decision-makers.
In 2010, long-term rains in combination with heavy rainfalls caused floods in several areas of Slovakia. However, the rapid rise of water level in rivers and streams was not only caused by higher precipitation, but also by a significant saturation of the soil with water after the previous rains. The precipitation volumes exceeded all historically measured flows. This is the reason why already built water barriers were overwhelmed. In addition to strategic planning documents [56,57,58], integrated landscape management is essential [59,60,61,62,63,64].
By the directive 2007/60/EC, floods are natural phenomena which cannot be prevented. Floods have the potential to cause damage to the environment, displacement of people, and fatalities, as well as severely compromise economic development and undermine economic activities. Historical maps provide us with data about how watercourses have changed from the past to the present. In pursuance of the watercourse transformation and shifts of riverbeds, the flood-prone areas can be identified. These localities in peri-urban areas should be used extensively with limited or forbidden construction of industrial parks.
The industrial park in Nitra does not appear as a problematic location in flood risk maps. Despite this, there are flood control measures—lowering the downstream-water level, modifying the riverbanks to a length of 15 km, and raising the structural foundations. According to the technical documentation, the top of the embankment was raised 0.3 m higher to the level of the calculated flood extension for Q1000, but no bridge structures in Nitra meet this parameter. Basically, these solutions were relatively expensive. This measure together with the lowering of groundwater should protect the industrial park area and surrounding municipalities from floods. The expansion of the industrial park will lead to the implementation of other development plans such as residential and civic buildings, services, and roads built alongside of watercourses. This could have a negative impact on the ability to retain water. People occupy the sites of previous meandering water streams and wetlands where natural water should be filtered and stored.
China has started the national program “Sponge Cities”, in which green spaces will be integrated into urban design to prevent surface flooding. Nature-based solutions will induce positive effects on ecosystems and human society. However, a dialogue among investment groups, politicians, and stakeholders is required to accept a consensus on urbanization and industrialization of flood vulnerable areas [65]. The United Kingdom has a strategic management document—Making Space for Water [66]. In Slovakia, urbanized industrial parks do not have enough eco-stabilizing features which would support the capture of water in the landscape, respectively slowing down the water outflow. The aggradation of the old river channels could be partially prevented by linking them with the river flow and by regular maintenance in the form of cleaning the river banks. This type of intervention is not a low cost one and would be desirable at regular intervals in the main riverbed of the river Nitra. In the past, this function was partly performed by the livestock. Although an enlargement of the riverbanks is undoubtedly one of the best flood protection measures, it causes an insufficiency of groundwater in the alluvial plain at the time of raising the river above its natural bed. An optimal use of the alluvial plain can be derived from their land use in the past when the economic profit did not usually exceed the limits of the carrying capacity of the territory.

6. Conclusions

The main purpose of our study was to provide a simple, efficient, and low-cost tool for local governments which have a decisive power in the preparation and implementation of the spatial planning documentation. Experts have to perform a deep hydrological and historical research before agricultural plots are designed to be delimited and turned into built-up areas of industrial parks. Multitemporal analyses of geodata from historical and current datasets was proposed to be an efficient methodical tool for responsible spatial planning. The flood map consists of water flow simulation by a mathematical hydrodynamic model which is valid only for current watercourses. However, the landscape has a “water memory”. Old historical watercourses can be computed with a certain accuracy from digital elevation models or interpreted from historical maps. Historical maps have some more advantages. They are easily accessible from public WMS, and they contain a lot of useful information. Despite a considerable variation in an accuracy, historical maps from the 18th and the 19th centuries provide valuable information not only about watercourses, but also about historical land use and old historical objects related to the time period which often lacks other data sources to be described more appropriately. Old orthophoto maps (1950) provide very valuable information about watercourses before their “modern” regulation took place during the Communist period (1950–1989) in Slovakia. Old watercourses do not exist anymore in the country. However, they have still been presented as underground water flows or as terrain linear depressions sporadically filled with water. During the torrential rainfall or after snow melting, their water retention functions are markedly visible in the landscape. The results of the study clearly showed that historical maps might be used in the flood risk assessment of the industrial parks in peri-urban zones built-up in floodplains. The proposed method has the potential to be applied not only for the initial identification of floodplains, but it can also contribute to the creation and updating of flood maps in a relationship with the economic and social development of the territory.

Author Contributions

Conceptualization—H.G., M.I., M.M., F.P., G.V. and M.S.; methodology—H.G., M.M., M.S., G.V. and F.P.; formal analysis—M.M., M.I., M.S. and H.G.; investigation—M.M., M.I., G.V., H.G.; data curation and resources—G.V., J.S., Z.M., B.O., M.S., I.M. and H.G.; writing—H.G., M.I., M.S., G.V., I.M. and F.P.; visualization—M.M., H.G., M.I., G.V.; supervision— H.G., F.P., M.I., M.S.; project administration, funding acquisition, and correspondence—F.P., H.G. All authors have read and agreed to the published version of the manuscript.

Funding

This research was supported by the VEGA Grant Agency, the Project VEGA 1/0706/20 Urban sustainable development in the 21st century—assessment of key factors, planning approaches, and environmental relationships.

Conflicts of Interest

The authors declare no conflict of interest.

Appendix A

Figure A1. Rainfall in the Slovak Republic (SR) in June 2010; Source: (SHMÚ, 2010) [48].
Sustainability 12 04144 g0a1
Figure A2. Daily flow rates at the water meter station in Vieska nad Žitavou from 2007 to 2016—the river Žitava; Source: (SHMÚ, 2017) [67].
Sustainability 12 04144 g0a2
Figure A3. Water level evolution at the water meter station in Vieska nad Žitavou from 31 May to 5 June 2010—the Žitava; Source: (SHMÚ, 2017) [68].
Sustainability 12 04144 g0a3
Figure A4. Comparison of the historical background of maps of the town Vráble from the First, Second, and Third Military Surveys and from the 1950s [37,38].
Sustainability 12 04144 g0a4
Figure A5. Comparison of the historical background of maps of the city Nitra from the First, Second, and Third Military Surveys and from the 1950s [37,38].
Sustainability 12 04144 g0a5

References

  1. Majlingová, A.; Lubinszká, Z. An assessment of urban area flood susceptibility. In Proceedings of the Symposium GIS Ostrava, Ostrava, Czech Republic, 23–26 January 2011; Růžička, Pešková, Eds.; Technical University of Ostrava: Ostrava, Czech Republic, 2011. [Google Scholar]
  2. Thanvisitthpon, N. Impact of land use transformation and anti-flood infrastructure on flooding in world heritage site and peri-urban area: A case study of Thailand’s Ayutthaya province. J. Environ. Manag. 2019, 247, 518–524. [Google Scholar] [CrossRef] [PubMed]
  3. Miki, I.; Kimio, T.; Shintaro, A. JICA’s policies, experiences and lessons learned on impacts of urban floods in Asia. Int. J. Water Resour. Dev. 2019, 35, 343–362. [Google Scholar]
  4. Zope, P.E.; Eldho, T.I.; Jothiprakash, V. Hydrological impacts of land use–land cover change and detention basins on urban flood hazard: A case study of Poisar River basin, Mumbai, India. Nat. Hazards 2017, 87, 1267–1283. [Google Scholar] [CrossRef]
  5. Van den Honert, R.C.; McAneney, J. The 2011 Brisbane Floods: Causes, Impacts and Implications. Water 2011, 3, 1149–1173. [Google Scholar] [CrossRef] [Green Version]
  6. Ramasamy, S.M.; Vijay, A.; Dhinesh, S. Geo-anthropogenic aberrations and Chennai floods: 2015, India. Nat. Hazards 2018, 92, 443–477. [Google Scholar] [CrossRef]
  7. Jakubcová, A.; Grežo, H.; Hreško, J. Identification of areas with significant flood risk at the confluence of Danube and Ipeľ rivers (southern Slovakia). Nat. Hazards 2014, 75, 849–867. [Google Scholar] [CrossRef]
  8. Ryu, J.; Yoon, E.J.; Park, C.H.; Lee, D.K.; Jeon, S.W. A Flood Risk Assessment Model for Companies and Criteria for Governmental Decision-Making to Minimize Hazards. Sustainability 2017, 9, 2005. [Google Scholar] [CrossRef] [Green Version]
  9. Ryu, J.; Lee, D.; Park, C.; Ahn, Y.; Lee, S.; Choi, K.; Jung, T. Assessment of the vulnerability of industrial parks to flood in South Korea. Nat. Hazards 2016, 82, 811–825. [Google Scholar] [CrossRef] [Green Version]
  10. Vojtek, M.; Boltižiar, M. Management of Flood Risks with the Focus on Legislative Frame and Significance of Flood Maps. Geogr. Cassoviensis 2011, 5, 125–128. [Google Scholar]
  11. Jakubcová, A.; Grežo, H.; Hrešková, A.; Petrovič, F. Impacts of Flooding on the Quality of Life in Rural Regions of Southern Slovakia. Appl. Res. Qual. Life 2016, 11, 221–237. [Google Scholar] [CrossRef]
  12. Petrovič, F.; Stránovský, P.; Muchová, Z.; Falťan, V.; Skokanová, H.; Havlíček, M.; Špulerová, J. Landscape optimalization of hydric potential in foothills region with dispersed settlements (a case study of Nová Bošáca, Slovakia). Appl. Ecol. Environ. Res. 2017, 15, 379–400. [Google Scholar] [CrossRef]
  13. Petroselli, A.; Vojtek, M.; Vojteková, J. Flood mapping in small ungauged basins: A comparison of different approaches for two case studies in Slovakia. Hydrol. Res. 2019, 50, 379–392. [Google Scholar] [CrossRef] [Green Version]
  14. Vojtek, M.; Vojteková, J. Flood susceptibility mapping on a national scale in Slovakia using the analytical hierarchy process. Water (Switzerland) 2019, 11, 364. [Google Scholar] [CrossRef] [Green Version]
  15. Demir, V.; Kisi, O. Flood Hazard Mapping by Using Geographic Information System and Hydraulic Model: Mert River, Samsun, Turkey. Adv. Meteorol. 2016, 2016. [Google Scholar] [CrossRef] [Green Version]
  16. Vojtek, M.; Vojteková, J. Flood hazard and flood risk assessment at the local spatial scale: A case study. Geomat. Nat. Hazards Risk 2016, 7, 1973–1992. [Google Scholar] [CrossRef]
  17. Pinos, J.; Timbe, L. Performance assessment of two-dimensional hydraulic models for generation of flood inundation maps in mountain river basins. Water Sci. Eng. 2019, 12, 11–18. [Google Scholar] [CrossRef]
  18. Darabi, H.; Choubin, B.; Rahmati, O.; Haghighi, A.T.; Pradhan, B.; Kløve, B. Urban flood risk mapping using the GARP and QUEST models: A comparative study of machine learning techniques. J. Hydrol. 2019, 569, 142–154. [Google Scholar] [CrossRef]
  19. De Moel, H.; van Alphen, J.; Aerts, J.C.J.H. Flood maps in Europe—Methods, availability and use. Nat. Hazards Earth Syst. Sci. 2009, 9, 289–301. [Google Scholar] [CrossRef] [Green Version]
  20. Brown, J.D.; Damery, S.L. Managing flood risk in the UK: Towards as integration of social and technical perspectives. Trans. Inst. Br. Geogr. 2003, 27, 412–426. [Google Scholar] [CrossRef]
  21. How to Prepare a Strategic Flood Risk Assessment. 2013. Available online: https://www.gov.uk/guidance/local-planning-authoities-strategic-flood-risk-assessment (accessed on 3 May 2019).
  22. Strategic Flood Risk Assessment. 2020. Available online: https://www.ipswich.gov.uk/sites/default/files/draft_ipswich_sfra-for_issue.pdf (accessed on 3 May 2019).
  23. Janizadeh, S.; Avand, M.; Jaafari, A.; Phong, T.V.; Bayat, M.; Ahmadisharaf, E.; Prakash, I.; Pham, B.T.; Lee, S. Prediction Success of Machine Learning Methods for Flash Flood Susceptibility Mapping in the Tafresh Watershed, Iran. Sustainability 2019, 11, 5426. [Google Scholar] [CrossRef] [Green Version]
  24. Morita, M. Flood Risk Impact Factor for Comparatively Evaluating the Main Causes that Contribute to Flood Risk in Urban Drainage Areas. Water 2014, 6, 253–270. [Google Scholar] [CrossRef] [Green Version]
  25. Güneralp, B.; Güneralp, İ.; Liu, Y. Changing global patterns of urban exposure to flood and drought hazards. Glob. Environ. Chang. 2015, 31, 217–225. [Google Scholar] [CrossRef]
  26. Muis, S.; Güneralp, B.; Jongman, B.; Aerts, J.C.; Ward, P.J. Flood risk and adaptation strategies under climate change and urban expansion: A probabilistic analysis using global data. Sci. Total Environ. 2015, 538, 445–457. [Google Scholar] [CrossRef] [PubMed]
  27. European Environment Agency. Urban Sprawl in Europe—The Ignored Challenge; European Environment Agency (EEA), Office for Official Publications of the European Communities: Luxembourg. 2006. Available online: https://www.eea.europa.eu/publications/eea_report_2006_10 (accessed on 25 September 2019).
  28. International Commission for the Protection of the Danube River. Flood Risk Management Plans for the Danube River Basin District of 2015 until 2021. Available online: https://www.icpdr.org/main/sites/default/files/nodes/documents/1stdfrmp-final.pdf (accessed on 16 September 2019).
  29. Act No. 71/2015 Coll., Amending of Act No. 7/2010 Coll. on Protection against Floods. Available online: http://www.zakonypreludi.sk/zz/2015-71&gt (accessed on 31 October 2018). (In Slovak).
  30. Directive 2007/60/EC of the European Parliament and of the Council on the Assessment and Management of Flood Risks. Available online: http://eur-lex.europa.eu/legal-content/EN/TXT/HTML/?uri=CELEX:32007L0060&from=SK (accessed on 31 October 2018).
  31. Ministry of the Environment of the Slovak Republic. Strategy for Flood Protection to 2020. Available online: http://www.minzp.sk/sekcie/temy-oblasti/voda/ochrana-pred-povodnami/strategiaprotipovodnovej-ochrany-sr-do-roku-2020/ (accessed on 31 October 2017). (In Slovak)
  32. Act No. 193/2001 Coll. on Support for the Establishment of Industrial Parks. Available online: http://www.sario.sk/sites/default/files/content/files/act_193_2001_on_support_for_establishment.pdf (accessed on 31 October 2018).
  33. AUREX, s.r.o. The Slovak Spatial Development Perspective 2001, as Amended by the Slovak Spatial Development Perspective. 2011. Available online: http://www.telecom.gov.sk/index/index.php?ids=124582 (accessed on 29 September 2017). (In Slovak)
  34. Dubcová, A.; Kramáreková, H.; Repaská, G.; Vilinová, K. Programme of the Economic and Social Development of the Nitra Self-Governing Region 2016–2022. Available online: https://www.unsk.sk/zobraz/sekciu/dokumenty-regionalneho-rozvoja (accessed on 3 October 2019). (In Slovak).
  35. Mapire. Available online: https://mapire.eu/en/map/secondsurvey-hungary (accessed on 12 January 2020).
  36. Historická Ortofotomapa Slovenska. Available online: http://mapy.tuzvo.sk (accessed on 10 February 2020).
  37. Ministry of the Environment of the Slovak Republic, SAŽP 2014: Historical Mapping In: National Geoportal. Available online: http://geoportal.gov.sk/sk/map?wmc=http%3A%2F%2Fgeoportal.gov.sk%2Fwmc%2F4ee52ab9-1dd0-4429-ab58-597ac0a80139.xml (accessed on 2 February 2017).
  38. Biszak, E.; Kulovits, H.; Biszak, S.; Timár, G.; Molnár, G.; Székely, B.; Jankó, A.; Kenyeres, I. 2014: Cartographic Heritage of the Habsburg Empire on the Web: The MAPIRE Initiative, 9th International Workshop on Digital Approaches to Cartographic Heritage, Budapest, 6 Pages. Available online: https://www.arcanum.hu/media/uploads/mapire/pub/mapire_biszak_et_al.pdf (accessed on 4 April 2020).
  39. Geoportál. Available online: https://www.geoportal.sk/sk/udaje/ortofotomozaika/ (accessed on 12 May 2020). (In Slovak).
  40. Povodňové Mapy—Mapy Povodňového Rizika a Mapy Povodňového Ohrozenia Vodných Tokov Slovenska. Available online: http://mpomprsr.svp.sk/ (accessed on 5 May 2019).
  41. Mišovičová, R. Classification and evaluation of town Nitra’s contact area In: The Problems of Landscape Ecology: Four Dimensions of the Landscape. ISSN 2012, 15, 1899–3850. [Google Scholar]
  42. Simonová, S. 2016: Mlynárce—Čakajovce, rekonštrukcia POH rieky Nitra v km 61,710–68,550—Technical Report; Piešťany, SVP š.p.: Piešťany, Slovakia, 2016. [Google Scholar]
  43. Jančáriková, T. Jaguar Land Rover Picks Contractors, Breaks Ground for Slovak Plant. Available online: https://www.reuters.com/article/us-slovakia-autos-jaguar-lnd-rover/jaguar-land-rover-picks-contractors-breaks-ground-for-slovak-plant-idUSKCN11J1VC (accessed on 29 December 2017).
  44. Nitra Invest. Jaguar Land Rover. 2016. Available online: http://www.nitrainvest.sk/nitra-sever/jaguar-land-rover-postavi-svoj-zavod/ (accessed on 30 September 2017). (In Slovak).
  45. Liptávková, J. Jaguar Land Lover to Build Cars in Slovakia. Available online: https://spectator.sme.sk/c/20066424/jaguar-land-rover-deal-signed.html (accessed on 8 October 2017). (In Slovak).
  46. Conticelli, E.; Tondelli, S. Eco-Industrial Parks and Sustainable Spatial Planning: A Possible Contradiction? Adm. Sci. 2014, 4, 331–349. [Google Scholar] [CrossRef]
  47. SARIO. Automotive Nitra Project. 2015. Available online: http://www.enviroportal.sk/sk_SK/eia/detail/automotive-nitra-project (accessed on 29 September 2017). (In Slovak)
  48. Slovak Hydrometeorological Institute. Report of the Floods. 2010. Available online: http://www.shmu.sk/File/HIPS/Povodnova_sprava_2010.pdf (accessed on 30 September 2017). (In Slovak)
  49. Lapin, M.; Faško, P.; Melo, M.; Šťastný, P.; Tomlain, J. Climatic regions. In Landscape Atlas of the Slovak Republic, 1st ed.; Miklós, L., Hrnčiarová, T., Eds.; Ministry of Environment of the Slovak Republic: Bratislava, Slovak Republic, 2002; p. 95. ISBN 80-88833-27-2. (In Slovak) [Google Scholar]
  50. Act. No. 171/1999 Coll. on Certain Measures Concerning the Preparation of Significant Investments and on the Amendment of Certain Laws. Available online: https://www.slov-lex.sk/pravne-predpisy/SK/ZZ/1999/175/20150707 (accessed on 16 April 2019).
  51. Association of Towns and Communities of Slovakia. 2016. Available online: http://www.zmos.sk/samospravy-realizuju-protipovodnoveopatrenia.phtml?id3=80977&module_action__295820__id_art=23761&gt (accessed on 29 September 2017). (In Slovak).
  52. Feník, I.; Števko, B. 2017: Komplexný Urbanistický Návrh In: Územný Plán Obce—Mesto Vráble, Land Use Planning Documentation; IF_ROGGI s.r.o.: Nitra, Slovakia, 2017. [Google Scholar]
  53. Raška, P.; Brázdil, R. Participatory responses to historical flash floods and their relevance for current risk reduction: A view from a post-communist country. Area 2015, 47, 166–178. [Google Scholar] [CrossRef]
  54. Tárník, A.; Igaz, D. Quantification of soil water storage available to plants in the Nitra river basin. Acta Sci. Pol. 2015, 14, 209–216. [Google Scholar] [CrossRef]
  55. Bajčan, M.; Mišík, M.; Kučera, M. 2016: Výpočet hladinového režimu na rieke Nitra v úseku rkm 59,60–74,75 s určením hladinového režimu v medzihrádzovom priestore pre prietoky Q100 a Q1000, Technická správa; DHI SLOVAKIA, s.r.o.: Bratislava, Slovakia, 2016. [Google Scholar]
  56. Ivan, P.; Macura, V.; Belčáková, I. Various approaches to evaluation of ecological stability. In GeoConference on Ecology, Economics, Education and Legislation: Conference Proceedings; SGEM: Sofia, Bulgaria, 2014; Volume I, pp. 799–805. ISBN 978-619-7105-18-6. [Google Scholar]
  57. Belčáková, I. Strategic environmental assessment—An instrument for better decision-making towards urban sustainable planning. Procedia Eng. 2016, 161, 2058–2061. [Google Scholar] [CrossRef] [Green Version]
  58. Belčáková, I.; Vojtkova, J.; Pauková, Ž.; Offertalerova, M. The impact of floodplain vegetation on the erosion-sedimentation processes in fluvisols during flood events. Appl. Ecol. Environ. Res. 2019, 17, 6349–6374. [Google Scholar] [CrossRef]
  59. Izakovičová, Z. Ecological interpretations and evaluation of encounters of interests in landscape. Ekológia (ČSSR) 1995, 14, 261–275. [Google Scholar]
  60. Izakovičová, Z. Evaluation of the stress factors in the landscape. Ekológia (Bratislava) 2000, 19, 92–103. [Google Scholar]
  61. Izakovičová, Z. Example of the elaboration of the strategy of sustainable development. Ekológia (Bratislava) 2005, 24, 277, No. 3. [Google Scholar]
  62. Izakovičová, Z.; Miklós, L.; Miklósová, V. Integrative assessment of land use conflicts. Sustainability 2018, 10, 3270. [Google Scholar] [CrossRef] [Green Version]
  63. Izakovičová, Z.; Miklós, L.; Miklósová, V.; Petrovič, F. The integrated approach to landscape management—Experience from Slovakia. Sustainability 2019, 11, 4554. [Google Scholar] [CrossRef] [Green Version]
  64. Izakovičová, Z.; Špulerová, J.; Petrovič, F. Integrated approach to sustainable land use management. Environments 2018, 5, 37. [Google Scholar] [CrossRef] [Green Version]
  65. Jongman, B. Effective adaptation to rising flood risk. Nat. Commun. 2018, 9, 1986. [Google Scholar] [CrossRef] [Green Version]
  66. Defra, Department of the Environment, Food and Rural Affairs, London. Making Space for Water: Developing a New Government Strategy for Flood and Coastal Erosion Risk Management in England. 2004. Available online: http://www.defra.gov.uk/ (accessed on 15 April 2020).
  67. Slovak Hydrometeorological Institute Hydrological Situation on Slovak Rivers. Available online: http://www.shmu.sk/en/?page=1&id=hydro_vod_all (accessed on 30 September 2017). (In Slovak).
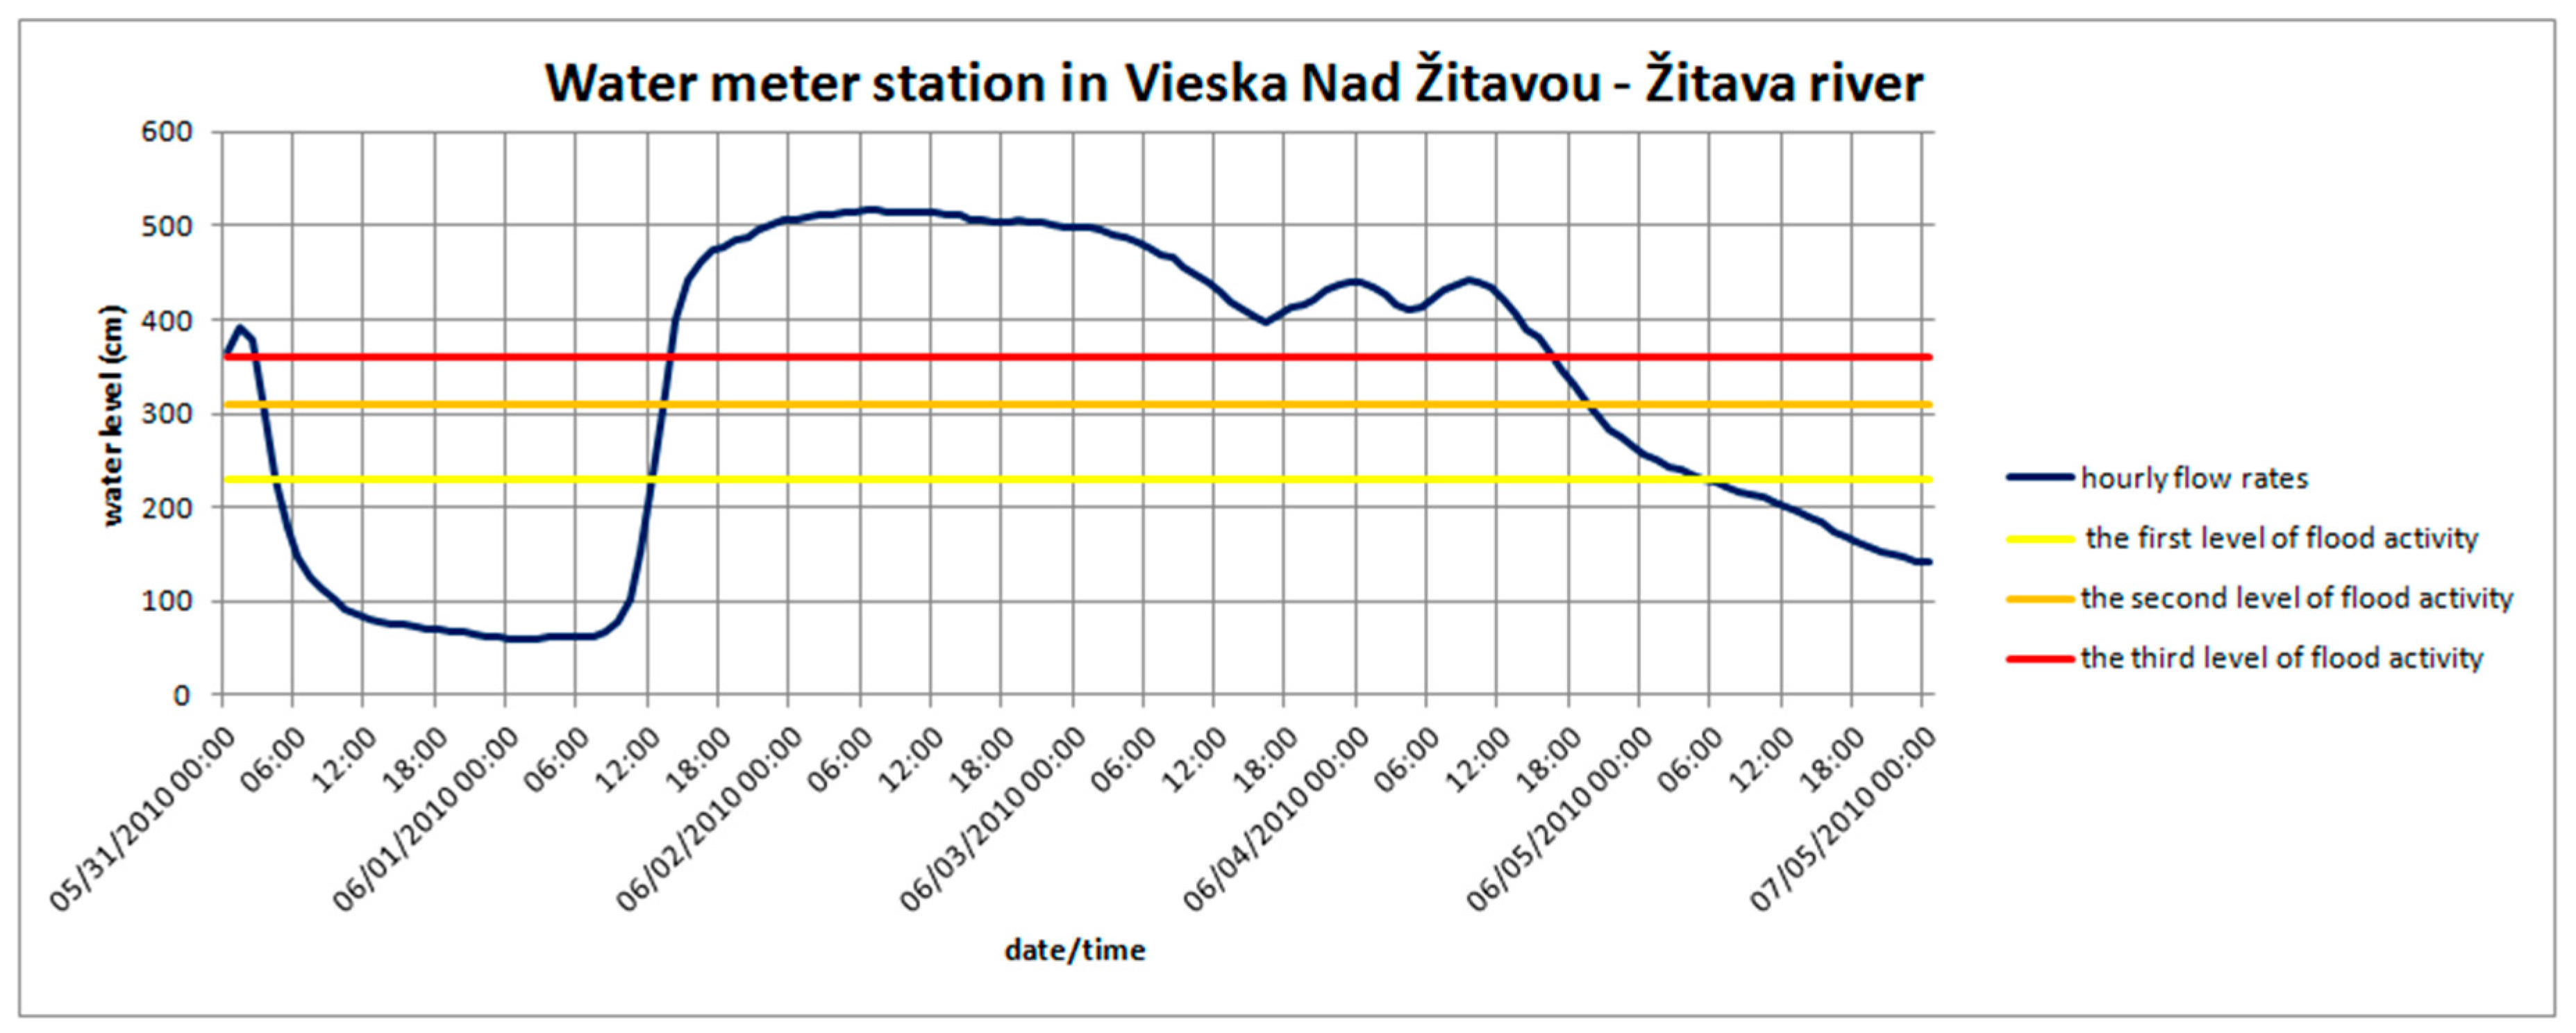
  68. Slovak Hydrometeorological Institute Flood Situation on Streams Western Slovakia in May and June 2010. Available online: http://www.shmu.sk/File/Povodnova_situacia_na_tokoch_zapadneho_Slovenska_v_maji_a%20juni_2010_1_cast.pdf (accessed on 30 September 2017). (In Slovak).
Figure 1. The comparison of current (2017) and historical land cover (latter half of the 19th century) of the study site, located in an alluvial plain of the river Nitra: A new industrial park in the peri-urban zone of the city Nitra, and traditionally and extensively used pastures and meadows in the past.
Sustainability 12 04144 g001
Figure 2. Map of the case study sites.
Sustainability 12 04144 g002
Figure 3. (a) Industrial park in Vráble with an average flow of water in the river Žitava (2017); (b) industrial park in Vráble in June 2010. The river Žitava created a new riverbed, which passed through the industrial park and poured into the main riverbed in front of the bridge (2010). (Photo: M. Izsóff).
Sustainability 12 04144 g003
Figure 4. The Nitra-North industrial park during the floods in June 2010. (Source: Nitra-Dražovce district [51]).
Sustainability 12 04144 g004
Figure 5. Map of the flood in Vráble (June 2010) with the comparison of development changes of watercourses and water areas from 1782 to 2017.
Sustainability 12 04144 g005
Figure 6. Map of the flood in Nitra (June 2010) with the comparison of development changes of watercourses and water areas from 1782 to 2017.
Sustainability 12 04144 g006
Table 1. Assurance of the flood protection in the Slovak Republic (2020).
LEVELADMINISTRATION LEVELFLOOD PROTECTION DOCUMENTS
Trans-nationalThe European UnionFlood Risk Management Plan for the Danube River Basin District of 2015 until 2021
NationalThe Ministry of Environment of the Slovak RepublicStrategy for Flood Protection to 2020
-The Slovak Water Management Enterprise, state owned enterprise in Banská ŠtiavnicaFlood Risk Management Plans
-Piešťany branchAnalysis of Flood Protection in the Slovak Republic including the Implementation of Flood Warning and Forecast system of 2011
RegionalDistrict Office at the seat of the Nitra RegionTerritorial Plan of the Nitra Region of 2015
-Department of Nature Protection and Selected Components of the EnvironmentProgramme of the Economic and Social Development of the Nitra Self-Governing Region 2016–2022
-State Administration of Water and Selected Components of the Environment
LocalCity of NitraEIA Nitra Automotive Project of 2015
Town of VrábleFlood Protection Measures in the Area of Vráble—Industrial Park in Vráble—Horný Ohaj of 2010
Territorial Plan of Town Vráble, 2017
Municipality of ČakajovceEIA 2016 Mlynárce—Čakajovce, Reconstruction of the River Nitra in km 61.710–68.550

