Analysis for Growth Potential in Response to Changes in the Online Food Market


Department of Economy & Industry Research, ChungNam Institute, 73-26 Yeonsuwon-gil, Gongju-si, Chungcheongnam-do 32589, Korea
Sustainability 2020, 12(11), 4386; https://0-doi-org.brum.beds.ac.uk/10.3390/su12114386
Submission received: 21 April 2020
/
Revised: 24 May 2020
/
Accepted: 25 May 2020
/
Published: 27 May 2020
Abstract
:This study examines changes in the online food market in South Korea, identifies this market’s potential for sustainable growth, and analyzes the causal relationships between media channels (mobile and PC-based devices) and product groups (fresh food, processed food, and food service). Whereas prior research has mainly focused on PC-based online shopping, this study analyzes the market for different media and product groups using Statistics Korea’s monthly time series data and the vector error correction model. The results reveal that PC-based online shopping has a long-term equilibrium relationship with mobile shopping in the online food market. However, in the short term, the mobile fresh food and food service transaction amounts are in a feedback relationship, while mobile processed food transaction amounts have a negative effect on other variables. In turn, PC-based online shopping has a positive effect on mobile shopping. In addition, consumer preference is shifting from PC-based devices to mobile devices, and demand is expanding from processed food to fresh food and food service. The results imply that marketers should both prepare for the emergence of new media and expand their product groups—their focus should be on expanding services rather than goods. In conclusion, for the sustainable growth of the online food market, it is essential for the market participants to cope actively with the new environment surrounding the online food market, and enhance their sustainability to minimize the negative effects from technological advances as consumer preference is continuously changing and information technology and online media continue to develop.
1. Introduction
An increasing number of consumers are purchasing food online via PC-based devices (personal computers and laptops) and mobile devices—particularly in South Korea, which has one of the highest Internet and smartphone penetration rates in the world. Currently, approximately 12.3% of Korean retail food is purchased online [1], compared to an average of 3.4%, 1.5%, and 1.8% in the Asia-Pacific region, North America, and Europe, respectively [2]; as retail food is traded through various retail channels, this is not a small proportion.
This growing trend of online food shopping is primarily due to the emergence of mobile shopping and the diversification of services. With the advent and dissemination of compact devices, such as smartphones and tablet PCs, portability and consumers’ convenience has increased [3,4]. Furthermore, consumers can significantly save both time and money when purchasing products online and can purchase products across various online stores [3]. These advantages have promoted the growth of online shopping [4,5,6]. In addition, as mobile shopping has become more common, the existing product-oriented online shopping culture has expanded to the food service sector [7,8]. Initially, online shopping was mainly used as a channel for trading industrial products, but has gradually expanded to include the trading of processed and fresh food [9,10]. The delivery of prepared food has also flourished, and numerous food delivery services, such as Baedal Minjok and Yogiyo, are currently in operation in South Korea [7].
However, while emerging growth factors are leading to changes in Korea’s online food market, the market’s response and its effects have not been identified. In addition, scant research exists about the causal relationship and the feedback effect between the use of different media devices (mobile and PC-based devices) and the product group (fresh food, processed food, and food service) as growth factors. Therefore, this study explores the changes in the new online food market by analyzing the causal relationship between the media device used and product groups through the vector error correction (VEC) model using time series data, in order to identify the growth potential in the online food market.
Researchers have mainly studied online food shopping in terms of marketing [5,8,10,11,12,13,14,15,16,17,18,19,20,21,22,23,24,25,26], such as the distribution channel and the purchasing behavior of consumers. However, these studies did not properly reflect the new environment of online food shopping as they did not distinguish between the media device used and food services. Technological evolution, such as an emergence of new media and the change in consumers’ needs, which are important for the sustainable growth of the online food market, were not properly considered in those works. This study aimed to analyze the realistic online food shopping environment using those factors, and we explore the potential of online food shopping for its sustainable growth.
2. Literature Review
This section is divided into three parts. The first part reviews the definition of online food shopping, the second part reviews prior studies of online food shopping, and the third part reviews the current status of the online food market in South Korea.
2.1. Definition of Online Food Shopping
Online shopping refers to the process of purchasing goods and services from merchants who sell on the Internet [11]. This study embraced Statistics Korea’s [12] definitions of online shopping as a combination of PC-based online shopping and mobile device online shopping. PC-based online shopping refers to the purchase of products through the Internet using a personal computer—a desktop PC or laptop. Mobile shopping refers to the purchase of products through a mobile software application (app) utilizing enhanced portable or mobile devices, such as smartphones and tablet PCs. This study also utilized Statistics Korea’s [12] definitions of each product group in the online food market, including fresh food (agricultural, livestock, and fishery products), processed foods (such as fully processed snacks, instant noodles, and nonalcoholic beverages), and food service delivery of freshly cooked foods. Statistics Korea publishes the transaction amounts of each of these product groups in its Monthly Online Shopping Survey.
2.2. Review of Prior Studies on the Online Food Market
Researchers have explored food-related online shopping since the early 2000s. Initially, studies defined and classified characteristics based on the emergence of new distribution channels that used the Internet. Subsequent studies analyzed the purchasing behavior and patterns of remote transactions between trading partners, including attributes such as consumer trust in online shopping, loyalty, perceived ease of use, and perceived usefulness, and identified cognitive dissonance relating to trading products. The field has broadened as the products traded online have expanded from industrial products, such as electronic, clothing, and household goods, to food and food service; indeed, item classifications have been further subdivided. Recently scholars have focused on fresh foods, such as agriculture, fishery, and livestock products, with the introduction of supplementary measures to prevent the spoilage and deterioration of food—considered the biggest drawback of food-related online shopping [5]. Other studies have investigated the growth of mobile shopping—with its enhanced portability and convenience—over PC-based online shopping, and have explored multichannel distribution strategies compared to online-only distribution channels. The literature relevant to food-related online shopping draws on several streams of research.
First, scholars considered online shopping as a new channel for food distribution. Anckar et al. [13] studied Nettimarket.com—a Finnish online grocery business launched in 1998—to examine the relationship between business models and the creation of consumer value in online grocery shopping. They argued that while Nettimarket’s business model theoretically provided the virtual store an opportunity to compete with competitors on the basis of price and service, in practice, its predominantly elderly and disabled customer base was both small and slow-growing; thus, Nettimarket was forced to set higher prices than its competitors. Kim et al. [10] explored online food shopping in Korea, direct and indirect distribution channels, and the role of infomediaries; that is, online agents that specialize in collecting and distributing information. These infomediaries provide consumers price and product information in exchange for information about themselves; in turn, they provide this consumer information to companies or vendors [14,15]. The authors analyzed direct and indirect distribution channels based on the four main functions of distribution—the supply chain, logistics, information, and auxiliary functions. They found that producers (farmers) directly sold and marketed to consumers online (direct distribution), unless infomediaries were available. In that case, infomediaries—instead of producers—sold and marketed to consumers online (indirect distribution) [10]. Thus, Kim et al. determined that infomediaries played an important role in directing online shoppers into direct or indirect distribution channels, while supporting the participation of farmers, diversifying product composition, and contributing to the widening of consumer choices. Hanus [5] presented the conditions for online grocery shopping and consumer attitudes toward purchasing food via the Internet, and noted that with online grocery supermarkets, consumers have convenient online access to products and stores globally with no location or time constraints. However, he also noted consumers’ risk of being misled by misinformation and the difficulty of selecting and handling fresh food products. Verdouw et al. [16] explored food-based Internet transactions in terms of agri-food supply chain networks. They discussed the opportunities for Future Internet technologies to address specific demands on information systems for logistics in the food and agribusiness sector, and presented a design for smart agri-food logistic information systems. Verdouw et al. [16] demonstrated that these systems virtualized the logistics flows from farm to fork, supported a timely and error-free exchange of logistics information, and provided functionality for the intelligent analysis and reporting of exchanged data to enable early warning and advanced forecasting.
Secondly, researchers studied consumer purchasing behavior in the context of online food shopping. Morganosky and Cude [17] measured consumer response and demand based on 243 consumers in the United States who had purchased food online, and found that 70% of the respondents indicated that their primary reasons for purchasing groceries online were its convenience and time-saving aspects. In addition, they found that consumers shopped online due to factors such as their demographic characteristics (education, income, age, and number of adults and children in the household), willingness to buy products online, perception of time-saving, and purchase experience. Hansen [18] measured the relationship between consumers’ personal values, attitudes, social norms, perceived behavioral control (PBC), and consumers’ intention to purchase food online, based on the vertical value–attitude–behavior approach of the theory of planned behavior (TPB). After dividing 1058 Swedish consumers into three groups—consumers who did not buy anything online, consumers who bought everything online except food, and consumers who bought everything online including food—Hansen found that personal values were related to attitudes toward online grocery purchases. Scuderi et al. [19] examined Italian consumers’ purchasing attitudes toward traditional (offline) and online markets when shopping for organic products. They analyzed consumers’ behavior to understand whether it was conditioned more by offline or online channels, and to determine which parameters conditioned the purchasing process. They found that offline channels for organic products conditioned consumers’ choices, and were related to offline word-of-mouth (WOM), experiential and sensory marketing strategies, and direct contact with the producer. Kim et al. [20] analyzed the purchasing recognition structure of 295 online fresh food shoppers using the combined theory of technology acceptance (TAM) and the planned behavior (TPB) integrated model. They found that three exogenous variables—technical characteristics of online shopping, reliability of online shopping, and personal characteristics of users—had a significant effect on the technology acceptance model (TAM) side, while PBC, which indicates time and physical margins and reluctance to use, was found to be significant on the TPB side.
Thirdly, scholars explored the technological environmental changes and countermeasures related to online food shopping. Frits et al. [21] analyzed developments in electronic trade platform infrastructures in the United States and European agri-food sector between 2000 and 2002. Of the 85 existing platforms in the year 2000, only 25 remained active in 2002; however, there were market entries of new platforms and existing platforms from various types of partnerships. Their study identified a range of strategic developmental and evolutionary lines of successful platforms that included initiating cooperation with other platforms on the use of specific features and the development, improvement, and use of standards; gaining support of major market participants; improving trading functionalities; and expanding value-added services. Lehmann et al. [22] emphasized that the food sector needs to efficiently build an appropriate organization and control of processes and ensure the safety and quality of its products to establish consumers’ trust. They posited that it was necessary to make process control and consumer communications efficient using information and communication technologies (ICT), and provided an overview of the state-of-the-art in three use cases—agriculture, agri-food, and food awareness—along with the flow of food products. Boyer and Hult [23] conducted a case study of four online ordering and home delivery grocery stores and 2440 of their consumers. Each grocery store used a different operations strategy based on where the customer order was to be fulfilled (from existing shops or from a distribution center) and the delivery method (direct to consumers or indirect via consumer pickup or third-party logistics service). They found that e-business, product quality, and service quality had a significant influence on consumers’ intention to re-purchase. Benn et al. [24] examined how consumers used information to search for products in an online grocery store environment and recorded the eye movements of forty participants while they were doing their weekly shopping online. They found that 95% of participants used the site’s virtual departments while searching for products online, 80% used the site’s search function, and 68% searched through specially provided pages, tending to look closely at photos rather than detailed product descriptions.
Fourthly, researchers explored the socioeconomic environmental changes caused by emerging mobile and social media. Shukla and Sharma [25] examined the role of mobile technology in grocery shopping among 346 Indian consumers. Using the TAM, they tested how the participants perceived the use of technology—specifically, mobile apps—in grocery shopping. They concluded that consumers were well adapted to the use of mobile apps for general shopping, but the influence of a mobile app as a tool was limited in the grocery sector. Suhartanto et al. [8] estimated the direct influence of food quality and e-service quality on consumers’ loyalty toward online food delivery services, and its indirect influence through the mediation of customer satisfaction and perceived value. They collected primary data on 405 online food delivery service users, analyzed the data using partial least squares (PLS), and confirmed the direct effect of food quality—but not e-service quality—on online customer loyalty toward food delivery services. Elghannam et al. [26] found that consumers preferred direct contact with food producers to avoid the various intermediaries in the supply chain; thus, direct (short) food supply chains (SFSCs) emerged. They proposed a new approach to SFSCs utilizing social media sites, and surveyed thirty-two respondents using a focus group approach to understand consumers’ awareness and acceptance of SFSCs. Results confirmed the use of social media and electronic word-of-mouth (eWOM) to support the SFSC channel.
In summary, Anckar et al. [13] reported negative findings in the early period of online food shopping, when both a small customer base existed and only a small number of consumers purchased food online. However, researchers redefined online food shopping as a retail distribution channel for food and identified its advantages and disadvantages. Further research was conducted from a marketing perspective to understand the purchasing behavior of consumers who shop for food online, based on the theory of behavior. With the evolution of the social, economic, and technological environments of online food shopping, recent studies [8,16,19,20,22,23,24,25,26] have explored online food shopping as a new food distribution channel. However, existing studies have not determined if the growth of online food shopping reflects the growth of mobile shopping—due to its enhanced portability and convenience—compared to that of PC-based online shopping. Moreover, existing studies reflect the emergence of new online shopping cultures, such as food delivery services and SFSCs, but have not identified the relationship between them. Therefore, studies incorporating diverse online shopping media and product groups are needed to identify the potential for sustainable growth of online food shopping.
2.3. Status of the Online Food Market
Globally, South Korea has the highest online grocery market penetration rate according to IGD, a leading online grocery marketing site [27]. While China has the largest online grocery market size in terms of value, at US$ 50.9 billion, it has only 3.8% of the total online market [27]. Japan has 7.1%, followed by 6.0%, 4.5%, 2.1%, and 1.6% in the United Kingdom, France, Australia, Japan, and the United States, respectively [27].
According to Statistics Korea, as of 2018, 12.3% of Korean retail food is purchased online [1,12]. Considering that food is sold through several retail distribution channels, such as department stores, hypermarkets, supermarkets, and convenience stores, this does not represent a small proportion. Compared to 6.0% in 2014, the figure has more than doubled in just four years [1].
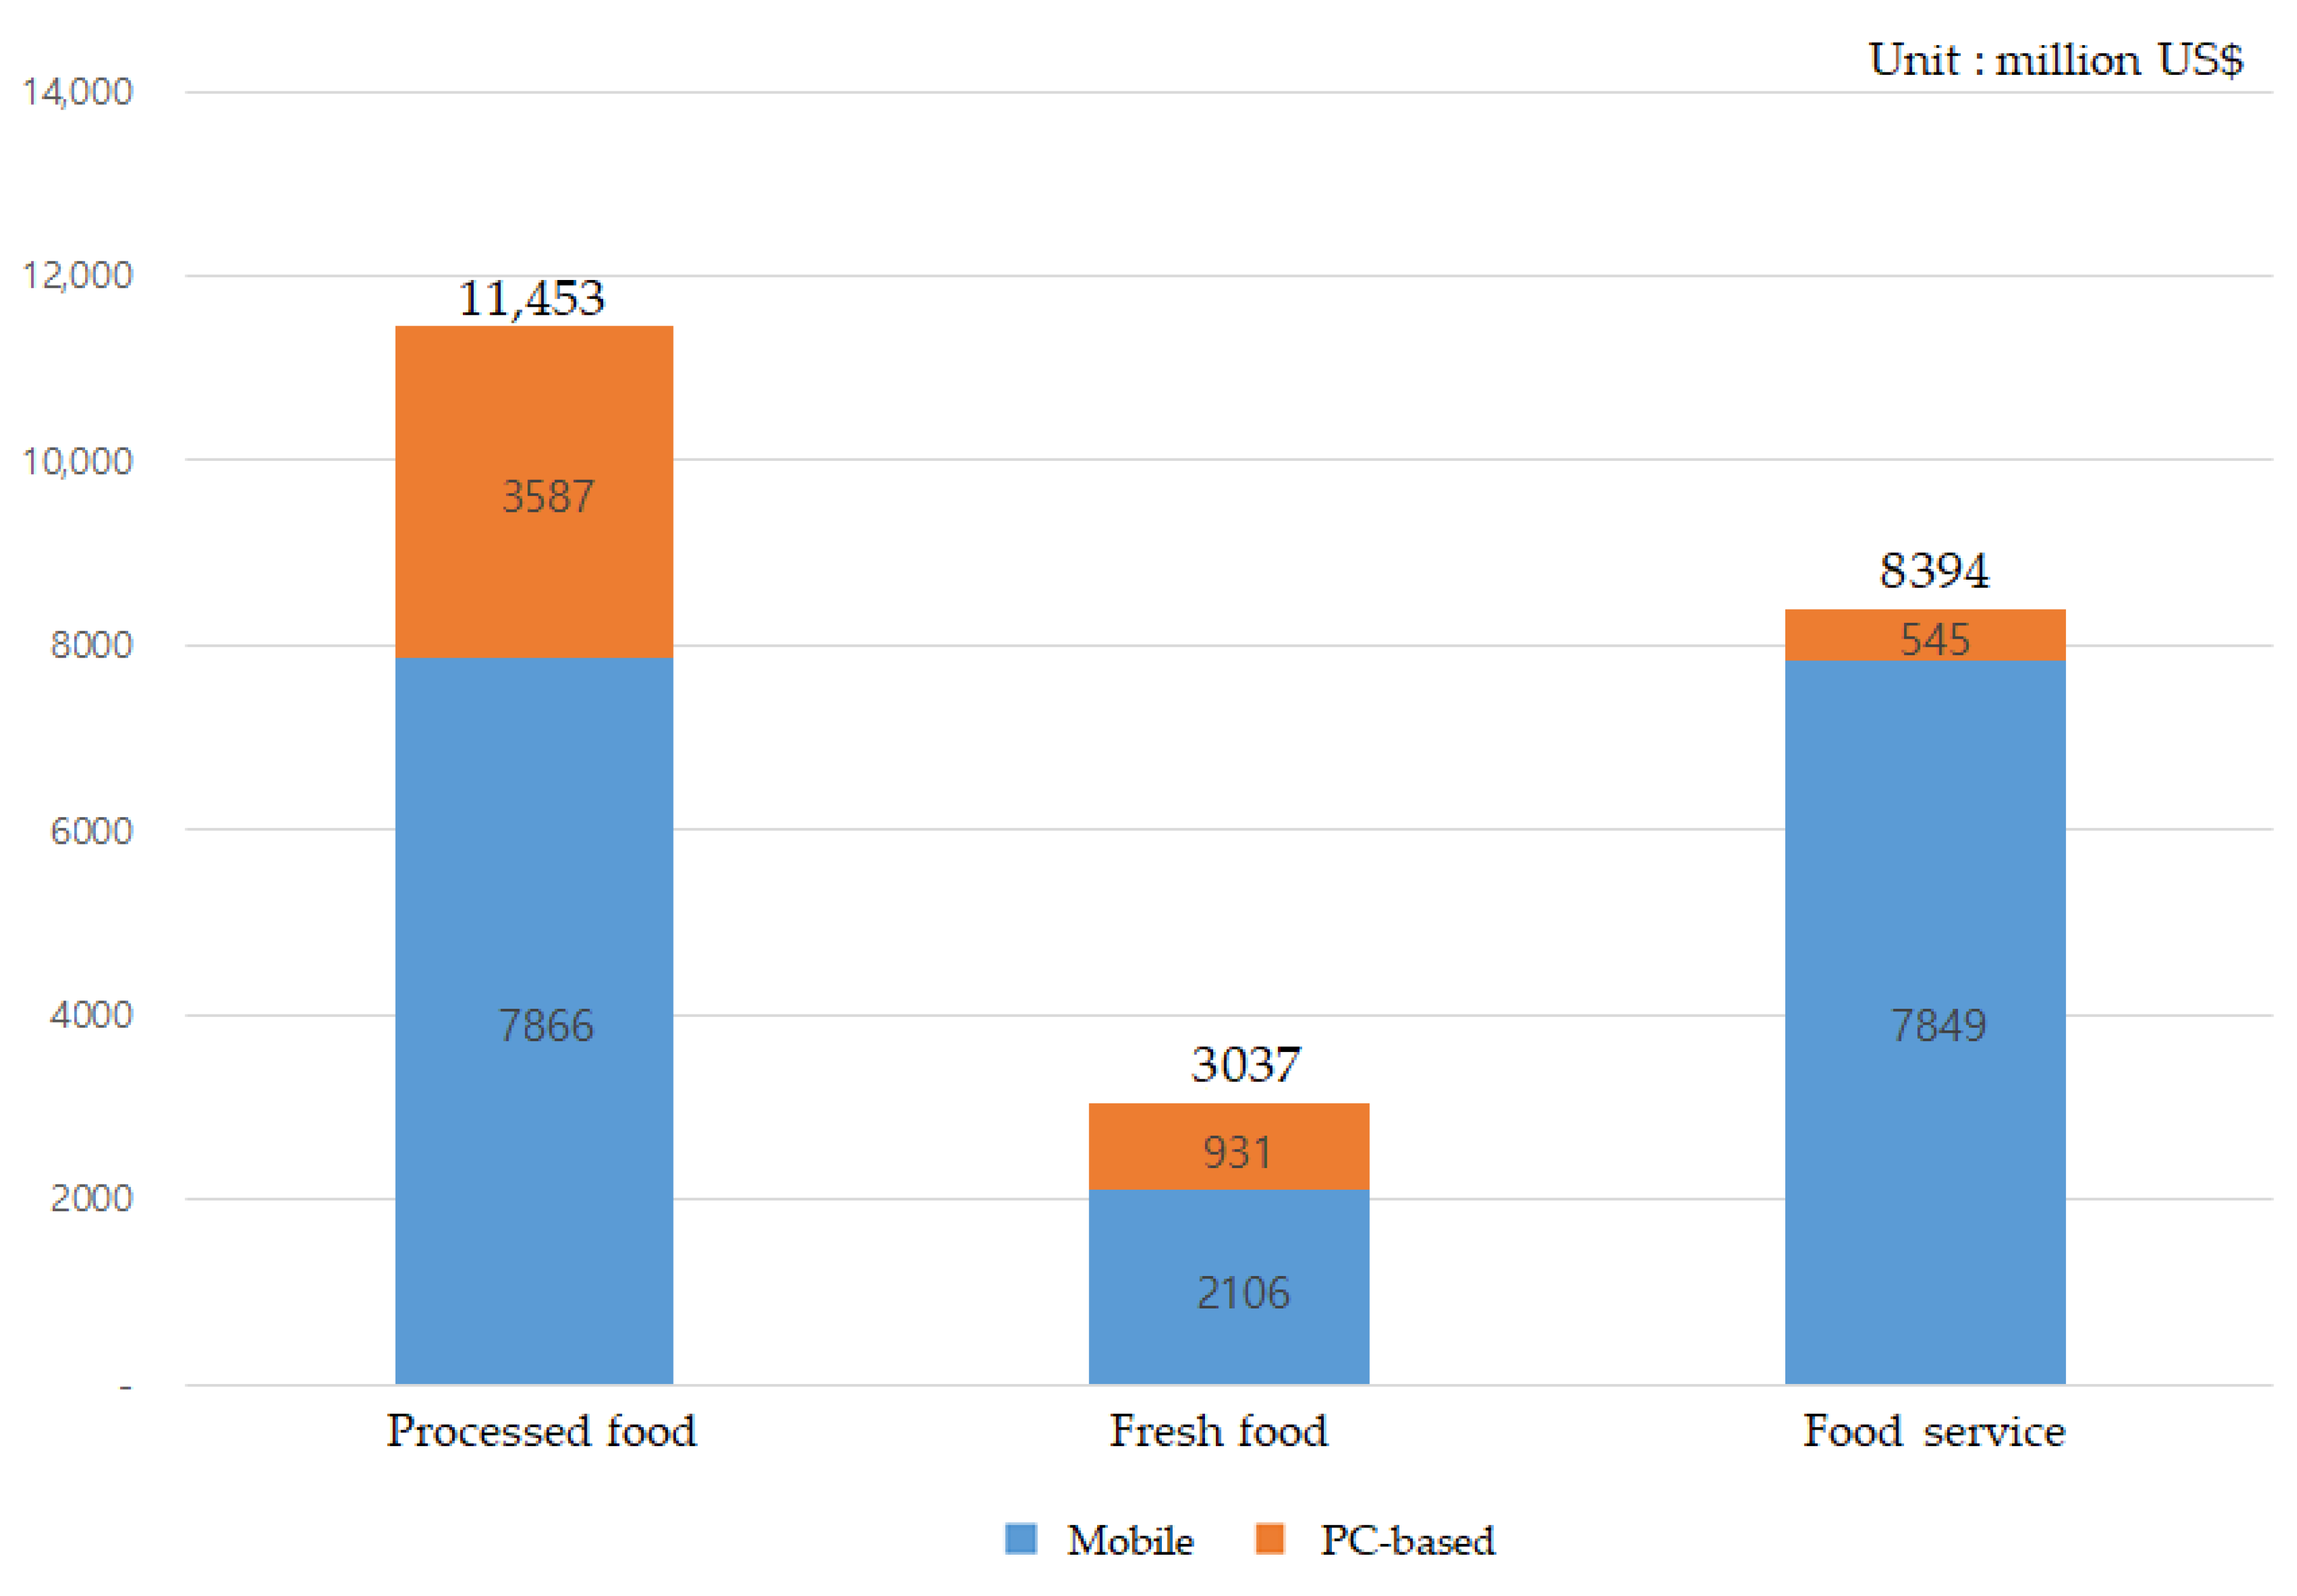
The total transaction amount of the Korean online shopping market was US$ 116.02 billion in 2019, an increase of 197.1% compared to US$ 39.054 billion in 2014 [12]. Mobile shopping and Internet shopping accounted for 64.4% and 35.6% of the total, respectively, in 2019. By product group, fresh food, processed food, and food services (delivery) amounted to US$ 22.884 billion, accounting for 19.7% of the total transaction amount. As shown in Figure 1, processed food was the leader in this product group at US$ 11.453 billion (50.0%), followed by food service at US$ 8.394 billion (36.7%), and fresh food at US$ 3.037 billion (13.3%).
Meanwhile, the total transaction amount of mobile shopping in the online market significantly increased by 483.1% to US$ 74.742 billion in 2019 from US$ 12.819 billion in 2014 [12]. As shown in Figure 1, the food transaction amount totaled US$ 17.821 billion, accounting for 23.8% of total mobile online shopping transactions. For food transactions using mobile online shopping, processed food and food service amounted to US$ 7.866 billion (44.1%) and US$ 7.849 billion (44.1%), respectively, while fresh food amounted to US$ 2.106 billion (11.8%). However, the transaction amount of PC-based online shopping increased by 57.3% to US$ 41.278 billion in 2019 from 26.235 billion in 2014 [12], and of this, the food transaction amount totaled 5.063 billion dollars, accounting for 12.3% of the total. For food transaction in mobile shopping, processed food was the highest at US$ 3.587 billion (70.8%), followed by fresh food at US$ 931 million (18.4%) and food service at US$ 545 million (10.8%). Thus, mobile online shopping is massively dominating PC-based online shopping. As of 2019, mobile online shopping accounted for 77.9% of total food transaction amount, while PC-based online shopping accounted for 22.1%. For food service specifically, mobile online shopping was approximately 14.4 times higher than PC-based online shopping.
3. Research Methodology
Since the research of Sims [28] in the 1980s, the vector auto regression (VAR) model has evolved as a standard analysis tool for analyzing multivariate time series because statistical tests are often used in determining interdependence and dynamic relationship between variables [29]. The VEC model used as this study’s main method is a special case of the VAR model, and is suitable for multivariate time series data as a simultaneous equation with a minimum of information loss [30]. Moreover, if a secured cointegrated relationship exists, the useful and flexible VEC model enables not only stationary but also nonstationary variables that have a unit root [30,31,32].
The method used in this study consisted of four steps. In step one, the transaction data for the online food market was collected, and the data was prepared for the VEC model analysis. In step two, the unit root was performed to confirm the stability of all variables using the augmented Dickey–Fuller (ADF) test. In step three, Johansen’s test was performed to confirm the cointegrated relationship between each variable. In step four, the VEC model was analyzed to identify the causal relationships between fresh food, processed food, and food service transactions in mobile and PC-based online shopping. In the final step, the direction of causality between each variable was identified through Granger causal analysis.
3.1. Variable Definition and Data Collection
First, each variable was defined as in Table 1 below, in order to make the time series data easier to analyze. Each variable was defined as the transaction amount of fresh food, processed food, and food service traded, using mobile or PC-based devices. Statistics Korea [12,33] has defined the mean of fresh food, processed food, and food service by product groups. Fresh food is defined by fresh agro-food, such as grains, meats, fish, vegetables, and fruits. Processed food is defined by industrial food products, such as coffee, sugar, cooking oil, kimchi, soybean paste, pepper paste, and pickled vegetable [33]. Food service is the delivery service of food, such as pizza, chicken, and Chinese meals, that is cooked and delivered after online ordering [33].
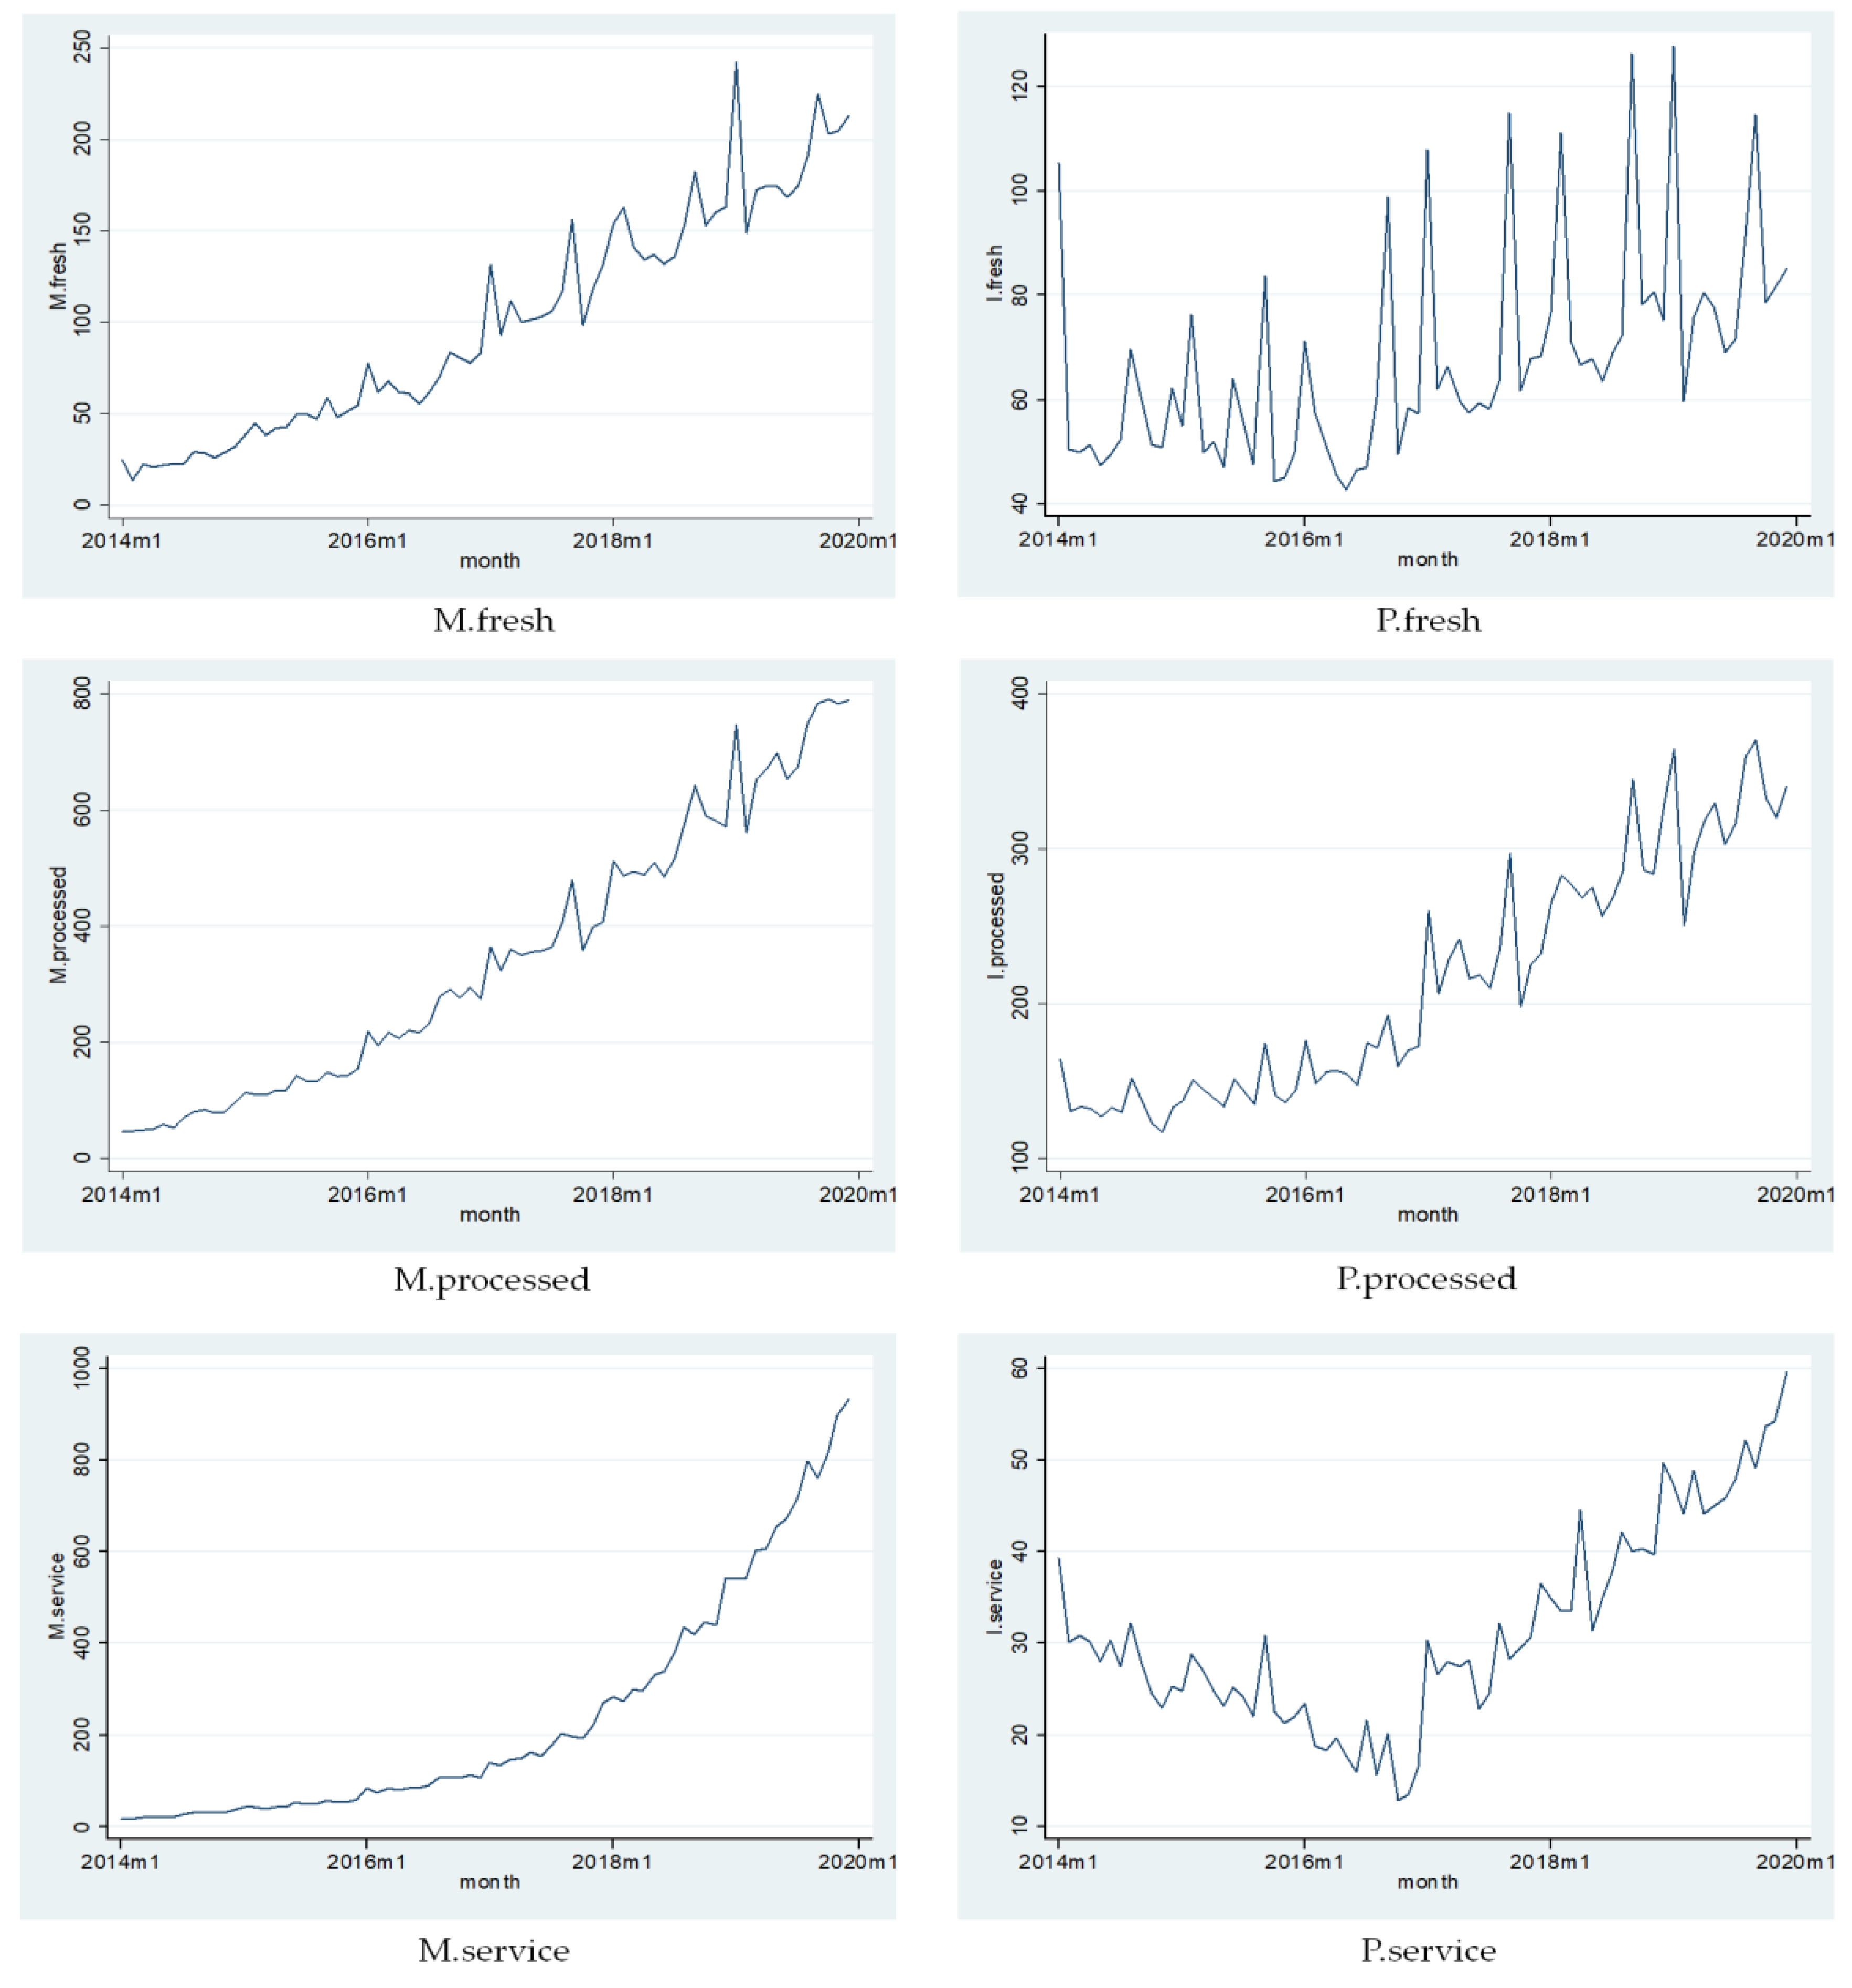
The data used in this study were obtained from Statistics Korea’s Monthly Online Shopping Survey, which provides online shopping transaction data by product group, media, and operation type. Data for 72 months (6 years) from January 2014 to December 2019 were collected and used for analysis in this study. Monthly time series data were constructed by dividing it into the media and product categories. However, food service transaction data were not available for 2014 to 2016, and thus the ratio of food service in the processed food transaction amount for January 2017 was calculated and used as estimated data for the 2014 to 2016 periods. In addition, all time series data were converted into real transaction amounts by applying the consumer’s food and nonalcoholic beverages price index (2015 = 100) provided by the Bank of Korea. In order to convert South Korean currency units (KRW) into US dollars, the standard exchange rate of 1160 KRW to 1 USD as of 20 January 2020 was used for conversion. The time series data that has gone through the aforementioned process is shown in Figure 2 below. All data in this paper were analyzed by STATA 14.0.
3.2. Unit Root Test
In general, most time series data are unstable, with means and variances that are inconsistent over time [31]. If we perform a regression analysis with unstable time series data, a spurious regression phenomenon may occur in which the coefficient of multiple determination () values and the test statistic (t) value for the significance test may appear to be high, even if there is actually no correlation between the variables [31,32]. In order to prevent such a phenomenon, it should be preceded by the unit root test that determines whether the time series data is stable. There are many statistical methods for the unit root test, such as ADF, the Phillips–Perron (PP) test, etc., although the ADF test is the most widely used method [31]. It may be difficult to make a consistent estimation when the DF test is enlarged since the error terms may become autocorrelated; thus, the ADF test is a method of adding distinguishing terms to the model to compensate for such a case. The ADF test can remove or add intercepts and trends [31]. The model including the intercept (a) and trend (T) is shown in Equation (1) below.
3.3. Cointegration Test and Vector Error Correction (VEC) Model
In general, univariate time series models, such as the autoregressive integrated moving average (ARIMA) model, are used when it can be assumed that the explanatory variables have a unilateral effect on the dependent variables but have no feedback effect [32]. However, if there is bilateral causality in two or more time series variables, a multivariate time series model, such as the vector VAR model, should be considered [32]. The VAR model, like the ARIMA model, can be used when all time series variables are stable, so that unstable variables must be stabilized through the use of differencing. However, if the time series variable is differenced, some valuable information and characteristics of the time series variable may be lost. In order to avoid this, the cointegration and VEC model suggested by Engle and Granger [34] can be considered. Engle and Granger [34] developed a representation theorem that “If there is a cointegration between specific economic variables, for example, if , there is a so-called error correction model representing it.” This means that meaningful regression results can be derived even if unstable time series variables can be stabilized through linear combinations. Therefore, the VEC model can be considered as one of the VAR models, which has been designed for use with nonstationary time series data having a cointegration relationship [30].
In order to apply the VEC model, at first, the cointegration relationship between the variables must be determined. There are two methods for determining the cointegration relationship—Engle and Granger’s two-step test and Johansen’s test [34,35,36]. Of these two methods, Johansen’s test does not just test the cointegration, but also performs various hypothesis tests related to the estimation of the cointegration parameters and other model settings when cointegration exists [32]. Therefore, Johansen’s cointegration test was used in this study.
The VEC model shows the error correction tendency to recover the long-run equilibrium relationship by correcting the error, when deviations or errors occur in the long-run equilibrium relationship between the integrated variables [37]. When cointegration relationship exists, the error correction term (ECT) reflects the unbalanced error between the two variables and can express not only the changes between the variables but also the effect of the degree of imbalance. In addition, the error correction term coefficient () is a speed adjustment coefficient and indicates how quickly the unbalanced error deviating from the long-term balance returns to the balanced state [32]. Therefore, based on the representation theorem developed by Engle and Granger [34], we derive six VEC models—M.fresh, M.processed, M.service, P.fresh, P.processed, and P.service—which were built by replacing the six variables used in this study as dependent variables Y and independent variables X for this study. Those VEC models were presented by the following Equations (2)–(7).
4. Research Results
4.1. Basic Data Analysis
Time series data of online shopping in South Korea are presented in Table 2. The mean value was the highest for M.processed and the lowest for P.service. This means that Korean consumers mostly purchased processed foods using mobile devices, while the purchase of food services via PC-based devices was relatively small. The minimum value of the variables was the lowest for P.service at 12.77, and the highest for M.service at 932.28. This shows that online food service shopping is more actively traded through mobile devices rather than through the PC-based devices. The standard deviation, which indicates how much data deviates from the mean, was the highest for M.service at 250.64 and the lowest for P.service at 10.93, indicating the largest deviation in food service.
4.2. Unit Root Test and Lag Selection
First, the unit root test was performed to confirm the stability of each time series variable. If the stability of all the time series variables can be secured, the VAR model can be used—otherwise the VEC model can be considered. Therefore, the unit root of each time series variable was checked through the ADF test first. As a result of testing the unit roots as shown in Table 3 below, it was confirmed that all variables were unstable because the null hypothesis that unit roots exist could not be rejected.
Models that measure the causal relationship between variables, such as the VAR model, are sensitive to the number of lags in how many past values should be included in the equation [38]. In lag time extension, the autocorrelation of the residual term may be reduced, but it can lead to a problem of low efficiency [39]. For this reason, appropriate lags generally are selected using information criteria such as Akaike’s information criterion (AIC), Hannan–Quinn information criterion (HQIC), and Schwarz Bayesian information criterion (SBIC), and the model with the smallest value is chosen [38,40,41]. Meanwhile, the likelihood-ratio (LR) test hypothesizes that all the coefficients on the pth lags of the endogenous variables are zero [42]. Rejecting the hypothesis, we should consider it appropriate for the most lags [42]. As a consequence, three lags were selected in consideration of the LR tests—AIC, HQIC, and SBIC—as shown in Table 4 [40,41].
4.3. Cointegration Test and VECM Analysis
All the time series variables were observed to be unstable at the present time based on the aforementioned unit root tests. Therefore, each variable needed to be stabilized through differencing, or needed to be checked for cointegration, in order to perform multivariate time series analysis. Johansen’s test results are shown in Table 5. As a result of Johansen’s test, it was confirmed that at the 5% significance level, there were three or less cointegration vectors (r ≤ 3) because the diagonal sum (trace) and the maximum eigenvalue statistic were smaller than the critical value.
It was confirmed through Johansen’s test that there were three cointegration relationships between the variables, and that it could be extended to the VEC models. Accordingly, the VEC model of each variable was estimated as shown in Table 6. First, the VEC models could be considered statistically significant looking at the chi-squared values. The R-squared values were also relatively significant, and the variable with the highest explanatory power was M.service.
A total of three error correction terms were derived for each variable in the cointegration relationship. In the long run, it showed a balanced relationship between the product groups of PC-based online shopping (P.fresh, P.processed, and P.service) that affect the mobile shopping product groups (M.fresh, M.processed, and M.service). If the three error correction terms (ECT = 0) in the long-term equilibrium relationship were 0, the following cointegration equation could be derived.
First, as shown in Equation (8), the long-term elasticities of P.fresh, P.processed, and P.service, with respect to M.fresh were −0.742, 0.841, and −0.953, respectively. It was found that all independent variables were significant at the 1% and 5% significance levels. Therefore, when the mobile fresh food transaction amount increases by 10%, the PC-based fresh food transaction amount decreases by 7.42%. In addition, when the PC-based processed food transaction amount increases by 8.41%, the PC-based food service transaction amount decreases by 9.53%. In other words, the mobile fresh food replaces the PC-based fresh food in the long term; the mobile food service also has the effect of complementing the PC-based processed food. In particular, it can be seen that mobile devices acted as a medium for trading fresh food on behalf of the PC-based devices.
Secondly, the long-term elasticities of P.fresh, P.processed, and P.service with respect to M.processed were −1.029, 2.384, and −6.042, respectively, as shown in Equation (9). However, while P.fresh was not statistically significant, P.processed and P.service were statistically significant at the 1% significance level. Therefore, when the mobile transaction amount for processed food increases by 10%, the PC-based transaction amount for the same increases by 23.84%, and the PC-based food service transaction amount decreases by 60.42%. In the long term, the mobile processed food supplements and grows together with the PC-based processed food, and has the effect of replacing the PC-based food service.
Thirdly, the long-term elasticities of P.fresh, P.processed, and P.service with respect to M.service were −12.281, 0.826, and 2.76, respectively, as shown in Equation (10). Only P.fresh was found to be statistically significant at the 1% significance level. Therefore, when the mobile food service transaction amount increases by 10%, the PC-based fresh food transaction amount decreases by 122.81%. In the long term, the mobile food service has the effect of replacing the PC-based fresh food. It is shown that the convenience of the mobile food service that delivers cooked food may replace the purchase of fresh food that requires a complicated cooking process.
The coefficient of the error correction term (ECT) is a speed of adjustment coefficient, which indicates how quickly the unbalanced error deviating from the long-term balance returns to the balanced state [31,32]. The speed of adjustment coefficient was found to be significant in all variables with the exception of P.service. In the M.fresh model, the ECT3 coefficients were adjusted in the negative direction. In the M.processed, M.service, P.fresh, and P.processed models, the ECT2 coefficients were adjusted in the positive direction, and the ECT3 coefficients were adjusted in the negative direction. Among them, the M.service and P.processed models showed the unbalanced errors of ECT2 and ECT3, respectively, returning most quickly in the positive and negative directions, respectively, to achieve the long-run equilibrium relationship.
The short-term equilibrium relationship between the models was as follows. First, the M.fresh model showed a negative impact of △ M.processed from 1 month ago, and a positive impact of △ M.service from 1 month ago. When the change in the mobile processed food transaction amount from one month ago increases by 10%, the mobile fresh food transaction amount decreases by 2.59%, and when the change in the mobile food service transaction amount from one month ago increases by 10%, the mobile fresh food transaction amount increases by 4.32%.
Second, the M.processed model showed positive impacts of △ M.fresh and △ P.fresh from one month ago, and a positive impact of △ M.service from two months ago. In addition, it showed a negative impact of △ M.processed from one to two months ago. When the change in the mobile and PC-based fresh food transaction amount increases by 10% from one month ago, the mobile processed food increases by 10.01% and 1.85%, respectively. In addition, when the change in the mobile food service transaction amount increases by 10%, the mobile processed food transaction amount increases by 5.08%. Furthermore, the mobile processed food shopping adjusts on its own, being negatively affected by the changes in the transaction amount from one to two months ago.
Thirdly, the M.service model showed positive impacts of △ M.fresh from one to two months ago and △ P.fresh from one month ago. In addition, it showed negative impacts of △ M.processed and △ M.service from one to two months ago. Furthermore, it showed a positive impact of △ P.service. When the change in the fresh mobile food transaction amount increases by 10% from one to two months ago, the mobile food service increases by 11.1% and 12.28%, respectively. In addition, when the change in the mobile processed food transaction amount increases by 10% from one to two months ago, the mobile food service decreases by 7.09% and 4.55%, respectively. When the change in the PC-based food service transaction amount increases by 10%, the mobile food service transaction amount increases by 12.88%. In addition, the mobile food service adjusts on its own, being negatively affected by the changes in the transaction amount from one to two months ago.
Fourthly, the P.service model showed only a positive impact of the △ M.service from one month ago. When the change in the mobile food service transaction amount increases by 10% from one month ago, the PC-based fresh food transaction amount increases by 3.17%.
Fifthly, the P.processed model showed only a negative impact of the △ M.processed from one month ago. If the change in the mobile processed food transaction amount increases by 10% from one month ago, the PC-based processed food transaction amount decreases by 4.52%.
Sixthly, the P.service model showed a positive impact of the △ M.fresh from two months ago, and a negative impact of the △ M.processed from one to two months ago. In addition, it showed a negative impact of the △ P.service. If the change in the mobile fresh food transaction amount increases by 10% from two months ago, the PC-based food service transaction amount increases by 1.84%. If the change in the mobile food service transaction amount increases by 10% from one to two months ago, the PC-based food service transaction amount decreases by 1.04% and 1.08%, respectively. In addition, the PC-based food service transaction amount adjusts on its own, being negatively affected by the changes in the transaction amount from one month ago.
4.4. Granger Causality Analysis
It was found through the VEC model analysis that there was an error correction bias in each variable. However, this meant that the independent variable affected the dependent variable, while not explicitly showing the exact direction of causality. For this reason, Granger causality analysis was needed to check the direction of causality of each variable. Granger causality analysis is the most commonly used analytical method to derive causality between variables [29]. If Granger causal relationship exists between each time series, one variable may help predict the future value of the other variable [43]. Finally, Granger causality analysis was performed on the variables determined to have a significant effect in each VEC model. As a result, it was confirmed that Granger causality exists in all models except the P.service model, as shown in Table 7. Therefore, with the exception of the P.service model, statistically significant variables in the other models had causal effects on each dependent variable.
5. Discussions
This study analyzed the causal relationship of each media and product group by using the VEC model in order to understand the changes in the online food market in South Korea. As a result, it was possible to comprehend the long-term and short-term equilibrium relationship between each variable through the VEC model. The characteristics of online food shopping in Korea according to this relationship follows.
First, there is a feedback relationship between the mobile fresh food and food service transaction amount. The portability and convenience referred to prior studies [4,7,25,44] have been strengthened on mobile devices, rather than on PC-based devices. The advantages of the mobile devices have a positive effect on the fresh food and food service transaction amounts. In particular, using apps in mobile online shopping enhanced consumers’ convenience, increasing the usefulness and ease of use versus simply searching the Internet, consistent with prior studies’ findings [4,7,25]. Moreover, the two food product groups used mobile devices as a window for the direct and interactive communication with producers (or sellers) [44]. For fresh food, the risk of product spoilage and deterioration may be reduced, and the strengthened mobile features may ease direct delivery from the production area in terms of the SFSCs referred by Elghannam et al. [26,45,46]. In addition, food service via a mobile app is replacing the traditional phone orders and provides consumers the opportunity to receive photos, product descriptions, and reviews [25,44,46]. The two food product groups provide a variety of information and strengthen communication with producers (or sellers), while feedback effects are formed that have mutually positive effects on each other. Furthermore, it shows that there is a long-term and short-term causal relationship between the mobile food service and the PC-based fresh food transaction amount. This feedback effect and causal relationship can act as factors enabling sustainable mutual growth between the two food product groups.
Secondly, the PC-based transaction amount for processed food has a positive effect on the mobile fresh food and processed food transaction amount in the long term, but the mobile transaction amount for processed food has a negative effect in the short term. Earlier, PC-based online shopping mainly focused on industrial products, and processed foods that did not easily deteriorate or become damaged were also actively traded. Currently, online processed food transaction amount accounts for 50% of the total online food transaction amount, of which the PC-based online transactions amount is 31.3%, which is a higher proportion than any other food product group [12]. This transaction experience with processed food has a positive effect on consumers’ food transactions using mobile devices in the long term. Cheong and Park [47] verified that PC-based online experience has a positive causal relationship with ease of use. However, in the short term, the mobile transaction amount for processed food has a negative impact on all media and product groups, except for PC-based fresh food shopping. This can also be seen as a substitution effect of products, showing that online shopping is becoming more popular for fresh or cooked food, instead of processed food. Additionally, the mobile transaction amount for processed food has been negatively affected by its own past transaction amounts. This shows that mobile shopping for processed food tends to maintain a certain level or decrease through self-adjustment rather than showing continuous growth. In summary, following the technological evolution of ICT and the platform development for mobiles that were discussed by Verdouw et al. [16] and Frits et al. [21], online shopping has moved away from its past focus on processed food transactions using the PC-based devices and has expanded into mobile devices—further reflecting the expansion into distribution channels related to various food product groups.
Thirdly, in the online food service market, mobile online shopping is gaining short-term positive effects from PC-based online shopping. In previous studies examining food delivery service, Lim and Jeon [7] stated that consumers perceive mobile devices’ usefulness and ease of use toward information and restaurant services, and Suhartanto [8] estimated the direct influence of food quality—but not e-service quality—on consumers’ loyalty. This means that consumers may be sufficiently motivated if food quality, restaurant information, and service are secured. Moreover, after technologically acquiring the use method of the delivery service using mobile or PC-based devices, consumers may shift to an online food service (delivery) from traditional delivery services. In the past, South Korean consumers ordered food service via the phone, but recently they shifted to both PC-based and mobile devices. With mobile devices, specifically, consumers can purchase their preferred food and receive restaurant and food information through mobile apps. Consumers who previously purchase food services via PC-based devices are shifting to mobile devices because of their enhanced convenience, thus creating a short-term equilibrium relationship [4,7,25,48]. However, in the VEC model, the changes in the previous PC-based food service transaction amounts are having a negative effect on their own previous transaction amounts—although this was not confirmed by the Granger causality test.
Although the statistically significant independent variables are different for each product group, this study confirmed that the factors that have a long-term effect on the mobile food transaction amounts are PC-based fresh food, processed food, and food service. In addition, the mobile fresh food and the mobile food service have a short-term feedback effect and a long-term causal relationship, and this study confirmed that sustainable shared growth may be possible. In the case of processed food, while PC-based online shopping has played a role in driving the growth of mobile online shopping in the long term, processed online food shopping through mobile devices tended to have a negative impact in the short term and the transaction amount tended to decrease. In addition, PC-based online food service shopping serves as an important factor in helping both the growth of mobile fresh food and processed food online shopping in the long term, and the growth of mobile online food service shopping in the short term.
Accordingly, we could confirm that consumers’ platform for the online food shopping have been changing from PC to mobile devices as the technological paradigm is changed, and sales of food have been expanded from processed food to fresh food or food service as consumers pursue convenience. We explain these changes from the perspective of sustainable development as referred by Azpagic and Perdan [49], such as the social, economic, and environmental objects, as follows [50].
First, in terms of the social object, online food shopping can make the consumer’s life and their online communities more prosperous. Social sustainability is defined that a life-enhancing condition and the process that is achieving the condition in communities [51]. Consumers can enhance their quality of life as purchasing the various products and services but paying less using technological advance. Moreover, they can participate in consumer-oriented online communities, and obtain valuable information based on abundant information on online. In particular, with the character of food requiring strong safety and confidence, consumers actively use their online communities, such as social media, to acquire accurate information on products and services.
Secondly, in terms of the economic object, online food shopping can promote digital economic activities in the online space, purchasing a lot of products and services using the various media. The digital economy is defined by all economic activities (business, government, and non-profit) that are performed using information technologies (hardware, software, app, and telecommunications) [52]. Technological advance in ICT promotes to form a new market platform economically. As developing ICT and pursuing the consumer’s convenience, the food delivery service market flourished due to delivery companies such as Baedal Minjok and Yogiyo, and the volume of quick delivery service market that enables delivering fresh food within 12 h was also expanded. Especially, these changes in the online food market promote the SFSCs, and the consumer’s benefit, and increase its utility by expanding the width of choice toward use media and products [26]. Furthermore, if a seller is a farmer (a producer), a direct transaction between the farmer and a consumer can promote an increase in the farmer’s income, and directly serve local fresh food to consumers [10].
Thirdly, in terms of the environmental object, online food shopping can be more environmentally friendly compared to an offline food transaction. The above mentioned online food shopping can enhance the SFSCs, thus it enables to save the physical resources such as time, space, and cost of transactions [26]. Moreover, these savings can contribute to solving the environmental problems in offline transactions, such as traffic pollution, inefficient logistic costs, and excessive promotion. In the future, if online media and consumer’s width of choice are expended by the evolution of ICT; the informational move will actively outperform the physical move, thus environment problems will decrease in food transaction.
To the end, this study identified that the online media and food product groups in the online food market are expanded by technological advances and the pursuit of consumer’s convenience. Moreover, these expansions of online food shopping will impact positively on society, the economy, and the environment to support sustainable development in the food industry.
6. Conclusions
This study analyzed the causal relationships of time series data using the VEC model to gauge the sustainable growth potential of the South Korean online food market with advanced ICT services. The causal relationships between media devices (mobile and PC-based devices) and product groups of online food shopping were examined using data published by Statistics Korea. This study confirmed that the online food shopping medium is shifting from PC-based devices to mobile devices, and the product groups are diversifying from processed food to fresh food and food service. Based on these results, we identify the marketing implications (place, product, and promotion) of the online food market for its sustainable growth as follows.
First, in terms of place (channel), marketers in the future should preemptively prepare for the emergence of new media. In traditional marketing terms, place can indicate the channel in online marketing. In the past, online food shopping was centered on PC-based devices, but product group purchases have shifted with the growth of mobile online shopping. This study confirmed that the past PC-based online shopping experience is affecting mobile online shopping. Consumers are now using mobile devices not only for perishable fresh foods that are susceptible to spoilage and deterioration, but also for food service. When a future medium emerges, marketers should be prepared for consumers’ rapid shift toward the new medium and rapidly adapted for the new online market environment.
Secondly, in terms of product, marketers should expand their product groups. In the past, online food shopping was centered on processed foods; that is, foods that are relatively free from spoilage and deterioration. However, since processed foods have been shown to have limited growth potential, marketers should be prepared to convert to other product groups. With the advent of mobile online shopping, marketers should expand into a product group with high growth potential, such as fresh food and food services, in which interactive communication is possible. Meanwhile, marketers should focus on expanding services rather than goods. If current online food shopping mainly focuses on processed foods and fresh foods, the future focus is likely to be on services, and the online service culture is highly likely to become the daily culture of South Koreans. This trend toward service will become accelerated with the development of new media with increased portability and convenience, and promote sustainable growth.
Thirdly, in terms of promotions, marketers should develop different information channels for mobile and PC-based devices. As prior studies suggest [7,8,20,25,26], online food shoppers are sensitive toward food quality, information, and ease of use. Therefore, sellers (or infomediaries) should provide accurate information and actively promote their products to consumers via social media, such as social network services (SNSs), blogs, and online communities, as future Internet communication will increasingly influence online food shopping. Moreover, they should fulfill their corporate social responsibility by ensuring the safety and quality of products posted on social media.
This study is significant as it analyzed the market for different media and product groups, differing from prior studies, which mainly focused on PC-based online shopping. In addition, this study proved that consumer preference is shifting from PC-based devices to mobile devices, that consumer demand is expanding from processed food to fresh food and food service, and presented a plan for marketers to both prepare for the emergence of new media and expand their product groups. This study also confirmed that mobile fresh food and food services are growing together in a feedback relationship.
In conclusion, online food shopping has the potential for sustainable growth in aspects of society, economy, and environment. Online food shopping can improve a consumer’s quality of life and promote customers to organize online communities in terms of the social aspect, and improve a consumer’s benefit and utility in terms of the economic aspect. Moreover, it can contribute to solving the environmental problems of offline food transactions. Therefore, technological innovation serves more sustainable improvement of life as their convenience to people, and this tendency will continue as ICT and online media continue to develop. Therefore, it is essential to cope actively with the new environment surrounding the online food market in the future and to minimize negative effects caused by technological advances for the sustainable growth of the online food market. For these, it is necessary to develop the more convenient technologies and adapt more various food products (or services) on online in accordance with establishing new online food marketing and distribution platform.
7. Limitations and Future Direction of the Research
Significantly, this study examined the Korean online food market using secondary data, in contrast to prior studies [7,8,17,18,19,20,25,45,46]. While the existing studies mainly analyzed consumers’ perceptions concerning media use or online food purchasing in terms of behavior theories, this study focused on the casual relationship by media and product groups, and predicted the potential for sustainable growth of the online food market.
However, this study also has limitations. First, the number of time series data samples was relatively small, and due to a lack of data, used estimates for food service transactions prior to 2017. However, this limitation can be resolved with the use of Statistics Korea’s Monthly Online Shopping Survey data [12].
Secondly, as Figure 2 demonstrates, mobile devices and PC-based devices have different variability, respectively. Although it can be estimated that each media device (mobile and PC-based devices) was affected by portability and convenience, it is necessary to precisely analyze this. For this analysis, the ARIMA model with seasonality is recommended.
Thirdly, this study did not consider social media and logistics in the analysis process. According to prior studies [19,26], electronic word-of-mouth (eWOM) is a very important purchasing factor in online food channels. WOM fosters online promotion and can attract consumers’ attention. Globally, there were 2.46 billion SNS users as of 2017—and the proportion of respondents (59,970 SNS users) was 65.2% according to a 2018 panel data survey in South Korea [53,54]. Thus, increasing the scale of social media is a crucial variable. Since 2015, a rapid delivery system has emerged in the Korean online grocery market whereby consumers receive their products within twelve hours of ordering groceries online. This system has been adopted not only by major players, but also by small- and mid-sized retail companies; hence, this is an important theme for researchers to explore.
In closing, recently, the so-called zero contact strategy has attracted attention due to the spread of the novel Coronavirus; that is, COVID-19. Zero contact (untact) is the opposite of contact, and signifies facilitating consumer encounters without face-to-face contact with employees [55]. Due to the possible spread of infection, consumers worldwide hesitate to interact face-to-face—the resultant social distancing emphasizes the importance of zero contact in the Korean and the global online grocery market. Hence, future research should focus on changes in the online food market stemming from the influence of COVID-19. This subject will bring forth important research to detect new growth factors in the crisis of public health in terms of social sustainability.
Funding
This research received no external funding.
Acknowledgments
We thank the anonymous referees for their kind comments and thoughtful suggestions.
Conflicts of Interest
The author declare no conflict of interest.
References
- Ministry of Agriculture, Food and Rural Affairs; Korea Agro-Fisheries and Food Trade Corporation. 2019 Food and Food Service Statistics; Ministry of Agriculture, Food and Rural Affairs: Sejong City, Korea; Korea Agro-Fisheries and Food Trade Corporation: Naju, Korea, 2019; pp. 1–61. [Google Scholar]
- IGD, Online Global Growth of 163% Predicted by 2023, Adding $ 257BN to Food Consumer Goods Industry. Available online: https://www.igd.com/articles/article-viewer/t/igd-online-global-growth-of-163-predicted-by-2023-adding-257bn-to-food-and-consumer-goods-industry/i/21745 (accessed on 12 May 2020).
- Bellini, S.; Aiolfi, S. The impact of mobile device use on shopper behavior in store: An empirical research on grocery retailing. Int. Bus. Res. 2017, 10, 58–68. [Google Scholar] [CrossRef] [Green Version]
- Okazaki, S.; Mendez, F. Exploring convenience in mobile commerce: Moderating effects of gender. Comput. Hum. Behav. 2013, 29, 1234–1242. [Google Scholar] [CrossRef] [Green Version]
- Hanus, G. Consumer behaviour during online grocery shopping. In Proceedings of the CBU International Conference on Innovations in Science and Education, Prague, Czech Republic, 23–25 March 2016; pp. 10–13. [Google Scholar]
- Jih, W.J. Effects of consumer-perceived convenience on shopping intention in Mobile commerce: An empirical study. Int. J. E-Bus. Res. 2007, 3, 33–48. [Google Scholar] [CrossRef]
- Lim, J.W.; Jeon, H.M. A study of Factors that affect the intention to use mobile delivery app: Focused on technology acceptance model and flow experience. J. Hosp. Tour. Stud. 2016, 18, 207–226. [Google Scholar]
- Suhartanto, D.; Ali, M.H.; Tan, K.H.; Sjahroeddin, F.; Kusdibyo, L. Loyalty toward online food delivery service: The role of e-service quality and food quality. J. Foodserv. Bus. Res. 2018, 22, 81–97. [Google Scholar] [CrossRef]
- Kim, H.; Kim, M. Analysis of online food purchase behavior and factors determining online purchases by adult consumers. J. Korea Soc. Food Sci. Nutr. 2018, 48, 97–108. [Google Scholar] [CrossRef]
- Kim, J.; Moritaka, M.; Fukuda, S. A study of indirect marketing channel in the fresh food internet transaction: Center of South Korea’s cases. In Proceedings of the Annual meeting of AESJ, Fukuoka, Japan, 29–30 March 2012; pp. 357–364. [Google Scholar]
- Jusoh, Z.M.; Ling, G.H. Factors influencing consumers’ attitude toward e-commerce purchases through online shopping. Int. J. Hum. Soc. Sci. 2012, 2, 223–230. [Google Scholar]
- Statistics Korea, Online Shopping Trend’s Survey. Available online: https://kostat.go.kr/portal/korea/kor_nw/1/12/3/index.board (accessed on 6 February 2020).
- Anckar, B.; Walden, P.; Jelassi, T. Creating customer value in online grocery shopping. Int. J. Retail. Distrib. Manag. 2002, 30, 211–220. [Google Scholar] [CrossRef] [Green Version]
- Chu, W.; Choi, B.; Song, M.R. The role of on-line retailer brand and infomediary reputation in increasing consumer purchase intention. Int. J. Electron. Commun. 2005, 9, 115–127. [Google Scholar] [CrossRef]
- Hagel, J., III; Singer, M. Net Worth; Harvard Business School Press: Boston, MA, USA, 1997; pp. 19–20. [Google Scholar]
- Verdouw, C.N.; Vucic, N.; Sundmaeker, H.; Beulens, A.J.M. Future internet as a driver for virtualization, connectivity and intelligence of agri-food supply chain networks. J. Food Syst. Dyn. 2013, 4, 261–272. [Google Scholar]
- Morganosky, M.A.; Cude, B.J. Consumer response to online grocery shopping. Int. J. Retail. Distrib. Manag. 2000, 28, 17–26. [Google Scholar] [CrossRef]
- Hansen, T. Consumer value, the theory of planned behavior and online grocery shopping. Int. J. Consum. Stud. 2008, 32, 128–137. [Google Scholar] [CrossRef]
- Scuderi, A.; Bellia, C.; Foti, V.T.; Sturiale, L.; Timpanaro, G. Evaluation of consumers’ purchasing process for organic food products. AIMS Agric. Food 2019, 4, 251–265. [Google Scholar] [CrossRef]
- Kim, J.H.; Moritaka, M.; Fukuda, S.; Yoon, S.J. A structure analysis of consumer purchasing perceptions in the internet shopping: In case of the fresh food in South Korea. J. Food Syst. Res. 2013, 19, 382–393. [Google Scholar] [CrossRef] [Green Version]
- Fritz, M.; Hausen, T.; Schiefer, G. Development and development directions of electronic trade platforms in US and European agri-food market: Impact on sector organization. Int. Food Agribus. Manag. Rev. 2004, 7, 1–21. [Google Scholar]
- Lehmann, R.J.; Reiche, R.; Schiefer, G. Future internet and the agri-food sector: State of the art in literature research. Comput. Electron. Agric. 2012, 89, 158–174. [Google Scholar] [CrossRef]
- Boyer, K.K.; Hult, G.T.M. Extending the supply chain: Integration operations and marketing in the online grocery industry. J. Oper. Manag. 2005, 23, 642–661. [Google Scholar] [CrossRef]
- Benn, Y.; Webb, T.L.; Chang, B.P.I.; Reidy, J. What information do consumers consider, and how do they look for it, when shopping for groceries online? Appetite 2015, 89, 265–273. [Google Scholar] [CrossRef] [Green Version]
- Shukla, A.; Sharma, S.K. Evaluating consumers’ adoption of mobile technology for grocery shopping: An application of technology acceptance model. Vis. J. Bus. Perspect. 2018, 22, 185–198. [Google Scholar] [CrossRef]
- Elghannam, A.; Mesias, F.J.; Escribano, M.; Fouad, L.; Horrillo, A.; Escribano, A.J. Consumers’ Perspectives on Alternative Short Food Supply Chains Based on Social Media: A Focus Group Study in Spain. Foods 2020, 9, 22. [Google Scholar] [CrossRef] [Green Version]
- IGD, Leading Global Online Grocery Markets to Create a $ 227BN Growth Opportunity by 2023. Available online: https://www.igd.com/articles/article-viewer/t/leading-global-online-grocery-markets-to-create-a-227bn-growth-opportunity-by-2023/i/20396 (accessed on 12 May 2020).
- Sims, C.A. Macroeconomics and reality. Econometrica 1980, 48, 1–48. [Google Scholar] [CrossRef] [Green Version]
- Pfaff, B. Analysis of Integrated and Cointegrated Time Series with R, 2nd ed.; Springer: New York, NY, USA, 2008; pp. 34–36. [Google Scholar]
- Usman, M.; Fatin, D.F.; Barusman, M.Y.S.; Elfaki, F.A.M. Application of vector error correction model (VECM) and impulse response function for analysis data index of farmers’ term of trade. Indian J. Sci. Technol. 2017, 10, 1–14. [Google Scholar] [CrossRef]
- Hill, R.C.; Griffiths, W.E.; Lim, G.C. Principles of Econometrics, 4th ed.; Willey: Hoboken, NJ, USA, 2011; pp. 474–497. [Google Scholar]
- Lee, J.W. Econometrics, 1st ed.; Pakyoungsa: Seoul, Korea, 2009; pp. 859–888. [Google Scholar]
- Statistics Korea, The Statistical Information Report of Online Shopping Trend’s Survey. Available online: http://meta.narastat.kr/ (accessed on 12 May 2020).
- Engle, R.F.; Granger, C.W.J. Co-integration and error correction: Representation, Estimation and Testing. Econometrica 1987, 55, 251–276. [Google Scholar] [CrossRef]
- Johansen, S. Statistical analysis of cointegration vectors. J. Econ. Dyn. Control 1988, 12, 231–254. [Google Scholar] [CrossRef]
- Park, B.J. Applied Econometrics Using R Statistical Software, 1st ed.; Sigmapress: Seoul, Korea, 2013; pp. 265–271. [Google Scholar]
- Nam, J.O.; Baek, E.Y.; Noh, S.G. Forecast for laver producer price using time series models. Ocean Policy Res. 2014, 29, 271–303. [Google Scholar]
- Hussain, K. Monetary Policy Channels of Pakistan and Their Impact on Real GDP and Inflation. In CID Graduate Student and Postdoctoral Fellow Working Papers 41; Center for International Development at Harvard University: Cambridge, MA, USA, 2009; pp. 1–33. [Google Scholar]
- Kim, C.H.; Nam, J.O. A causality analysis of the hairtail price by distribution channel using a vector autoregressive model. J. Fish. Bus. Adm. 2015, 46, 93–107. [Google Scholar]
- Tsay, R.S. Order selection in nonstationary autoregressive models. Ann. Stat. 1984, 12, 1425–1433. [Google Scholar] [CrossRef]
- Paulsen, J. Order determination of multivariate autoregressive time series with unit roots. J. Time Ser. Anal. 1984, 5, 115–127. [Google Scholar] [CrossRef]
- StataCorp LLC. STATA Time-Series Reference Manual Release 16; A Stata Press Publication: Lakeway Drive, TX, USA, 2019; pp. 826–832. [Google Scholar]
- Kim, M.K.; Koo, K.M. The impact of FMD on the relationship among pork prices. Korean J. Agric. Manag. Policy 2013, 40, 592–614. [Google Scholar]
- Lee, Y.E.; Benbasat, I. Interface design for mobile commerce. Commun. ACM 2003, 46, 49–52. [Google Scholar] [CrossRef]
- Lee, E.Y. The study of impact of mobile app attributes for fresh food on customers’ trust, satisfaction and net benefit. E-Bus. Stud. 2016, 17, 175–192. [Google Scholar] [CrossRef]
- Kim, H.J.; Yang, K.S.; Lee, Y.E. Moderating effect of trust and commitment in customer satisfaction and customer loyalty on mobile grocery purchasing quality attributes. J. Korean Soc. Food Sci. Nutr. 2018, 47, 207–221. [Google Scholar] [CrossRef]
- Cheong, J.H.; Park, M.C. Mobile internet acceptance in Korea. Internet Res. 2005, 15, 125–140. [Google Scholar] [CrossRef]
- Quan, S. Factors influencing the adoption of mobile service in China: An integration of TAM. J. Comput. 2010, 5, 799–806. [Google Scholar]
- Azapagic, A.; Perdan, S. Indicators of sustainable development for industry: A general framework. Trans. IChemE 2000, 78, 243–261. [Google Scholar] [CrossRef]
- Krajnc, D.; Glavič, P. Indicators of sustainable production. Clean Technol. Environ. Policy 2003, 5, 279–288. [Google Scholar] [CrossRef]
- McKenzie, S. Social Sustainability: Towards Some Definitions; Working Paper Series; Hawke Research Institute: Magil, Australia, 2004; p. 12. [Google Scholar]
- Malecki, E.J.; Moriset, B. The Digital Economy: Business Organization, Production Processes, and Regional Developments; Routledge: New York, NY, USA, 2004; p. 4. [Google Scholar]
- Statista, Number of Social Network Users Worldwide from 2010 to 2023. Available online: https://0-www-statista-com.brum.beds.ac.uk/statistics/278414/number-of-worldwide-social-network-users/ (accessed on 14 May 2020).
- Noh, M.S.; Heo, H.N.; Choi, Y.J.; Lee, H.S. 2018 Internet Use Status Report; Ministry of Science and ICT, Korea Information Security Agency: Naju, Korea, 2019; p. 66. [Google Scholar]
- Lee, S.M.; Lee, D.H. “Untact”: A new customer service strategy in the digital age. Serv. Bus. 2020, 14, 1–22. [Google Scholar] [CrossRef]
Figure 1.
Food transactions in online shopping as of 2019. Source: Statistics Korea [12].
Figure 1.
Food transactions in online shopping as of 2019. Source: Statistics Korea [12].

Figure 2.
Trend by time series data. Note: “M” and “P” refer to the mobile and PC-based online transaction amounts, respectively.
Figure 2.
Trend by time series data. Note: “M” and “P” refer to the mobile and PC-based online transaction amounts, respectively.


Table 1.
Variable definition.
| Variable Name | Variable Definition |
|---|---|
| M.fresh | Mobile online shopping transaction amount of fresh food |
| M.processed | Mobile online shopping transaction amount of processed food |
| M.service | Mobile online shopping transaction amount of food service |
| P.fresh | PC-based online shopping transaction amount of fresh food |
| P.processed | PC-based online shopping transaction amount of processed food |
| P.service | PC-based online shopping transaction amount of food service |
Table 2.
Basic statistics of the data.
| Variables | n | Mean | St. Dev. | Min | Max |
|---|---|---|---|---|---|
| M.fresh | 72 | 99.56 | 60.65 | 13.49 | 241.88 |
| M.processed | 72 | 344.88 | 232.00 | 46.82 | 790.62 |
| M.service | 72 | 238.71 | 250.64 | 17.88 | 932.28 |
| P.fresh | 72 | 67.74 | 20.14 | 42.57 | 127.87 |
| P.processed | 72 | 214.10 | 75.80 | 117.10 | 370.07 |
| P.service | 72 | 31.39 | 10.93 | 12.77 | 59.76 |
Note: “M” and “P” refer to the mobile and PC-based online transaction amounts, respectively.
Table 3.
Unit root test (augmented Dickey–Fuller (ADF)).
| Variables | Test Statistic | p-Value |
|---|---|---|
| M.fresh | 0.515 | 0.9853 |
| M.processed | 2.268 | 0.9989 |
| M.service | 7.608 | 1.000 |
| P.fresh | −1.908 | 0.3285 |
| P.processed | 0.421 | 0.9823 |
| P.service | 1.135 | 0.9955 |
Note: “M” and “P” refer to the mobile and PC-based online transaction amounts, respectively.
Table 4.
Lag selection.
| Lags | LL | LR | p-Value | AIC | HQIC | SBIC |
|---|---|---|---|---|---|---|
| 0 | −1835.72 | 53.3833 | 53.4604 | 53.5776 | ||
| 1 | −1566.77 | 537.91 | 0.000 | 46.631 | 47.1705 | 47.9909 * |
| 2 | −1497.9 | 137.75 | 0.000 | 45.6782 | 46.6801 | 48.2037 |
| 3 | −1442.87 | 100.05 * | 0.000 | 45.1267 * | 46.5911 * | 48.8178 |
Note: LL is the log-likelihood value. (*) indicates appropriate lags by information criteria.
Table 5.
Johansen’s cointegration test.
| Rank | LL | Eigenvalue | Trace | Max Eigenvalue | ||
|---|---|---|---|---|---|---|
| Statistic | 5% Critical | Statistic | 5% Critical | |||
| 0 | −1538.8628 | 191.9864 | 94.15 | 79.8864 | 39.37 | |
| 1 | −1498.9196 | 0.6858 | 112.1000 | 68.52 | 59.7676 | 33.46 |
| 2 | −1469.0358 | 0.5795 | 52.3324 | 47.21 | 23.5735 | 27.07 |
| 3 | −1457.2491 | 0.2894 | 28.7589 * | 29.68 | 18.8890 * | 20.97 |
| 4 | −1447.8046 | 0.2395 | 9.8699 | 15.41 | 9.7279 | 14.07 |
| 5 | −1442.9407 | 0.1315 | 0.1421 | 3.76 | 0.1421 | 3.76 |
Note: (*) indicates that the trace and the maximum eigenvalue statistic are smaller than the 5% critical value.
Table 6.
The results of the vector error correction (VEC) model.
| Variables | M.Fresh | M.Processed | M.Service | P.Fresh | P.Processed | P.Service |
|---|---|---|---|---|---|---|
| −0.364 | −0.161 | −0.354 | −0.287 | 0.262 | 0.034 | |
| 0.091 | 0.420 *** | 0.461 *** | 0.262 *** | 0.323 *** | 0.026 | |
| −0.047 * | −0.193 *** | −0.070 *** | −0.114 *** | −0.162 *** | −0.006 | |
| constant | 1.123 | 4.674 | 0.097 | −5.822* | −1.814 | 0.020 |
| 0.083 | 1.001 *** | 1.110 *** | 0.406 | 0.164 | 0.092 | |
| 0.130 | 0.589 | 1.228 *** | 0.251 | −0.048 | 0.184 ** | |
| −0.259 ** | −1.266 *** | −0.709 *** | −0.113 | −0.452 ** | −0.104 *** | |
| 0.052 | −0.131 * | −0.455 *** | 0.074 | 0.048 | −0.108 ** | |
| 0.432 *** | 0.644 | −0.795 *** | 0.317 ** | 0.294 | −0.004 | |
| 0.274 * | 0.508 ** | −0.405 *** | 0.131 | 0.279 | 0.000 | |
| 0.007 | 0.185 ** | 0.443 * | −0.102 | 0.210 | 0.013 | |
| 0.280 | 0.770 | −0.010 | 0.181 | 0.375 | −0.006 | |
| 0.157 | 1.123 | 0.252 | 0.254 | 0.436 | 0.082 | |
| −0.301 | −0.331 | −0.221 | −0.160 | −0.230 | 0.017 | |
| 0.771 | 1.292 | −0.295 | −0.027 | 0.192 | −0.721 *** | |
| 0.424 | 0.435 | 1.288 ** | 0.284 | 0.315 | −0.175 | |
| RMSE | 13.256 | 26.825 | 13.58 | 15.143 | 22.007 | 4.007 |
| R-squared | 0.711 | 0.754 | 0.82 | 0.686 | 0.63 | 0.387 |
| Chi-square | 128.173 *** | 159.533 *** | 236.198 *** | 113.562 *** | 88.51 *** | 32.855 *** |
| Information criterion | AIC = 45.283, HQIC = 46.631, SBIC = 48.682 | |||||
| Long-run relationship | ||||||
Note: △ in front of a variable’s name indicates difference. “M” and “P” refer to the mobile and PC-based online transaction amounts, respectively. *** p < 0.01, ** p < 0.05, * p < 0.1.
Table 7.
Granger causality test.
| Hypothesis | Lags | F-Value | p-Value |
|---|---|---|---|
| △M.processed → M.fresh | 3 | 6.37 | 0.00 *** |
| △M.service → M.fresh | 11.92 | 0.00 *** | |
| △M.fresh → M.processed | 3 | 6.04 | 0.00 *** |
| △M.processed → M.processed | 8.04 | 0.00 *** | |
| △M.service → M.processed | 9.80 | 0.00 *** | |
| △P.fresh → M.processed | 7.24 | 0.00 *** | |
| △M.fresh → M.service | 3 | 3.63 | 0.02 ** |
| △M.processed → M.service | 7.90 | 0.00 *** | |
| △M.service → M.service | 2.26 | 0.09 * | |
| △P.fresh → M.service | 3.50 | 0.02 ** | |
| △P.service → M.service | 2.53 | 0.07 * | |
| △M.service → P.fresh | 3 | 13.83 | 0.00 *** |
| △M.processed → P.processed | 3 | 4.60 | 0.01 ** |
| △M.fresh → P.service | 3 | 0.29 | 0.84 |
| △M.processed → P.service | 1.37 | 0.26 | |
| △P.service → P.service | 0.96 | 0.42 |
Note: △ in front of a variable’s name indicates difference. “M” and “P” refer to the mobile and PC-based online transaction amounts, respectively. *** p < 0.01, ** p < 0.05, * p < 0.1.
© 2020 by the author. Licensee MDPI, Basel, Switzerland. This article is an open access article distributed under the terms and conditions of the Creative Commons Attribution (CC BY) license (http://creativecommons.org/licenses/by/4.0/).
Share and Cite
MDPI and ACS Style
Kim, J. Analysis for Growth Potential in Response to Changes in the Online Food Market. Sustainability 2020, 12, 4386. https://0-doi-org.brum.beds.ac.uk/10.3390/su12114386
AMA Style
Kim J. Analysis for Growth Potential in Response to Changes in the Online Food Market. Sustainability. 2020; 12(11):4386. https://0-doi-org.brum.beds.ac.uk/10.3390/su12114386
Chicago/Turabian StyleKim, Jonghwa. 2020. "Analysis for Growth Potential in Response to Changes in the Online Food Market" Sustainability 12, no. 11: 4386. https://0-doi-org.brum.beds.ac.uk/10.3390/su12114386
Note that from the first issue of 2016, this journal uses article numbers instead of page numbers. See further details here.