Exploring the Dynamics between M&A Activities and Industry-Level Performance


School of Business, Sejong University, Seoul 05006, Korea
*
Author to whom correspondence should be addressed.
Sustainability 2020, 12(11), 4399; https://0-doi-org.brum.beds.ac.uk/10.3390/su12114399
Submission received: 24 April 2020
/
Revised: 22 May 2020
/
Accepted: 24 May 2020
/
Published: 27 May 2020
(This article belongs to the Special Issue Business Analytics and Data Mining for Business Sustainability)
Abstract
:This study investigates the correlation between mergers and acquisitions (M&As) activities and industry-level performance. While extensive research on M&As has focused on financial performance at the firm-level around the merger announcement, not much focus has been given to the relationship between M&A activities and financial performance at the industry level. Using global data from the S&P (Standard & Poor’s) Capital IQ platform database, this study examines the significance of relationships of 12 industry-level financial values with M&A frequency and transaction value across 11 industry sectors throughout 2009–2018. The results show that M&A activities play a key role in identifying industries with lots of potential and that strategic investment planning can be drawn from both industry and time lag perspectives. This study bridges the gap by exploring the complexity of M&A performance across various firms and industries, and supports forward-looking investment processes by delineating emerging industries with expected positive returns.
1. Introduction
Mergers and acquisitions (M&A) transactions have become an integral part of today’s business environment. The term M&A refers to the consolidation of firms or assets through various types of financial transactions, including mergers, acquisitions, consolidations, tender offers, purchase of assets, and management acquisitions [1]. M&A is generally considered to denote efforts to provide synergistic benefits for the acquirer, and to unify technology and market-related aspects [2,3]. Nowadays, M&As are considered a strategic alternative to enhance market share and extend product portfolios [4,5,6,7].
Over the last few decades, M&As have received extensive research attention from several disciplines including economics, finance, accounting, marketing, and management of technology. Each discipline considers M&A deals through its own lens, with one stream of the literature concerned with the causes and characteristics of M&A deals, and another concerned with the gains and losses resulting from M&A deals [8]. In particular, due to the various effects that M&A has on value creation in the business landscape, many studies have been conducted on the correlation between M&A transactions and performance [8,9,10,11].
Previous studies on the relationship between M&A and acquirers’ performance have suggested inconsistent findings regarding positive or negative impacts. While some authors report a significant positive influence of M&A transactions [12,13], others suggest little or even negative performance of M&As [8,14,15,16,17] or mixed results [9,11,18]. Meglio and Risberg [19] investigated the variety of meanings that M&A scholars defined on M&A performance and concluded that inconsistent findings relative to M&A performance research are subject to common practices of existing studies in that they compare different measures as if they measured the same feature of the organization. On the other hand, Gates and Very [20] proposed a practical framework for identifying critical measures of M&A performance.
While much research has focused on firm or deal-specific characteristics that can influence acquirers’ performance at the firm-level, very little attention has been given to explaining the M&A-performance relationship at the industry level. Many experts argue that it is necessary to activate M&A not only for the growth of firms but also for industrial or economic growth [21,22,23]. However, the relatively scarce research at the industry level leads to inconclusive results, with a weak or almost absent correlation between M&A and industry-level performance. In sum, the effect of M&A transactions on financial performance has been an ongoing investigation in a number of disciplines, including accounting and finance. Under these conditions, the following hypothesis is proposed: There is a positive relationship between M&A transactions and industry-level financial performance.
Thus, this research aims to identify the relationship that M&A activities have with industry-level financial performance. Specifically, this study examines the frequency and value of 11 industry sectors’ M&A activities throughout 2009–2018 to explore the market reaction at the industry level from various financial perspectives. In this manner, this study identifies the correlation between M&A transactions and industry-level performance for offering a comprehensive view of the effects of M&A activities at the industry level and furthermore suggests the strategic investment planning considering the time lag perspectives by visualizing changes in the financial relationship level by time lag differences.
The rest of this paper is organized as follows. The next section summarizes the results of key empirical studies on the relationship between M&A transactions and performance at the firm level. Section 3 presents the data, methodology, and empirical results. Section 4 discusses this research, including theoretical and managerial implications. Concluding remarks are presented in Section 5 and further research issues are suggested.
2. Literature Review
2.1. Sustaining Competitive Advantage through Market Convergence
To sustain competitive advantage, firms require not only an understanding of industry changes such as frequency (rate), variability (turbulence), and size of changes (magnitude) [24], but also a strategic investment decision that can foster positive growth. Investment decision makers are expected to formulate long-term goals, explore all possible alternatives, weigh future consequences, and make a decision that can remain resilient to environmental changes [25]. However, the current dominant perspective of investment through M&A is more prescriptive than descriptive, being more concerned with whether M&A delivers a positive (negative) outcome rather than in which context it creates such value. The forward-looking investment process should therefore include both the shareholder and management perspectives in increasing the awareness of the market trend in an early stage and an insight on alternative solutions.
From the shareholder perspective, M&A is expected to create a synergistic value through which a merged entity can benefit from increased cost efficiency and operational effectiveness rather than running as two separate entities [26]. However, the literature suggests that the short-term performance of such M&A activities is rather insignificant, and long-term performance is negative [8,15,16,17]. Despite the concept of value creation, the 2 + 2 = 5 effect, existing studies have found that merging firms do not actually generate sufficient or satisfactory returns for shareholders across various disciplines such as accounting, finance, and economics [1,8,27]. Recently, Zhang et al. [11] noted that such puzzling findings may be contingent on different variables including the agency problem, corporate governance structure, and development status of capital markets. This is well aligned with previous notions that the size and complexity of M&A increases with the size of the acquisition and target firm, method of payment, and even mode of acquisition [28,29,30].
From a management perspective, when M&A transactions occur between two different industries, an effective industry convergence can benefit participating firms. Knowledge of emerging industries and technologies offer valuable insights, especially in the era of Industry 4.0 in which the market environment is determined by the smart technologies [31]. Industry convergence, defined as the process of blurring boundaries between two or more disparate industries, can effectively share common values, such as technology, value chains, and markets [32]. Specifically, the outcomes of industry convergence can lead to the creation of new consumer markets, value chains, and even product and technology capabilities in other industries [32,33,34].
In summary, while there is a general consensus that M&A performance does not depict a positive value from an economic and accounting perspective, other disciplinary managements maintain a positive outlook on the potential synergistic outcome of industry convergence. This study aims to bridge the gap by exploring the complexity of M&A performance across various firms and industries, and to support forward-looking investment processes by delineating emerging industries with expected positive returns.
2.2. M&A Transactions, Financial Performance, and Business Strategy
M&A activities offer various insights into trends on innovation, technology sourcing strategies, initial public offerings (IPOs), and market convergence [2,6,35]. M&A transactions, which depict two firms’ strategic efforts in generating synergistic benefits through technology and market unification [2,36], are presented in financial terms that can be evaluated by the shareholders and the financial market. M&A transaction data, provided by the global financial community, is widely regarded as reliable due to its accurate representation of complex deal processes and its standardized approach to measuring and aggregating M&A activities at the industry level [11,37].
M&A activities information extends the depth of analysis by enabling industry-specific and transaction size dependent analysis. Based on the 230 takeover announcements in the US automotive industry between 1981–2007, Laabs and Schiereck [9] investigated the impact of M&A transaction volume and acquirer’s bidding experience on long-term post-acquisition performance. Specifically, M&A transaction size, which is determined by the total deal volume in US dollars, has been utilized as an indicator of a productive efficiency level. The study concluded that small deals lead to positive long-term averages, medium-sized deals provide relatively mediocre performance, and large deals even yield negative returns. Moreover, M&A activities information allows cross-border comparison. Based on M&A samples from 2005–2011 in the manufacturing industry and services, Mariani et al. [18] compared the effect of the M&A strategy of 98 Italian and 86 UK bidding firms’ performance. Based on the number of acquisitions, the authors investigated its effect on the bidding firm’s accounting performance (i.e., return on investment) and the ratio between the market value and replacement value of the same physical assets (i.e., Tobin’s Q). The study found that UK firms’ acquisition activity did not generally lead to positive effects on accounting and market performance whilst that of Italian firms produced a neutral effect on accounting and market performance.
Firms can also improve traditional performance measures and refine business strategy by utilizing M&A activities information. Based on 45 M&A deals in US industries from 1990–2010, Rahman and Lambkin (2015) investigated the role M&A transactions play in creating or destroying the acquiring firm’s value. The authors developed post-merger performance from a marketing perspective to gain a deeper understanding of how M&A can influence marketing effectiveness, efficiency, and performance. In addition to performance measure improvement, insights on firms’ strategic values can been determined through the M&A information. Based on Chinese pharmaceutical firms’ M&A activities in 2008–2016, Zhang et al. [11] investigated the impact of M&A participating firms’ performance. By delineating M&A strategic goals into three dimensions (i.e., value-chain extension, technology-seeking, mixed), the authors found that value-chain extension and technology-seeking M&A are positively related to firm performance while mixed-M&A and firm performance are not.
Overall, the effect of M&A transactions on participating firms’ market value has been an ongoing investigation in the accounting and finance fields. Schoenberg [38] noted that the measurement of M&A performance is a complex process, and that it requires a careful selection for holistic view of outcome. Furthermore, although much research has focused on firm or deal-specific characteristics that can influence acquirers’ performance at the firm-level, limited attention has been given to explaining the M&A-performance relationship at the industry-level. Relatively lacking research at the industry-level provides no explanation for the correlation between M&A and industry-level performance. To this end, the current study investigates the role of M&A activities in the industry-level performance to gain a holistic view of the outcome of such on industry-level outcomes.
3. Empirical Analysis
3.1. Data and Summary Statistics
Using data from the S&P (Standard & Poor’s) Capital IQ platform database on the number and transaction value of M&As by 11 stock market industries, the investigated sample is based on global M&As over the period from 2009 to 2018. This study collected 12 financial figures from financial statements and markets including market capitalization (MC), earnings before interest and tax (EBIT), earnings before interest tax depreciation and amortization (EBITDA), total enterprise value (TEV), current ratio (CR), debt ratio (DR), debt to equity ratio (DER), asset turnover ratio (ATR), return on asset (ROA), return on equity (ROE), earnings per share (EPS), and price earnings ratio (PER) for each industry. As the S&P database does not provide complete financial figures for all firms in each industry except for the number of M&As, the available M&A transaction values and 12 financial figures were converted to industry-level values and removed the outlier effect from the analysis. The industry-level M&A transaction values were estimated by calculating the average of the middle 50 percent of the M&A transaction values when ordered from lowest to highest and multiplying it by the number of M&As. Similarly, industry-level values of MC, EBIT, EBITDA, and TEV were obtained by multiplying by average of the middle 50 percent of those ordered values and the total number of firms in each industry. For the remaining eight financial ratios, averages in the middle 50 percent of those ordered ratios were used. Table 1, Table 2 and Table 3 show the sample distribution of the number and transaction value of M&As by industry ζi (i = 1: Communication; 2: Consumer Discretionary; 3: Consumer Staples; 4: Energy; 5: Financial; 6: Healthcare; 7: Industrial; 8: Information Technology; 9: Materials; 10: Real Estate; 11: Utilities).
The total number of firms included in each industry over the period is reported in Table 1. The largest number of firms is in the industrial sector (834,386 firms) while the smallest number is associated with the utilities industry (46,761). The sample distribution of the number of M&As by industry and year is reported in Table 2. Overall, the average number of M&As across 11 industries ranges from 1159 to 9535 per year. This study finds that the proportion of firms involved in M&As differs across industries. Approximately 4.12% of real estate firms are involved in M&As while this figure is 0.43% for financial firms. The sample distribution of the transaction values of M&As by industry and year is reported in Table 3. The average transaction values across 11 industries range from USD 30,176 million to USD 224,350 million per year. The energy industry shows the highest ratio of M&A transaction value to market capitalization (0.61%) whereas the lowest proportion (0.09%) is in the financial industry. The relationship between M&A activities and industry-level financial performance might differ by industry due to the varying range of M&A frequency and transaction value.
3.2. Methodology
This study included a one-sided t-test to examine the significance of the relationship between M&A-related values and 12 financial-related values by industry. The links between M&A activities and various financial aspects of the industry were examined to identify how the effects of M&A differ by industry. Particularly, the employed M&A values included the number of M&As by industry traded worldwide in the last 10 years (2009~2018) and transaction values of the M&As. For financial values for each industry, EBIT and EBITDA from income statements, MC and TEV from market data, and the five major categories of financial ratios including liquidity (CR), debt (DR and DER), activity (ATR), profitability (ROA and ROE), and market ratios (EPS and PER) were utilized. Since the correlations between M&A values and 11 industry-level financial values showed positive signs, the following null hypothesis were investigated to test the significance of the relationships:
This study repeated the test using M&A values with lag 0, lag 1, lag 2, and lag 3 financial values to investigate if the effects of the M&A occur with a time difference. This additional analysis addresses the unresolved time-lag issue between the existing patent-based analysis results and the actual convergence [32]. Patents or bibliometric data require a significant amount of time prior to being commercialized or published. Thus, the timely nature of M&A data is a distinct feature that can benefit a time-sensitive strategic investment decision.
Table A1, Table A2, Table A3, Table A4, Table A5, Table A6, Table A7, Table A8, Table A9, Table A10 and Table A11 in Appendix A show the test results with correlations, t-statistics, and p-values by industry. For each industry, Panel A reports the test results with the number of M&As and 12 financial values while Panel B reports test results with the transaction value of M&As and 12 financial values.
3.3. Empirical Results
3.3.1. Significance of M&A Activities Regarding Financial Values by Industries
Table A1 shows that the M&A transaction value of the communication services industry is significantly related to most financial values, regardless of time lag. On the other hand, the number of M&As is not found to have significant relationship with all financial values in the year when M&As occur, but it is significantly related to most financial values with a time lag 2. Test results for the consumer discretionary industry in Table A2 are similar to those for communication services. The transaction value of M&A is found to be more significantly related to financial values than the number of M&As, and both M&A variables show the most significance with lag 2 financial values, producing 10 significant relationships out of 12 values. Table A3 reveals that the number of M&As is found to be more significantly related to financial values than the M&A transaction value of the consumer staples industry. This industry shows no financial values significantly related to M&A transaction value in the year when M&As occur, whereas the number of M&As is found to be significantly related to lag 0, lag 1, and lag 2 values of EBIT, EBITDA, DER, and ATR.
In Table A4, test results for the energy industry show no significance regarding M&A transaction values, and only lag 0 values of EBIT, EBITDA, TEV, DR, and EPS are found to be significantly related to the number of M&As. Financial values of the financial industry are found to have significant relationships with the number of M&As as well as transaction value of M&A in Table A5. Most lag 0 financial values show significant results, and around half of lag 1, lag 2, and lag 3 values are found to be significant for both M&A variables. The healthcare industry is found to be the most significantly related to M&A variables. Table A6 shows that both M&A variables are significantly related to most lag 0, lag 1, and lag 2 financial variables, and around half of lag 3 variables are found to be significant for both M&A variables. For the industrial sector, the transaction value of M&As is found to be more significantly related to financial values than the number of M&As. Table A7 shows that most lag 0, lag 1, and lag 2 values are significantly related with transaction values of M&As whereas around half of them are significantly related with the number of M&As.
Test results in Table A8 show that the information technology industry is significantly related to both M&A variables. More than half of lag 0, lag 1, and lag 2 financial values are significantly related to both M&A variables. The materials industry is found to have the weakest relationships with M&A variables. Most financial values are not significantly related to both M&A variables in Table A9. Test results for the real estate industry in Table A10 show that the transaction value of M&A is more significantly related to financial values than the number of M&As. The transaction value of M&As shows the most significance when M&As occur, whereas the number of M&As is related to around half of the financial value with time lag. As with the consumer staples industry, test results for the utilities industry in Table A11 show that the number of M&As is more significantly related to financial values than the M&A transaction value. Most financial values are not related to M&A transaction values regardless of time lags, whereas the number of M&As is significantly related to around half of lag 0, lag 1, and lag 2 financial values.
3.3.2. Changes in the Significant Relationship between M&A and Financial Values with Time Lag
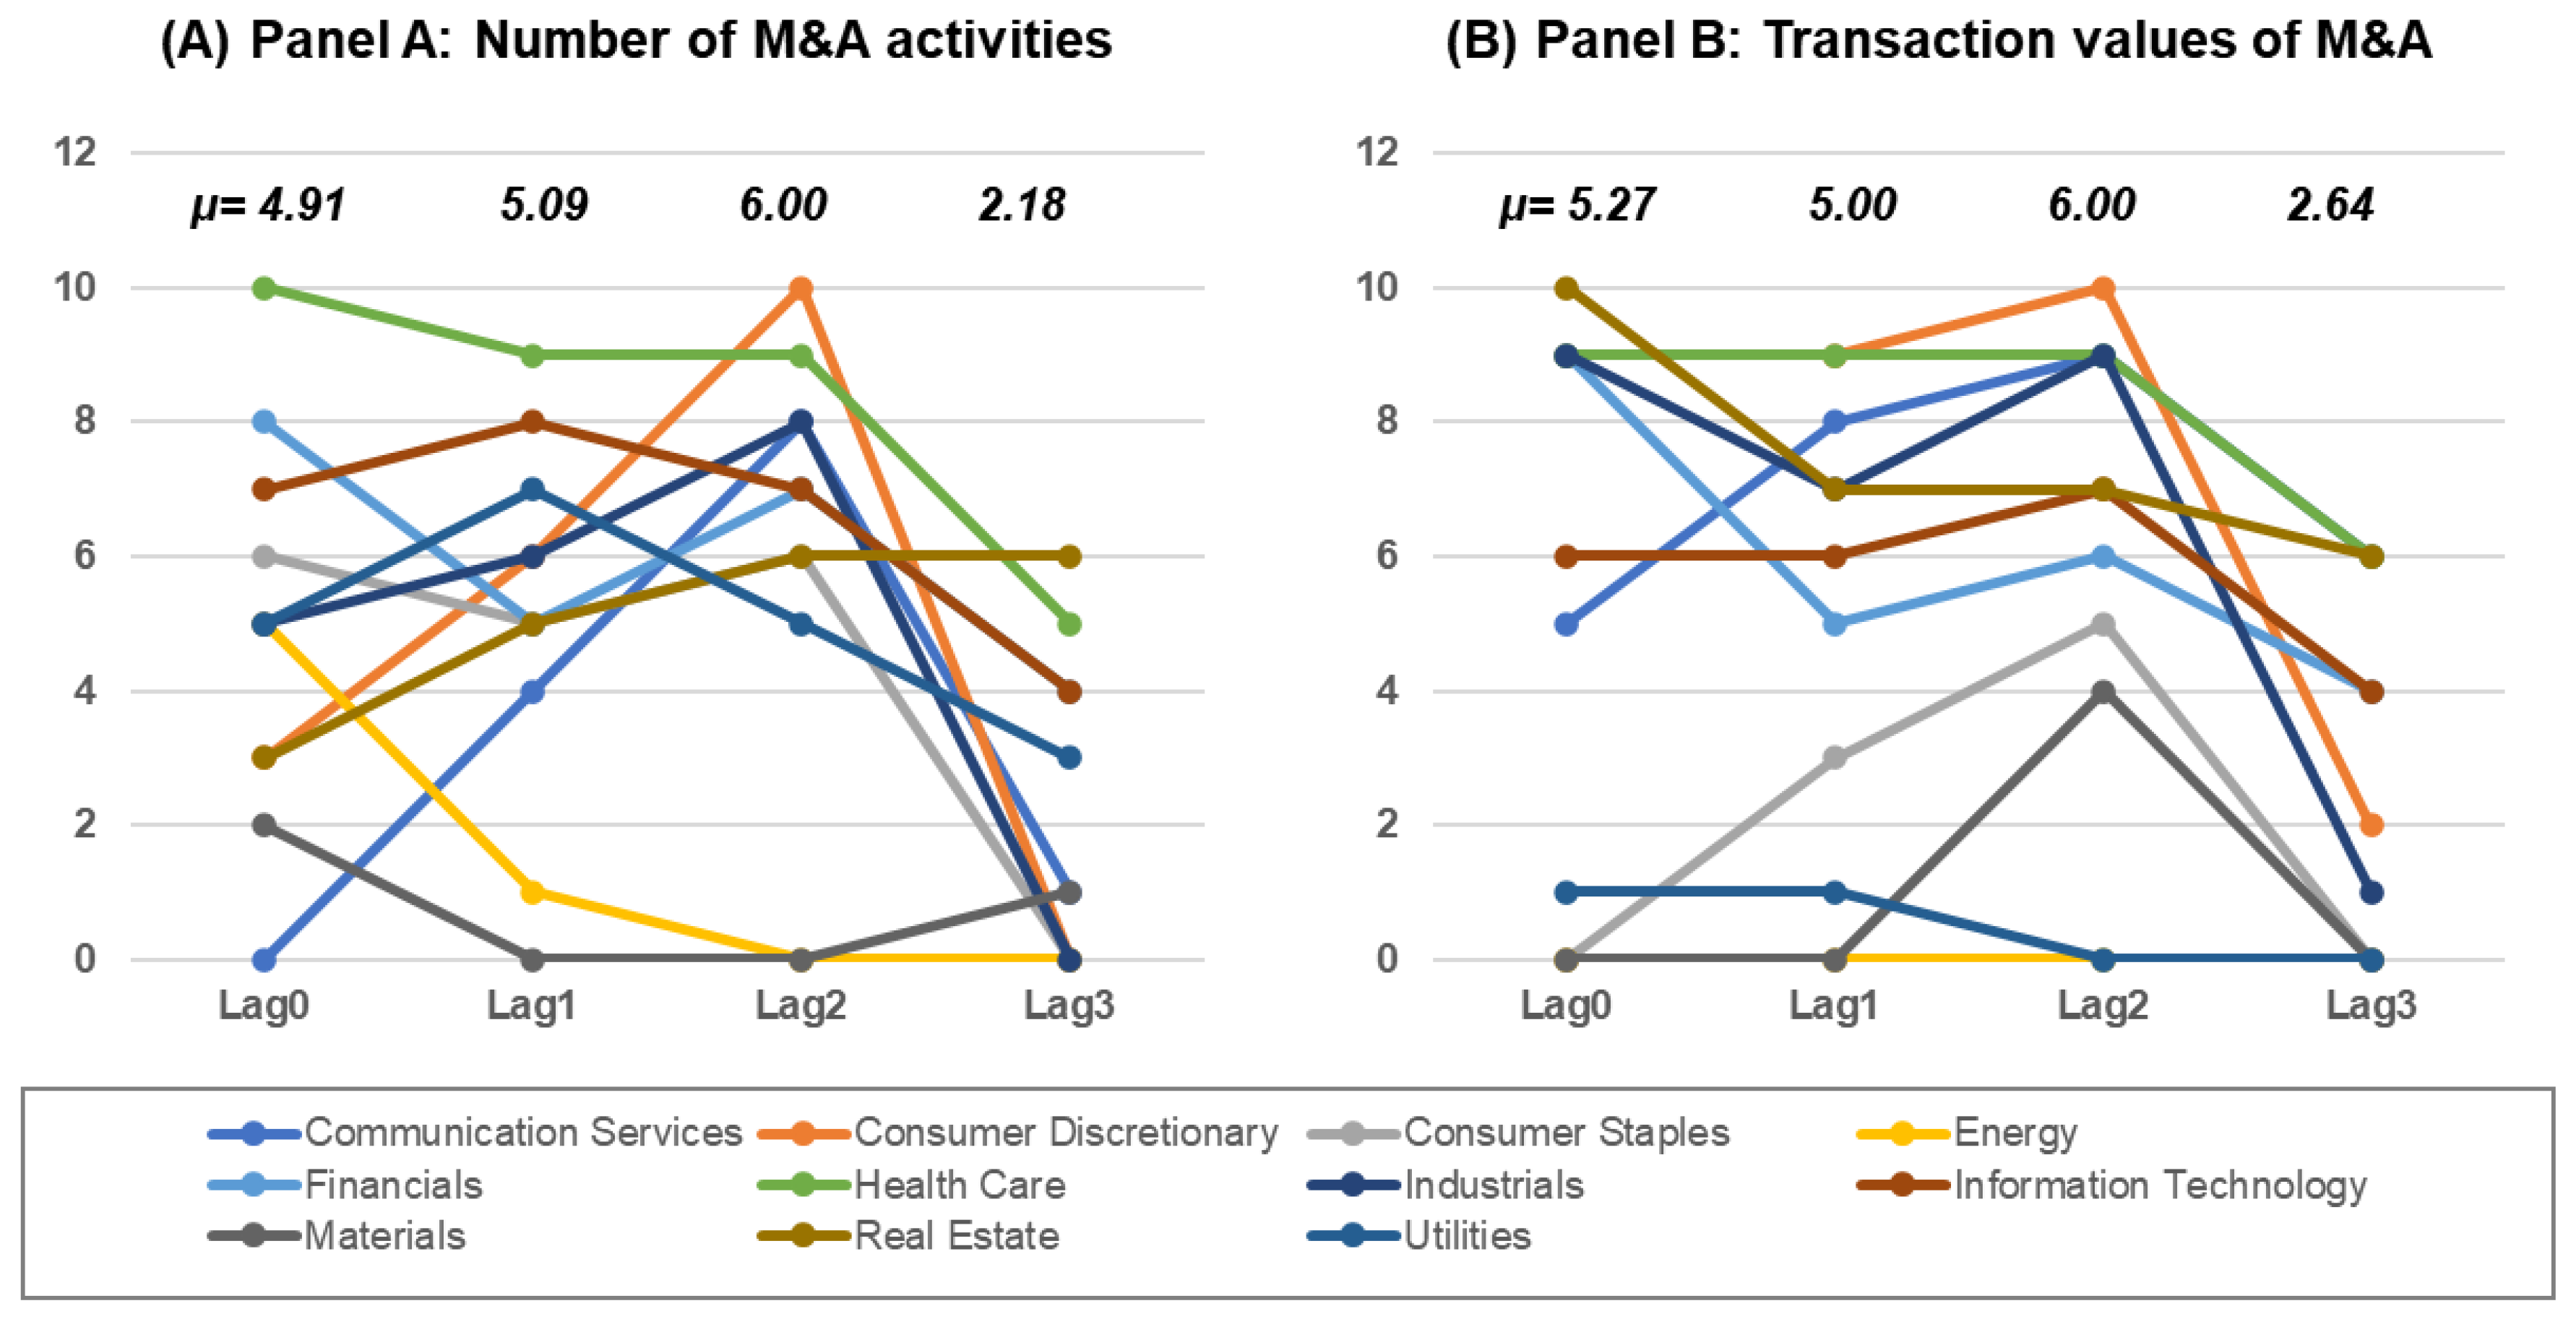
The significance of the relationship of M&A activities with financial values (financial relationship level) is shown in Table 4. The financial relationship level ranges from 0 to 11 with a total of 11 financial values that are under consideration in this study. The increase or decrease in the number of financial values with significant relationships for each time-lag period is also shown (+ = positive, − = negative, and ◌ = no change).
At lag 1, while the number of M&As (Panel A) shows a positive increase in terms of the financial relationship level as a result of analysis based on the average for 11 industries, the transaction value (Panel B) does not. Specifically, industrial, information technology, real estate, and utilities industries show an increase in the number of financial values with significant relationship in lag 1 compared to lag 0 for Panel A. For Panel B, most of the industries remain unchanged in the number of financial values with significant relationships (i.e., consumer discretionary, energy, healthcare, information technology, materials, utilities). Communication services industry shows an increase for both Panel A (0 to 4) and B (5 to 8), demonstrating a potential causal relationship between M&A activities and financial values.
At lag 2, both Panel A and B reach the highest financial relationship level of 10. Notably, the communication services industry has 10 financial values that are significantly correlated to both M&A transaction number and transaction values. At lag 3, both Panel A and B show the lowest financial relationship level, with the average significant numbers of financial values ranging between 2.18 and 2.64.
The results demonstrate that there is a statistically significant correlation between M&A activities and industry-level financial performance, and highlights the importance of ex-post assessment of M&A activities rather than an immediate financial return as part of performance measures because the effect of M&A activities can show significant financial performance after some time.
4. Discussion
Based on the correlation analyses between M&A transactions and industry-level performance of 11 industry sectors during the period from 2009 to 2018, this study highlights three theoretical and managerial implications: (i) benefit of the inclusion of M&A activities in the identification process of promising industries, (ii) strategic investment planning through the industry classification based on the number of M&As and transaction values, and (iii) understanding the time lag perspective of the relationship between M&A activities and financial values.
4.1. Managerial Benefit of M&A Activities Inclusion in Identifying a Promising Industry
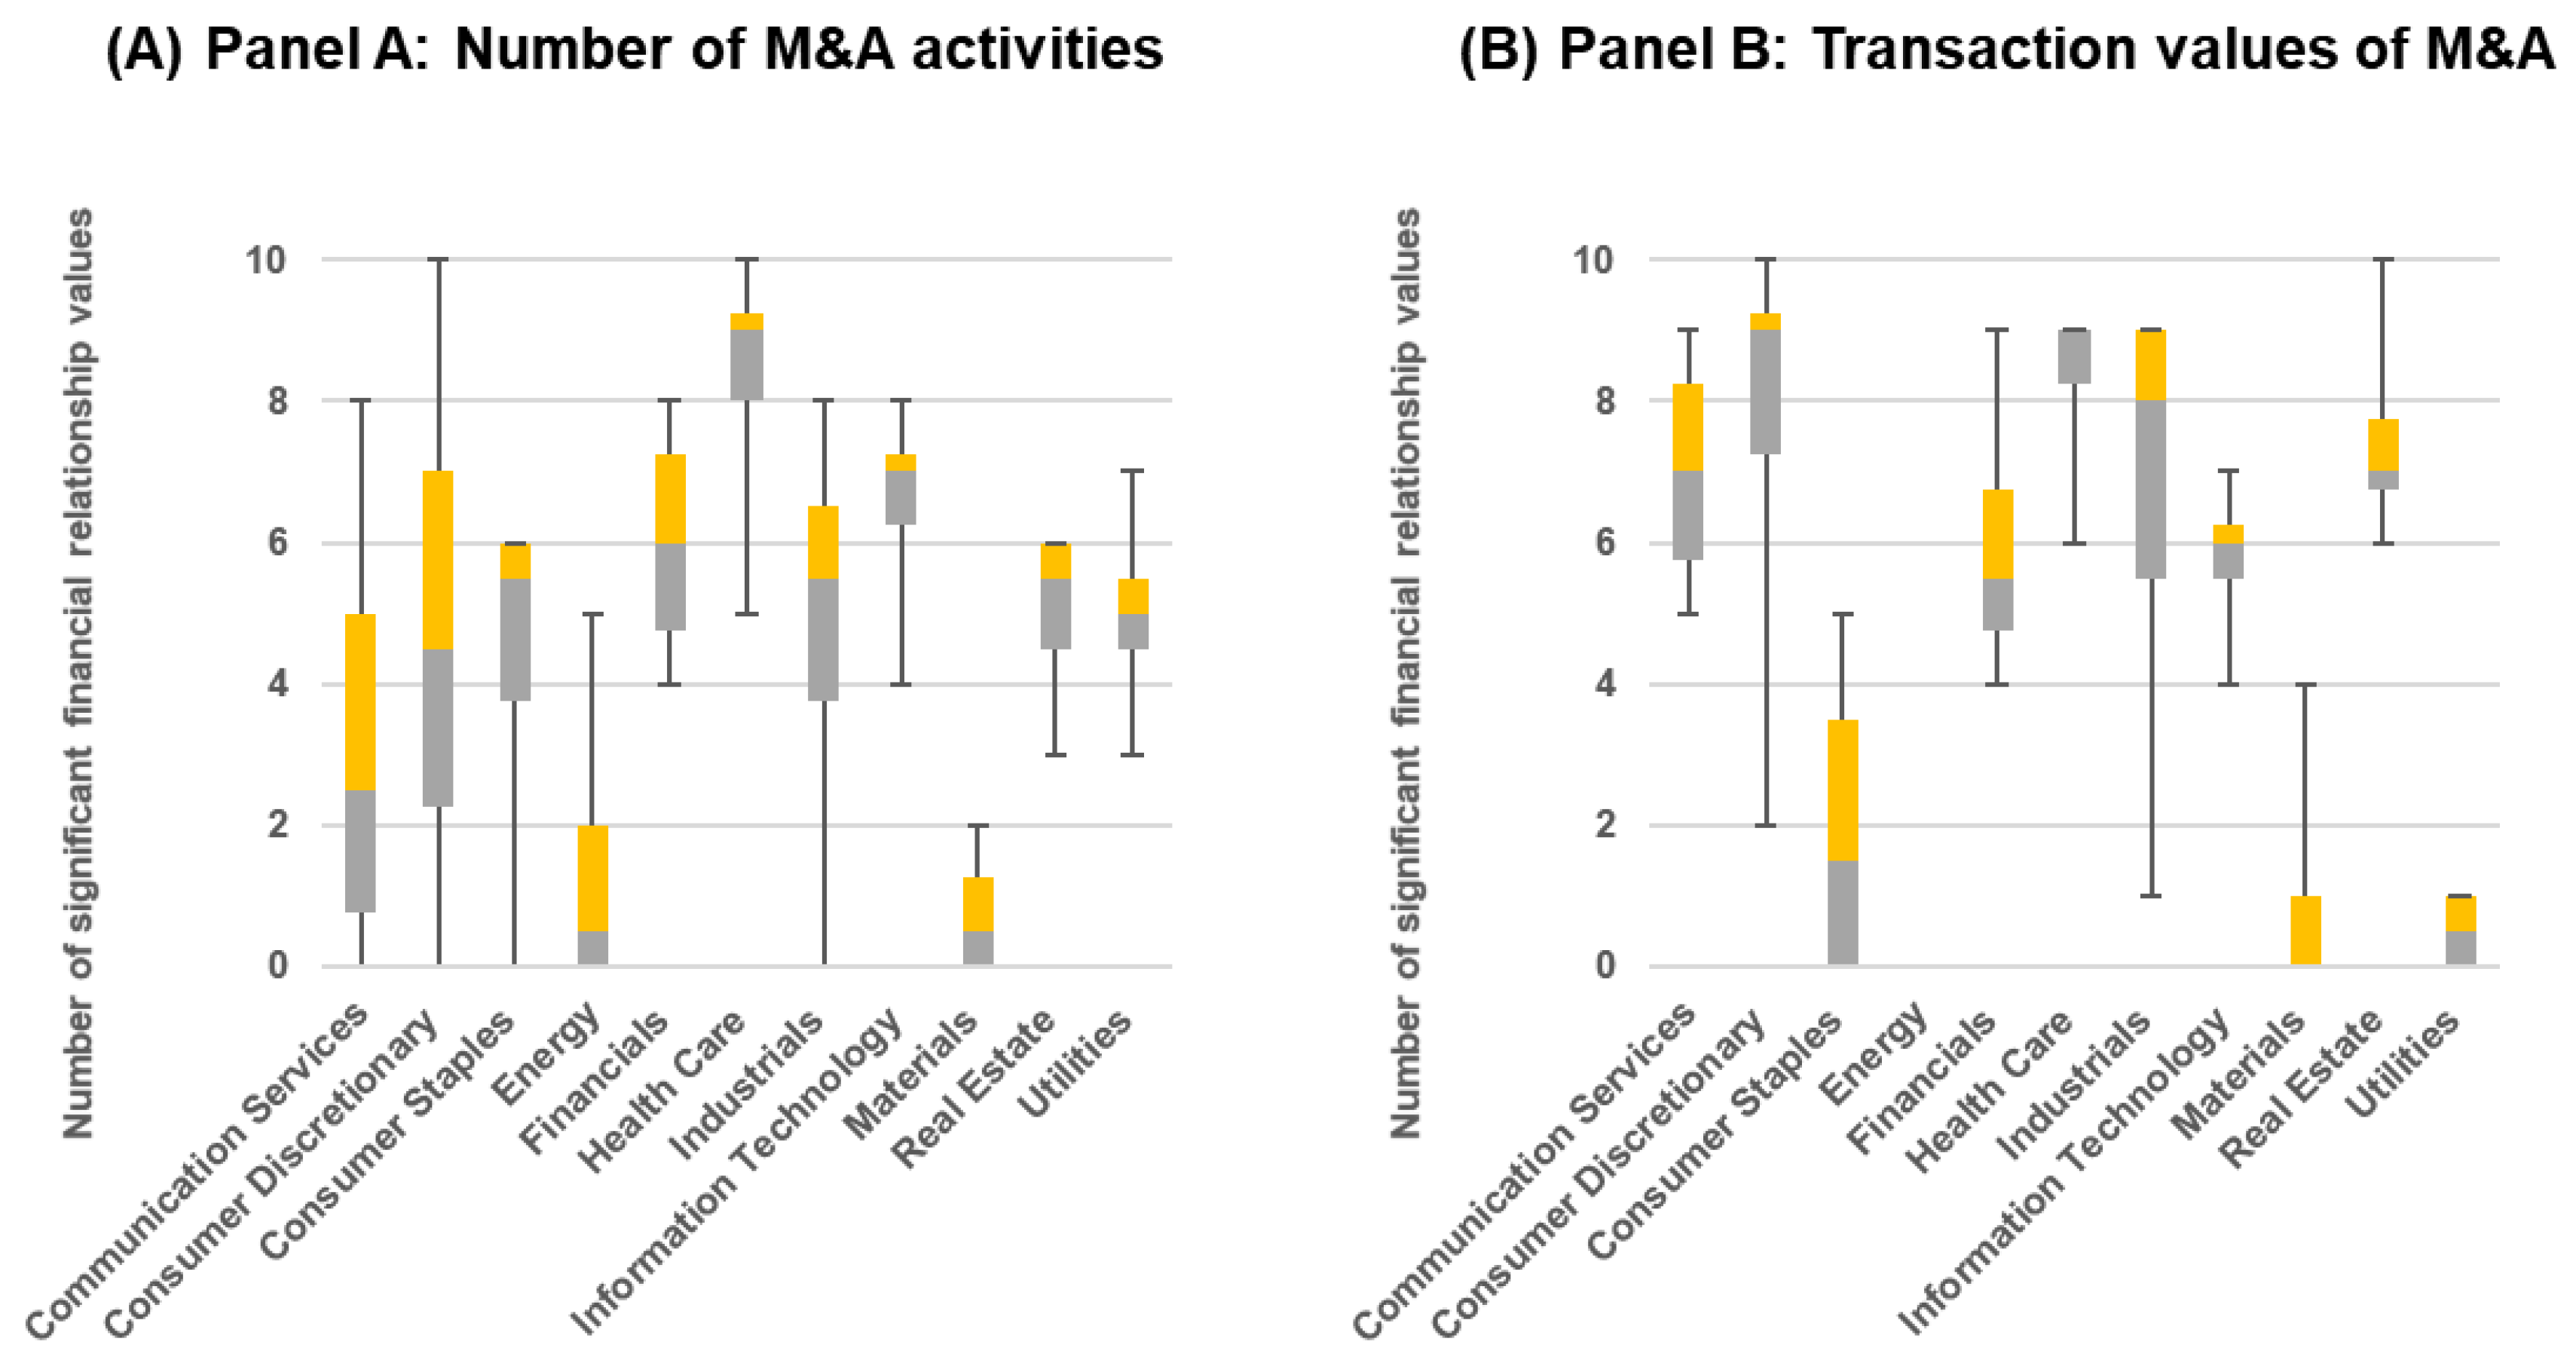
As a contribution to the existing literature on the significance of M&A activities on the improvement of financial performance, this study posits that it positively contributes to industry-level financial performance based on a three-year time period. The maximum, minimum, median, and quartiles (first quartile in grey, third quartile in yellow) of significant relationship are illustrated in Figure 1. Resultantly, financial, healthcare, and information technology industries were found to have at least six financial values that are statistically correlated to the number of M&A activities and transaction values. Financial had an average of six and six, healthcare with an average of nine and nine, information technology with an average of seven and six significant financial performance values for Panel A and B, respectively. This finding contradicts Yaghoubi’s [39] finding that banking and healthcare demonstrated significantly negative long-term returns over the three-year period, and suggestion that the long-term performance of the banking industry is around zero. Such differences in the findings may be due to the limited coverage of M&A activities and measures of financial values.
Moreover, the findings can be utilized to update those of the aforementioned study, which were based on the M&A effect between the timeline from 1981 to 2007. The abovementioned three industries are considered fast-paced industries, which are characterized by technology advancement enabling rapid changes in production and processing improvement [24,40]. While a low number of financial values are found to be significantly driven by the M&A activities for industries such as energy, materials, and utilities, the findings must be taken into consideration along with the fact that these industries also had a relatively low number of M&A activities. For example, the utilities industry remained at the bottom for both Panel A and Panel B while the materials industry had the lowest M&A transaction values of all 11 industries in Table 1.
4.2. Strategic Investment Planning Based on Industry-Specific Insights
By investigating the links between M&A activities and 11 industry-level financial values, this study provides a comprehensive overview of the impact of M&A activities on various industry-level financial outcomes and how the effect of M&As differs by industry. The size and complexity of an M&A increase with the size of the target [41], and both the transaction number and values are therefore worth comparing prior to anticipating a promising financial return. Based on the empirical test results, industries were divided into four classes to distinguish the outcomes of M&A activities as follows:
- Class 1: Industries in which the frequency and the transaction value of M&As have similar significant relationships with industry-level financial outcomes.
- Class 2: Industries in which the frequency of M&As has a more significant relationship than the transaction value of M&As with industry-level financial outcomes.
- Class 3: Industries in which the transaction value of M&As has a more significant relationship than the frequency of M&As with industry-level financial outcomes.
- Class 4: Industries in which both the frequency and the transaction value of M&As have weak significant relationships with industry-level financial outcomes.
Table 5 summarizes industry classification from the empirical results with descriptions of the significance level of frequency and transaction values of M&As for each class.
Among 11 industries, financial outcomes of the healthcare industry were found to have the most significant relationship with M&A activities, whereas those of the materials industry have the weakest relationships with M&A activities. Accordingly, the healthcare industry is expected to have the most positive outcomes from M&A activities, while M&As in the materials industry are found to have little effect. The results in Table 5 reveal the distinct effects of M&A activities at the industry-level across various industries. They also offer valuable implications to forward-looking stock market investors as well as managers who are seeking promising industries.
4.3. Strategic Investment Planning Based on Time Lag-Specific Insight
As an effective means to create new markets and competitive environments in value chains, industry convergence has gained attention as a complementary or substitutionary offering across industries [32], but without a timely support in the promising industry identification. At lag 1, Figure 2A, with the noticeable exception of energy, materials, financial, consumer staples, and healthcare industries, six other industries experienced an increase in the average number of significant financial values. On the other hand, Panel B illustrates that while six industries remained the same in terms of the relationship level for financial values, real estate, industrial, and financial industries experienced noticeable decreases as shown in Figure 2B.
At lag 2, Panel B experiences a sharp increase in the number of industries that experienced a positive increase in the financial relationship level. For example, most of the industries showed no improvement in the financial relationship level transitioning from lag 0 through lag 1, with the exception of two industries—consumer staples and communication services. However, entering lag 2, seven industries showed a dramatic increase in the number of financial values with significant relationships with M&A activities.
Based on the comparison analysis of each lag, the overall trends in promising industries and sub-industries can be further explored. This information is prudent for R&D policymakers and strategic investors as their primary interests lie in identifying promising technology and industry for an investment. With appropriate integration of analysis (i.e., association analysis), more sophisticated approach can be applied in analyzing the relationships by industries, sub-industries, and even technology areas.
5. Conclusions
Given the lack of research on the relationship between M&A activities and financial values, this study offers insights into the comprehensive review of M&A activities among various industries, explores the statistical relationship it has with the industry-level financial performance, and suggests strategic investment planning considering both industry and time lag perspectives.
Previous research on the role of M&A activities and its strategic management process for a desirable financial outcome remains in an initial stage. By comparing the relationship between M&A activities and financial values for each period, the overall trends in promising industries and sub-industries can be delineated. Such information can enable R&D policymakers and strategic investors in selecting appropriate promising industry and technology areas to cultivate and invest in for a positive financial outcome. However, this study has potential limitations that should inspire future in-depth study. First, this study mostly evaluates emerging technology based on financial implication of M&A activities. The future studies could integrate varying kinds of indicators including expert knowledge, new product and service introduction, or innovation performance. Second, this study relied on only one source of M&A activity. Therefore, future studies are could utilize other variables as part of M&A activity measure. Lastly, the experimental result in this study does not provide a clear-cut investment strategy and is of limited use in decision-making process.
In association with findings of this study, future research can be enriched in the following ways. First, the inclusion of exogenous variables such as market disruption, technology advancement, and even global financial crisis could support the exploration of industry-specific changes. Second, future studies may contribute to the strategic investment decision-making process by proposing a decision support framework that incorporates industry classification and time-lag analyses as part of the key features of the system. Lastly, further classifications of M&A activities’ characteristics may greatly contribute in advancing the industry convergence-driven financial performance forecast literature.
Author Contributions
Conceptualization, J.C., H.S.L., and N.S.; methodology, J.C., H.S.L., and N.S.; software, H.S.L.; validation, J.C., H.S.L., and N.S.; formal analysis, H.S.L.; investigation, H.S.L.; resources, J.C. and N.S.; data curation, J.C.; writing—original draft preparation, J.C., H.S.L., and N.S.; writing—review and editing, N.S.; visualization, N.S.; supervision, J.C.; project administration, J.C.; funding acquisition, J.C. All authors have read and agreed to the published version of the manuscript.
Funding
This research was supported by the Ministry of Education of the Republic of Korea and the National Research Foundation of Korea (NRF- 2019S1A5A2A03049194).
Conflicts of Interest
The authors declare no conflict of interest.
Appendix A

Table A1.
Test Results for Communication Services Industry.
| Lag 0 | Lag 1 | Lag2 | Lag3 | |||||||||
|---|---|---|---|---|---|---|---|---|---|---|---|---|
| Correlation | t-Statistics | p-Value | Correlation | t-Statistics | p-Value | Correlation | t-Statistics | p-Value | Correlation | t-Statistics | p-Value | |
| Panel A: Number of M&A and 12 financial related values | ||||||||||||
| MC | 0.3920 | 1.2053 | 0.2625 | 0.4603 | 1.3718 | 0.2125 | 0.7554 | 2.8236 | 0.0302 | 0.6534 | 1.9299 | 0.1115 |
| EBIT | 0.2311 | −0.6718 | 0.5206 | 0.6223 | −2.1031 | 0.0735 | 0.7421 | −2.7122 | 0.0350 | 0.7446 | −2.4944 | 0.0549 |
| EBITDA | 0.3859 | −1.1833 | 0.2707 | 0.6969 | −2.5710 | 0.0370 | 0.7496 | −2.7743 | 0.0322 | 0.7346 | −2.4213 | 0.0600 |
| TEV | 0.3567 | 1.0800 | 0.3116 | 0.4500 | 1.3333 | 0.2242 | 0.7988 | 3.2521 | 0.0174 | 0.5904 | 1.6357 | 0.1628 |
| CR | 0.6026 | 2.1360 | 0.0652 | 0.7110 | 2.6751 | 0.0318 | 0.5861 | 1.7720 | 0.1268 | 0.2867 | 0.6692 | 0.5330 |
| DR | 0.6246 | −2.2621 | 0.0535 | 0.2767 | −0.7618 | 0.4710 | 0.1678 | 0.4169 | 0.6913 | 0.0146 | 0.0327 | 0.9752 |
| DER | 0.5438 | −1.8326 | 0.1042 | 0.7572 | −3.0673 | 0.0181 | 0.7700 | −2.9560 | 0.0254 | 0.4024 | −0.9829 | 0.3708 |
| ATR | 0.3699 | 1.1262 | 0.2927 | 0.6504 | 2.2657 | 0.0578 | 0.7833 | 3.0864 | 0.0215 | 0.1836 | 0.4177 | 0.6935 |
| ROA | 0.5857 | 2.0437 | 0.0752 | 0.7679 | 3.1721 | 0.0157 | 0.7421 | 2.7123 | 0.0350 | 0.7877 | −2.8593 | 0.0354 |
| ROE | 0.5097 | 1.6755 | 0.1324 | 0.6653 | 2.3578 | 0.0505 | 0.8152 | 3.4471 | 0.0137 | 0.1443 | −0.3260 | 0.7576 |
| EPS | 0.0291 | 0.0824 | 0.9364 | 0.5672 | −1.8219 | 0.1113 | 0.2381 | −0.6005 | 0.5702 | 0.5763 | −1.5768 | 0.1757 |
| PER | 0.3156 | 0.9408 | 0.3743 | 0.4300 | 1.2601 | 0.2480 | 0.6877 | 2.3203 | 0.0594 | 0.4241 | 1.0470 | 0.3430 |
| Panel B: Transaction value of M&A and 12 financial related values | ||||||||||||
| MC | 0.5481 | 1.8536 | 0.1009 | 0.7225 | 2.7646 | 0.0279 | 0.8260 | 3.5890 | 0.0115 | 0.8546 | 3.6798 | 0.0143 |
| EBIT | 0.5509 | −1.8672 | 0.0988 | 0.7016 | −2.6053 | 0.0352 | 0.8631 | −4.1869 | 0.0058 | 0.7591 | −2.6073 | 0.0478 |
| EBITDA | 0.6532 | −2.4402 | 0.0406 | 0.7618 | −3.1117 | 0.0170 | 0.8760 | −4.4499 | 0.0043 | 0.8212 | −3.2179 | 0.0235 |
| TEV | 0.5024 | 1.6433 | 0.1390 | 0.6646 | 2.3530 | 0.0509 | 0.8284 | 3.6229 | 0.0111 | 0.8712 | 3.9677 | 0.0107 |
| CR | 0.6235 | 2.2555 | 0.0541 | 0.8146 | 3.7162 | 0.0075 | 0.9608 | 8.4844 | 0.0001 | 0.7669 | 2.6720 | 0.0442 |
| DR | 0.1930 | −0.5563 | 0.5932 | 0.4214 | −1.2293 | 0.2587 | 0.4491 | −1.2311 | 0.2644 | 0.4383 | −1.0904 | 0.3253 |
| DER | 0.6562 | −2.4598 | 0.0393 | 0.7138 | −2.6963 | 0.0308 | 0.8318 | −3.6704 | 0.0104 | 0.7295 | −2.3852 | 0.0628 |
| ATR | 0.6480 | 2.4062 | 0.0428 | 0.6130 | 2.0528 | 0.0792 | 0.7130 | 2.4906 | 0.0471 | 0.1590 | 0.3602 | 0.7334 |
| ROA | 0.7040 | 2.8034 | 0.0231 | 0.7661 | 3.1532 | 0.0161 | 0.6789 | 2.2647 | 0.0641 | 0.2638 | −0.6116 | 0.5675 |
| ROE | 0.6670 | 2.5321 | 0.0351 | 0.6522 | 2.2763 | 0.0569 | 0.6574 | 2.1370 | 0.0765 | 0.1096 | 0.2466 | 0.8151 |
| EPS | 0.1274 | −0.3633 | 0.7258 | 0.7474 | −2.9760 | 0.0206 | 0.7718 | −2.9735 | 0.0248 | 0.7226 | −2.3371 | 0.0666 |
| PER | 0.3009 | 0.8923 | 0.3983 | 0.7443 | 2.9483 | 0.0215 | 0.8333 | 3.6922 | 0.0102 | 0.8002 | 2.9833 | 0.0307 |
Bold figures in p-value column indicate significant correlation at the 5% significance level.
Table A2.
Test Results for Consumer Discretionary Industry.
| Lag 0 | Lag 1 | Lag2 | Lag3 | |||||||||
|---|---|---|---|---|---|---|---|---|---|---|---|---|
| Correlation | t-Statistics | p-Value | Correlation | t-Statistics | p-Value | Correlation | t-Statistics | p-Value | Correlation | t-Statistics | p-Value | |
| Panel A: Number of M&A and 12 financial related values | ||||||||||||
| MC | 0.4196 | 1.3074 | 0.2274 | 0.4803 | 1.4489 | 0.1906 | 0.7954 | 3.2147 | 0.0183 | 0.7257 | 2.3587 | 0.0649 |
| EBIT | 0.1924 | −0.5545 | 0.5944 | 0.9075 | −5.7173 | 0.0007 | 0.8444 | −3.8608 | 0.0084 | 0.0423 | −0.0947 | 0.9283 |
| EBITDA | 0.3513 | −1.0612 | 0.3196 | 0.9003 | −5.4709 | 0.0009 | 0.8734 | −4.3923 | 0.0046 | 0.4898 | −1.2562 | 0.2645 |
| TEV | 0.3747 | 1.1431 | 0.2860 | 0.4406 | 1.2984 | 0.2353 | 0.7592 | 2.8573 | 0.0289 | 0.7119 | 2.2667 | 0.0727 |
| CR | 0.5479 | 1.8523 | 0.1011 | 0.7419 | 2.9277 | 0.0221 | 0.7383 | 2.6815 | 0.0365 | 0.6946 | 2.1589 | 0.0833 |
| DR | 0.6571 | −2.4655 | 0.0390 | 0.3064 | −0.8515 | 0.4227 | 0.5203 | −1.4923 | 0.1862 | 0.5576 | −1.5022 | 0.1934 |
| DER | 0.5516 | −1.8704 | 0.0983 | 0.7788 | −3.2848 | 0.0134 | 0.9025 | −5.1327 | 0.0022 | 0.6948 | −2.1600 | 0.0832 |
| ATR | 0.6023 | 2.1342 | 0.0654 | 0.7958 | 3.4764 | 0.0103 | 0.8753 | 4.4346 | 0.0044 | 0.3327 | 0.7889 | 0.4659 |
| ROA | 0.6781 | 2.6094 | 0.0312 | 0.6736 | 2.4112 | 0.0467 | 0.8552 | 4.0419 | 0.0068 | 0.6719 | 2.0285 | 0.0983 |
| ROE | 0.6170 | 2.2175 | 0.0574 | 0.5911 | 1.9388 | 0.0937 | 0.7830 | 3.0832 | 0.0216 | 0.4865 | 1.2452 | 0.2682 |
| EPS | 0.7191 | 2.9266 | 0.0191 | 0.3901 | −1.1208 | 0.2994 | 0.2073 | −0.5191 | 0.6222 | 0.6897 | −2.1301 | 0.0864 |
| PER | 0.1381 | −0.3944 | 0.7036 | 0.3539 | 1.0012 | 0.3501 | 0.7863 | 3.1177 | 0.0206 | 0.6202 | 1.7677 | 0.1374 |
| Panel B: Transaction value of M&A and 12 financial related values | ||||||||||||
| MC | 0.8120 | 3.9349 | 0.0043 | 0.8104 | 3.6592 | 0.0081 | 0.8656 | 4.2347 | 0.0055 | 0.7552 | 2.5758 | 0.0497 |
| EBIT | 0.5078 | −1.6670 | 0.1341 | 0.8457 | −4.1933 | 0.0041 | 0.7401 | −2.6958 | 0.0358 | 0.2106 | −0.4818 | 0.6503 |
| EBITDA | 0.6419 | −2.3678 | 0.0454 | 0.8630 | −4.5201 | 0.0027 | 0.7646 | −2.9062 | 0.0271 | 0.6327 | −1.8268 | 0.1273 |
| TEV | 0.7912 | 3.6591 | 0.0064 | 0.7875 | 3.3803 | 0.0118 | 0.8485 | 3.9277 | 0.0077 | 0.7375 | 2.4421 | 0.0585 |
| CR | 0.9007 | 5.8629 | 0.0004 | 0.9273 | 6.5551 | 0.0003 | 0.8385 | 3.7690 | 0.0093 | 0.7439 | 2.4890 | 0.0552 |
| DR | 0.7883 | −3.6236 | 0.0067 | 0.5085 | −1.5624 | 0.1622 | 0.5443 | −1.5893 | 0.1631 | 0.4534 | −1.1376 | 0.3069 |
| DER | 0.8586 | −4.7380 | 0.0015 | 0.9289 | −6.6360 | 0.0003 | 0.9252 | −5.9722 | 0.0010 | 0.8631 | −3.8207 | 0.0124 |
| ATR | 0.7789 | 3.5132 | 0.0079 | 0.8381 | 4.0647 | 0.0048 | 0.7499 | 2.7770 | 0.0321 | 0.3875 | 0.9398 | 0.3905 |
| ROA | 0.8762 | 5.1433 | 0.0009 | 0.9034 | 5.5745 | 0.0008 | 0.8788 | 4.5107 | 0.0041 | 0.7262 | 2.3621 | 0.0646 |
| ROE | 0.8833 | 5.3290 | 0.0007 | 0.9213 | 6.2693 | 0.0004 | 0.9169 | 5.6261 | 0.0013 | 0.6758 | 2.0504 | 0.0956 |
| EPS | 0.3760 | 1.1477 | 0.2843 | 0.6351 | −2.1754 | 0.0661 | 0.4117 | −1.1067 | 0.3108 | 0.6905 | −2.1347 | 0.0859 |
| PER | 0.3045 | 0.9043 | 0.3923 | 0.6406 | 2.2070 | 0.0631 | 0.7480 | 2.7607 | 0.0328 | 0.5612 | 1.5162 | 0.1899 |
Bold figures in p-value column indicate significant correlation at the 5% significance level.
Table A3.
Test Results for Consumer Staples Industry.
| Lag 0 | Lag 1 | Lag2 | Lag3 | |||||||||
|---|---|---|---|---|---|---|---|---|---|---|---|---|
| Correlation | t-Statistics | p-Value | Correlation | t-Statistics | p-Value | Correlation | t-Statistics | p-Value | Correlation | t-Statistics | p-Value | |
| Panel A: Number of M&A and 12 financial related values | ||||||||||||
| MC | 0.6582 | 2.4731 | 0.0385 | 0.5958 | 1.9627 | 0.0905 | 0.7122 | 2.4850 | 0.0475 | 0.5058 | 1.3109 | 0.2469 |
| EBIT | 0.7243 | −2.9716 | 0.0178 | 0.8845 | −5.0151 | 0.0015 | 0.8778 | −4.4893 | 0.0042 | 0.3546 | −0.8480 | 0.4352 |
| EBITDA | 0.7240 | −2.9688 | 0.0179 | 0.8806 | −4.9177 | 0.0017 | 0.8781 | −4.4943 | 0.0041 | 0.6862 | −2.1096 | 0.0887 |
| TEV | 0.6707 | 2.5579 | 0.0338 | 0.6342 | 2.1701 | 0.0666 | 0.7342 | 2.6490 | 0.0381 | 0.5225 | 1.3702 | 0.2289 |
| CR | 0.5924 | 2.0800 | 0.0711 | 0.5069 | 1.5557 | 0.1637 | 0.5318 | 1.5383 | 0.1749 | 0.6889 | 2.1249 | 0.0870 |
| DR | 0.5639 | 1.9313 | 0.0895 | 0.7402 | 2.9124 | 0.0226 | 0.4096 | 1.0998 | 0.3136 | 0.6926 | −2.1472 | 0.0845 |
| DER | 0.6942 | −2.7278 | 0.0259 | 0.7260 | −2.7933 | 0.0268 | 0.8586 | −4.1025 | 0.0063 | 0.6846 | −2.1002 | 0.0897 |
| ATR | 0.6654 | 2.5214 | 0.0357 | 0.8119 | 3.6791 | 0.0079 | 0.7897 | 3.1529 | 0.0197 | 0.5829 | −1.6040 | 0.1696 |
| ROA | 0.1435 | 0.4100 | 0.6926 | 0.1004 | −0.2670 | 0.7972 | 0.1974 | 0.4933 | 0.6393 | 0.4948 | 1.2733 | 0.2589 |
| ROE | 0.5988 | 2.1144 | 0.0674 | 0.5743 | 1.8561 | 0.1058 | 0.6406 | 2.0435 | 0.0870 | 0.4567 | 1.1480 | 0.3029 |
| EPS | 0.2015 | −0.5817 | 0.5768 | 0.2880 | −0.7956 | 0.4524 | 0.2470 | 0.6244 | 0.5554 | 0.5512 | −1.4772 | 0.1997 |
| PER | 0.5744 | 1.9849 | 0.0824 | 0.5593 | 1.7849 | 0.1175 | 0.6761 | 2.2476 | 0.0657 | 0.6545 | 1.9359 | 0.1106 |
| Panel B: Transaction value of M&A and 12 financial related values | ||||||||||||
| MC | 0.5952 | 2.0952 | 0.0695 | 0.4717 | 1.4153 | 0.1999 | 0.7605 | 2.8688 | 0.0285 | 0.4619 | 1.1644 | 0.2968 |
| EBIT | 0.6117 | −2.1871 | 0.0602 | 0.7719 | −3.2120 | 0.0148 | 0.7523 | −2.7968 | 0.0313 | 0.4794 | −1.2216 | 0.2763 |
| EBITDA | 0.6117 | −2.1871 | 0.0602 | 0.7682 | −3.1749 | 0.0156 | 0.7560 | −2.8291 | 0.0300 | 0.6973 | −2.1755 | 0.0816 |
| TEV | 0.6068 | 2.1592 | 0.0629 | 0.5081 | 1.5606 | 0.1626 | 0.7705 | 2.9612 | 0.0252 | 0.4994 | 1.2888 | 0.2539 |
| CR | 0.5994 | 2.1182 | 0.0670 | 0.5478 | 1.7326 | 0.1268 | 0.4512 | 1.2383 | 0.2619 | 0.5438 | 1.4489 | 0.2070 |
| DR | 0.4172 | 1.2984 | 0.2303 | 0.5758 | 1.8634 | 0.1047 | 0.3834 | 1.0169 | 0.3484 | 0.4500 | −1.1269 | 0.3109 |
| DER | 0.6041 | −2.1440 | 0.0644 | 0.6301 | −2.1467 | 0.0689 | 0.7975 | −3.2384 | 0.0177 | 0.5641 | −1.5275 | 0.1872 |
| ATR | 0.5456 | 1.8412 | 0.1029 | 0.6967 | 2.5695 | 0.0370 | 0.6749 | 2.2401 | 0.0663 | 0.5055 | −1.3101 | 0.2471 |
| ROA | 0.2283 | 0.6633 | 0.5258 | 0.0498 | 0.1319 | 0.8988 | 0.2079 | 0.5205 | 0.6214 | 0.2517 | 0.5816 | 0.5861 |
| ROE | 0.5546 | 1.8849 | 0.0962 | 0.5701 | 1.8358 | 0.1090 | 0.6329 | 2.0023 | 0.0921 | 0.3536 | 0.8451 | 0.4366 |
| EPS | 0.3175 | −0.9470 | 0.3714 | 0.4221 | −1.2319 | 0.2578 | 0.4411 | 1.2040 | 0.2739 | 0.2395 | −0.5517 | 0.6049 |
| PER | 0.5638 | 1.9309 | 0.0896 | 0.4711 | 1.4131 | 0.2005 | 0.6458 | 2.0719 | 0.0837 | 0.5127 | 1.3353 | 0.2393 |
Bold figures in p-value column indicate significant correlation at the 5% significance level.
Table A4.
Test Results for Energy Industry.
| Lag 0 | Lag 1 | Lag2 | Lag3 | |||||||||
|---|---|---|---|---|---|---|---|---|---|---|---|---|
| Correlation | t-Statistics | p-Value | Correlation | t-Statistics | p-Value | Correlation | t-Statistics | p-Value | Correlation | t-Statistics | p-Value | |
| Panel A: Number of M&A and 12 financial related values | ||||||||||||
| MC | 0.2281 | −0.6626 | 0.5262 | 0.4992 | −1.5244 | 0.1712 | 0.0509 | −0.1248 | 0.9048 | 0.0435 | −0.0973 | 0.9263 |
| EBIT | 0.7986 | 3.7536 | 0.0056 | 0.6253 | 2.1199 | 0.0717 | 0.2604 | 0.6605 | 0.5334 | 0.2660 | 0.6171 | 0.5642 |
| EBITDA | 0.8481 | 4.5266 | 0.0019 | 0.5603 | 1.7899 | 0.1166 | 0.1335 | 0.3301 | 0.7526 | 0.6432 | 1.8783 | 0.1191 |
| TEV | 0.7746 | −3.4645 | 0.0085 | 0.8470 | −4.2152 | 0.0040 | 0.5590 | −1.6515 | 0.1497 | 0.3586 | −0.8590 | 0.4296 |
| CR | 0.2216 | 0.6429 | 0.5383 | 0.2444 | −0.6668 | 0.5262 | 0.6061 | −1.8666 | 0.1112 | 0.3522 | −0.8415 | 0.4385 |
| DR | 0.6562 | −2.4594 | 0.0394 | 0.3820 | −1.0937 | 0.3103 | 0.0862 | −0.2119 | 0.8392 | 0.4416 | −1.1007 | 0.3212 |
| DER | 0.3318 | −0.9949 | 0.3489 | 0.1676 | 0.4498 | 0.6664 | 0.6338 | 2.0071 | 0.0915 | 0.7275 | 2.3712 | 0.0639 |
| ATR | 0.4922 | −1.5994 | 0.1484 | 0.2524 | −0.6901 | 0.5124 | 0.0083 | 0.0202 | 0.9845 | 0.3835 | −0.9285 | 0.3958 |
| ROA | 0.4201 | −1.3093 | 0.2268 | 0.2596 | −0.7111 | 0.5000 | 0.0014 | −0.0034 | 0.9974 | 0.2648 | −0.6141 | 0.5660 |
| ROE | 0.4171 | −1.2981 | 0.2304 | 0.3819 | −1.0934 | 0.3104 | 0.1738 | −0.4322 | 0.6807 | 0.5206 | −1.3633 | 0.2310 |
| EPS | 0.8088 | 3.8897 | 0.0046 | 0.6264 | 2.1260 | 0.0711 | 0.4854 | 1.3599 | 0.2227 | 0.3247 | 0.7677 | 0.4773 |
| PER | 0.3740 | 1.1406 | 0.2870 | 0.1412 | 0.3774 | 0.7170 | 0.5258 | 1.5143 | 0.1807 | 0.5214 | 1.3662 | 0.2301 |
| Panel B: Transaction value of M&A and 12 financial related values | ||||||||||||
| MC | 0.3785 | 1.1567 | 0.2808 | 0.0103 | −0.0273 | 0.9790 | 0.2405 | 0.6069 | 0.5662 | 0.2915 | 0.6813 | 0.5259 |
| EBIT | 0.1672 | 0.4797 | 0.6443 | 0.3135 | −0.8734 | 0.4114 | 0.5248 | −1.5104 | 0.1817 | 0.3689 | −0.8875 | 0.4154 |
| EBITDA | 0.1853 | −0.5334 | 0.6083 | 0.3179 | −0.8871 | 0.4045 | 0.6719 | −2.2220 | 0.0680 | 0.1421 | −0.3209 | 0.7613 |
| TEV | 0.3618 | 1.0977 | 0.3043 | 0.3149 | 0.8779 | 0.4091 | 0.5193 | 1.4885 | 0.1872 | 0.5434 | 1.4475 | 0.2074 |
| CR | 0.4398 | −1.3851 | 0.2034 | 0.5346 | −1.6737 | 0.1381 | 0.1357 | −0.3354 | 0.7487 | 0.3343 | 0.7931 | 0.4636 |
| DR | 0.4683 | 1.4991 | 0.1722 | 0.5061 | 1.5525 | 0.1645 | 0.6648 | 2.1801 | 0.0720 | 0.4418 | 1.1012 | 0.3210 |
| DER | 0.4090 | 1.2678 | 0.2405 | 0.4293 | 1.2575 | 0.2489 | 0.2928 | 0.7500 | 0.4816 | 0.0563 | −0.1262 | 0.9045 |
| ATR | 0.4797 | 1.5463 | 0.1606 | 0.4352 | 1.2790 | 0.2417 | 0.5524 | 1.6232 | 0.1557 | 0.1568 | −0.3551 | 0.7370 |
| ROA | 0.5686 | 1.9551 | 0.0863 | 0.4454 | 1.3161 | 0.2296 | 0.6071 | 1.8714 | 0.1105 | 0.0946 | −0.2126 | 0.8401 |
| ROE | 0.5537 | 1.8808 | 0.0968 | 0.3772 | 1.0777 | 0.3169 | 0.5553 | 1.6355 | 0.1531 | 0.0134 | −0.0300 | 0.9772 |
| EPS | 0.0570 | 0.1616 | 0.8756 | 0.2688 | −0.7384 | 0.4843 | 0.3873 | −1.0291 | 0.3431 | 0.3405 | −0.8097 | 0.4549 |
| PER | 0.3832 | −1.1734 | 0.2744 | 0.1908 | −0.5142 | 0.6229 | 0.3345 | −0.8695 | 0.4180 | 0.2640 | 0.6121 | 0.5672 |
Bold figures in p-value column indicate significant correlation at the 5% significance level.
Table A5.
Test Results for Financial Industry.
| Lag 0 | Lag 1 | Lag2 | Lag3 | |||||||||
|---|---|---|---|---|---|---|---|---|---|---|---|---|
| Correlation | t-Statistics | p-Value | Correlation | t-Statistics | p-Value | Correlation | t-Statistics | p-Value | Correlation | t-Statistics | p-Value | |
| Panel A: Number of M&A and 12 financial related values | ||||||||||||
| MC | 0.7196 | 2.9312 | 0.0190 | 0.6843 | 2.4831 | 0.0420 | 0.8067 | 3.3443 | 0.0155 | 0.7548 | 2.5730 | 0.0499 |
| EBIT | 0.6512 | −2.4271 | 0.0414 | 0.7202 | −2.7467 | 0.0286 | 0.5111 | 1.4566 | 0.1955 | 0.4602 | −1.1590 | 0.2988 |
| EBITDA | 0.7923 | −3.6732 | 0.0063 | 0.8495 | −4.2598 | 0.0037 | 0.0432 | −0.1060 | 0.9190 | 0.4735 | −1.2022 | 0.2831 |
| TEV | 0.7129 | 2.8753 | 0.0207 | 0.4860 | 1.4711 | 0.1847 | 0.7558 | 2.8277 | 0.0300 | 0.8055 | 3.0392 | 0.0288 |
| CR | 0.7420 | −3.1307 | 0.0140 | 0.5647 | −1.8104 | 0.1131 | 0.9051 | −5.2155 | 0.0020 | 0.5431 | −1.4462 | 0.2078 |
| DR | 0.7955 | 3.7127 | 0.0059 | 0.7281 | 2.8107 | 0.0261 | 0.8025 | 3.2948 | 0.0165 | 0.6654 | 1.9934 | 0.1028 |
| DER | 0.6307 | 2.2990 | 0.0505 | 0.4721 | 1.4171 | 0.1994 | 0.3061 | 0.7875 | 0.4610 | 0.0361 | −0.0807 | 0.9388 |
| ATR | 0.6310 | 2.3006 | 0.0504 | 0.6593 | 2.3202 | 0.0534 | 0.7742 | 2.9966 | 0.0241 | 0.8921 | 4.4143 | 0.0069 |
| ROA | 0.6555 | 2.4549 | 0.0396 | 0.5845 | 1.9058 | 0.0984 | 0.8969 | 4.9688 | 0.0025 | 0.6803 | 2.0756 | 0.0926 |
| ROE | 0.0384 | 0.1086 | 0.9162 | 0.0883 | −0.2345 | 0.8213 | 0.8053 | 3.3273 | 0.0159 | 0.1790 | −0.4068 | 0.7010 |
| EPS | 0.6449 | 2.3867 | 0.0441 | 0.5125 | 1.5791 | 0.1583 | 0.6023 | 1.8481 | 0.1141 | 0.7746 | 2.7385 | 0.0409 |
| PER | 0.0523 | 0.1481 | 0.8859 | 0.6968 | 2.5702 | 0.0370 | 0.6039 | 1.8559 | 0.1129 | 0.0265 | −0.0593 | 0.9550 |
| Panel B: Transaction value of M&A and 12 financial related values | ||||||||||||
| MC | 0.7292 | 3.0137 | 0.0167 | 0.7891 | 3.3992 | 0.0115 | 0.7551 | 2.8215 | 0.0303 | 0.9097 | 4.8995 | 0.0045 |
| EBIT | 0.6563 | −2.4600 | 0.0393 | 0.8869 | −5.0801 | 0.0014 | 0.2559 | 0.6483 | 0.5408 | 0.1887 | −0.4296 | 0.6853 |
| EBITDA | 0.7487 | −3.1945 | 0.0127 | 0.9666 | −9.9808 | 0.0000 | 0.3288 | −0.8529 | 0.4264 | 0.3519 | −0.8405 | 0.4390 |
| TEV | 0.7665 | 3.3756 | 0.0097 | 0.5758 | 1.8633 | 0.1047 | 0.6554 | 2.1254 | 0.0777 | 0.9480 | 6.6584 | 0.0012 |
| CR | 0.7319 | −3.0380 | 0.0161 | 0.5769 | −1.8686 | 0.1039 | 0.8837 | −4.6252 | 0.0036 | 0.7103 | −2.2563 | 0.0737 |
| DR | 0.7946 | 3.7013 | 0.0060 | 0.7352 | 2.8699 | 0.0240 | 0.7969 | 3.2309 | 0.0179 | 0.8118 | 3.1088 | 0.0266 |
| DER | 0.2250 | 0.6530 | 0.5321 | 0.4054 | 1.1733 | 0.2790 | 0.4228 | 1.1428 | 0.2967 | 0.3702 | 0.8911 | 0.4137 |
| ATR | 0.8178 | 4.0192 | 0.0038 | 0.6814 | 2.4632 | 0.0433 | 0.7795 | 3.0479 | 0.0226 | 0.7580 | 2.5983 | 0.0483 |
| ROA | 0.7667 | 3.3775 | 0.0097 | 0.5643 | 1.8085 | 0.1135 | 0.8579 | 4.0906 | 0.0064 | 0.7290 | 2.3815 | 0.0630 |
| ROE | 0.2127 | 0.6156 | 0.5553 | 0.2016 | −0.5445 | 0.6030 | 0.6948 | 2.3663 | 0.0558 | 0.0665 | −0.1491 | 0.8873 |
| EPS | 0.8691 | 4.9686 | 0.0011 | 0.5564 | 1.7719 | 0.1197 | 0.5708 | 1.7028 | 0.1395 | 0.4777 | 1.2158 | 0.2783 |
| PER | 0.1253 | −0.3571 | 0.7303 | 0.5934 | 1.9507 | 0.0921 | 0.8539 | 4.0181 | 0.0070 | 0.3211 | 0.7582 | 0.4825 |
Bold figures in p-value column indicate significant correlation at the 5% significance level.
Table A6.
Test Results for Healthcare Industry.
| Lag 0 | Lag 1 | Lag2 | Lag3 | |||||||||
|---|---|---|---|---|---|---|---|---|---|---|---|---|
| Correlation | t-Statistics | p-Value | Correlation | t-Statistics | p-Value | Correlation | t-Statistics | p-Value | Correlation | t-Statistics | p-Value | |
| Panel A: Number of M&A and 12 financial related values | ||||||||||||
| MC | 0.8203 | 4.0567 | 0.0037 | 0.7278 | 2.8079 | 0.0262 | 0.8293 | 3.6352 | 0.0109 | 0.7631 | 2.6400 | 0.0460 |
| EBIT | 0.8546 | −4.6547 | 0.0016 | 0.9306 | −6.7251 | 0.0003 | 0.5044 | −1.4308 | 0.2024 | 0.7325 | −2.4058 | 0.0612 |
| EBITDA | 0.8329 | −4.2568 | 0.0028 | 0.9362 | −7.0481 | 0.0002 | 0.8566 | −4.0661 | 0.0066 | 0.7684 | −2.6847 | 0.0436 |
| TEV | 0.7933 | 3.6854 | 0.0062 | 0.6711 | 2.3949 | 0.0478 | 0.8209 | 3.5210 | 0.0125 | 0.7212 | 2.3279 | 0.0674 |
| CR | 0.3070 | 0.9123 | 0.3883 | 0.0950 | 0.2525 | 0.8079 | 0.1811 | 0.4510 | 0.6678 | 0.6040 | 1.6946 | 0.1509 |
| DR | 0.1085 | 0.3088 | 0.7654 | 0.0701 | 0.1859 | 0.8578 | 0.3373 | −0.8776 | 0.4139 | 0.7376 | −2.4425 | 0.0585 |
| DER | 0.6652 | −2.5195 | 0.0358 | 0.6596 | −2.3216 | 0.0533 | 0.9272 | −6.0638 | 0.0009 | 0.8634 | −3.8263 | 0.0123 |
| ATR | 0.7352 | 3.0675 | 0.0154 | 0.8026 | 3.5592 | 0.0092 | 0.8480 | 3.9199 | 0.0078 | 0.6819 | 2.0847 | 0.0915 |
| ROA | 0.7895 | 3.6379 | 0.0066 | 0.7962 | 3.4818 | 0.0102 | 0.8298 | 3.6428 | 0.0108 | 0.7700 | 2.6988 | 0.0428 |
| ROE | 0.7921 | 3.6707 | 0.0063 | 0.7747 | 3.2416 | 0.0142 | 0.8206 | 3.5170 | 0.0126 | 0.5083 | 1.3197 | 0.2441 |
| EPS | 0.8342 | −4.2787 | 0.0027 | 0.8664 | −4.5914 | 0.0025 | 0.8150 | −3.4451 | 0.0137 | 0.8746 | −4.0332 | 0.0100 |
| PER | 0.7545 | 3.2520 | 0.0117 | 0.6777 | 2.4384 | 0.0449 | 0.7200 | 2.5416 | 0.0440 | 0.5172 | 1.3514 | 0.2345 |
| Panel B: Transaction value of M&A and 12 financial related values | ||||||||||||
| MC | 0.6932 | 2.7202 | 0.0262 | 0.7133 | 2.6929 | 0.0310 | 0.8746 | 4.4186 | 0.0045 | 0.6498 | 1.9116 | 0.1142 |
| EBIT | 0.8212 | −4.0704 | 0.0036 | 0.7628 | −3.1207 | 0.0168 | 0.5104 | −1.4538 | 0.1962 | 0.8045 | −3.0287 | 0.0291 |
| EBITDA | 0.7780 | −3.5023 | 0.0081 | 0.8308 | −3.9491 | 0.0055 | 0.7888 | −3.1437 | 0.0200 | 0.8533 | −3.6595 | 0.0146 |
| TEV | 0.6564 | 2.4611 | 0.0393 | 0.6755 | 2.4239 | 0.0458 | 0.8862 | 4.6849 | 0.0034 | 0.5616 | 1.5177 | 0.1896 |
| CR | 0.1888 | 0.5437 | 0.6015 | 0.0509 | 0.1349 | 0.8965 | 0.1984 | 0.4959 | 0.6376 | 0.6245 | 1.7878 | 0.1339 |
| DR | 0.2195 | 0.6362 | 0.5424 | 0.1211 | 0.3227 | 0.7563 | 0.3429 | −0.8942 | 0.4057 | 0.7761 | −2.7517 | 0.0402 |
| DER | 0.4441 | −1.4019 | 0.1985 | 0.5873 | −1.9196 | 0.0964 | 0.8989 | −5.0243 | 0.0024 | 0.8336 | −3.3751 | 0.0198 |
| ATR | 0.6583 | 2.4735 | 0.0385 | 0.7102 | 2.6690 | 0.0320 | 0.7344 | 2.6506 | 0.0380 | 0.7786 | 2.7740 | 0.0392 |
| ROA | 0.7521 | 3.2278 | 0.0121 | 0.7930 | 3.4439 | 0.0108 | 0.7466 | 2.7490 | 0.0333 | 0.6973 | 2.1753 | 0.0816 |
| ROE | 0.7538 | 3.2451 | 0.0118 | 0.7713 | 3.2058 | 0.0149 | 0.7425 | 2.7150 | 0.0349 | 0.4720 | 1.1971 | 0.2849 |
| EPS | 0.7032 | −2.7972 | 0.0233 | 0.7551 | −3.0468 | 0.0187 | 0.8057 | −3.3319 | 0.0158 | 0.8734 | −4.0093 | 0.0102 |
| PER | 0.6737 | 2.5786 | 0.0327 | 0.7076 | 2.6492 | 0.0330 | 0.7657 | 2.9156 | 0.0268 | 0.4217 | 1.0400 | 0.3460 |
Bold figures in p-value column indicate significant correlation at the 5% significance level.
Table A7.
Test Results for Industrial Industry.
| Lag 0 | Lag 1 | Lag2 | Lag3 | |||||||||
|---|---|---|---|---|---|---|---|---|---|---|---|---|
| Correlation | t-Statistics | p-Value | Correlation | t-Statistics | p-Value | Correlation | t-Statistics | p-Value | Correlation | t-Statistics | p-Value | |
| Panel A: Number of M&A and 12 financial related values | ||||||||||||
| MC | 0.4337 | 1.3616 | 0.2104 | 0.4523 | 1.3417 | 0.2216 | 0.7285 | 2.6048 | 0.0404 | 0.5768 | 1.5790 | 0.1752 |
| EBIT | 0.5206 | −1.7248 | 0.1228 | 0.9108 | −5.8371 | 0.0006 | 0.8308 | −3.6559 | 0.0106 | 0.3619 | −0.8681 | 0.4250 |
| EBITDA | 0.5875 | −2.0536 | 0.0741 | 0.9055 | −5.6453 | 0.0008 | 0.8556 | −4.0494 | 0.0067 | 0.5694 | −1.5489 | 0.1821 |
| TEV | 0.4612 | 1.4702 | 0.1797 | 0.4539 | 1.3478 | 0.2197 | 0.6901 | 2.3357 | 0.0582 | 0.5909 | 1.6380 | 0.1623 |
| CR | 0.6081 | 2.1664 | 0.0622 | 0.6520 | 2.2749 | 0.0571 | 0.6245 | 1.9587 | 0.0979 | 0.5948 | 1.6547 | 0.1589 |
| DR | 0.0296 | −0.0837 | 0.9354 | 0.0549 | 0.1456 | 0.8884 | 0.2642 | −0.6711 | 0.5271 | 0.5238 | −1.3751 | 0.2275 |
| DER | 0.6689 | −2.5448 | 0.0345 | 0.8159 | −3.7339 | 0.0073 | 0.8913 | −4.8145 | 0.0030 | 0.7304 | −2.3910 | 0.0623 |
| ATR | 0.6880 | 2.6814 | 0.0279 | 0.8267 | 3.8878 | 0.0060 | 0.7935 | 3.1944 | 0.0187 | 0.3558 | −0.8514 | 0.4334 |
| ROA | 0.7693 | 3.4058 | 0.0093 | 0.7635 | 3.1284 | 0.0166 | 0.8832 | 4.6118 | 0.0036 | 0.5525 | 1.4822 | 0.1984 |
| ROE | 0.7237 | 2.9661 | 0.0180 | 0.7743 | 3.2376 | 0.0143 | 0.8576 | 4.0852 | 0.0065 | 0.2907 | 0.6794 | 0.5271 |
| EPS | 0.8207 | 4.0621 | 0.0036 | 0.2156 | 0.5842 | 0.5774 | 0.2150 | 0.5392 | 0.6092 | 0.3353 | 0.7958 | 0.4622 |
| PER | 0.0067 | 0.0189 | 0.9854 | 0.2774 | 0.7640 | 0.4698 | 0.7759 | 3.0131 | 0.0236 | 0.4080 | 0.9991 | 0.3636 |
| Panel B: Transaction value of M&A and 12 financial related values | ||||||||||||
| MC | 0.6376 | 2.3412 | 0.0473 | 0.6195 | 2.0879 | 0.0752 | 0.7904 | 3.1606 | 0.0195 | 0.6609 | 1.9691 | 0.1061 |
| EBIT | 0.5915 | −2.0748 | 0.0717 | 0.9192 | −6.1739 | 0.0005 | 0.8786 | −4.5074 | 0.0041 | 0.3707 | −0.8925 | 0.4130 |
| EBITDA | 0.6472 | −2.4014 | 0.0431 | 0.9167 | −6.0707 | 0.0005 | 0.8932 | −4.8657 | 0.0028 | 0.5777 | −1.5825 | 0.1744 |
| TEV | 0.6405 | 2.3588 | 0.0460 | 0.6082 | 2.0272 | 0.0823 | 0.7500 | 2.7774 | 0.0321 | 0.6496 | 1.9107 | 0.1143 |
| CR | 0.7264 | 2.9894 | 0.0174 | 0.7462 | 2.9655 | 0.0209 | 0.6974 | 2.3834 | 0.0545 | 0.6014 | 1.6830 | 0.1532 |
| DR | 0.1402 | −0.4006 | 0.6992 | 0.0305 | −0.0808 | 0.9379 | 0.2974 | −0.7629 | 0.4744 | 0.4959 | −1.2769 | 0.2577 |
| DER | 0.7595 | −3.3021 | 0.0108 | 0.8703 | −4.6762 | 0.0023 | 0.9381 | −6.6327 | 0.0006 | 0.7914 | −2.8946 | 0.0340 |
| ATR | 0.7019 | 2.7875 | 0.0237 | 0.8104 | 3.6592 | 0.0081 | 0.8020 | 3.2885 | 0.0166 | 0.3798 | −0.9179 | 0.4008 |
| ROA | 0.8150 | 3.9775 | 0.0041 | 0.8309 | 3.9504 | 0.0055 | 0.9256 | 5.9897 | 0.0010 | 0.5884 | 1.6273 | 0.1646 |
| ROE | 0.7993 | 3.7618 | 0.0055 | 0.8476 | 4.2270 | 0.0039 | 0.9294 | 6.1685 | 0.0008 | 0.3708 | 0.8928 | 0.4128 |
| EPS | 0.8718 | 5.0334 | 0.0010 | 0.4117 | 1.1952 | 0.2709 | 0.3377 | 0.8788 | 0.4133 | 0.4014 | 0.9799 | 0.3721 |
| PER | 0.1879 | 0.5412 | 0.6031 | 0.3691 | 1.0507 | 0.3283 | 0.7412 | 2.7043 | 0.0354 | 0.4724 | 1.1983 | 0.2845 |
Bold figures in p-value column indicate significant correlation at the 5% significance level.
Table A8.
Test Results for Information Technology Industry.
| Lag 0 | Lag 1 | Lag2 | Lag3 | |||||||||
|---|---|---|---|---|---|---|---|---|---|---|---|---|
| Correlation | t-Statistics | p-Value | Correlation | t-Statistics | p-Value | Correlation | t-Statistics | p-Value | Correlation | t-Statistics | p-Value | |
| Panel A: Number of M&A and 12 financial related values | ||||||||||||
| MC | 0.8076 | 3.8739 | 0.0047 | 0.7525 | 3.0234 | 0.0193 | 0.9091 | 5.3463 | 0.0018 | 0.8176 | 3.1753 | 0.0247 |
| EBIT | 0.3489 | −1.0529 | 0.3231 | 0.8134 | −3.6999 | 0.0077 | 0.6864 | −2.3117 | 0.0601 | 0.4430 | −1.1048 | 0.3196 |
| EBITDA | 0.6404 | −2.3583 | 0.0461 | 0.8397 | −4.0907 | 0.0046 | 0.7457 | −2.7419 | 0.0337 | 0.6019 | −1.6852 | 0.1528 |
| TEV | 0.7928 | 3.6789 | 0.0062 | 0.7271 | 2.8022 | 0.0264 | 0.9008 | 5.0809 | 0.0023 | 0.8228 | 3.2368 | 0.0230 |
| CR | 0.8495 | 4.5542 | 0.0019 | 0.7619 | 3.1119 | 0.0170 | 0.4750 | 1.3223 | 0.2343 | 0.3181 | 0.7503 | 0.4868 |
| DR | 0.0580 | −0.1644 | 0.8735 | 0.0250 | −0.0661 | 0.9491 | 0.0589 | 0.1444 | 0.8899 | 0.2874 | −0.6709 | 0.5320 |
| DER | 0.9041 | −5.9854 | 0.0003 | 0.9252 | −6.4502 | 0.0004 | 0.9003 | −5.0657 | 0.0023 | 0.7446 | −2.4945 | 0.0549 |
| ATR | 0.4386 | 1.3805 | 0.2048 | 0.0967 | 0.2572 | 0.8044 | 0.0538 | 0.1320 | 0.8993 | 0.6518 | −1.9216 | 0.1127 |
| ROA | 0.8210 | 4.0669 | 0.0036 | 0.6901 | 2.5231 | 0.0396 | 0.8614 | 4.1542 | 0.0060 | 0.8436 | 3.5134 | 0.0170 |
| ROE | 0.8483 | 4.5304 | 0.0019 | 0.7507 | 3.0067 | 0.0198 | 0.8431 | 3.8407 | 0.0086 | 0.9187 | 5.2021 | 0.0035 |
| EPS | 0.1965 | 0.5667 | 0.5865 | 0.6012 | −1.9906 | 0.0868 | 0.1322 | −0.3267 | 0.7550 | 0.5990 | 1.6726 | 0.1553 |
| PER | 0.4610 | 1.4694 | 0.1799 | 0.6659 | 2.3613 | 0.0502 | 0.7877 | 3.1320 | 0.0203 | 0.4466 | 1.1162 | 0.3151 |
| Panel B: Transaction value of M&A and 12 financial related values | ||||||||||||
| MC | 0.8168 | 4.0039 | 0.0039 | 0.6859 | 2.4940 | 0.0414 | 0.9218 | 5.8243 | 0.0011 | 0.8021 | 3.0030 | 0.0300 |
| EBIT | 0.3406 | −1.0245 | 0.3356 | 0.8181 | −3.7636 | 0.0070 | 0.6805 | −2.2746 | 0.0633 | 0.4658 | −1.1769 | 0.2922 |
| EBITDA | 0.6228 | −2.2515 | 0.0544 | 0.8336 | −3.9934 | 0.0052 | 0.7471 | −2.7531 | 0.0332 | 0.6176 | −1.7557 | 0.1395 |
| TEV | 0.8052 | 3.8407 | 0.0049 | 0.6576 | 2.3097 | 0.0542 | 0.9123 | 5.4580 | 0.0016 | 0.8078 | 3.0648 | 0.0279 |
| CR | 0.7611 | 3.3193 | 0.0106 | 0.7207 | 2.7503 | 0.0285 | 0.4738 | 1.3178 | 0.2357 | 0.3196 | 0.7543 | 0.4846 |
| DR | 0.0232 | 0.0656 | 0.9493 | 0.0133 | 0.0352 | 0.9729 | 0.0734 | 0.1802 | 0.8629 | 0.2933 | −0.6860 | 0.5232 |
| DER | 0.8838 | −5.3429 | 0.0007 | 0.9070 | −5.6968 | 0.0007 | 0.8696 | −4.3145 | 0.0050 | 0.7282 | −2.3759 | 0.0635 |
| ATR | 0.4426 | 1.3962 | 0.2002 | 0.1273 | 0.3395 | 0.7442 | 0.0920 | 0.2262 | 0.8285 | 0.6345 | −1.8358 | 0.1258 |
| ROA | 0.8109 | 3.9188 | 0.0044 | 0.6599 | 2.3238 | 0.0531 | 0.8723 | 4.3691 | 0.0047 | 0.8461 | 3.5498 | 0.0164 |
| ROE | 0.8334 | 4.2651 | 0.0027 | 0.7408 | 2.9178 | 0.0224 | 0.8406 | 3.8013 | 0.0090 | 0.9271 | 5.5311 | 0.0026 |
| EPS | 0.2444 | 0.7130 | 0.4961 | 0.6263 | −2.1254 | 0.0711 | 0.1567 | −0.3887 | 0.7109 | 0.6006 | 1.6797 | 0.1538 |
| PER | 0.4104 | 1.2728 | 0.2388 | 0.5872 | 1.9194 | 0.0964 | 0.8544 | 4.0277 | 0.0069 | 0.4140 | 1.0170 | 0.3558 |
Bold figures in p-value column indicate significant correlation at the 5% significance level.
Table A9.
Test Results for Materials Industry.
| Lag 0 | Lag 1 | Lag2 | Lag3 | |||||||||
|---|---|---|---|---|---|---|---|---|---|---|---|---|
| Correlation | t-Statistics | p-Value | Correlation | t-Statistics | p-Value | Correlation | t-Statistics | p-Value | Correlation | t-Statistics | p-Value | |
| Panel A: Number of M&A and 12 financial related values | ||||||||||||
| MC | 0.3057 | 0.9081 | 0.3904 | 0.1131 | −0.3011 | 0.7721 | 0.1192 | −0.2940 | 0.7787 | 0.4873 | −1.2479 | 0.2673 |
| EBIT | 0.7779 | 3.5011 | 0.0081 | 0.2667 | −0.7320 | 0.4879 | 0.5326 | −1.5413 | 0.1742 | 0.2548 | −0.5892 | 0.5813 |
| EBITDA | 0.6246 | 2.2621 | 0.0535 | 0.1495 | −0.4001 | 0.7010 | 0.4014 | −1.0735 | 0.3243 | 0.1654 | −0.3750 | 0.7231 |
| TEV | 0.1064 | 0.3028 | 0.7698 | 0.2608 | −0.7146 | 0.4980 | 0.1768 | −0.4399 | 0.6754 | 0.3978 | −0.9696 | 0.3768 |
| CR | 0.6450 | 2.3872 | 0.0440 | 0.1437 | −0.3841 | 0.7123 | 0.6416 | −2.0488 | 0.0864 | 0.6964 | −2.1698 | 0.0822 |
| DR | 0.4525 | −1.4354 | 0.1891 | 0.0952 | 0.2530 | 0.8076 | 0.5504 | 1.6148 | 0.1575 | 0.8022 | 3.0047 | 0.0299 |
| DER | 0.2774 | 0.8166 | 0.4378 | 0.0004 | 0.0010 | 0.9992 | 0.1260 | −0.3111 | 0.7663 | 0.4795 | 1.2218 | 0.2762 |
| ATR | 0.1492 | −0.4266 | 0.6809 | 0.2081 | 0.5628 | 0.5912 | 0.6215 | 1.9430 | 0.1000 | 0.2815 | 0.6559 | 0.5409 |
| ROA | 0.1706 | −0.4896 | 0.6376 | 0.0036 | 0.0095 | 0.9927 | 0.1484 | 0.3677 | 0.7257 | 0.3356 | −0.7967 | 0.4618 |
| ROE | 0.1111 | −0.3161 | 0.7600 | 0.0394 | −0.1042 | 0.9199 | 0.0502 | 0.1232 | 0.9060 | 0.4152 | −1.0206 | 0.3543 |
| EPS | 0.6084 | 2.1685 | 0.0620 | 0.1073 | 0.2855 | 0.7835 | 0.3449 | −0.9000 | 0.4028 | 0.3100 | −0.7290 | 0.4987 |
| PER | 0.2985 | −0.8847 | 0.4021 | 0.4718 | −1.4158 | 0.1997 | 0.0396 | 0.0972 | 0.9258 | 0.1560 | −0.3532 | 0.7384 |
| Panel B: Transaction value of M&A and 12 financial related values | ||||||||||||
| MC | 0.1288 | −0.3675 | 0.7228 | 0.2226 | −0.6042 | 0.5648 | 0.5666 | 1.6842 | 0.1431 | 0.4427 | 1.1040 | 0.3199 |
| EBIT | 0.2264 | 0.6575 | 0.5293 | 0.5631 | −1.8029 | 0.1144 | 0.2912 | −0.7455 | 0.4841 | 0.4625 | 1.1664 | 0.2961 |
| EBITDA | 0.0841 | −0.2388 | 0.8173 | 0.5861 | −1.9139 | 0.0972 | 0.6479 | −2.0837 | 0.0823 | 0.0627 | 0.1405 | 0.8938 |
| TEV | 0.0134 | 0.0379 | 0.9707 | 0.0242 | −0.0640 | 0.9507 | 0.6601 | 2.1523 | 0.0749 | 0.5358 | 1.4191 | 0.2151 |
| CR | 0.0338 | −0.0955 | 0.9262 | 0.4507 | −1.3356 | 0.2235 | 0.1833 | −0.4566 | 0.6640 | 0.2216 | 0.5082 | 0.6329 |
| DR | 0.2545 | 0.7443 | 0.4780 | 0.4913 | 1.4926 | 0.1792 | 0.7062 | 2.4433 | 0.0502 | 0.3271 | 0.7740 | 0.4739 |
| DER | 0.2209 | −0.6407 | 0.5396 | 0.4313 | −1.2648 | 0.2464 | 0.7885 | −3.1407 | 0.0201 | 0.4779 | −1.2164 | 0.2781 |
| ATR | 0.4514 | 1.4307 | 0.1904 | 0.4068 | 1.1782 | 0.2772 | 0.6531 | 2.1127 | 0.0791 | 0.3168 | 0.7468 | 0.4888 |
| ROA | 0.3790 | 1.1584 | 0.2801 | 0.5000 | 1.5274 | 0.1705 | 0.8137 | 3.4289 | 0.0140 | 0.5912 | 1.6390 | 0.1621 |
| ROE | 0.3721 | 1.1340 | 0.2896 | 0.4315 | 1.2656 | 0.2461 | 0.7732 | 2.9866 | 0.0244 | 0.5396 | 1.4331 | 0.2113 |
| EPS | 0.3205 | 0.9569 | 0.3666 | 0.3753 | −1.0713 | 0.3196 | 0.0459 | −0.1125 | 0.9141 | 0.5962 | 1.6605 | 0.1577 |
| PER | 0.2671 | −0.7841 | 0.4556 | 0.2696 | 0.7407 | 0.4829 | 0.8110 | 3.3957 | 0.0146 | 0.2202 | 0.5047 | 0.6352 |
Bold figures in p-value column indicate significant correlation at the 5% significance level.
Table A10.
Test Results for Real Estate Industry.
| Lag 0 | Lag 1 | Lag2 | Lag3 | |||||||||
|---|---|---|---|---|---|---|---|---|---|---|---|---|
| Correlation | t-Statistics | p-Value | Correlation | t-Statistics | p-Value | Correlation | t-Statistics | p-Value | Correlation | t-Statistics | p-Value | |
| Panel A: Number of M&A and 12 financial related values | ||||||||||||
| MC | 0.4164 | 1.2955 | 0.2313 | 0.7564 | 3.0593 | 0.0183 | 0.9676 | 9.3843 | 0.0001 | 0.8807 | 4.1582 | 0.0088 |
| EBIT | 0.6918 | 2.7099 | 0.0267 | 0.5585 | 1.7816 | 0.1180 | 0.3958 | 1.0557 | 0.3317 | 0.6829 | −2.0905 | 0.0908 |
| EBITDA | 0.7121 | 2.8686 | 0.0209 | 0.4976 | 1.5178 | 0.1728 | 0.3094 | 0.7971 | 0.4558 | 0.6336 | −1.8311 | 0.1266 |
| TEV | 0.3582 | 1.0851 | 0.3095 | 0.7330 | 2.8509 | 0.0247 | 0.9801 | 12.0944 | 0.0000 | 0.9386 | 6.0819 | 0.0017 |
| CR | 0.4697 | 1.5048 | 0.1708 | 0.7699 | 3.1920 | 0.0152 | 0.9747 | 10.6918 | 0.0000 | 0.9856 | 13.0346 | 0.0000 |
| DR | 0.6860 | −2.6665 | 0.0285 | 0.7239 | −2.7764 | 0.0274 | 0.6991 | −2.3949 | 0.0537 | 0.2202 | −0.5047 | 0.6352 |
| DER | 0.5013 | −1.6385 | 0.1400 | 0.3476 | −0.9809 | 0.3593 | 0.2520 | −0.6380 | 0.5470 | 0.1140 | 0.2566 | 0.8077 |
| ATR | 0.4563 | −1.4505 | 0.1850 | 0.0206 | −0.0545 | 0.9581 | 0.2207 | 0.5543 | 0.5994 | 0.1001 | −0.2250 | 0.8309 |
| ROA | 0.5416 | 1.8223 | 0.1059 | 0.7396 | 2.9075 | 0.0227 | 0.9007 | 5.0793 | 0.0023 | 0.8419 | 3.4885 | 0.0175 |
| ROE | 0.4364 | 1.3718 | 0.2073 | 0.5712 | 1.8411 | 0.1082 | 0.9380 | 6.6265 | 0.0006 | 0.8668 | 3.8876 | 0.0116 |
| EPS | 0.4123 | 1.2801 | 0.2364 | 0.5602 | 1.7895 | 0.1167 | 0.8800 | 4.5379 | 0.0039 | 0.9800 | 11.0179 | 0.0001 |
| PER | 0.3137 | −0.9344 | 0.3774 | 0.1357 | 0.3623 | 0.7278 | 0.4377 | 1.1924 | 0.2781 | 0.4053 | −0.9914 | 0.3670 |
| Panel B: Transaction value of M&A and 12 financial related values | ||||||||||||
| MC | 0.8427 | 4.4271 | 0.0022 | 0.8480 | 4.2328 | 0.0039 | 0.9530 | 7.7066 | 0.0003 | 0.8827 | 4.2001 | 0.0085 |
| EBIT | 0.6915 | 2.7078 | 0.0267 | 0.4358 | 1.2811 | 0.2410 | 0.4379 | 1.1931 | 0.2779 | 0.5908 | −1.6372 | 0.1625 |
| EBITDA | 0.6772 | 2.6029 | 0.0315 | 0.3283 | 0.9196 | 0.3884 | 0.3455 | 0.9019 | 0.4018 | 0.5354 | −1.4176 | 0.2155 |
| TEV | 0.8348 | 4.2887 | 0.0027 | 0.8884 | 5.1189 | 0.0014 | 0.9632 | 8.7732 | 0.0001 | 0.9256 | 5.4689 | 0.0028 |
| CR | 0.9004 | 5.8530 | 0.0004 | 0.9628 | 9.4269 | 0.0000 | 0.9570 | 8.0831 | 0.0002 | 0.9852 | 12.8616 | 0.0001 |
| DR | 0.8526 | −4.6156 | 0.0017 | 0.7869 | −3.3734 | 0.0119 | 0.7216 | −2.5534 | 0.0433 | 0.3259 | −0.7707 | 0.4757 |
| DER | 0.7395 | −3.1071 | 0.0145 | 0.5832 | −1.8994 | 0.0993 | 0.3371 | −0.8770 | 0.4142 | 0.0328 | 0.0734 | 0.9443 |
| ATR | 0.0971 | −0.2759 | 0.7896 | 0.2640 | 0.7241 | 0.4925 | 0.3314 | 0.8604 | 0.4226 | 0.0944 | −0.2120 | 0.8405 |
| ROA | 0.8997 | 5.8295 | 0.0004 | 0.8974 | 5.3800 | 0.0010 | 0.9348 | 6.4494 | 0.0007 | 0.8374 | 3.4261 | 0.0187 |
| ROE | 0.9032 | 5.9515 | 0.0003 | 0.8018 | 3.5493 | 0.0094 | 0.9660 | 9.1509 | 0.0001 | 0.8443 | 3.5236 | 0.0169 |
| EPS | 0.9434 | 8.0432 | 0.0000 | 0.8444 | 4.1709 | 0.0042 | 0.8493 | 3.9403 | 0.0076 | 0.9734 | 9.5074 | 0.0002 |
| PER | 0.5498 | −1.8618 | 0.0996 | 0.1811 | −0.4873 | 0.6410 | 0.4363 | 1.1878 | 0.2798 | 0.4373 | −1.0874 | 0.3265 |
Bold figures in p-value column indicate significant correlation at the 5% significance level.
Table A11.
Test Results for Utilities Industry.
| Lag 0 | Lag 1 | Lag2 | Lag3 | |||||||||
|---|---|---|---|---|---|---|---|---|---|---|---|---|
| Correlation | t-Statistics | p-Value | Correlation | t-Statistics | p-Value | Correlation | t-Statistics | p-Value | Correlation | t-Statistics | p-Value | |
| Panel A: Number of M&A and 12 financial related values | ||||||||||||
| MC | 0.5795 | 2.0113 | 0.0791 | 0.6150 | 2.0635 | 0.0780 | 0.7611 | 2.8738 | 0.0283 | 0.6352 | 1.8391 | 0.1253 |
| EBIT | 0.7804 | −3.5304 | 0.0077 | 0.8435 | −4.1546 | 0.0043 | 0.7805 | −3.0578 | 0.0223 | 0.7311 | −2.3958 | 0.0619 |
| EBITDA | 0.7864 | −3.6004 | 0.0070 | 0.8542 | −4.3467 | 0.0034 | 0.7936 | −3.1947 | 0.0187 | 0.7075 | −2.2387 | 0.0753 |
| TEV | 0.7340 | 3.0570 | 0.0157 | 0.7780 | 3.2767 | 0.0135 | 0.8647 | 4.2165 | 0.0056 | 0.7655 | 2.6603 | 0.0449 |
| CR | 0.4120 | 1.2791 | 0.2367 | 0.1818 | 0.4892 | 0.6397 | 0.1842 | 0.4591 | 0.6623 | 0.2791 | −0.6500 | 0.5444 |
| DR | 0.6287 | 2.2866 | 0.0515 | 0.5259 | 1.6358 | 0.1459 | 0.3630 | 0.9544 | 0.3768 | 0.2377 | 0.5472 | 0.6078 |
| DER | 0.5466 | −1.8463 | 0.1021 | 0.6918 | −2.5349 | 0.0390 | 0.5377 | −1.5623 | 0.1692 | 0.0643 | 0.1441 | 0.8911 |
| ATR | 0.3748 | −1.1433 | 0.2860 | 0.3596 | −1.0196 | 0.3418 | 0.5615 | −1.6619 | 0.1476 | 0.8988 | −4.5852 | 0.0059 |
| ROA | 0.7110 | 2.8595 | 0.0212 | 0.7662 | 3.1542 | 0.0161 | 0.7642 | 2.9020 | 0.0273 | 0.0204 | 0.0457 | 0.9653 |
| ROE | 0.5470 | 1.8480 | 0.1018 | 0.7264 | 2.7965 | 0.0267 | 0.6845 | 2.3001 | 0.0611 | 0.0326 | 0.0729 | 0.9447 |
| EPS | 0.9076 | −6.1161 | 0.0003 | 0.8240 | −3.8482 | 0.0063 | 0.6788 | −2.2643 | 0.0642 | 0.8640 | −3.8379 | 0.0121 |
| PER | 0.1724 | 0.4950 | 0.6339 | 0.3313 | 0.9291 | 0.3837 | 0.5216 | 1.4975 | 0.1849 | 0.0596 | 0.1335 | 0.8990 |
| Panel B: Transaction value of M&A and 12 financial related values | ||||||||||||
| MC | 0.0712 | −0.2019 | 0.8451 | 0.1959 | −0.5286 | 0.6134 | 0.1242 | 0.3066 | 0.7695 | 0.3707 | 0.8925 | 0.4130 |
| EBIT | 0.2565 | −0.7507 | 0.4743 | 0.5623 | −1.7993 | 0.1150 | 0.5263 | −1.5160 | 0.1803 | 0.5673 | −1.5404 | 0.1841 |
| EBITDA | 0.2441 | −0.7120 | 0.4967 | 0.5612 | −1.7939 | 0.1159 | 0.4990 | −1.4104 | 0.2081 | 0.1219 | −0.2746 | 0.7946 |
| TEV | 0.1096 | 0.3118 | 0.7631 | 0.0323 | −0.0855 | 0.9342 | 0.1905 | 0.4754 | 0.6513 | 0.3180 | 0.7500 | 0.4870 |
| CR | 0.5363 | 1.7970 | 0.1101 | 0.6158 | 2.0676 | 0.0775 | 0.0033 | 0.0082 | 0.9938 | 0.5381 | −1.4276 | 0.2128 |
| DR | 0.6795 | 2.6193 | 0.0307 | 0.5855 | 1.9108 | 0.0976 | 0.3205 | 0.8286 | 0.4390 | 0.0319 | 0.0715 | 0.9458 |
| DER | 0.3543 | −1.0715 | 0.3152 | 0.6091 | −2.0319 | 0.0817 | 0.1511 | −0.3743 | 0.7210 | 0.5703 | 1.5524 | 0.1813 |
| ATR | 0.1080 | −0.3071 | 0.7666 | 0.5268 | 1.6399 | 0.1450 | 0.1255 | 0.3100 | 0.7671 | 0.3460 | −0.8245 | 0.4472 |
| ROA | 0.2992 | 0.8870 | 0.4010 | 0.5395 | 1.6951 | 0.1339 | 0.3461 | 0.9036 | 0.4010 | 0.6277 | −1.8032 | 0.1312 |
| ROE | 0.3617 | 1.0972 | 0.3045 | 0.6735 | 2.4105 | 0.0467 | 0.3211 | 0.8304 | 0.4381 | 0.4400 | −1.0956 | 0.3232 |
| EPS | 0.4581 | −1.4575 | 0.1831 | 0.2029 | −0.5483 | 0.6006 | 0.0164 | 0.0402 | 0.9692 | 0.4267 | −1.0549 | 0.3398 |
| PER | 0.4974 | −1.6216 | 0.1435 | 0.1016 | −0.2703 | 0.7947 | 0.1094 | 0.2696 | 0.7965 | 0.3472 | 0.8277 | 0.4455 |
Bold figures in p-value column indicate significant correlation at the 5% significance level.
References
- Zollo, M.; Meier, D. What Is M&A Performance? Acad. Manag. Perspect. 2008, 22, 55–77. [Google Scholar] [CrossRef]
- Aaldering, L.J.; Leker, J.; Song, C.H. Uncovering the dynamics of market convergence through M&A. Technol. Forecast. Soc. Chang. 2019, 138, 95–114. [Google Scholar] [CrossRef]
- Garzella, S.; Fiorentino, R. A synergy measurement model to support the pre-deal decision making in mergers and acquisitions. Manag. Decis. 2014, 52, 1194–1216. [Google Scholar] [CrossRef]
- Bower, J.L. Not All M&As Are Alike—And That Matters—HBS Working Knowledge; Harvard Business School: Boston, MA, USA, 2001. [Google Scholar]
- Cassiman, B.; Colombo, M.G.; Garrone, P.; Veugelers, R. The impact of M&A on the R&D process: An empirical analysis of the role of technological- and market-relatedness. Res. Policy 2005, 34, 195–220. [Google Scholar] [CrossRef]
- Cefis, E. The impact of M&A on technology sourcing strategies. Econ. Innov. New Technol. 2010, 19, 27–51. [Google Scholar] [CrossRef] [Green Version]
- Hagedoorn, J.; Duysters, G. The effect of mergers and acquisitions on the technological performance of companies in a high-tech environment. Technol. Anal. Strateg. Manag. 2002, 14, 67–85. [Google Scholar] [CrossRef]
- Rahman, M.; Lambkin, M. Creating or destroying value through mergers and acquisitions: A marketing perspective. Ind. Mark. Manag. 2015, 46, 24–35. [Google Scholar] [CrossRef] [Green Version]
- Laabs, J.P.; Schiereck, D. The long-term success of M&A in the automotive supply industry: Determinants of capital market performance. J. Econ. Financ. 2010, 34, 61–88. [Google Scholar] [CrossRef]
- Madura, J.; Ngo, T.; Viale, A.M. Why do merger premiums vary across industries and over time? Q. Rev. Econ. Financ. 2012, 52, 49–62. [Google Scholar] [CrossRef]
- Zhang, W.; Wang, K.; Li, L.; Chen, Y.; Wang, X. The impact of firms’ mergers and acquisitions on their performance in emerging economies. Technol. Forecast. Soc. Chang. 2018, 135, 208–216. [Google Scholar] [CrossRef]
- Mentz, M.; Schiereck, D. Cross-border mergers and teh cross-border TEMPeffect: The case of teh automotive supply industry. Rev. Manag. Sci. 2008, 2, 199–218. [Google Scholar] [CrossRef]
- Nicholson, R.R.; Salaber, J. The motives and performance of cross-border acquirers from emerging economies: Comparison between Chinese and Indian firms. Int. Bus. Rev. 2013, 22, 963–980. [Google Scholar] [CrossRef]
- Aktas, N.; de Bodt, E.; Roll, R. Learning, hubris and corporate serial acquisitions. J. Corp. Financ. 2009, 15, 543–561. [Google Scholar] [CrossRef] [Green Version]
- Martynova, M.; Renneboog, L. A century of corporate takeovers: What have we learned and where do we stand? J. Bank. Financ. 2008, 32, 2148–2177. [Google Scholar] [CrossRef]
- McNamara, G.M.; Haleblian, J.; Dykes, B.J. The performance implications of participating in an acquisition wave: Early mover advantages, bandwagon effects, and the moderating influence of industry characteristics and acquirer tactics. Acad. Manag. J. 2008, 51, 113–130. [Google Scholar] [CrossRef] [Green Version]
- Tuch, C.; O’Sullivan, N. The impact of acquisitions on firm performance: A review of the evidence. Int. J. Manag. Rev. 2007, 9, 141–170. [Google Scholar] [CrossRef]
- Mariani, G.; Dzepava, K.; Panaro, D. Corporate acquisition: A value strategy during the period of crisis. A comparison between Italian and UK companies. Corp. Ownersh. Control 2015, 13, 1430–1439. [Google Scholar] [CrossRef]
- Meglio, O.; Risberg, A. Mergers and acquisitions-Time for a methodological rejuvenation of the field? Scand. J. Manag. 2010, 26, 87–95. [Google Scholar] [CrossRef]
- Gates, S.; Very, P. Measuring performance during M&A integration. Long Range Plan. 2003, 36, 167–185. [Google Scholar] [CrossRef]
- Platt, E.; Fontanella-Khan, J.; Noonan, L.; Massoudi, A. Global Dealmaking Grinds to Slowest Pace in Two Years. Available online: https://www.ft.com/content/68aa3d40-e2ce-11e9-b112-9624ec9edc59 (accessed on 24 April 2020).
- Prentice, P. Mergers and Acquisitions Benefit the Economy and Americans. Available online: https://www.insidesources.com/mergers-and-acquisitions-benefit-the-economy-and-american (accessed on 24 April 2020).
- Tamosiuniene, R.; Duksaite, E. The Importance of Mergers and Acquisitions in Today’s Economy. J. KSI 2009, 4, 11–16. [Google Scholar] [CrossRef]
- Nadkarni, S.; Narayanan, V.K. Strategic schemas, strategic flexibility, and firm performance: The moderating role of industry clockspeed. Strateg. Manag. J. 2007, 28, 243–270. [Google Scholar] [CrossRef]
- Pot, W.D.; Dewulf, A.; Biesbroek, G.R.; Van der Vlist, M.J.; Termeer, C.J.A.M. What makes long-term investment decisions forward looking: A framework applied to the case of Amsterdam’s new sea lock. Technol. Forecast. Soc. Chang. 2018, 132, 174–190. [Google Scholar] [CrossRef]
- Agrawal, A.; Jaffe, J.F. The post-merger performance puzzle. In Advances in Mergers and Acquisitions; Emerald Group Publishing Limited: Bingley, UK, 2000; Volume 1, pp. 7–41. ISBN 978-0-76230-683-1/1479-361X. [Google Scholar]
- Seth, A. Sources of value creation in acquisitions: An empirical investigation. Strateg. Manag. J. 1990, 11, 431–446. [Google Scholar] [CrossRef]
- Savor, P.G.; Lu, Q. Do stock mergers create value for acquirers? J. Financ. 2009, 64, 1061–1097. [Google Scholar] [CrossRef]
- Moeller, S.B.; Schlingemann, F.P.; Stulz, R.M. Firm size and the gains from acquisitions. J. Financ. Econ. 2004, 73, 201–228. [Google Scholar] [CrossRef]
- Kane, E.J. Incentives for Banking Megamergers: What Motives Might Regulators Infer from Event- Study Evidence? J. Money Credit Bank. 2000, 32, 671–701. [Google Scholar] [CrossRef]
- Chiarello, F.; Trivelli, L.; Bonaccorsi, A.; Fantoni, G. Extracting and mapping industry 4.0 technologies using wikipedia. Comput. Ind. 2018, 100, 244–257. [Google Scholar] [CrossRef]
- Kim, N.; Lee, H.; Kim, W.; Lee, H.; Suh, J.H. Dynamic patterns of industry convergence: Evidence from a large amount of unstructured data. Res. Policy 2015, 44, 1734–1748. [Google Scholar] [CrossRef]
- Zhou, Y.; Dong, F.; Kong, D.; Liu, Y. Unfolding the convergence process of scientific knowledge for the early identification of emerging technologies. Technol. Forecast. Soc. Chang. 2019, 144, 205–220. [Google Scholar] [CrossRef]
- Cozzens, S.; Gatchair, S.; Kang, J.; Kim, K.S.; Lee, H.J.; Ordóñez, G.; Porter, A. Emerging technologies: Quantitative identification and measurement. Technol. Anal. Strateg. Manag. 2010, 22, 361–376. [Google Scholar] [CrossRef]
- Signori, A.; Vismara, S. M&A synergies and trends in IPOs. Technol. Forecast. Soc. Chang. 2018, 127, 141–153. [Google Scholar] [CrossRef]
- Lemieux, O.P.; Banks, J.C. High tech M&A—Strategic valuation. Manag. Decis. 2007, 45, 1412–1425. [Google Scholar] [CrossRef]
- Trichterborn, A.; Zu Knyphausen-Aufseß, D.; Schweizer, L. How to improve acquisition performance: The role of a dedicated M&A function, M&A learning process, and M&A capability. Strateg. Manag. J. 2016, 37, 763–773. [Google Scholar] [CrossRef]
- Schoenberg, R. Measuring the Performance of Corporate Acquisitions: An Empirical Comparison of Alternative Metrics. Br. J. Manag. 2006, 17, 361–370. [Google Scholar] [CrossRef] [Green Version]
- Yaghoubi, R.; Locke, S.; Gibb, J. Acquisition returns: Does industry matter? Stud. Econ. Financ. 2014, 31, 309–324. [Google Scholar] [CrossRef] [Green Version]
- Henningsson, S.; Carlsson, S. The DySIIM model for managing IS integration in mergers and acquisitions. Inf. Syst. J. 2011, 21, 441–476. [Google Scholar] [CrossRef]
- Lin, C.Y.; Lee, H.T. The bigger the better? Merger and acquisition performance of financial holding corporations: Empirical evidence from Taiwan. Emerg. Mark. Financ. Trade 2010, 46, 96–107. [Google Scholar] [CrossRef]
Figure 1.
Overview of number of significant financial relationship values by industries. (A) shows financial relationship with number of M&A activities and (B) shows financial relationship with transaction values of M&A.
Figure 1.
Overview of number of significant financial relationship values by industries. (A) shows financial relationship with number of M&A activities and (B) shows financial relationship with transaction values of M&A.

Figure 2.
Changes in the financial relationship level by time lag differences. (A) shows financial relationship with number of M&A activities and (B) shows financial relationship with transaction values of M&A.
Figure 2.
Changes in the financial relationship level by time lag differences. (A) shows financial relationship with number of M&A activities and (B) shows financial relationship with transaction values of M&A.

Table 1.
Sample distribution. Total number of firms by industry ζi*.
| Year | ζ1 | ζ2 | ζ3 | ζ4 | ζ5 | ζ6 | ζ7 | ζ8 | ζ9 | ζ10 | ζ11 |
|---|---|---|---|---|---|---|---|---|---|---|---|
| 2009–2018 | 158,176 | 624,786 | 237,333 | 74,753 | 778,471 | 175,620 | 834,386 | 249,154 | 220,611 | 231,244 | 46,761 |
*i = 1: Communication; 2: Consumer Discretionary; 3: Consumer Staples; 4: Energy; 5: Financial; 6: Healthcare; 7: Industrial; 8: Information Technology; 9: Materials; 10: Real Estate; 11: Utilities.
Table 2.
Sample distribution. Number of mergers and acquisitions (M&As) by industry ζi*.
| Year | ζ1 (%)** | ζ2 (%) | ζ3 (%) | ζ4 (%) | ζ5 (%) | ζ6 (%) | ζ7 (%) | ζ8 (%) | ζ9 (%) | ζ10 (%) | ζ11 (%) |
|---|---|---|---|---|---|---|---|---|---|---|---|
| 2009 | 2716 | 4535 | 1786 | 1680 | 2887 | 2008 | 6129 | 3427 | 2902 | 4416 | 913 |
| (1.72) | (0.73) | (0.75) | (2.25) | (0.37) | (1.15) | (0.73) | (1.38) | (1.32) | (1.91) | (1.95) | |
| 2010 | 3298 | 5651 | 2215 | 2139 | 3332 | 2800 | 7549 | 4186 | 3677 | 7171 | 1033 |
| (2.09) | (0.90) | (0.93) | (2.86) | (0.43) | (1.60) | (0.90) | (1.68) | (1.67) | (3.10) | (2.21) | |
| 2011 | 3536 | 6361 | 2435 | 2154 | 3273 | 2946 | 8494 | 4540 | 3755 | 8914 | 1133 |
| (2.24) | (1.02) | (1.02) | (2.88) | (0.42) | (1.69) | (1.02) | (1.82) | (1.70) | (3.85) | (2.42) | |
| 2012 | 3486 | 6119 | 2418 | 2057 | 3294 | 2922 | 8278 | 4409 | 3439 | 9839 | 1111 |
| (2.20) | (0.98) | (1.02) | (2.75) | (0.42) | (1.67) | (0.99) | (1.77) | (1.56) | (4.25) | (2.38) | |
| 2013 | 3085 | 5748 | 2198 | 1713 | 3134 | 2884 | 7655 | 4299 | 2829 | 11,251 | 1143 |
| (1.95) | (0.92) | (0.93) | (2.29) | (0.40) | (1.65) | (0.92) | (1.73) | (1.28) | (4.87) | (2.44) | |
| 2014 | 3574 | 6201 | 2352 | 1830 | 3529 | 3273 | 8059 | 5051 | 3120 | 12,690 | 1129 |
| (2.26) | (0.99) | (0.99) | (2.45) | (0.45) | (1.87) | (0.97) | (2.03) | (1.41) | (5.49) | (2.41) | |
| 2015 | 3814 | 6476 | 2487 | 1475 | 3709 | 3644 | 8680 | 5495 | 3250 | 13,604 | 1233 |
| (2.41) | (1.04) | (1.05) | (1.97) | (0.48) | (2.09) | (1.04) | (2.21) | (1.47) | (5.88) | (2.64) | |
| 2016 | 3452 | 6051 | 2535 | 1368 | 3401 | 3418 | 8287 | 5457 | 3305 | 12,470 | 1260 |
| (2.18) | (0.97) | (1.07) | (1.83) | (0.44) | (1.96) | (0.99) | (2.19) | (1.50) | (5.39) | (2.69) | |
| 2017 | 3379 | 5839 | 2625 | 1446 | 3665 | 3430 | 8226 | 5487 | 3392 | 7728 | 1293 |
| (2.14) | (0.93) | (1.11) | (1.93) | (0.47) | (1.96) | (0.99) | (2.20) | (1.54) | (3.34) | (2.77) | |
| 2018 | 3149 | 5751 | 2365 | 1386 | 3487 | 3467 | 8644 | 5612 | 3083 | 7262 | 1337 |
| (1.99) | (0.92) | (1.00) | (1.85) | (0.45) | (1.99) | (1.04) | (2.25) | (1.40) | (3.14) | (2.86) | |
| Average | 3349 | 5873 | 2342 | 1725 | 3371 | 3079 | 8000 | 4796 | 3275 | 9535 | 1159 |
| (2.12) | (0.94) | (0.99) | (2.31) | (0.43) | (1.76) | (0.99) | (1.93) | (1.48) | (4.12) | (2.48) | |
| Standard Deviation | 306 | 545 | 236 | 309 | 247 | 477 | 757 | 734 | 304 | 2958 | 127 |
| (0.19) | (0.09) | (0.10) | (0.41) | (0.03) | (0.27) | (0.09) | (0.29) | (0.14) | (1.28) | (0.27) |
*i = 1: Communication; 2: Consumer Discretionary; 3: Consumer Staples; 4: Energy; 5: Financial; 6: Healthcare; 7: Industrial; 8: Information Technology; 9: Materials; 10: Real Estate; 11: Utilities.** Proportion is obtained by number of M&As / total number of firms.
Table 3.
Sample distribution. Transaction value of M&A by industry ζi* (USD Million).
| Year | ζ1 (%)** | ζ2 (%) | ζ3 (%) | ζ4 (%) | ζ5 (%) | ζ6 (%) | ζ7 (%) | ζ8 (%) | ζ9 (%) | ζ10 (%) | ζ11 (%) |
|---|---|---|---|---|---|---|---|---|---|---|---|
| 2009 | 29,386 | 39,675 | 28,693 | 34,465 | 54,652 | 25,889 | 54,426 | 28,005 | 18,828 | 85,369 | 35,369 |
| (0.26) | (0.09) | (0.11) | (0.47) | (0.14) | (0.20) | (0.07) | (0.22) | (0.15) | (0.23) | (0.13) | |
| 2010 | 39,928 | 64,959 | 41,507 | 58,435 | 93,733 | 48,308 | 98,797 | 48,406 | 30,333 | 162,766 | 41,687 |
| (0.03) | (0.01) | (0.01) | (0.06) | (0.02) | (0.03) | (0.01) | (0.03) | (0.02) | (0.04) | (0.02) | |
| 2011 | 46,965 | 91,350 | 48,705 | 55,660 | 80,058 | 63,743 | 121,559 | 59,566 | 34,615 | 197,644 | 55,336 |
| (0.37) | (0.18) | (0.18) | (0.62) | (0.09) | (0.50) | (0.17) | (0.44) | (0.26) | (0.60) | (0.24) | |
| 2012 | 47,527 | 80,274 | 43,491 | 71,295 | 87,142 | 66,456 | 110,358 | 58,875 | 30,038 | 197,262 | 42,780 |
| (0.31) | (0.14) | (0.14) | (0.77) | (0.08) | (0.42) | (0.13) | (0.37) | (0.22) | (0.44) | (0.17) | |
| 2013 | 54,990 | 81,493 | 36,453 | 51,024 | 92,219 | 61,764 | 105,327 | 49,775 | 25,829 | 228,350 | 42,323 |
| (0.24) | (0.11) | (0.11) | (0.45) | (0.07) | (0.28) | (0.10) | (0.23) | (0.20) | (0.43) | (0.15) | |
| 2014 | 63,642 | 99,291 | 48,812 | 82,809 | 113,439 | 68,381 | 117,471 | 73,112 | 35,517 | 264,994 | 41,462 |
| (0.28) | (0.13) | (0.14) | (0.83) | (0.08) | (0.28) | (0.11) | (0.34) | (0.27) | (0.45) | (0.13) | |
| 2015 | 52,617 | 113,681 | 52,507 | 48,796 | 104,133 | 101,902 | 133,816 | 85,787 | 38,225 | 284,548 | 41,824 |
| (0.22) | (0.14) | (0.14) | (0.62) | (0.08) | (0.39) | (0.11) | (0.38) | (0.29) | (0.48) | (0.13) | |
| 2016 | 52,102 | 115,229 | 45,551 | 78,557 | 96,533 | 79,438 | 132,712 | 76,809 | 31,074 | 271,380 | 43,574 |
| (0.22) | (0.13) | (0.12) | (0.72) | (0.07) | (0.32) | (0.10) | (0.33) | (0.19) | (0.44) | (0.13) | |
| 2017 | 39,761 | 111,155 | 54,038 | 53,190 | 112,867 | 66,319 | 132,615 | 90,264 | 24,734 | 273,299 | 48,594 |
| (0.15) | (0.11) | (0.12) | (0.44) | (0.07) | (0.24) | (0.08) | (0.28) | (0.12) | (0.38) | (0.13) | |
| 2018 | 54,119 | 131,740 | 47,050 | 64,358 | 141,533 | 72,834 | 160,625 | 95,247 | 32,568 | 277,884 | 59,247 |
| (0.25) | (0.16) | (0.13) | (0.64) | (0.10) | (0.31) | (0.13) | (0.37) | (0.18) | (0.45) | (0.20) | |
| Average | 48,104 | 92,885 | 44,681 | 59,859 | 97,631 | 65,504 | 116,771 | 66,585 | 30,176 | 224,350 | 45,220 |
| (0.25) | (0.13) | (0.13) | (0.61) | (0.09) | (0.32) | (0.11) | (0.33) | (0.20) | (0.43) | (0.15) | |
| Standard Deviation | 9717 | 27,322 | 7625 | 14,670 | 23,006 | 19,621 | 28,135 | 21,365 | 5743 | 64,395 | 7170 |
| (0.18) | (0.14) | (0.14) | (0.99) | (0.06) | (0.33) | (0.10) | (0.36) | (0.21) | (0.50) | (0.17) |
*i = 1: Communication; 2: Consumer Discretionary; 3: Consumer Staples; 4: Energy; 5: Financial; 6: Healthcare; 7: Industrial; 8: Information Technology; 9: Materials; 10: Real Estate; 11: Utilities. ** Proportion is obtained by number of M&As / total number of firms.
Table 4.
Number of financial values significantly correlated to the M&A activities with increment direction in brackets*.
Table 4.
Number of financial values significantly correlated to the M&A activities with increment direction in brackets*.
| Industries | Panel A | Panel B | ||||||
|---|---|---|---|---|---|---|---|---|
| Lag0 | Lag1 | Lag2 | Lag3 | Lag0 | Lag1 | Lag2 | Lag3 | |
| ζ1: Communication Services | 0 | 4 (+) | 8 (+) | 1 (‒) | 5 | 8 (+) | 9 (+) | 6 (‒) |
| ζ2: Consumer Discretionary | 3 | 6 (+) | 10 (+) | 0 (‒) | 9 | 9 (◌) | 10 (+) | 2 (‒) |
| ζ3: Consumer Staples | 6 | 5 (‒) | 6 (+) | 0 (‒) | 0 | 3 (+) | 5 (+) | 0 (‒) |
| ζ4: Energy | 5 | 1 (‒) | 0 (‒) | 0 (◌) | 0 | 0 (◌) | 0 (◌) | 0 (◌) |
| ζ5: Financial | 8 | 5 (‒) | 7 (+) | 4 (‒) | 9 | 5 (‒) | 6 (+) | 4 (‒) |
| ζ6: Healthcare | 10 | 9 (‒) | 9 (◌) | 5 (‒) | 9 | 9 (◌) | 9 (◌) | 6 (‒) |
| ζ7: Industrial | 5 | 6 (+) | 8 (+) | 0 (‒) | 9 | 7 (‒) | 9 (+) | 1 (‒) |
| ζ8: Information Technology | 7 | 8 (+) | 7 (‒) | 4 (‒) | 6 | 6 (◌) | 7 (+) | 4 (‒) |
| ζ9: Materials | 2 | 0 (‒) | 0 (◌) | 1 (+) | 0 | 0 (◌) | 4 (+) | 0 (‒) |
| ζ10: Real Estate | 3 | 5 (+) | 6 (+) | 6 (◌) | 10 | 7 (‒) | 7 (◌) | 6 (‒) |
| ζ11: Utilities | 5 | 7 (+) | 5 (‒) | 3 (‒) | 1 | 1 (◌) | 0 (‒) | 0 (◌) |
| (Min.; Max.) | (0; 10) | (0; 9) | (0; 10) | (0; 6) | (0; 10) | (0; 9) | (0; 10) | (0; 6) |
| Avg. | 4.91 | 5.09 | 6.00 | 2.18 | 5.27 | 5.00 | 6.00 | 2.64 |
*+ = positive, ‒ = negative, and ◌ = no change in the number of financial values with significant relationship.
Table 5.
Industry classification based on the empirical results.
| Class | Significance Level of Relationship with Financial Values | Industries |
|---|---|---|
| Class 1 | Similar significance of M&A frequency and transaction value | Financial, Healthcare, Information Technology |
| Class 2 | M&A frequency > M&A transaction value | Consumer Staples, Utility |
| Class 3 | M&A frequency < M&A transaction value | Communication Services, Consumer Discretionary, Industrial, Real Estate |
| Class 4 | Weak significance of M&A frequency and transaction value | Energy, Materials |
© 2020 by the authors. Licensee MDPI, Basel, Switzerland. This article is an open access article distributed under the terms and conditions of the Creative Commons Attribution (CC BY) license (http://creativecommons.org/licenses/by/4.0/).
Share and Cite
MDPI and ACS Style
Choi, J.; Shin, N.; Lee, H.S. Exploring the Dynamics between M&A Activities and Industry-Level Performance. Sustainability 2020, 12, 4399. https://0-doi-org.brum.beds.ac.uk/10.3390/su12114399
AMA Style
Choi J, Shin N, Lee HS. Exploring the Dynamics between M&A Activities and Industry-Level Performance. Sustainability. 2020; 12(11):4399. https://0-doi-org.brum.beds.ac.uk/10.3390/su12114399
Chicago/Turabian StyleChoi, Jinho, Nina Shin, and Hee Soo Lee. 2020. "Exploring the Dynamics between M&A Activities and Industry-Level Performance" Sustainability 12, no. 11: 4399. https://0-doi-org.brum.beds.ac.uk/10.3390/su12114399
Note that from the first issue of 2016, this journal uses article numbers instead of page numbers. See further details here.