Article

Selection of Winter Season Crop Pattern for Environmental-Friendly Agricultural Practices in India

by
Veerasekar Palaniappan Sambasivam
1,
Gowtham Thiyagarajan
1,
Golam Kabir
1,*,
Syed Mithun Ali
2,
Syed Abdul Rehman Khan
3,* and
Zhang Yu
4
1
Industrial Systems Engineering, Faculty of Engineering and Applied Sciences, University of Regina, 3737 Wascana Pkwy, Regina, SK S4S 0A2, Canada
2
Department of Industrial and Production Engineering, Bangladesh University of Engineering and Technology, Dhaka 1000, Bangladesh
3
School of Economics and Management, Tsinghua University, Beijing 100084, China
4
School of Economics and Management, Chang’an University, Xi’an 710064, China
*
Authors to whom correspondence should be addressed.
Sustainability 2020, 12(11), 4562; https://0-doi-org.brum.beds.ac.uk/10.3390/su12114562
Submission received: 11 April 2020 / Revised: 22 May 2020 / Accepted: 25 May 2020 / Published: 3 June 2020

Abstract

:
Owing to the sudden changes in climatic conditions, monsoon failure, and scarce availability of resources because of population hike, yielding a minimum profit has become a challenge for Indian farmers. This is a severe problem for India, as a major part of the Nation’s Gross Domestic Product (GDP) depends on agriculture. To change this dreadful situation, Indian farmers must employ sustainable agricultural practices in farming, as it will help them to meet their agricultural needs and economic stability. Here, we have built a framework for selecting the ideal crop pattern for Winter Cropping Season (Rabi Season), as crop pattern plays a vital role in the effective function of sustainable agricultural practices. We have used the rough AHP-TOPSIS (Analytical Hierarchy Process-Technique for Order Preference by Similarity to Ideal Solution) method for finding the best crop pattern for the Rabi season, by considering all the influential criteria in terms of agriculture sustainability. Our study demonstrates an overall idea to the farmers and stakeholders about attaining maximum crop productivity with optimum use of available resources, without compromising the economic, social, and ecological aspects of agriculture.

1. Introduction

The population of India is increasing at an alarming rate, which is creating a burden on the agricultural industry [1,2,3]. It is noted by Worldometers (an institution owned by Dadax) that the population increased continuously to over 1.32 billion by the end of 2019. This poses enormous challenges to the government to match the food needs with the population. In addition, according to the data collected by the National Crime Records Bureau (NCRB), a government organization responsible for collecting and analyzing crime data, said that 11,458 farmers committed suicide in distress due to crop failure, monsoon failure, loan debt problems, etc. during the year 2016 [4,5]. Agriculture is said to be the backbone of India, as its contribution to the country’s Gross Domestic Product (GDP) is huge, and over half of the total Indian population depends on agriculture for a living. This unfavorable situation will collapse the Indian economy, and the country’s overall development will also decline [5]. To overcome all these issues, Indian farmers should follow sustainable farming practices to increase agricultural efficiency. Sustainable agriculture is a model that considers all the economic, social, and environmental factors related to farming that produces only the positive outcomes by using and circulating optimum available resources [6].
The success of sustainable agriculture is defined by the selection of the right crop pattern for the right place at the right time by considering all the sustainable factors [7]. As the factors involving in sustainable farming practices are very complex, it will be a huge challenge for one to select the right crop pattern [8]. A crop pattern could be, for example, one of three types of cropping, which are single cropping, mixed cropping, and intercropping. In single cropping, only one crop is cultivated at a time. In mixed and intercropping, multiple crops are grown in the field at a time [8]. In this study, we have considered only a single cropping pattern.
This study aims at identifying the best crop pattern of one of the three cropping seasons, which is Rabi season crops. It is the major cropping season, which is sown in winter (November) and harvested in spring (March or April). The other two cropping seasons are Kharif and Zaid crops [8]. The Kharif crops are cultivated between June to September, and the Zaid crop is from March to July. According to the survey by the 70th round of the National Sample Survey Organization (NSSO)’s findings of the year 2015–2016, the micro and macro level of benefits of agriculture would be more if the focus was given to Rabi season crops. The report of the survey also depicts that Rabi crop contributed 50.83% in total food grain production of the country as opposed to only 49.16% by Kharif crops, even though it used 22.4% more land area than the Rabi season crops. So, studying the sustainability of Rabi season crops is more important compared to others while considering the overall benefits.
By considering the challenges that are involved in the selection of a crop pattern in terms of three-dimensional (economic, social, environmental) aspects of agriculture sustainability, this study aims:
(a)
To formulate a comprehensive framework that covers all the major criteria involved in the selection of ideal crop patterns for Rabi season crops in terms of sustainable agricultural practices, and
(b)
to provide rough set modeling for the selection of Rabi season crops based on sustainable farming practices.
The structure of this paper is as follows. The relevant literature review is described in Section 2. Section 3 illustrates the research methodology. The developed framework for the concerned study is explained in Section 4. The results of this study are discussed in the following section. Conclusions and recommendations for further study are given in Section 5.

2. Literature Review
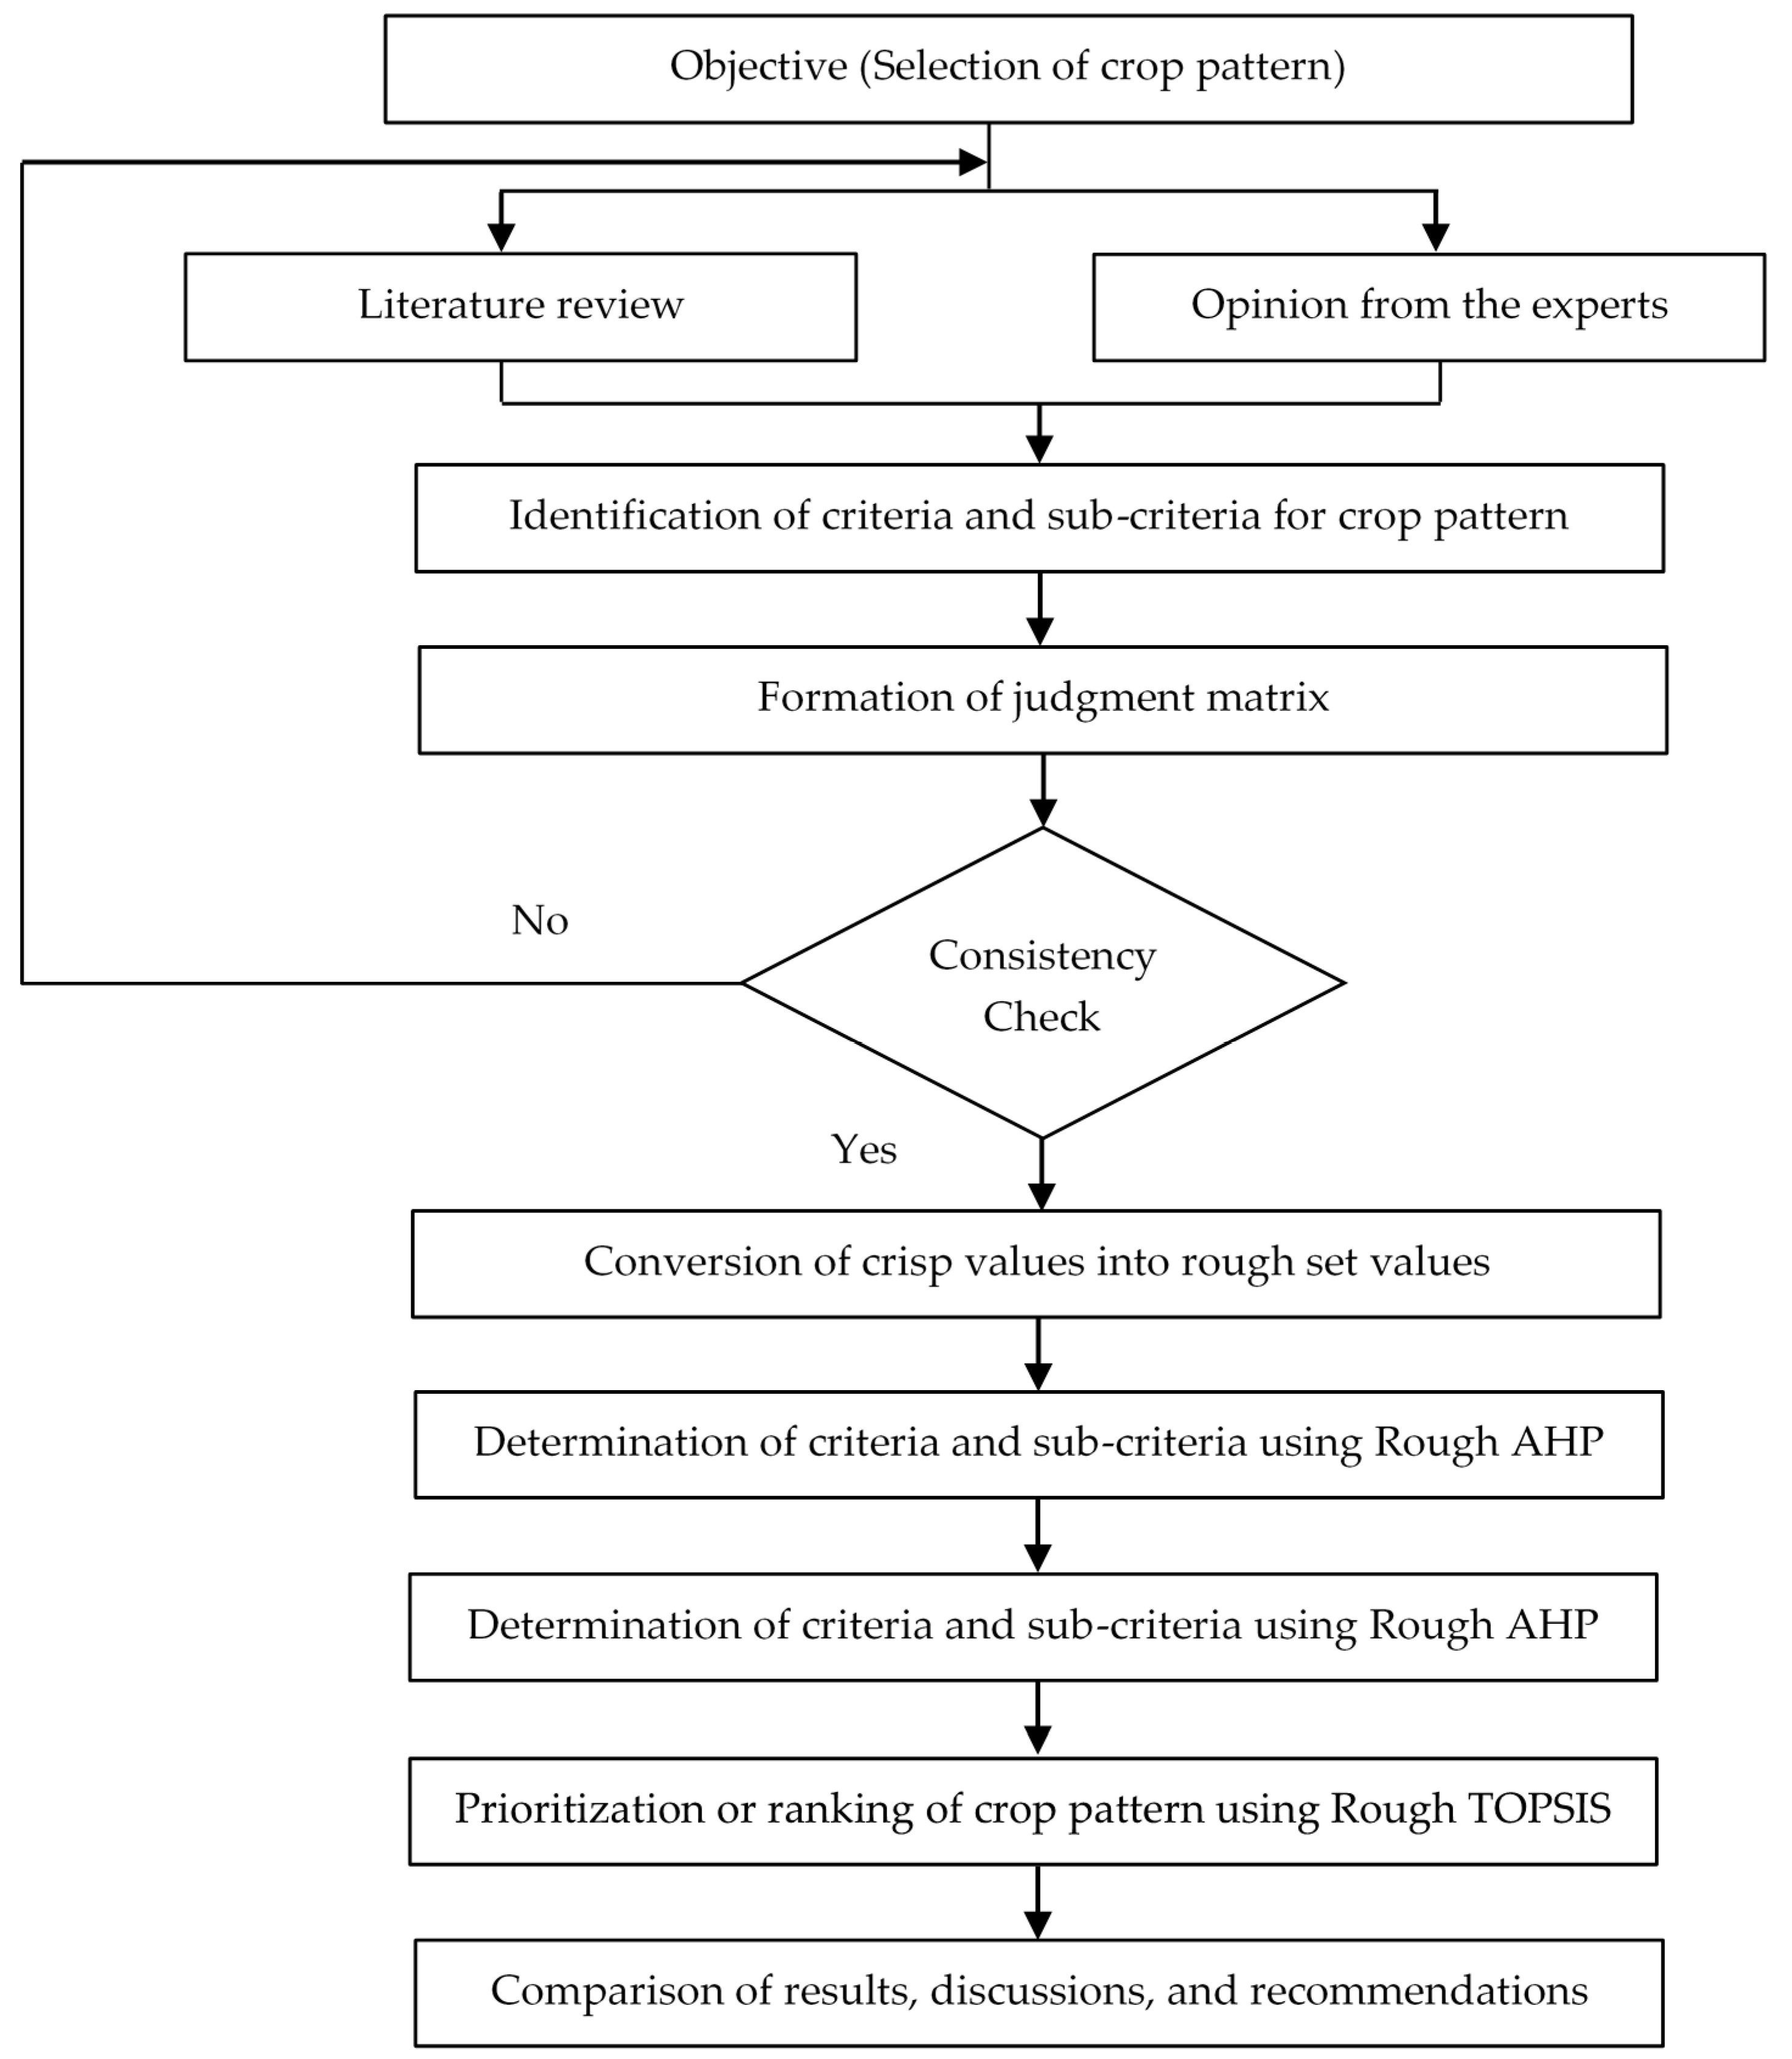
Many studies and investigations have been done to formulate frameworks for sustainable agriculture practices to maximize benefits from agriculture sectors. This study is based on the Web of Science (WOS) web database and Science Citation Index Expanded (SCIE). WOS is a premier worldwide database which contains more than 12,000 authoritative and high-impact academic journals. The retrieval mode of this study is mainly determined by two retrieval terms, sustainable agriculture in India and crop pattern. The content of the search is TS = (sustainable agriculture in India or crop pattern) AND (sustainable agriculture AND crop pattern) AND (crop pattern selection). The retrieval time range is from 1995 to 2019. In this section, some of the significant studies for this study are discussed.
For instance, Adewale et al. [9] studied the adoption of sustainable agriculture practices by farmers of Iowa, USA, on considering its positive impact on overall profit. Chandre et al. [10] formulated a mathematical model to measure the Agriculture Sustainability Index (ASI) considering the nine factors which affect sustainability. Identically, Nambiar et al. [11] also measured the ASI in Chinese coastal zones by including the biophysical, chemical, and socio-economic indicators. Zhen et al. [12] assessed the three dimensions of agricultural sustainability by employing the threshold value of the indicators in the Northern China Plane (NCP). Sydorovych and Wossink [13] had used the conjoint decisions of both the scientists and farmers to aggregate sustainability effectively. An agricultural experimentation study by Halbrendt et al. [14] in the tribal societies of Odisha was conducted with conservative methods. As a result, the highest yield of maize–cowpea was obtained while it followed the intercropping pattern.
Yadav et al. [15] compared conventional and organic farming and identified organic farming as a way of attaining agricultural sustainability. Demartini et al. [16] employed rough set theory for formulating the geo-referenced framework for assessing agriculture sustainability aimed at helping in the planning. Nageswararao et al. [7] studied the impact of variability in climatic conditions on productivity of Rabi season crops in the northwest part of India by finding the correlation between the variables and the crop yield. Qureshi et al. [8] developed a framework for the selection of crop patterns for sustainable agriculture practice using the Fuzzy AHP-TOPSIS (Analytical Hierarchy Process-Technique for Order Preference by Similarity to Ideal Solution) multi-criteria decision-making method. Zdzislaw [17] introduced rough set theory as a suitable tool for the treatment of uncertainties without affecting the decisions made by the experts. To work with the rough sets, only a small amount of prior information is needed, and it will also provide the best results by avoiding the vagueness of judgments made by the experts [18].
In Table 1, Water tariff, crop value, crop demand, and crop inventory are the sub-criteria of the economic factor. Irrigation methods and cultivation methods are the sub-criteria of agricultural management practices. Water availability, soil quality, and water quality are sub-criteria of the availability factor. Climatic conditions and rainfall are a part of the environmental factor.
Table 2 gives the basic summary of the literature that is referred to for finding the influential criteria of agricultural sustainability. Furthermore, the eight most important Rabi season crops, which are grown in the Rabi season, are taken as alternatives [27]. They are wheat, gram, barley, Rabi spices, Rabi cereals, Rabi pulses, Rabi vegetables, and Rabi fruits.

3. Methodology

The proposed methodology is demonstrated in Figure 1. A brief introduction about rough set theory is discussed, and the rough AHP-TOPSIS method is implemented for finding the crop pattern for the Rabi cropping season.

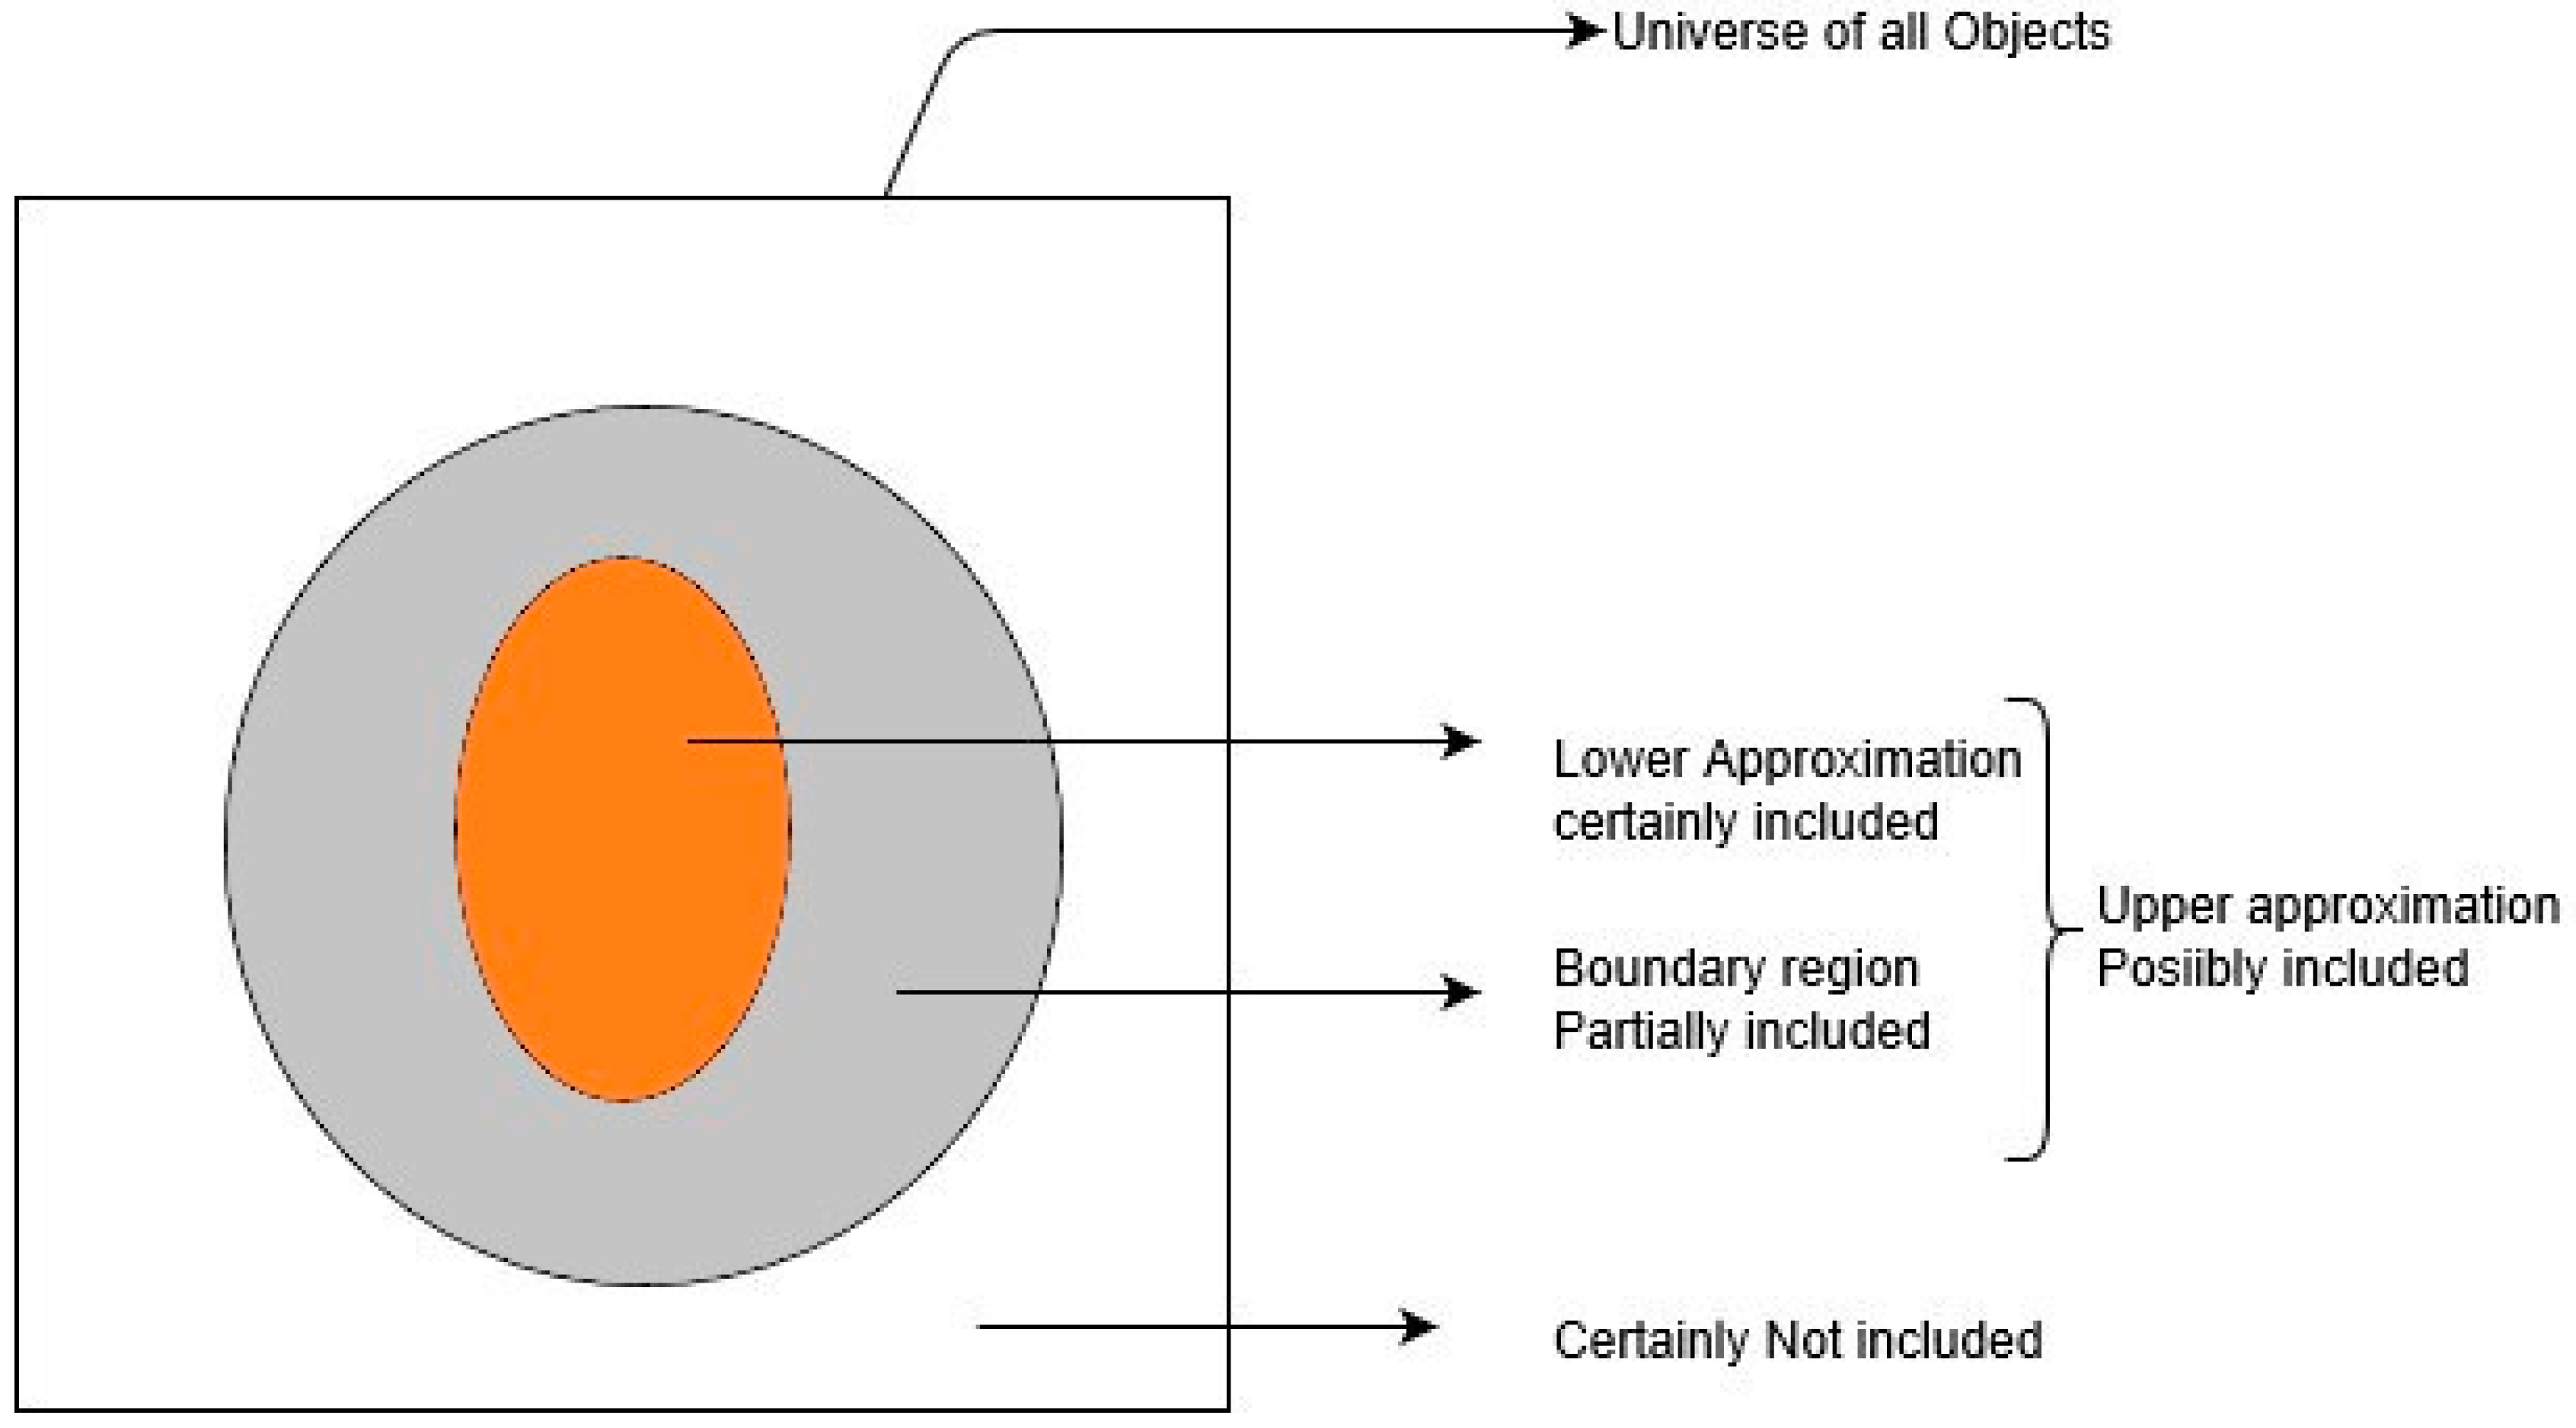
3.1. Rough Set Theory

Rough set theory gives the importance primarily in the field of artificial intelligence [28,29]. The application proposed as a general concept that left a way for use in many other applications for decision making [30,31]. The decision-makers are used to evaluate the criteria for a particular problem and have the option of prioritizing them using the provided scale values. It is not possible to have all the decision-makers be experts in all fields, as some may be experienced in one field, and some may be in another. So, if an unexperienced decision-maker decided on a particular area, the judgment made by the expert might be uncertain. In order to find and eliminate the uncertainties, rough set theory plays a significant role and provides the best decision by removing the vagueness of the experts’ opinion. Sometimes, when there are sets that are characterized by a very small amount of data, the rough set theory can be applied [32,33]. The rough set can work well with a small amount of information problems and avoid uncertainty to give the best decision making [34]. Some of the advantages of the rough set theory, such as its use for finding the hidden patterns in data, reducing the original data, and evaluating the importance of data, are explained in Song et al. [18].
The pair of precise concepts based on the lower and upper approximation is used to deal with the vague concept [17]. The lower and upper approximation of rough set theory are represented in Figure 2. Let us assume U to be the universe containing all the objects, Z is the lower approximation, which states that the set of all objects can be certainly mentioned in Z. The upper approximation set of Z consists of elements that can belong certainly to Z or not. The boundary region of Z in U of the elements in it which cannot be either brought in nor can be brought out as a member of the target set (Song et al., 2014).
Consider that there are e classes of experts’ opinion, H = { G 1 , G 2 , , G e } , which are in the order G 1 < G 2 < < G e , and T is an arbitrary object of U, then the upper and lower approximations of Gi and the boundary region are evaluated by,
Lower approximation:
A p r _ ( G i ) = { T U H ( T ) G i }
Upper approximation:
A p r ¯ ( G i ) = { T U H ( T ) G i }
Boundary region:
B n d ( G i ) = { T U H ( T ) G i } = { T U H ( T ) > G i } { T U H ( T ) < G i }
Hence, the class Gi can be represented in the form of a rough number, which contains the lower limit L i m _ ( G i ) and upper limit L i m ¯ ( G i ) and can be calculated as,
L i m _ ( G i ) = 1 N L H ( T ) T A p r _ ( G i )
L i m ¯ ( G i ) = 1 N U H ( T ) T A p r ¯ ( G i )
where N L represents number of objects included for lower approximation of G i , and N U is the number of objects included for the upper approximation of G i .
The human subjective decisions can be expressed in terms of rough interval form on the basis of lower limit L i m _ ( G i ) and upper limit L i m ¯ ( G i ) .
Rough number:
R N ( G i ) = [ L i m _ ( G i ) , L i m ¯ ( G i ) ]
The degree of accuracy of decisions by decision-makers can be analyzed by finding the interval of boundary region, and the smaller the interval of a rough number, the greater the precision is.
Interval of boundary region:
I B R ( G i ) = L i m ¯ ( G i ) L i m _ ( G i )
The arithmetic operations for rough numbers are done as follows,
Addition of rough numbers R N 1 and R N 2 ,
R N 1 + R N 2 = ( L i m _ 1 , L i m ¯ 1 ) + ( L i m _ 2 , L i m ¯ 2 ) = ( L i m _ 1 + L i m _ 2 ,   L i m ¯ 1 + L i m ¯ 2 )
Subtraction of rough numbers R N 1 and R N 2 ,
R N 1 R N 2 = ( L i m _ 1 , L i m ¯ 1 ) ( L i m _ 2 , L i m ¯ 2 ) = ( L i m _ 1 L i m ¯ 2 ,   L i m ¯ 1 L i m _ 2 )
Multiplication of rough numbers R N 1 and R N 2 ,
R N 1 × R N 2 = ( L i m _ 1 , L i m ¯ 1 ) × ( L i m _ 2 , L i m ¯ 2 ) = ( L i m _ 1 × L i m _ 2 ,   L i m ¯ 1 × L i m ¯ 2 )
Division of rough numbers R N 1 and R N 2 ,
R N 1 ÷ R N 2 = ( L i m _ 1 , L i m ¯ 1 ) ÷ ( L i m _ 2 , L i m ¯ 2 ) = ( L i m _ 1 ÷ L i m ¯ 2 ,   L i m ¯ 1 ÷ L i m _ 2 )
Scalar multiplication of rough number R N 1 with non-zero constant ƿ,
ƿ × R N 1 = [ ƿ × L i m _ 1 , ƿ × L i m ¯ 1 ]

3.2. Rough Analytical Hierarchy Process

Step 1: Identify the criteria, sub-criteria, and the alternatives which help to achieve our proposed objective. Then, form the hierarchal structure with the objective in the top level, alternatives in the bottom level, and criteria and sub-criteria in the middle.
Step 2: Form the pair-wise comparison matrix by collecting information from the experts by using the values in Table 3. The form of pair-wise comparison matrix are as follows,
D e = [ 1 x 12 e x 1 n e x 21 e 1 x 2 n e x n 1 e x n 2 e 1 ]
where x r c e (1 ≤ rn, 1 ≤ cn, 1 ≤ es) represents the values of relative importance of the criteria r over criteria c, given by the experts e, n, and s, are the number of criteria and number of expert decision makers, respectively.
Step 3: Find the maximum Eigen value λmax of the decision matrix De, and find the Consistency Index (CI) using the formula, CI = (λmaxn)/(n − 1).
Compute the Consistency Ratio (CR) of the judgement matrix De by selecting the corresponding Random Integer (RI) value from the Table 4 and by using the formula, CR = CI/RI.
If the pairwise comparison matrix has CR < 0.10, then the decision matrix is acceptable, if not, the judgment matrix should be altered until the CR value reaches less than 10%.
Then integrated comparison matrix D ˜ is constructed as,
D ˜ = [ 1 x ˜ 12 e x ˜ 1 n e x ˜ 21 e 1 x ˜ 2 n e x ˜ n 1 e x ˜ n 2 e 1 ]
Step 4: Form the rough comparison matrix.
Convert the crisp elements x r c e in the D ˜ into rough number RN ( x r c e ) using Equations (1)–(6),
R N ( x r c e ) = [ x r c e L , x r c e U ]
where x r c e L and x r c e U are lower and upper limits of RN ( x r c e ), respectively.
The set of rough numbers by different decision makers are represented by RN ( x r c e ) as,
R N ( x r c e ) = { [ x r c 1 L ,   x r c 1 U ] ,   [ x r c 2 L ,   x r c 2 U ] , ,   [ x r c s L ,   x r c s U ] }
It is further combined into single set by taking average of RN ( x r c e ) by rough arithmetic equations,
R N ( x r c ) = [ x r c L , x r c U ]
x r c L = x r c 1 L + x r c 2 L + + x r c s L s
x r c U = x r c 1 U + x r c 2 U + + x r c s U s
where x r c L is the lower limit and x r c U is the upper limit of RN ( x r c ).
Then, the rough comparison matrix R is formed as,
R = [ [ 1 , 1 ] [ x 12 L , x 12 U ] [ x 1 m L , x 1 m U ] [ x 21 L , x 21 U ] [ 1 , 1 ] [ x 2 m L , x 2 m U ] [ x m 1 L , x m 1 U ] [ x m 2 L , x m 2 U ] [ 1 , 1 ] ]
Step 5: Calculate the rough weight w g of each criterion.
w g = [ Π c = 1 n   x r c U n w g , Π c = 1 n   x r c U n ]
w g = w g / max ( w g U )
Here w g is the normalized weight of the criteria in the form of rough set.

3.3. Rough TOPSIS Method

This section presents the steps of rough TOPSIS method as follows [35,36]:
Step 1: Form the decision matrix by compiling the data of the decision-makers. The matrix is formed in the way that the performance values of each alternative are compared with different criteria. The judgment matrix is expressed as J as follows,
C 1     C 2       C n       J = A 1 A 2 A m [ x 11 e x 12 e x 1 n e x 21 e x 22 e x 2 n e x m 1 e x m 2 e x m n e ]
where e = 1 , 2 , , l and x i j e   ( i = 1 , 2 , , m ; j = 1 , 2 , , n ) is the performance rating of ith alternative in accordance with the jth criteria given by the eth expert.
Step 2: Convert the crisp values into the rough set values R N ( x i j e ) by using the formulae (1) to (6), and form the rough-group decision matrix. The rough set values are in the form of,
R N ( x i j e ) = [ x i j e L , x i j e U ]
where x i j e L and x i j e U are the upper and lower limit of rough number R N ( x i j e ) , respectively.
Thus, the combined rough set sequence R N ( x i j ) is obtained as,
R N ( x i j ) = { [ x i j 1 L , x i j 1 U ] , [ x i j 2 L , x i j 2 U ] , , [ x i j e L , x i j e U ] }
The average of R N ( x i j ) is obtained by using rough computational principles as,
R N ( x i j ) ¯ = [ x i j L , x i j U ]
x i j L = ( x i j 1 L + x i j 2 L + + x i j e L ) / e
x i j U = ( x i j 1 U + x i j 2 U + + x i j e U ) / e
Then the formation of rough group decision matrix is as follows,
R = [ [ 1 , 1 ] [ x 12 L , x 12 U ] [ x 1 m L , x 1 m U ] [ x 21 L , x 21 U ] [ 1 , 1 ] [ x 2 m L , x 2 m U ] [ x m 1 L , x m 1 U ] [ x m 2 L , x m 2 U ] [ 1 , 1 ] ]
Step 3: Calculate the weighted normalized matrix in the form of rough numbers. Normalization is done to convert the various criteria scale values into a single comparable scale. The normalization is conducted as follows,
x i j L = x i j L M a x i = 1 m { max [ x i j L , x i j U ] ,   x i j U = x i j U M a x i = 1 m { max [ x i j L , x i j U ] }  
[ x i j L , x i j U ]   is the normalized form of rough set [ x i j L , x i j U ] , and the aforementioned normalization method fits the values in the interval of [0, 1].
Then, the calculation of weighted normalized matrix is as follows,
z i j L = w j L   x i j L ,   i = 1 , 2 , m ; j = 1 , 2 , , n .
z i j U = w j U   x i j U ,   i = 1 , 2 , m ; j = 1 , 2 , , n .
In the above equations, w j L and w j U represent the weight of criteria in the form of rough set and are calculated by rough AHP method.
Step 4: Identify the Positive Ideal Solution (PIS) and Negative Ideal Solution (NIS).
z + ( j ) = { m a x i = 1 m ( z i j U   ) , i f   j B ; m i n i = 1 m ( z i j L   ) ,   i f   j C } , z ( j ) = { m i n i = 1 m ( z i j L   ) , i f   j B ; m a x i = 1 m ( z i j U   ) ,   i f   j C }
Here, z + ( j ) and z ( j ) are PIS and NIS of a particular criteria j. B is associated with benefit criteria and C is associated with cost criteria.
Step 5: Find the distance of each criteria from PIS and NIS using the n-dimensional Euclidean distance. d i +   is the magnitude of separation from PIS and is calculated as,
d i + = { j B ( z i j L z + ( j ) ) 2 + j C ( z i j U z + ( j ) ) 2 } 1 2   i = 1 , 2 , m ; j = 1 , 2 , , n .
Similarly, separation from NIS is identified as,
d i _ = { j B ( z i j U z ( j ) ) 2 + j C ( z i j L z ( j ) ) 2 } 1 2   i = 1 , 2 , m ; j = 1 , 2 , , n .
Step 6: A closeness coefficient ( C C i ) is calculated to find the order of ranking of the alternatives using d i + and   d i _ .
C C i = d i _ d i + + d i _   ; i = 1 , 2 , , m .
The rank of alternatives is given based on the values of C C i in descending order. Obviously, the alternative which is nearest to PIS and farthest from NIS will be ranked number one.

4. Implementation of Developed Framework

Here, to apply this proposed framework in real life, sustainable agriculture in India is taken for the study. As the population of India is gradually increasing on one side [1,3], it is challenging for the Government to match the agricultural needs of the people [20]. Additionally, Indian farmers are also facing many issues in making the produces due to challenges of environment and scarcity of resources [2]. Furthermore, due to the uncertainty of the agricultural market in India [37,38], farmers are not able to make the minimum profit [2,19,39]. So, it is an important issue to address for changing the dreadful situation of the Indian farmers and for making the economic background of the nation healthier.
As per the findings of past researchers, agricultural sustainability is the solution to this problem. So, we decided to do the study on the selection of crop pattern for Rabi season crops, by considering all the challenges in accordance with sustainable agricultural practices. The proposed rough AHP-TOPSIS is implemented to find the perfect crop pattern, which yields all the desirable outputs. The data were collected in the form of a matrix, in which the elements of the matrix compare the criteria and the alternatives with the range of scale values representing the magnitude of influence. Four experts were chosen, who have immense experience in the field of agriculture over a long tenure. Among the four participants, three are academic experts, and the other one is a farmer. At last, the expert’s opinions were compiled and examined using the developed rough AHP-TOPSIS framework, and the results were analyzed. The procedure of the developed model is illustrated below.

Implementation of Rough AHP-TOPSIS Methods

Step 1: Formation of hierarchal structure
Firstly, all the criteria, associated sub-criteria, and the alternatives are chosen for the selection of ideal crop pattern of Rabi crop in accordance with sustainable agricultural practices. Then the selected criteria, sub-criteria, and alternatives are compiled and organized to form a hierarchal structure. In that structure, the goal is at level 1, alternatives are in level 4, and the criteria and sub-criteria are in level 3 and level 4, respectively. The hierarchal framework for the selected problem is presented in Table 5.
Step 2: Construction of judgement matrices
The decision-makers were informed of all the necessary details of this study at the beginning of the survey (Table 3 and Table 6). Then the experts were allowed to fill the decision matrices that are necessary to perform rough AHP-TOPSIS calculations for selecting the ideal crop pattern. A sample of judgments made by the decision-makers is presented in Appendix A (Table A1, Table A2, Table A3, Table A4, Table A5 and Table A6). The pairwise comparison table values from Table 3 are used to fill the matrices which compare one criterion with the other criteria, which are employed in finding the weight of each criteria using a rough AHP method. Another judgment matrix was also formed by the experts, which compares criteria with the alternatives for performing the rough TOPSIS calculations. For forming that matrix, a performance rating was given based on the score values, which are presented in Table 6.
Step 3: Finding weights of criteria by rough AHP
The decisions made by the four decision-makers are aggregated by combining the values of particular criteria over others in the form of sets. The integrated decision matrix is converted into rough set values by using the Equations (1)–(6). The integrated rough decision matrices of all the criteria and sub-criteria are presented in Appendix B (Table A7, Table A8, Table A9, Table A10 and Table A11). The converted rough numbers are used in the Analytical Hierarchy Process, and the weights of each criterion and the sub-criteria are found in the form of a rough set using Equation (21). Then, with the help of Equation (22), weights are normalized to the scale of 0 to 1. Then, the normalized weights of the main criteria were multiplied with the weights of the sub-criteria to form the global weight. They are shown in Table 7 below.
Step 4: Finding the ideal crop pattern by rough TOPSIS
As similar to the rough-AHP method, the judgment matrix of decision-makers is integrated, and the aggregated decision matrix was converted into the matrix of rough values, and the normalization was done by using the formula (30). In Appendix C, tables of integrated judgment matrix (Table A12) and the normalized matrix (Table A13) are presented. The weighted normalized matrix (Table A14) was formed by multiplying the global weights of each sub-criteria with corresponding normalized performance ratings according to the Equations (31) and (32).
The positive and negative ideal solutions of each sub-criteria correlated with the alternatives are found using the Equation (33). Then, the distance from PIS and NIS of each sub-criteria in relation to the respective alternatives were found using formula (34) and (35), respectively. These values are presented in Table 8.
According to Equation (36), the closeness coefficients (Ci) of each alternative were found, and the values are ranked in descending order and are illustrated in Table 9. The alternative which ranked number 1 (Rabi Pulses) was chosen as an ideal crop pattern for the sustainable agricultural practice considering all the influencing factors in sustainable farming.
According to the results obtained from the rough AHP-TOPSIS method, the ideal crop pattern for the Rabi cropping season for sustainable agricultural practices is Rabi pulses, as it got the highest closeness coefficient (Ci) value at about 0.5701, and is ranked number 1 among all alternatives that are considered. The least preferred crop pattern would be barley, and it has the minimum Ci value, only 0.3759 by considering all the criteria that influence agricultural sustainability. The ranking of all the alternative crop patterns are in the order of Rabi pulses > Rabi fruits > Rabi cereals > Rabi spices > Rabi vegetables > gram > wheat > barley.
Figure 3 presents the graphical representation of a comparison of weights of all the criteria obtained by the Rough AHP-TOPSIS method to the conventional crisp AHP-TOPSIS method. It is interesting to note that the order of ranking of weights of all the criteria by rough AHP-TOPSIS is more or less the same with the rank order of weights by the AHP-TOPSIS method. C8 > C7 > C6 > C5 > C9 > C1 > C2 > C10 > C3 > C4 > C11 is the rank order obtained by rough AHP-TOPSIS method, and the sequence of rank by AHP-TOPSIS method is C8 > C7 > C6 > C5 > C9 > C10 > C1 > C2 > C3 > C11 > C4. In the aforementioned sequence of rank orders, only a few criteria (C1, C2, C4, C10, and C11) have a different position of rank by both methods. In the rough method, the uncertainties of decision-makers can be understood, as it fits the values of decision-makers in the form of upper and lower limits [17,18,28]. Here, in this graph, the spread of judgment by experts is represented in the form of the bar for the rough AHP process as opposed to a line by the crisp AHP method. The more the length of the bar indicates, the more the uncertainties of decisions by the decision-makers. The less the length of the spread represents, the higher the accuracy of the decisions. When it comes to the weights by the AHP method, they are represented in the form of lines, even though multiple decision-makers are involved in this problem. It takes only the mean value of decisions by the experts, and so the vagueness and uncertainties of the judgment values cannot be found in the conventional AHP method.
In Figure 4, the rank of the alternatives found by rough AHP-TOPSIS is compared with the rank of alternative by the crisp AHP-TOPSIS method. It can be seen from the graph that the rank of alternatives of Rabi fruits, Rabi spices, wheat, and barley are the same by both methods; they are 2, 4, 7, and 8, respectively. Rabi pulses are the most suggested crop pattern for the sustainable agricultural practices by the rough AHP-TOPSIS method, whereas Rabi cereals by the AHP-TOPSIS method. The least preferred crop pattern for Rabi season in terms of agricultural sustainability is barely, as it ranked eight among the alternatives by both methods.

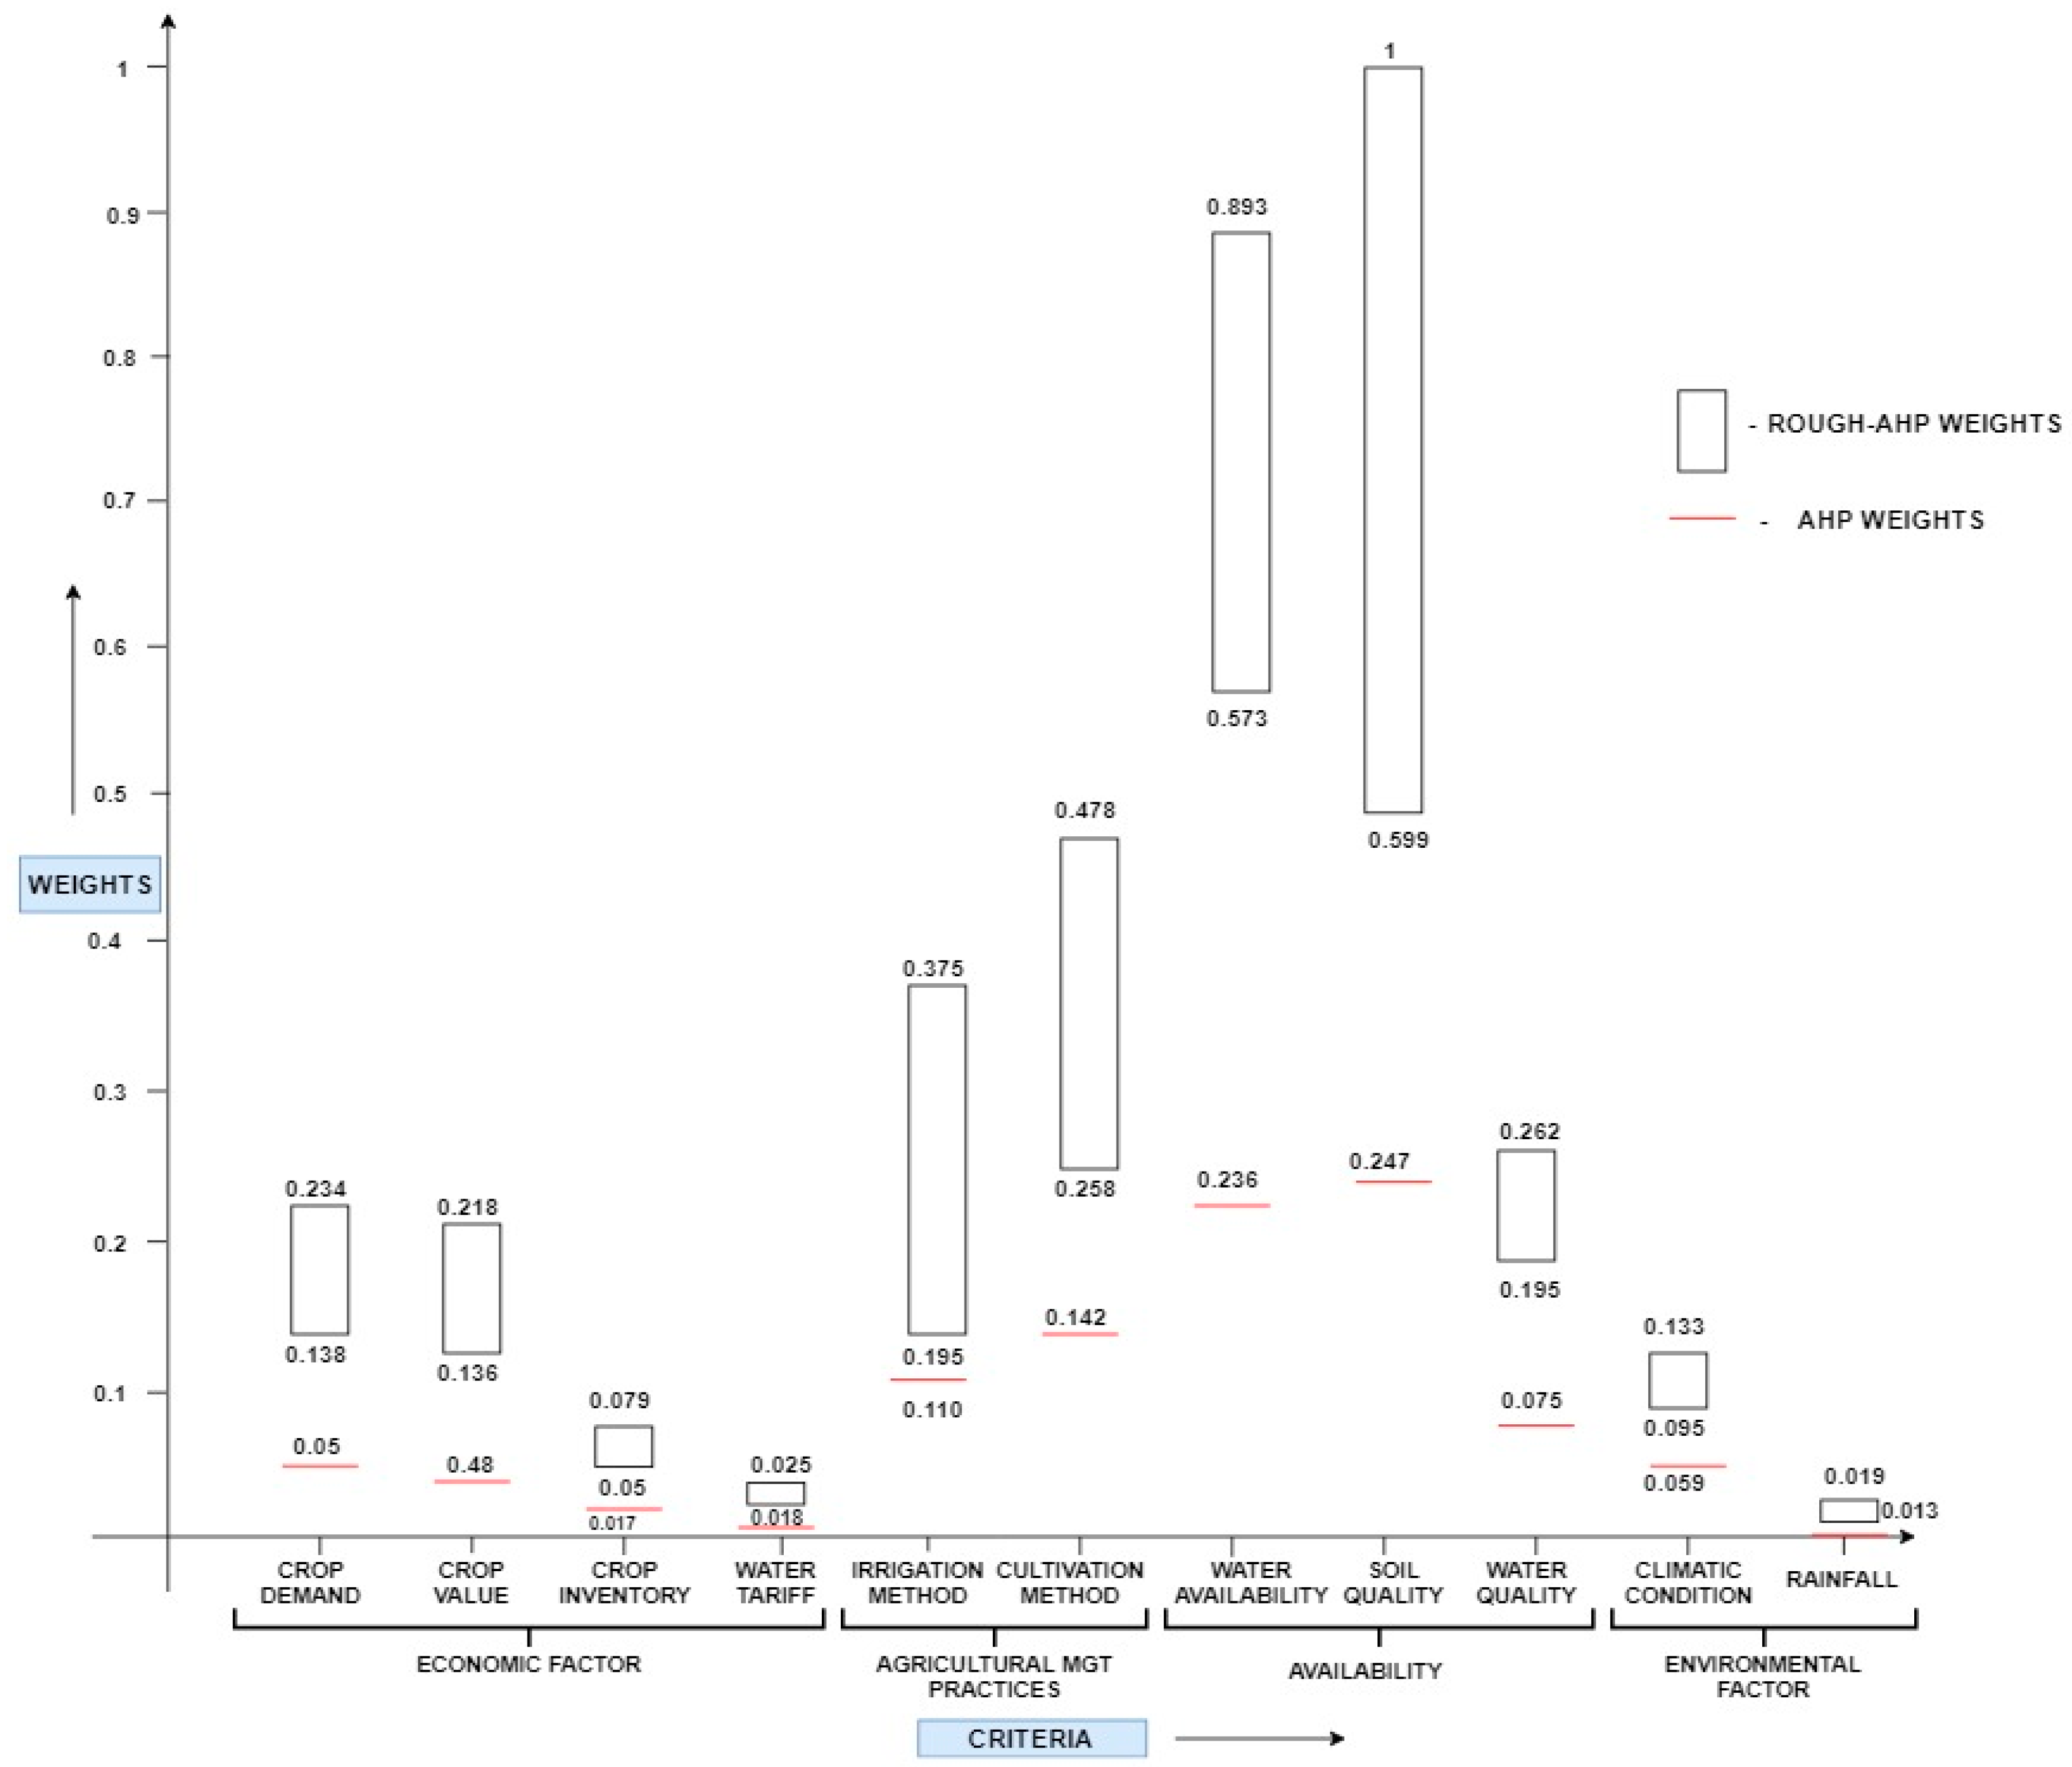
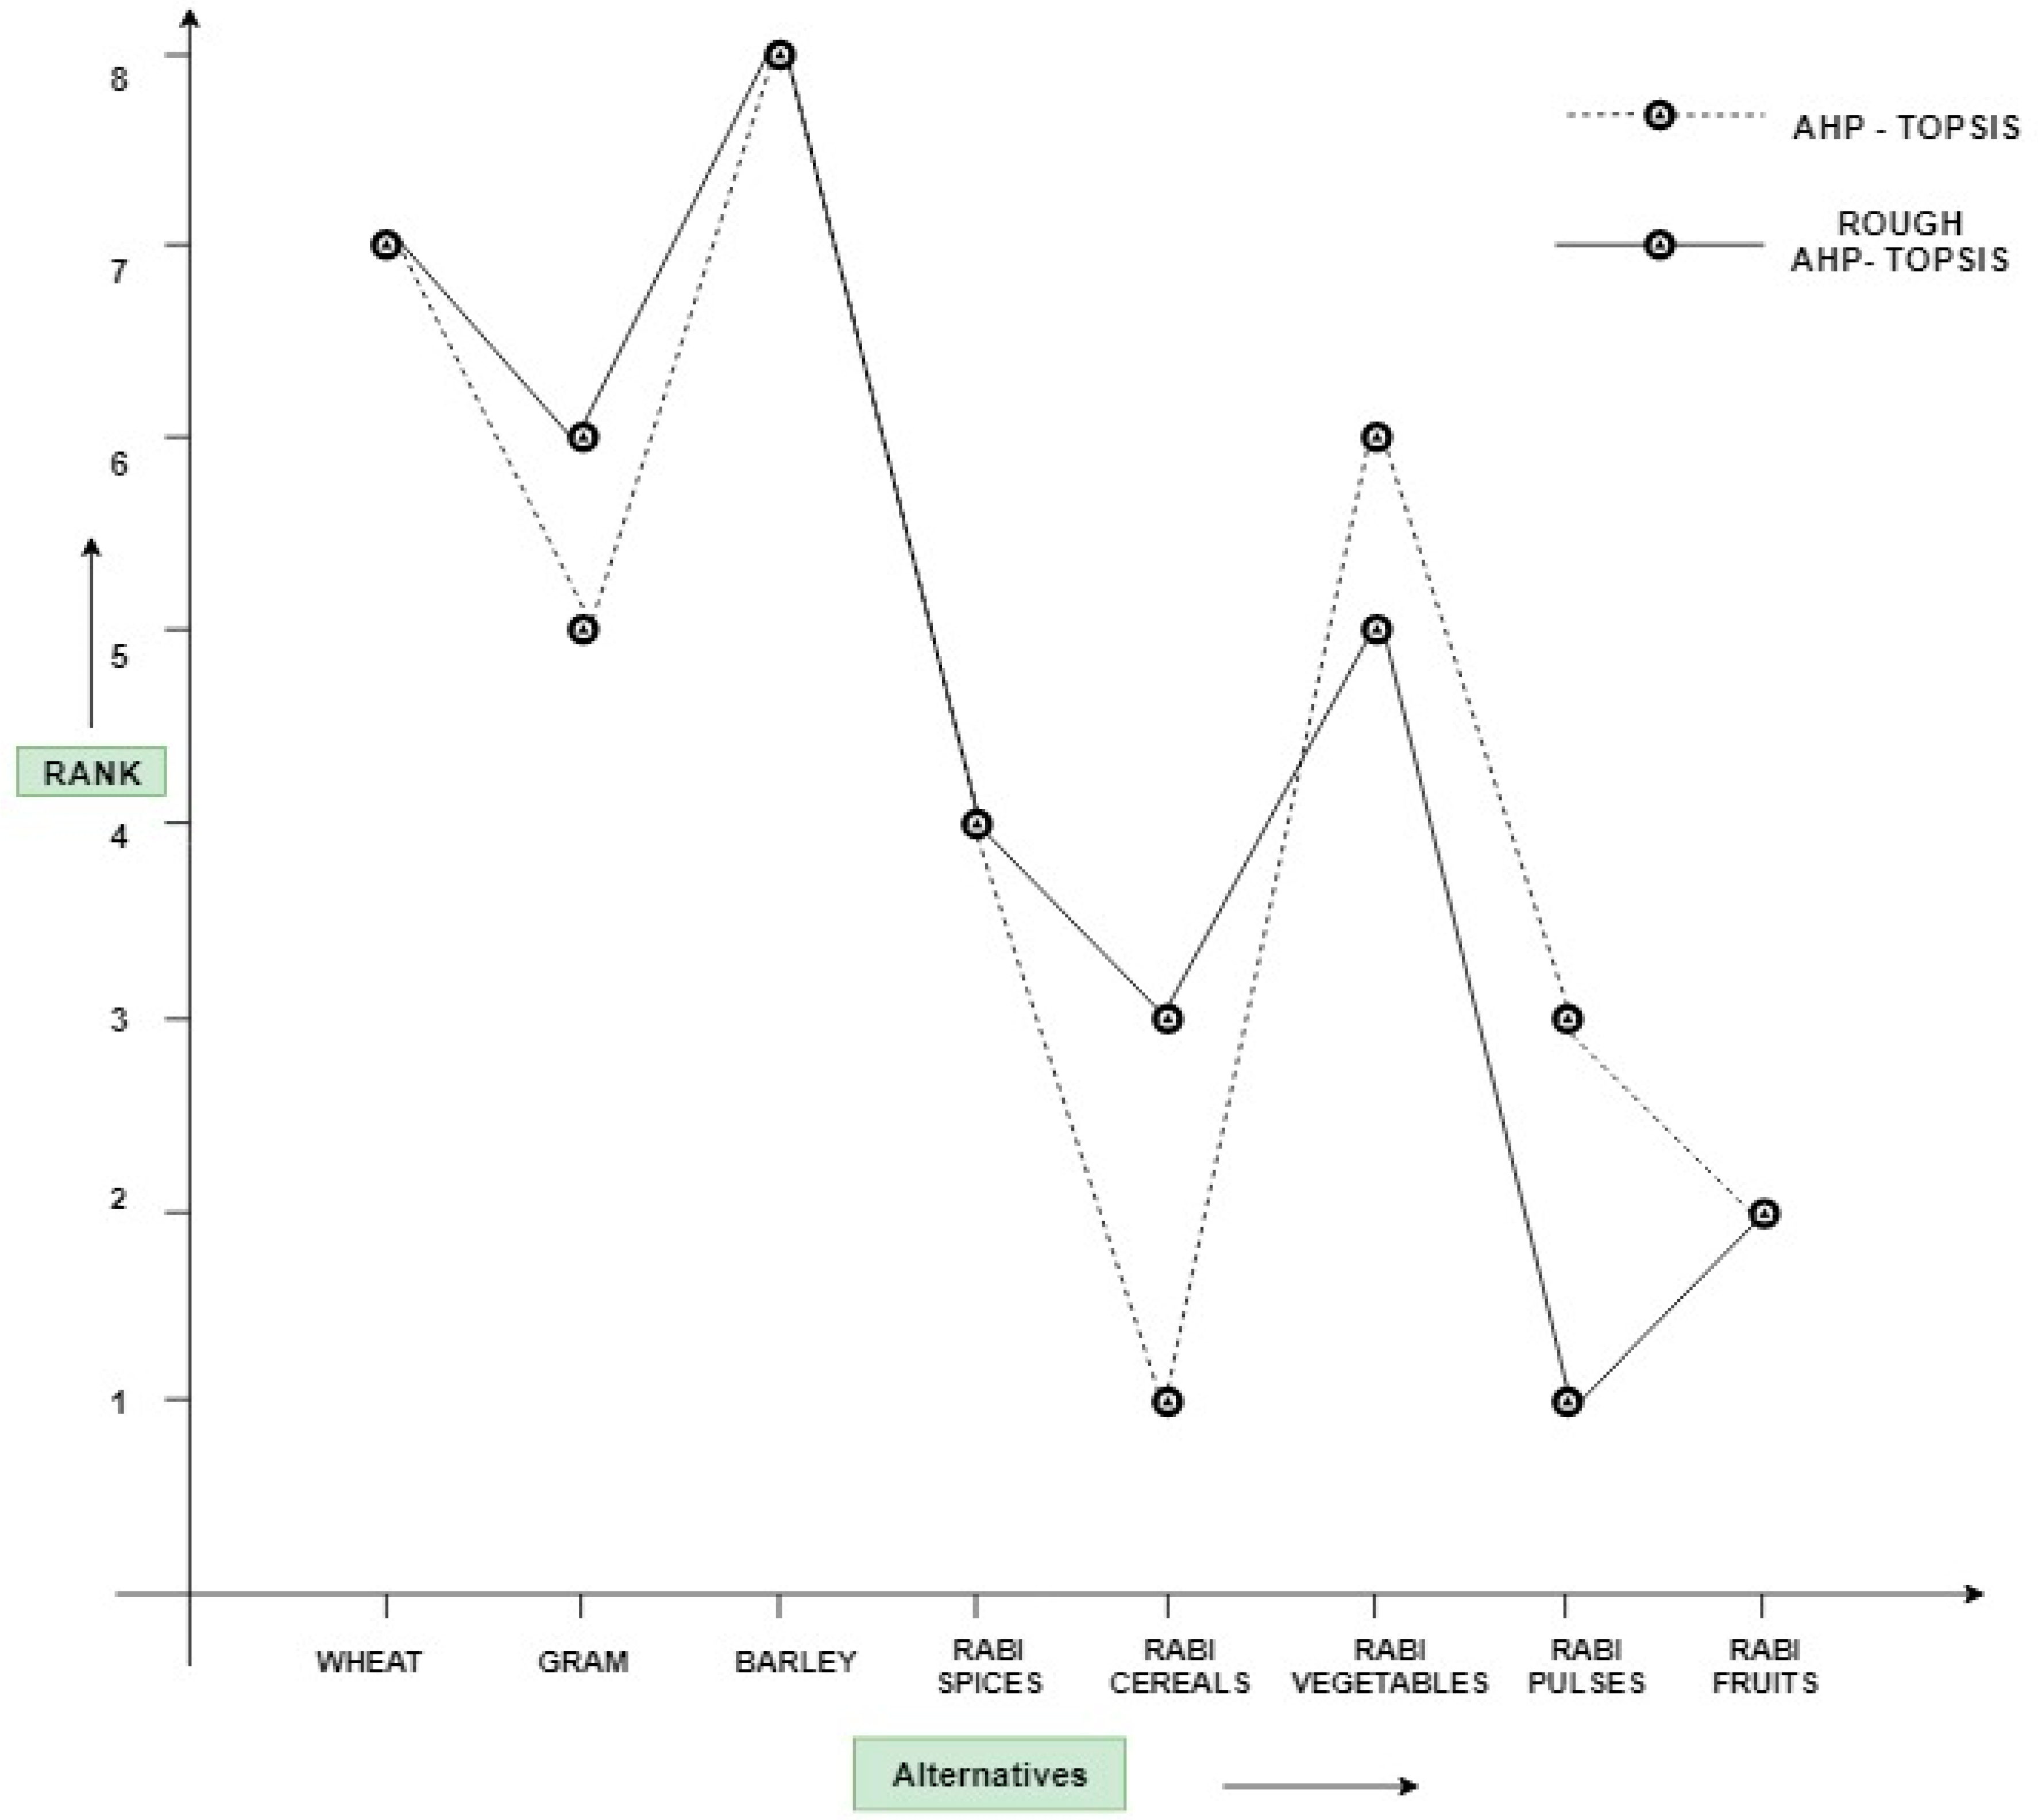
5. Results and Discussions

Figure 3 presents that the soil quality and water availability are the most critical parameters for the Rabi season crop pattern selection. Rabi pulses can play a vital role in sustaining crop productivity and soil health. Choudhary [40] highlighted that soil fertility and pest management practices integrated with improved crop establishment and management practices can enhance not only the productivity and profitability, but also warrant environmental and social sustainability. The availability of irrigation water at critical stages of crop growth plays a critical role in sustainable production. For this, Yadav et al. [41] suggested replacing high water duty crops with low water-intensive crops like pulses in dry and water scarce areas during critical stages of crop growth through effective water scheduling.
Decision-makers also emphasized on proper cultivation and irrigation methods. The proper irrigation method is also important, as Rabi pulse crops need proper drainage due to their sensitivity to waterlogging [42]. Yadav et al. [41] also mentioned that better irrigation infrastructure can eventually lead to higher technology adoption and sustainable agricultural practices in pulses among Indian farmers. For the sustainable agricultural practices, Pooniya et al. [43] summarized that various improved and advanced cultivation methods (e.g., raised bed planting method, seed replacement with improved varieties, foliar application of fertilizers at critical stages in rainfed areas, use of biofertilizers, adoption of appropriate weed and pest management, application of secondary and micro-nutrients) can increase the productivity of Rabi pulses. Figure 3 also shows that the criteria ‘Rainfall and water tariff’ have the least amount of uncertainties as its spread lengths are minimum, and soil quality has the maximum bar length, and so its accuracy is minimum.
The results of this study indicate that Rabi pulses can be an appropriate crop pattern, followed by Rabi fruits. The selected crop pattern with sustainable and environment-friendly agricultural practices can guide practitioners to higher production and productivity, which is vital for socio-economic sustainability. The proper selection of Rabi crop patterns can lead to a strategic decision, which impacts the interest of stakeholders, sustainability, and the degree of automation in farming practices, socio-environment effects, irrigation methods, degree of farming skills, etc. In this study, the authors mainly focused on the selection of the crop pattern by considering all the factors that affect agricultural sustainability. However, for sustainable and environment-friendly agricultural practices, it is essential to consider other important factors and further discussions. Some of the factors are discussed below:
  • Due to the fluctuating socioeconomic conditions and limited resources over the states and regions of India, the selection of appropriate Rabi crop patterns is incredibly challenging. The majority of farmers in India depend on state or government-sponsored subsidies for managing basic crop production resources like water, seeds, fertilizers, labor, and electricity [8]. Proper government support is needed to control the crop value and minimum support price (MSP) so that farmers can grow Rabi crops economically and are not affected by the overflowing stock of granaries [8].
  • To ensure proper utilization of existing arable lands between Kharif and Rabi seasons, intercropping of pulses and growing short-duration varieties can be performed. The Department of Agriculture and Cooperation (DAC) of New Delhi, India, has also proposed some strategies to introduce summer pulses (for example, green gram, black gram, and cowpea) in irrigated areas after the harvest of Rabi crops. Replacement of upland paddy with Rabi pulses can be another potential option to ensure more profits to farmers [43].
  • For sustainable production, appropriate strategies are required to reduce post-harvest losses, which can cause an immense economic deficit. It is important to identify the crucial causal factors of post-harvest losses in the Rabi crops supply chain. The reduction of post-harvest losses can support to achieve sustainability balancing social, economic, and environmental dimensions [44].
  • Lack of proper knowledge and information regarding the demand of pulses and their market price fluctuations may cause overproduction or underproduction, which leads to the unfortunate realization of costs, complicates transportation issues, and leads to substantial losses [45].
  • Proper communication and knowledge about the quality of seeds are also essential, as Negi and Anand [46] highlighted that many Indian farmers are unaware of the fact that crops grown from high-quality seeds can actively fight diseases and pests.
  • Effective integration and exchange of information between the government, public and private institutions, industries, and farmers are vital for sustainable agricultural practices [47]. The consideration of effective policies for farming, processing, distribution, and sufficient knowledge and training for handling crops can reduce the harvest losses significantly and improve productivity.
  • Effective backward–forward integration from farmers to consumers can reduce the dependencies and risks in agricultural supply chains. Effective backward–forward integration can also provide proper control over critical resources and competencies, which can increase the effectiveness and competitiveness of a supply chain [48].
  • In India, during Rabi season, most of the crops (i.e., Rabi pulses, Rabi cereals, wheat, barley, gram) are used for annual food consumption in addition to cash crops (i.e., vegetables, sugarcane, spices) [8]. These help farmers to meet their annual food requirements and to generate additional income for future agricultural practices. Thus, for the sustainable consumption, availability of the resources, government support, climatic factors, and economic support are critical to the Rabi season [8].
  • For low-income countries, pulse protein is a relatively large share of the overall protein consumption. India is one of the largest producers, consumers, and importers of pulses in the world. Therefore, enhancing Rabi pulse productivity and diversifying cropping systems are key challenges to policymakers, government, scientists, and farming communities for the reduction of the demand–supply gap and to meet the national and local consumptions [40].
  • While sustainable agricultural policies are important for India, dedicated efforts also need to be put in practice from all stakeholders in agricultural supply chains for improving health and nutrition through pulse consumption. To develop sustainable water-use and consumption policies, changes in crops and an increased level of intercropping of pulses would be an important strategic consideration [49].

6. Conclusions, Limitations, and Future Research Direction

Generally, attaining agricultural sustainability is a tough goal to achieve. In a country like India with a huge population, multiple cultures, and extensive geography with drastic climatic variation, attaining agricultural sustainability is an even a tougher task. Thus, the main objective of this study was to find the ideal crop pattern for the Rabi cropping season based on sustainable farming practices. This paper presented the rough AHP-TOPSIS framework to select the crop pattern by considering all the factors that affect agricultural sustainability. Additionally, the results obtained by the rough AHP-TOPSIS framework are compared with the results of AHP-TOPSIS model in the goal of finding the perfect crop pattern.
The research findings illustrated that the Rabi pulses are the ideal crop pattern for Rabi season in India, as it ranked number 1 among all the alternatives that are chosen for the study that is analyzed by the rough AHP-TOPSIS model. These findings will give an idea to farmers and stakeholders to choose the crop pattern for Rabi season. It will also provide the maximum economic benefits to the farmers by yielding maximum productivity and the associated benefits to the government, society, and to the environment.
This study was conducted by taking expert inputs, and is therefore subject to individual bias. Additionally, the uncertainties of the experts’ decisions are higher for the sub-factor soil quality, water availability, cultivation methods, and irrigation methods are higher. If those uncertainties are reduced, qualitative results can be obtained. Furthermore, in this study, a single cropping pattern is only considered, not the multi-crop pattern. The better results may be acquired if the multiple crop pattern is considered. So, it can be taken into account in further research studies. For better sustainable agricultural practices, future research can include adaption and mitigation options to cope with climate change issues. For the sustainable and environment-friendly agricultural and consumption practices in India, there is a need for an inclusive understanding of the issues affecting the pulses’ overall production, value chain, and food processing, as well as the interest of consumers, governments, policymakers, and the food industry in pulses and their nutrition, health, and environmentally sustainable benefits.

Author Contributions

Conceptualization, V.P.S., G.T., and G.K.; methodology, V.P.S., G.T., and G.K.; software, V.P.S., G.T.; validation, V.P.S., G.T., G.K., and S.M.A.; formal analysis, V.P.S. and G.T.; investigation, V.P.S. and G.T.; resources, V.P.S., G.T., G.K., and S.M.A.; data curation, V.P.S. and G.T.; writing—original draft preparation, V.P.S., G.T., G.K., and S.M.A.; writing—review and editing, G.K., S.M.A., S.A.R.K., and Z.Y.; visualization, S.A.R.K. and Z.Y.; supervision, G.K.; project administration, G.K. All authors have read and agreed to the published version of the manuscript.

Funding

The third author acknowledge the financial support through Natural Science Engineering Research Council Canada Discovery Grant Program (RGPIN-2019-04704).

Acknowledgments

We thank our anonymous reviewers and the editor for their constructive feedback and suggestions, which led to a much-improved paper.

Conflicts of Interest

The authors declare no conflict of interest.

Appendix A

Sample of decision made by decision makers
Decision maker number 1
Qualification: Ph.D. in Agricultural Entomology
Experience in the field of Agriculture: 20 Years
Table A1. Main criteria for the Rabi crop pattern selection.
AvailabilityAgricultural Management PracticesEconomic FactorEnvironmental Impact
Availability1356
Agricultural management practices 133
Economic factor 12
Environmental impact 1
Table A2. Sub-criteria of the economic factor.
Crop DemandCrop ValueWater TariffCrop Inventory
Crop demand1146
Crop value 157
Water tariff 14
Crop inventory 1
Table A3. Sub-criteria of the agricultural management practices.
Irrigation MethodsCultivation Methods
Irrigation methods1
Cultivation methods31
Table A4. Sub-criteria of the availability criteria.
Water AvailabilitySoil QualityWater Quality
Water availability112
Soil quality 13
Water quality 1
Table A5. Sub-criteria for environmental factor.
Climatic ConditionRain Fall
Climatic condition18
Rainfall 1
Table A6. Performance rating by experts comparing the alternatives with sub-criteria.
WheatGramBarleyRabi SpicesRabi CerealsRabi VegetablesRabi PulsesRabi Fruits
Crop demand44135543
Crop value33143321
Crop inventory32222122
Water tariff54134432
Irrigation method41414122
Cultivation method11121122
Water availability21221233
Soil quality23232134
Water quality23242244
Climatic condition12133233
Rainfall22142332

Appendix B

Table A7. Aggregated rough decision matrix of the main criteria.
AvailabilityAgr Mgt PrcEconomicEnvironmental
LimitsLULULULU
Availability1.001.002.583.424.564.946.256.75
Agr mgt prc0.300.411.001.002.583.423.274.25
Economic0.200.220.300.411.001.002.333.75
Environmental0.150.160.260.490.310.461.001.00
Table A8. Integrated rough matrix of the sub-criteria of agricultural management practices.
Irrigation MethodsCultivation Methods
LimitsLULU
Irrigation1.001.000.581.41
Cultivation1.012.281.001.00
Table A9. Combined rough matrix of the sub-criteria of availability factor.
Water AvailabilitySoil QualityWater Quality
LimitsLULULU
Water availability1.001.000.921.752.273.25
Woil quality0.731.881.001.003.274.25
Water quality0.330.460.250.311.001.00
Table A10. Aggregated decision matrix of the sub-criteria of environmental factors in terms of rough set.
Climatic ConditionsRainfall
LimitsLULU
Climatic conditions1.001.006.587.42
Rainfall0.140.151.001.00
Table A11. Integrated rough judgement matrix of the sub-criteria economic factor.
Crop DemandCrop ValueCrop InventoryWater Tariff
LimitsLULULULU
Crop demand1.001.001.001.762.754.605.756.73
Crop value0.661.371.001.003.584.426.256.75
Crop inventory0.250.550.260.291.001.004.254.75
Water tariff0.150.170.150.160.210.241.001.00

Appendix C

Rough TOPSIS
Table A12. Aggregated performance rating rough matrix for the rough TOPSIS calculation.
LimitsWheatGramBarleyRabi SpicesRabi CerealsRabi VegetablesRabi PulsesRabi Fruits
Crop demandL2.683.061.182.584.564.564.253.58
U3.813.432.313.414.934.934.754.41
Crop valueL2.123.561.124.003.063.272.752.12
U2.873.931.874.003.434.253.722.87
Crop inventoryL1.752.272.252.272.252.002.562.062
U3.253.252.753.252.753.522.932.43
Water tariffL1.953.561.183.063.563.563.562.58
U4.043.932.313.433.933.933.933.41
Irrigation methodL3.121.332.681.063.121.252.062.00
U3.872.753.811.433.871.752.432.00
Cultivation methodL1.501.751.122.121.581.642.062.12
U2.502.721.872.872.412.892.432.87
Water availabilityL2.501.712.062.582.682.583.253.06
U3.503.372.433.413.813.413.753.43
Soil qualityL2.273.061.643.253.102.223.274.00
U3.253.432.893.754.354.184.254.00
Water qualityL1.753.061.583.252.752.583.253.25
U3.253.432.413.753.723.413.753.75
Climatic conditionL1.502.751.503.253.252.583.253.25
U2.503.732.503.753.753.413.753.75
RainfallL1.752.581.753.563.123.063.062.25
U2.723.413.253.933.873.433.432.75
Table A13. Normalized rough decision matrix.
LimitsWheatGramBarleyRabi SpicesRabi CerealsRabi VegetablesRabi PulsesRabi Fruits
Crop demandL0.540.620.240.520.920.920.860.72
U0.770.690.460.691.001.000.960.89
Crop valueL0.500.830.260.940.720.760.640.50
U0.670.920.440.940.801.000.870.67
Crop inventoryL0.490.640.630.640.630.560.720.58
U0.920.920.780.920.781.000.830.69
Water tariffL0.480.880.290.750.880.880.880.63
U1.000.970.570.850.970.970.970.84
Irrigation methodL0.800.340.690.270.800.320.530.51
U1.000.700.980.371.000.450.620.51
Cultivation methodL0.510.600.380.730.540.560.710.73
U0.860.940.640.990.831.000.840.99
Water availabilityL0.650.440.540.670.700.670.850.80
U0.910.880.630.891.000.890.980.90
Soil qualityL0.520.700.370.740.710.510.750.91
U0.740.780.660.861.000.960.970.91
Water qualityL0.460.810.420.860.730.680.860.86
U0.860.910.641.000.990.911.001.00
Climatic conditionL0.400.730.400.860.860.680.860.86
U0.660.990.661.001.000.911.001.00
RainfallL0.440.650.440.900.790.770.770.57
U0.690.860.821.000.980.870.870.69
Table A14. Weighted normalized matrix of rough TOPSIS method.
LimitsWheatGramBarleyRabi SpicesRabi CerealsRabi VegetablesRabi PulsesRabi Fruits
Crop demandL0.070.080.030.070.130.120.120.10
U0.180.160.110.160.230.230.220.21
Crop valueL0.060.110.040.120.090.100.090.07
U0.140.200.090.200.170.220.190.15
Crop inventoryL0.020.030.030.030.030.030.040.03
U0.070.070.060.070.060.080.070.06
Water tariffL0.010.020.010.010.020.020.020.01
U0.020.020.010.020.020.020.020.02
Irrigation methodL0.150.060.130.050.150.060.100.10
U0.370.260.360.140.370.170.240.19
Cultivation methodL0.130.150.100.190.140.150.180.19
U0.410.450.300.470.390.480.400.47
Water availabilityL0.370.250.310.390.400.390.490.46
U0.820.790.570.800.890.800.880.81
Soil qualityL0.310.420.220.450.420.310.450.55
U0.740.780.660.861.000.960.970.92
Water qualityL0.090.150.080.170.140.130.170.17
U0.220.240.170.260.260.240.260.26
Climatic conditionL0.030.070.030.080.080.070.080.08
U0.080.130.080.130.130.120.130.13
RainfallL0.010.010.010.010.010.010.010.01
U0.010.020.020.020.020.020.020.01

References

  1. Walle, D. Population growth and poverty: Another look at the Indian time series data. J. Dev. Stud. 2007, 21, 429–439. [Google Scholar] [CrossRef]
  2. Mahajan, K. Rainfall shocks and the gender wage gap: Evidence from indian agriculture. World Dev. 2017, 91, 156–172. [Google Scholar] [CrossRef]
  3. Goel, R.; Morhan, D. Investigating the association between population density and travel patterns in Indian cities—An analysis of 2011 census data. Cities 2020, 100. [Google Scholar] [CrossRef] [PubMed]
  4. NCRB. 2019. Available online: http://ncrb.gov.in/ (accessed on 27 June 2019).
  5. Mariappan, K.; Zhou, D. A Threat of Farmers’ Suicide and the Opportunity in Organic Farming for Sustainable Agricultural Development in India. Sustainability 2019, 11, 2400. [Google Scholar] [CrossRef] [Green Version]
  6. Tzouramani, I.; Mantziaris, S.; Karanikolas, P. Assessing Sustainability Performance at the Farm Level: Examples from Greek Agricultural Systems. Sustainability 2020, 12, 2929. [Google Scholar] [CrossRef] [Green Version]
  7. Nageswararao, M.M.; Dhekale, B.S.; Mohanty, U.C. Impact of climate variability on various Rabi crops over Northwest India. Theor. Appl. Climatol. 2018, 131, 503–521. [Google Scholar] [CrossRef]
  8. Qureshi MR, N.; Singh, R.K.; Hasan, M.A. Decision support model to select crop pattern for sustainable agricultural practices using fuzzy MCDM. Environ. Dev. Sustain. 2018, 20, 641–659. [Google Scholar] [CrossRef]
  9. Adewale Johnson Alonge, R.A.M. Assessment of the Adoption Of Sustainable Agriculture Practices: Implications For Agricultural Education. J. Agric. Educ. 1995, 36, 34–42. [Google Scholar] [CrossRef] [Green Version]
  10. Chandre Gowda, M.J.; Jayaramaiah, K.M. Comparative evaluation of rice production systems for their sustainability. Agric. Ecosyst. Environ. 1998, 69, 1–9. [Google Scholar] [CrossRef]
  11. Nambiar KK, M.; Gupta, A.P.; Fu, Q.; Li, S. Biophysical, chemical and socio-economic indicators for assessing agricultural sustainability in the Chinese coastal zone. Agric. Ecosyst. Environ. 2001, 87, 209–214. [Google Scholar] [CrossRef]
  12. Zhen, L.; Routray, J.K.; Zoebisch, M.A.; Chen, G.; Xie, G.; Cheng, S. Three dimensions of sustainability of farming practices in the North China Plain: A case study from Ningjin County of Shandong Province, PR China. Agric. Ecosyst. Environ. 2005, 105, 507–522. [Google Scholar] [CrossRef]
  13. Sydorovych, O.; Wossink, A. The meaning of agricultural sustainability: Evidence from a conjoint choice survey. Agric. Syst. 2008, 98, 10–20. [Google Scholar] [CrossRef]
  14. An Integrative Approach for Introducing Conservation Agriculture Practices to Tribal Societies in India. Available online: https://vtechworks.lib.vt.edu/bitstream/handle/10919/70446/5149_Cambodia_poster_2011.pdf?sequence=1&isAllowed=y (accessed on 27 May 2020).
  15. Yadav, S.K.; Babu, S.; Yadav, M.K.; Singh, K.; Yadav, G.S.; Pal, S. A Review of Organic Farming for Sustainable Agriculture in Northern India. Int. J. Agron. 2013, 2013, 718145. [Google Scholar] [CrossRef] [Green Version]
  16. Demartini, E.; Gaviglio, A.; Bertoni, D. Environmental Science & Policy Integrating agricultural sustainability into policy planning: A geo-referenced framework based on Rough Set theory. Environ. Sci. Policy 2015, 54, 226–239. [Google Scholar]
  17. Zdzislaw, P. Rough Sets. Int. J. Comput. Inf. Sci. 1982, 11, 341–356. [Google Scholar] [CrossRef]
  18. Song, W.; Ming, X.; Wu, Z.; Zhu, B. A rough TOPSIS approach for failure mode and effects analysis in uncertain environments. Qual. Reliab. Eng. Int. 2014, 30, 473–486. [Google Scholar] [CrossRef]
  19. Shankarnarayan, V.K.; Ramakrishna, H. Paradigm change in Indian agricultural practices using big data: Challenges and Opportunities from field to plate. Inf. Process. Agric. 2020. [Google Scholar] [CrossRef]
  20. Mohanty, S.K.; Mishra, S. Regulatory reform and market efficiency: The case of Indian agricultural commodity futures markets. Res. Int. Bus. Financ. 2020, 52, 101145. [Google Scholar] [CrossRef]
  21. Barry, P.J.; Fraser, D.R. Risk Management in Primary Agricultural Production: Methods, Distribution, Rewards, and Structural Implications. Am. J. Agric. Econ. 2006, 58, 286. [Google Scholar] [CrossRef]
  22. Dadhwal, V.K.; Singh, R.P.; Dutta, S.; Parihar, J.S. Remote sensing based crop inventory: A review of Indian experience. Trop. Ecol. 2002, 43, 107–122. [Google Scholar]
  23. Pathak, H.; Pramanik, P.; Khanna, M.; Kumar, A. Climate change and water availability in Indian agriculture: Impacts and adaptation. Indian J. Agric. Sci. 2014, 84, 671–679. [Google Scholar]
  24. German, R.N.; Thompson, C.E.; Benton, T.G. Relationships among multiple aspects of agriculture’s environmental impact and productivity: A meta-analysis to guide sustainable agriculture. Biol. Rev. 2017, 92, 716–738. [Google Scholar] [CrossRef] [PubMed]
  25. Wagner, M.; Lewandowski, I. Relevance of environmental impact categories for perennial biomass production. Bioenergy 2016, 9, 215–228. [Google Scholar] [CrossRef] [Green Version]
  26. Krishna Kumar, K.; Rupa Kumar, K.; Ashrit, R.G.; Deshpande, N.R.; Hansen, J.W. Climate impacts on Indian agriculture. Int. J. Climatol. 2004, 24, 1375–1393. [Google Scholar] [CrossRef]
  27. ENVIS Centre. Environmental Information System. State of Environment and Related Issues. 2019. Available online: http://www.envis.nic.in/ (accessed on 25 June 2019).
  28. Zhang, Q.; Xie, Q.; Wang, G. A survey on rough set theory and its applications. CAAI Trans. Intell. Technol. 2016, 1, 323–333. [Google Scholar] [CrossRef]
  29. Skowron, A.; Dutta, S. Rough sets: Past, present, and future. Nat. Comput. 2018, 17, 855–876. [Google Scholar] [CrossRef] [Green Version]
  30. Vluymans, S.; D’eer, L.; Saeys, Y.; Cornelis, C. Applications of fuzzy rough set theory in machine learning: A survey. Fundam. Inform. 2015, 142, 53–86. [Google Scholar] [CrossRef] [Green Version]
  31. Skowron, A.; Jankowski, A. Rough sets and interactive granular computing. Fundam. Inform. 2016, 147, 371–385. [Google Scholar]
  32. Pawlak, Z.; Skowron, A. Rudiments of rough sets. Inf. Sci. 2007, 177, 3–27. [Google Scholar] [CrossRef]
  33. Skowron, A.; Suraj, Z. (Eds.) Rough Sets and Intelligent Systems-Professor Zdzisław Pawlak in Memoriam; Series Intelligent Systems Reference Library; Springer: Heidelberg, Germany, 2013; Volume 42–43. [Google Scholar]
  34. Li, Y.; Sun, M.; Yuan, G.; Zhou, Q.; Liu, J. Study on Development Sustainability of Atmospheric Environment in Northeast China by Rough Set and Entropy Weight Method. Sustainability 2019, 11, 3793. [Google Scholar] [CrossRef] [Green Version]
  35. Chang, T.-W.; Lo, H.-W.; Chen, K.-Y.; Liou, J.J.H. A novel FMEA model based on rough BWM and Rough TOPSIS-AL for Risk Assessment. Mathematics 2019, 7, 874. [Google Scholar] [CrossRef] [Green Version]
  36. He, Y.H.; Wang, L.B.; He, Z.Z.; Xie, M. A fuzzy TOPSIS and rough set based approach for mechanism analysis of product infant failure. Eng. Appl. Artif. Intel. 2016, 47, 25–37. [Google Scholar] [CrossRef]
  37. Berchoux, T.; Watmough, G.R.; Hutton, C.W.; Atkinson, P.M. Agricultural shocks and drivers of livelihood precariousness across Indian rural communities. Landsc. Urban Plan. 2019, 189, 307–319. [Google Scholar] [CrossRef]
  38. Vetter, S.H.; Sapkota, T.B.; Hillier, J.; Stirling, C.M.; Macdiarmid, J.I.; Aleksandrowicz, L.; Green, R.; Joy, E.J.M.; Dangour, A.D.; Smith, P. Greenhouse gas emission from agricultural food production to supply Indian diets: Implications for climate change mitigation. Agric. Ecosyst. Environ. 2017, 237, 234–241. [Google Scholar] [CrossRef] [Green Version]
  39. Sapkota, T.B.; Vetter, S.H.; Jat, M.L.; Sirohi, S.; Shirsath, P.B.; Singh, R.; Jat, H.S.; Smith, P.; Hillier, J.; Stirling, C.M. Cost-effective opportunities for climate change mitigation in Indian agriculture. Sci. Total Environ. 2019, 655, 1342–1354. [Google Scholar] [CrossRef]
  40. Choudhary, A.K. Technological and extension yield gaps in pulse crops in Mandi district of Himachal Pradesh, India. Indian J. Soil Conserv. 2013, 41, 88–98. [Google Scholar]
  41. Yadav, A.; Suri, V.K.; Kumar, A.; Choudhary, A.K.; Meena, A.L. Enhancing plant water relations, quality, and productivity of pea (Pisum sativum L.) through arbuscular mycorrhizal fungi, inorganic phosphorus, and irrigation regimes in an Himalayan acid Alfisol. Commun. Soil Sci. Plant Anal. 2015, 46, 80–93. [Google Scholar] [CrossRef]
  42. Sharma, D.P.; Singh, M.P.; Gupta, S.K.; Sharma, N.L. Response of pigeonpea to short-term water stagnation in a moderately sodic soil under field conditions. J. Indian Soc. Soil Sci. 2005, 53, 243–248. [Google Scholar]
  43. Pooniya, V.; Choudhary, A.K.; Dass, A.; Bana, R.S.; Rana, K.S.; Rana, D.S.; Tyagi, V.K.; Puniya, M.M. Improved crop management practices for sustainable pulse production: An Indian perspective. Indian J. Agric. Sci. 2015, 85, 747–758. [Google Scholar]
  44. Raut, R.D.; Gardas, B.B.; Kharat, M.; Narkhede, B. Modeling the drivers of post-harvest losses–MCDM approach. Comput. Electron. Agric. 2018, 154, 426–433. [Google Scholar] [CrossRef]
  45. Modi, P.; Mishra, D.; Gulati, H.; Murugesan, K. Uttarakhand state cooperative federation: Can it help the horticulture farmers? Vision 2009, 13, 53–61. [Google Scholar] [CrossRef]
  46. Negi, S.; Anand, N. Supply chain of fruits & vegetables’ agribusiness in Uttarakhand (India): Major issues and challenges. J. Supply Chain Manag. Syst. 2015, 4, 43–57. [Google Scholar]
  47. Van Roekel, J.; Willems, S.; Boselie, D.M. Agri-supply chain management: To stimulate cross-border trade in developing countries and emerging economies. World Bank Pap. Cross Bord. Agri Supply Chain Manag. 2002, 1–28. [Google Scholar]
  48. Singh, S.P.; Sikka, B.K.; Singh, A. Supply chain management and Indian fresh produce supply chain: Opportunities and challenges. In Proceedings of the International Food & Agribusiness Management Association, 19th Annual World Symposium, Budapest, Hungary, 20–23 June 2009. [Google Scholar]
  49. McDermott, J.; Wyatt, A.J. The role of pulses in sustainable and healthy food systems. Ann. N. Y. Acad. Sci. 2017, 1392, 30–42. [Google Scholar] [CrossRef] [PubMed] [Green Version]
Figure 1. Framework for rough AHP-TOPSIS (Analytical Hierarchy Process-Technique for Order Preference by Similarity to Ideal Solution) based Rabi season crop pattern selection.
Sustainability 12 04562 g001
Figure 2. Basic notation of rough set theory.
Sustainability 12 04562 g002
Figure 3. Weights of criteria by AHP and rough-AHP methods.
Sustainability 12 04562 g003
Figure 4. Rank of the alternatives by AHP-TOPSIS and rough AHP-TOPSIS.
Sustainability 12 04562 g004
Table 1. Criteria for selecting crop pattern in terms of sustainable agriculture.
NoCriteriaBrief DescriptionLiterature
1Economic factorThe economic factor is one of three major factors of sustainable agriculture. It accounts for all the economic aspects that are involved in agricultural practices.Shankarnarayan & Ramakrishna [19]; Mohanty & Mishra [20]
2Water tariffIt’s one of the sub-criteria of the economic factor. Water tariff is the cost of water that is assigned by the Government.Qureshi et al. [8]
3Crop valueCrop value is a part of the economic factor, which tells the value of a crop in the local and global market at one time.Sydorovych & Wossink [13]
4Crop demandIt measures the requirement of a particular crop in the local and global markets.Qureshi et al. [8]
5Crop inventoryPrice variability risks are more associated with the crop inventory. The fluctuations in the agricultural market challenge the forecast of crop inventory.Barry&Fraser, [21]; Dadhwal et al. [22]
6Agricultural management practicesThis factor accounts for all the processes from sowing seeds until the harvesting.Nambiar et al. [11]
7Irrigation methodsThis is a part of agricultural management practice which illustrates the type of irrigation method (surface, sub-surface, drip, sprinkler) that will be suitable for a particular crop.Qureshi et al. [8]
8Cultivation methodsIt is a sub-criteria of agricultural management practices. It covers all the processes other than irrigation.Nambiar et al. [11]
9AvailabilityThis factor indicates the availability of all the factors that are necessary for sustainable agricultural practices.Sydorovych & Wossink [13]
10Water availabilityThe quantity of water for agriculture in India shows a progressive increase over the years as more and more areas are brought under irrigation.H Pathak et al. [23]
11Soil qualityInitial practice to improve soil quality is very costly for a farmer for the first year, but a continuous following of organic farming over a period of time can contribute to high yielding, and also preserves the soil for further cultivation. Vermicompost generated by earthworms gives us plenty of opportunities to utilize the soil for sustainable farming for the crops.Yadav et al. [15]
12Water qualityWater quality is one of the most important ecological components for measuring agricultural sustainability.Sydorovych & Wossink [13]
13Environmental impactSoil erosion; acidification potential; abiotic depletion potential; terrestrial ecotoxicity; freshwater ecotoxicity; marine water ecotoxicity; and polluted water.German et al. [24]; Wagner & Lewandowski [25]
14Climatic conditionsGlobal warming potential; photochemical ozone creation potential; ozone depletion potential; and heavy rainfallKrishna et al. [26]; Wagner & Lewandowski [25]; Qureshi et al. [8]
Table 2. Summary of literature related to sustainable agriculture.
ReferencesMethodApplication
Adewale Johnson Alonge [9]Population sample, data collection, and data analysisTo assess how much the farmers in Iowa adopt sustainable agriculture practices.
Chandre et al. [10]Normalized rank approachTo find the Agriculture Sustainability Index (ASI).
Nambiar et al. [11]Indicator and rating systemTo find the Agriculture Sustainability Index (ASI).
Krishna Kumar et al. [26]Statistics of crop data and climate data were used to analyze.To find out the relationship between the crops of both Kharif and Rabi season with respect to climate change.
Zhen et al. [12]Setting up the threshold values of site-specific indicators.To assess the socio-institutional and environmental aspects of major cropping systems.
Sydorovych & Wossink [13]Method of conjoint analysisAggregation on sustainable agriculture.
Yadav et al. [15]Systematic literature reviewHow Organic farming helps to improvise the crop yield, soil fertility.
German et al. [24]Used meta-analysis to assess the relationships between multiple measures of sustainabilityProvide strong evidence of the relationship between yield and negative externalities created by farming
Nageswararao et al. [7]Calculating the correlation coefficient.To measure the impact of climate variability in the growth of Rabi season crops.
Qureshi et al. [8]AHP-TOPSIS methodTo find the crop pattern of sustainable agriculture.
Table 3. AHP pairwise comparison chart.
Intensity of ImportanceExplanation
1Equal importance
2Weak or slight
3Moderate importance
4Moderate plus
5Strong importance
6Strong plus
7Very strong importance
8Very, very strong importance
9Extreme importance
Table 4. Value of Random Integers (RI) based on rank of the matrix (Satty and Vargas, 2012).
n12345678910
RI000.520.891.111.251.351.401.451.49
Table 5. Hierarchal structure for the selection of Rabi crop pattern.
GoalCriteriaSub-CriteriaAlternatives
Selection of Crop PatternEconomic FactorCrop DemandBarley
Crop ValueGram
Crop InventoryRabi Cereals
Water TariffRabi Fruits
Agriculture Management PracticesIrrigation MethodsRabi Pulses
Cultivation MethodsRabi Spices
AvailabilityWater AvailabilityRabi Vegetables
Water QualityWheat
Soil Quality
Environmental FactorClimatic Condition
Rainfall
Table 6. TOPSIS performance rating scale.
CriteriaScore ValuesDefinition
Crop demand, crop value, water tariff, crop inventory, water requirement, soil quality, water quality, climatic conditions, rainfall1Very low
2Low
3Moderate
4High
5Very high
Irrigation methods1Sprinkle irrigation
2Drip irrigation
3Sub-surface irrigation
4Surface irrigation
Cultivation methods1Low care
2Medium care
3High care
Table 7. Weights of criteria and sub-criteria.
CriteriaCriteria WeightSub-CriteriaSub-Criteria WeightGlobal Weight
LimitsLU LULU
Crop Demand0.731.000.140.23
Economic0.190.23Crop Value0.720.930.130.22
Crop Inventory0.270.340.050.08
Water Tariff0.090.110.020.02
Agr mgt Prac0.390.48Irrigation0.500.790.190.37
Cultivation0.661.000.250.48
Water Availability0.630.890.570.89
Availability0.891.00Soil Quality0.671.000.591.00
Water Quality0.220.260.190.26
Environmental0.100.13Climatic Condition0.941.000.090.13
Rainfall0.140.140.010.02
Table 8. Distance of alternatives from Positive Ideal Solution (PIS) and Negative Ideal Solution (NIS).
Distanced+D−
Wheat0.990.92
Gram0.990.92
Barley1.120.67
Rabi Spices0.890.97
Rabi Cereals0.871.14
Rabi Vegetables0.991.05
Rabi Pulses0.811.08
Rabi Fruits0.771.01
Table 9. Closeness coefficient (Ci) and rank of the alternatives.
DistanceCloseness Coefficient (Ci)Rank
Wheat0.487
Gram0.486
Barley0.388
Rabi Spices0.524
Rabi Cereals0.563
Rabi Vegetables0.515
Rabi Pulses0.571
Rabi Fruits0.562

