Aging Society and the Selected Aspects of Environmental Threats: Evidence from Poland


1
Department of Regional Economy, Wroclaw University of Economics and Business, Nowowiejska 3, 58-500 Jelenia Góra, Poland
2
Department of Quality and Environmental Management; Wroclaw University of Economics and Business, Nowowiejska 3, 58-500 Jelenia Góra, Poland
*
Author to whom correspondence should be addressed.
Sustainability 2020, 12(11), 4648; https://0-doi-org.brum.beds.ac.uk/10.3390/su12114648
Submission received: 29 April 2020
/
Revised: 3 June 2020
/
Accepted: 4 June 2020
/
Published: 6 June 2020
(This article belongs to the Special Issue Socio-Environmental Vulnerability Assessment for Sustainable Management)
Abstract
:The article addresses problems of population aging in Poland and the selected environmental hazards exerting a negative impact on seniors’ health. The introduction presents the reasons underlying the above-mentioned aging process and provides the characteristics of the primary environmental threats. The next part covers the most important trends and indicators related to the demographic situation in the country. The core of the study is focused on presenting and interpreting the results of empirical research on the periodization of the population aging process in Poland, in the years 2004–2019, using the multidimensional statistical analysis method including, in particular, the data classification method. The key demographic factors differentiating the development phases of the population aging process include, in order of their significance: longer life expectancy of the population, narrowed gross reproduction rate, declining birth rate, and total migration balance. In addition, the article provides the analysis of the selected environmental threats’ impact on population aging in Poland, among which the following were indicated: high temperatures, solar conditions, heavy rainfall, strong winds, droughts, and fires. Moreover, the process of longer life expectancy in fine health is essentially related to two issues: the level of medical care, with particular attention paid to check-ups and preventive measures, and the promotion of a healthy lifestyle. In summary, it should be highlighted that the elimination of all pollutants or the reasons of environmental hazards is not possible; however, the actions primarily focused on reducing the emission of harmful gases into the atmosphere and other forms of environmental pollution should definitely be taken.
1. Introduction
Population aging is a problem which affects the vast majority of European countries, including Poland. It can be viewed that this phenomenon represents a specific sign of our times—we live longer, whereas the fertility rate remains at a relatively low level. The activities focused on the intensification of pro-family policy and the allocation of parental benefits, which is also taking place in Poland, stand for natural remedial undertakings in this respect. Unfortunately, as the previous analyses have shown, such actions, even though expensive, are not very effective. The financial factor is significant; however, it is not the most important one in the context of family planning and the number of offspring. The approach to private life and professional careers of the members of Polish families seems to be more important nowadays. In addition to the typical social support and financial transfers, the promotion of a large family model, strengthened by the system of discounts and promotions offered by both public and private sector entities, can turn out effective.
The aforementioned aging is a process difficult to put a halt to, let alone reverse. Therefore, the care offered to seniors has to be enhanced. Special programs should be developed to support and activate the elderly as well as provide them with medical services at a satisfactory level. When investigating the positive aspects of the described aging situation, the process of increasing the average life expectancy in Poland can be recognized as one of them, which, indeed, results from the improvement in the level of provided health care over the years. Life expectancy continues to grow practically all the time since the beginning of the transformation period in the 90s. Effective activities carried out by the non-governmental organizations represent an important factor activating seniors [1]. These activities are perceived as an important socio-economic phenomenon manifested in creating development perspectives for the poorer part of the society [2] and participation in shaping the current socio-economic policy [3]. In other words, Non-Government Organizations (NGOs) in Poland, in addition to the business and local government sector, remain an inseparable component, acting as the creators of development processes. It should be noted that their activity is not yet as dynamic as those in the United States or Western European countries [4].
The purpose of the study is to present the phenomena and processes related to the problem of population aging in Poland from various perspectives. This subject matter is considered highly important and current in the subject literature. [5,6]. The added value of the presented research is addressing simultaneously the environmental threats affecting both life and health of the society and, in particular, of the elderly. The main focus of the article was placed on empirical research covering the issue of periodization regarding population aging in Poland, in the years 2004–2019, using the multidimensional statistical analysis method, mainly including the data classification method. The study has the following structure: an introduction, an overview of the selected publications, the aging society in numbers, an impact of selected environmental threats on the aging society, methodology, main results, a discussion, and conclusions. In summary, the conclusions and recommendations were presented based on the conducted studies and analyses.
2. Literature Review
Social stratification is a phenomenon correlated with population aging and poverty. It often affects older people who cannot cope with the rapidly changing market milieu in the country. It is not possible to talk about sustainable development [7] when a significant part of the society persists at risk of poverty. Social wealth and stability are not evidenced by a narrow group of the rich, but a broad and strong middle class capable of covering senior citizens with proper care and creating fair conditions for their existence. It should be emphasized that despite an undeniable socio-economic development of Poland [8], low unemployment rate at the level of 5.2% at the end of 2019, calculated according to the methodology of the Statistics Poland, the scale of stratification has not improved significantly. For example, a higher standard of living in large cities (in terms of Polish conditions) is not always followed by an improved functioning in smaller ones, inhabited by the majority of the country population. Social stratification itself is associated with a number of other adverse phenomena, e.g., poverty, social exclusion, addictions, crime, hereditary unemployment, low social activity, and entrepreneurship.
The already mentioned sustainable development [9,10] can be defined, for the purposes of this study, as the process of transformations which ensures meeting the needs of the present generation, taking into account intergenerational justice [11], as a result of performing integrated activities in the social, economic, environmental, spatial, institutional, and political dimensions [11,12,13,14]. The initiators of sustainable development include society, entrepreneurs, the world of science, and public authorities [15] with the support of good governance by NGOs [16]. Good governance stands for, in simple terms, undertaking and implementing correct decisions, involving the stakeholders, and paying attention to social interest and consensus. In this context, openness, participation, responsibility, efficiency, and coherence are of high importance. In other words, good governance represents effective strategic management in the public sector, taking into account participation and social consensus [17]. In terms of sustainable development, the natural environment remains its base, the economy stands for its tool, and well-being along with high quality of social life are the goals of taking respective actions [18]. The important components of the sustainable development concept, reducing the use of renewable resources to the level defined by the capacity of restoring them [19], include limiting the use of non-renewable resources within the scale, allowing their gradual replacement by the appropriate substitutes [20]. In addition, it is important to eliminate consistently the hazardous and toxic substances from economic processes and maintain emissions within the limits set by the carrying capacity in the environment. Biodiversity should be restored and holistically protected at the landscape, ecosystem [21], genic, and species levels.
Polish society is faced with aging in the times of environmental threats. Among the most important hazards the following can be listed: atmospheric air pollution, water pollution, waste pollution, soil degradation, still unsolved problem of asbestos in the natural environment, noise and vibration predominantly in urban areas [22], radiation hazard, increasing carbon dioxide level, and depletion of natural resources. In addition, the threats [23] either directly or indirectly related to climate change [24] include more frequent occurrence of high temperatures (global warming), sudden floods and inundations caused by heavy rainfall, increased incidence of intensive gales, and higher frequency of droughts and the resulting fires.
The aforementioned facts can be supplemented with the species threatened with extinction and the loss of biodiversity. The latter phenomenon has particularly negative consequences, because biodiversity is the basis of ecosystems’ existence and functioning [25], which we all benefit from. Care for the natural environment and biodiversity is one of the basic factors for counteracting poverty in third world countries. Furthermore, biodiversity is the basis of sustainable development and economic growth in developed countries [26].
A separate problem is the phenomenon of deforestation [27], i.e., the process of shrinking share of forest areas in the given total area [28], usually as a result of anthropopressure, which is visible through an excessive economic use of forests or environmental pollution [29]. Deforestation can lead to floods, droughts, landslides, and mudslides. In Poland, due to the fact that the forest area is slowly expanding, this phenomenon seems to be under control.
Industry is one of the economy sectors focused on the exploitation and processing of natural resources on a massive scale into products intended to meet human needs. The above-mentioned industry is often indicated as the factor most responsible for environmental degradation. Its negative impact is actually wide and varied [30] and is listed as follows: emission and deposition of gaseous, dust, and aerosol pollutants; direct and indirect soil degradation, acidification, and alkalization; impact on the well-being and life of plants, animals, and humans; destruction of fixed assets and anthropogenic capital through accelerated corrosion and degradation of surface layers; heavy metals emission and deposition in the natural environment, primarily in food; pollution and degradation of surface and underground waters; degradation of sea and ocean waters; emission of electromagnetic and ionizing radiation; noise emissions; acoustic climate disturbances; degradation of non-economic values of the environment, landscape, recreation and leisure; solid waste emissions and surface destruction; land consumption of industrial production; industrial disasters posing high environmental risks [31]; excessive demand for raw materials, energy, and other natural resources; thermal pollution of the natural environment; degradation of basic natural capital, climate, ozone layer. Moreover, agriculture also has a negative impact on the level of pollution [32]. Using artificial fertilizers, plant protection substances, and products improving the structure of arable land affects the accumulation of toxic substances in the natural environment, e.g., pesticides, nitrates, arsenic, cyanides, and heavy metals such as mercury and lead.
As the above examples show, practically all the presented phenomena adversely affect both human life and health, also having a particularly negative impact on the elderly. The accumulation of the described phenomena requires taking up comprehensive remedial actions by public authorities [33] supported by the private sector and the already mentioned non-governmental organizations.
3. Aging Society in Numbers
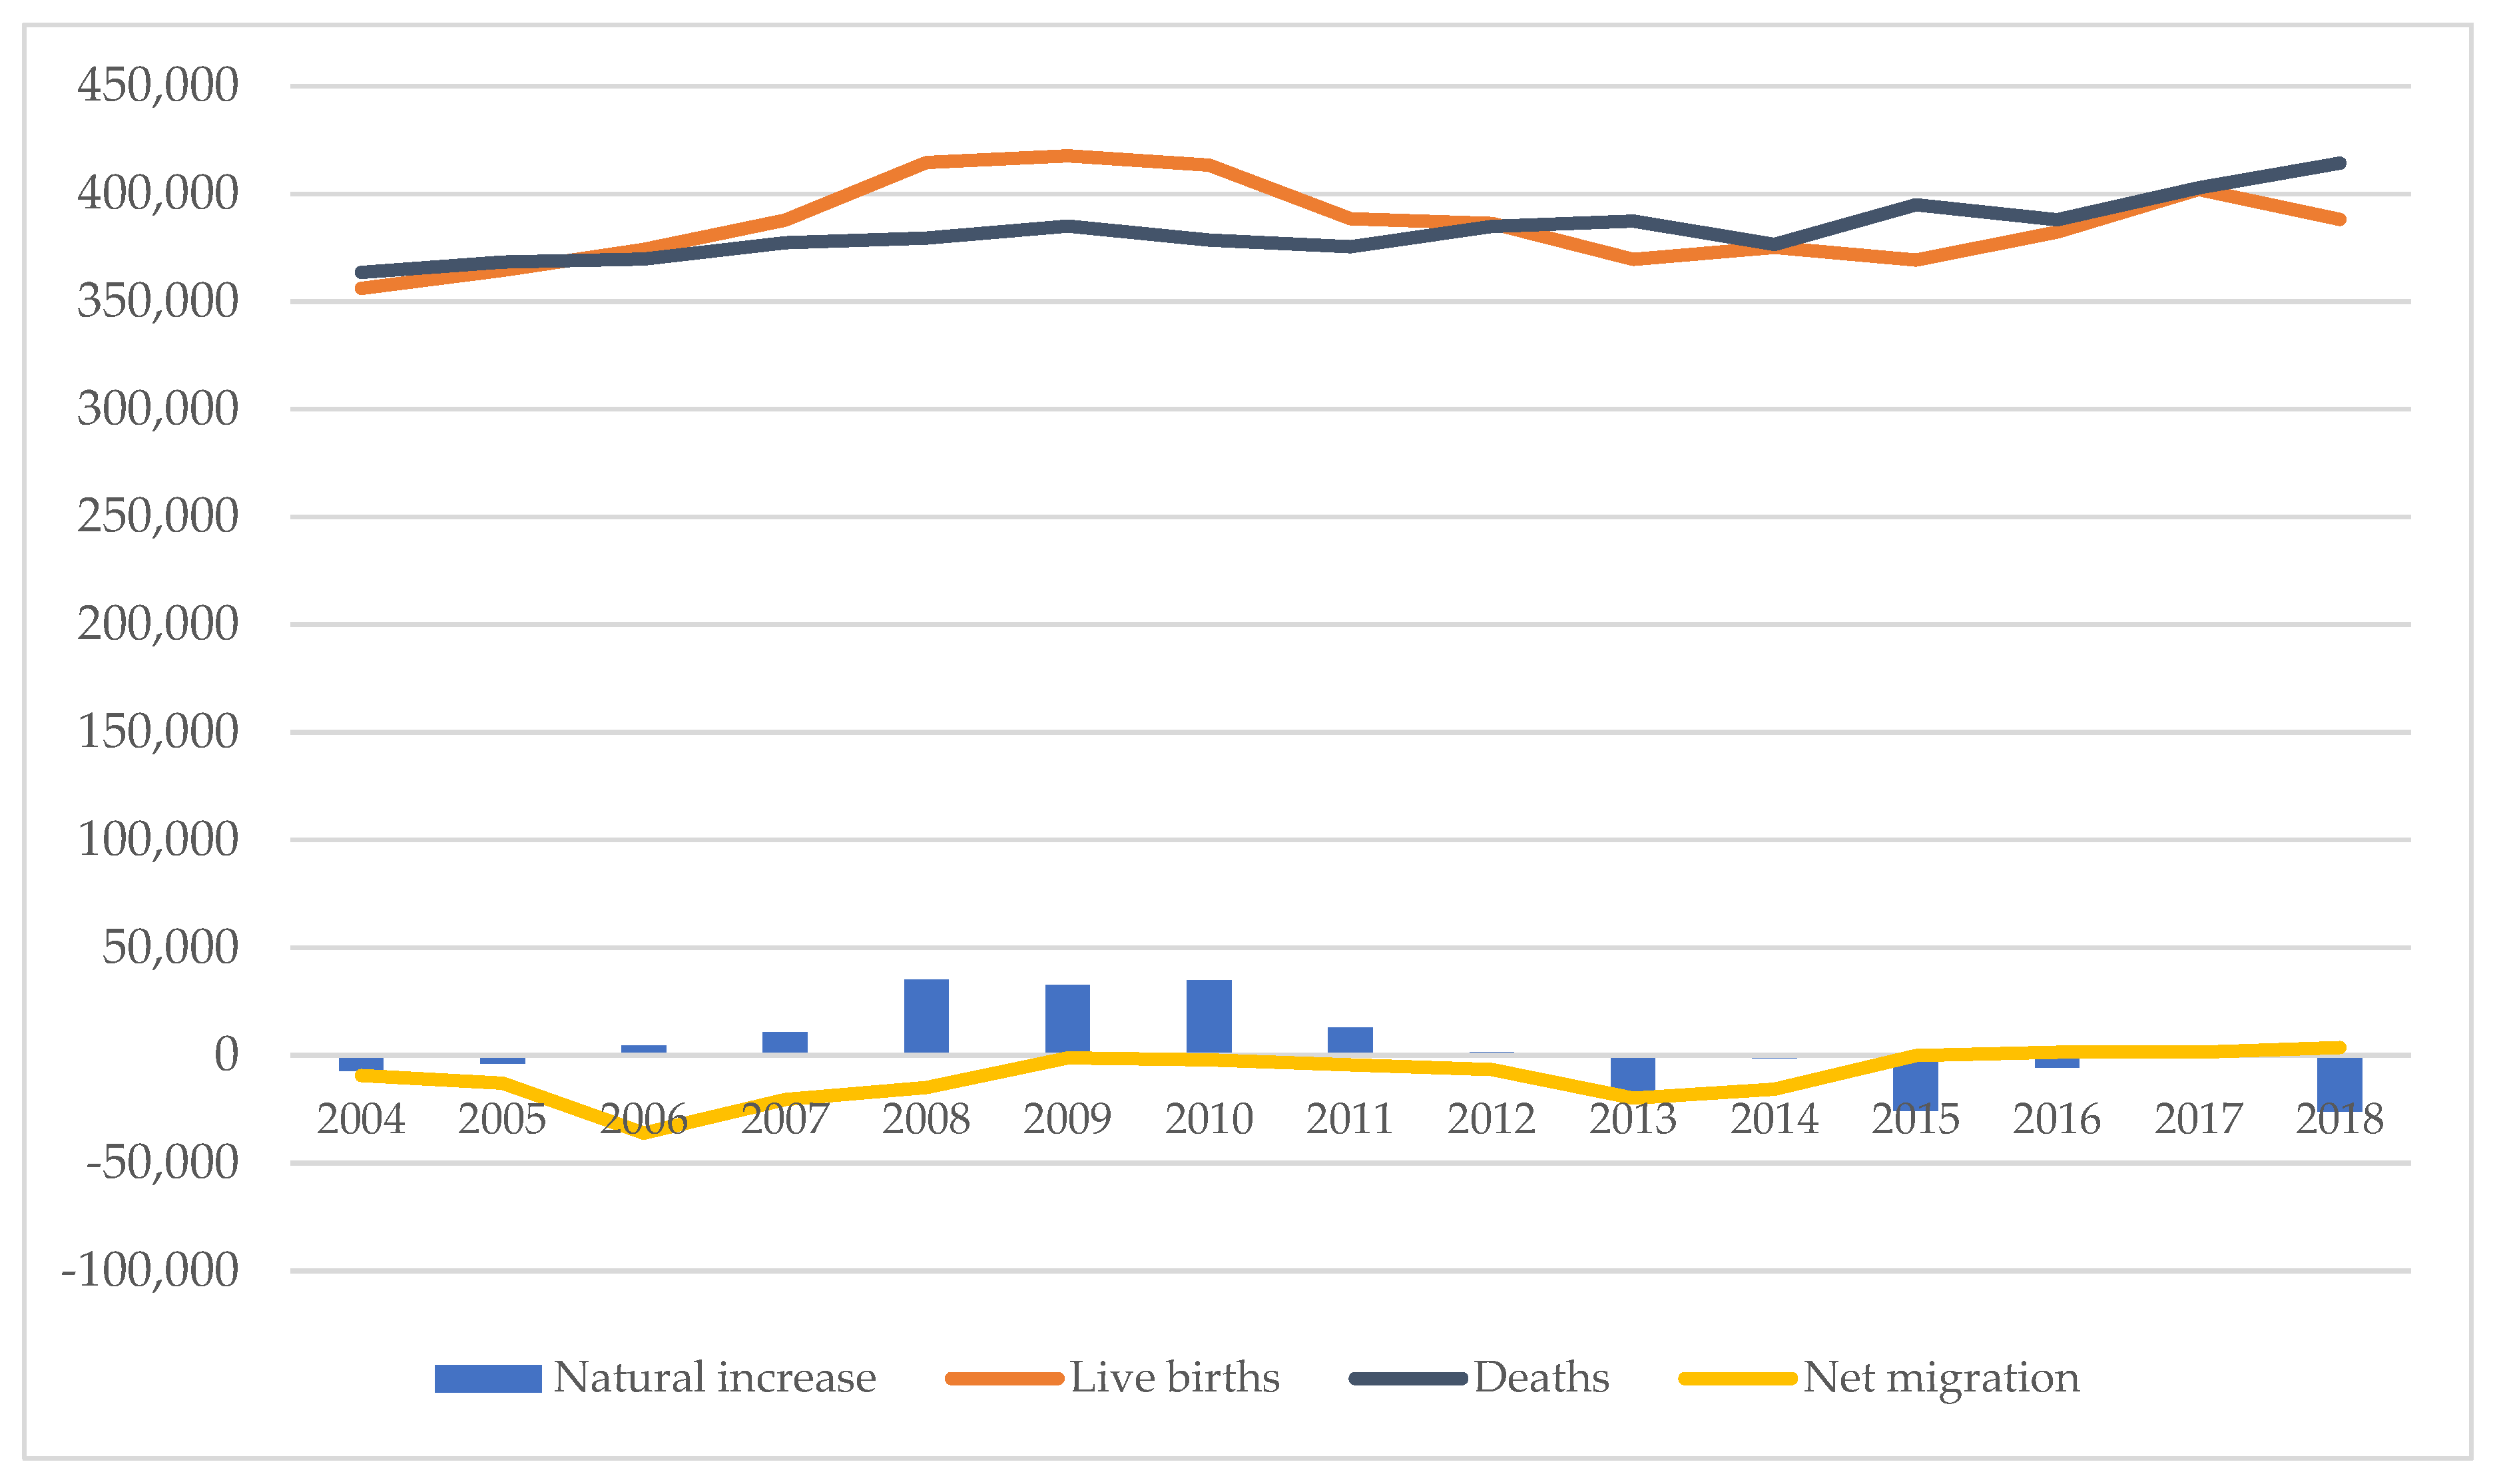
Figure 1 presents basic information about the population dynamics and net migration in Poland in the years 2004–2018. The analysis of the natural increase rate shows that its value can be divided into three phases. In the years 2004–2005, it was negative. In the course of the next phase, covering the years 2006–2012, its values were positive. In the period 2013–2018, it presented negative values yet again. Taking into account the entire analyzed period, it can be observed that this indicator value was characterized by a downward trend.
The number of live births was systematically growing in 2004–2009. Next, in the period 2010–2013, it went down and then up again in the subsequent years. Taking into account the entire analyzed period, the discussed indicator was characterized by an upward trend. Its average annual value amounted to almost 386,000.
The death rate value was also characterized by an increasing tendency. Its average annual value was over 383,000. The value of net migration, in the years 2004–2014, showed a negative value. In the following years the indicator presented a positive value.
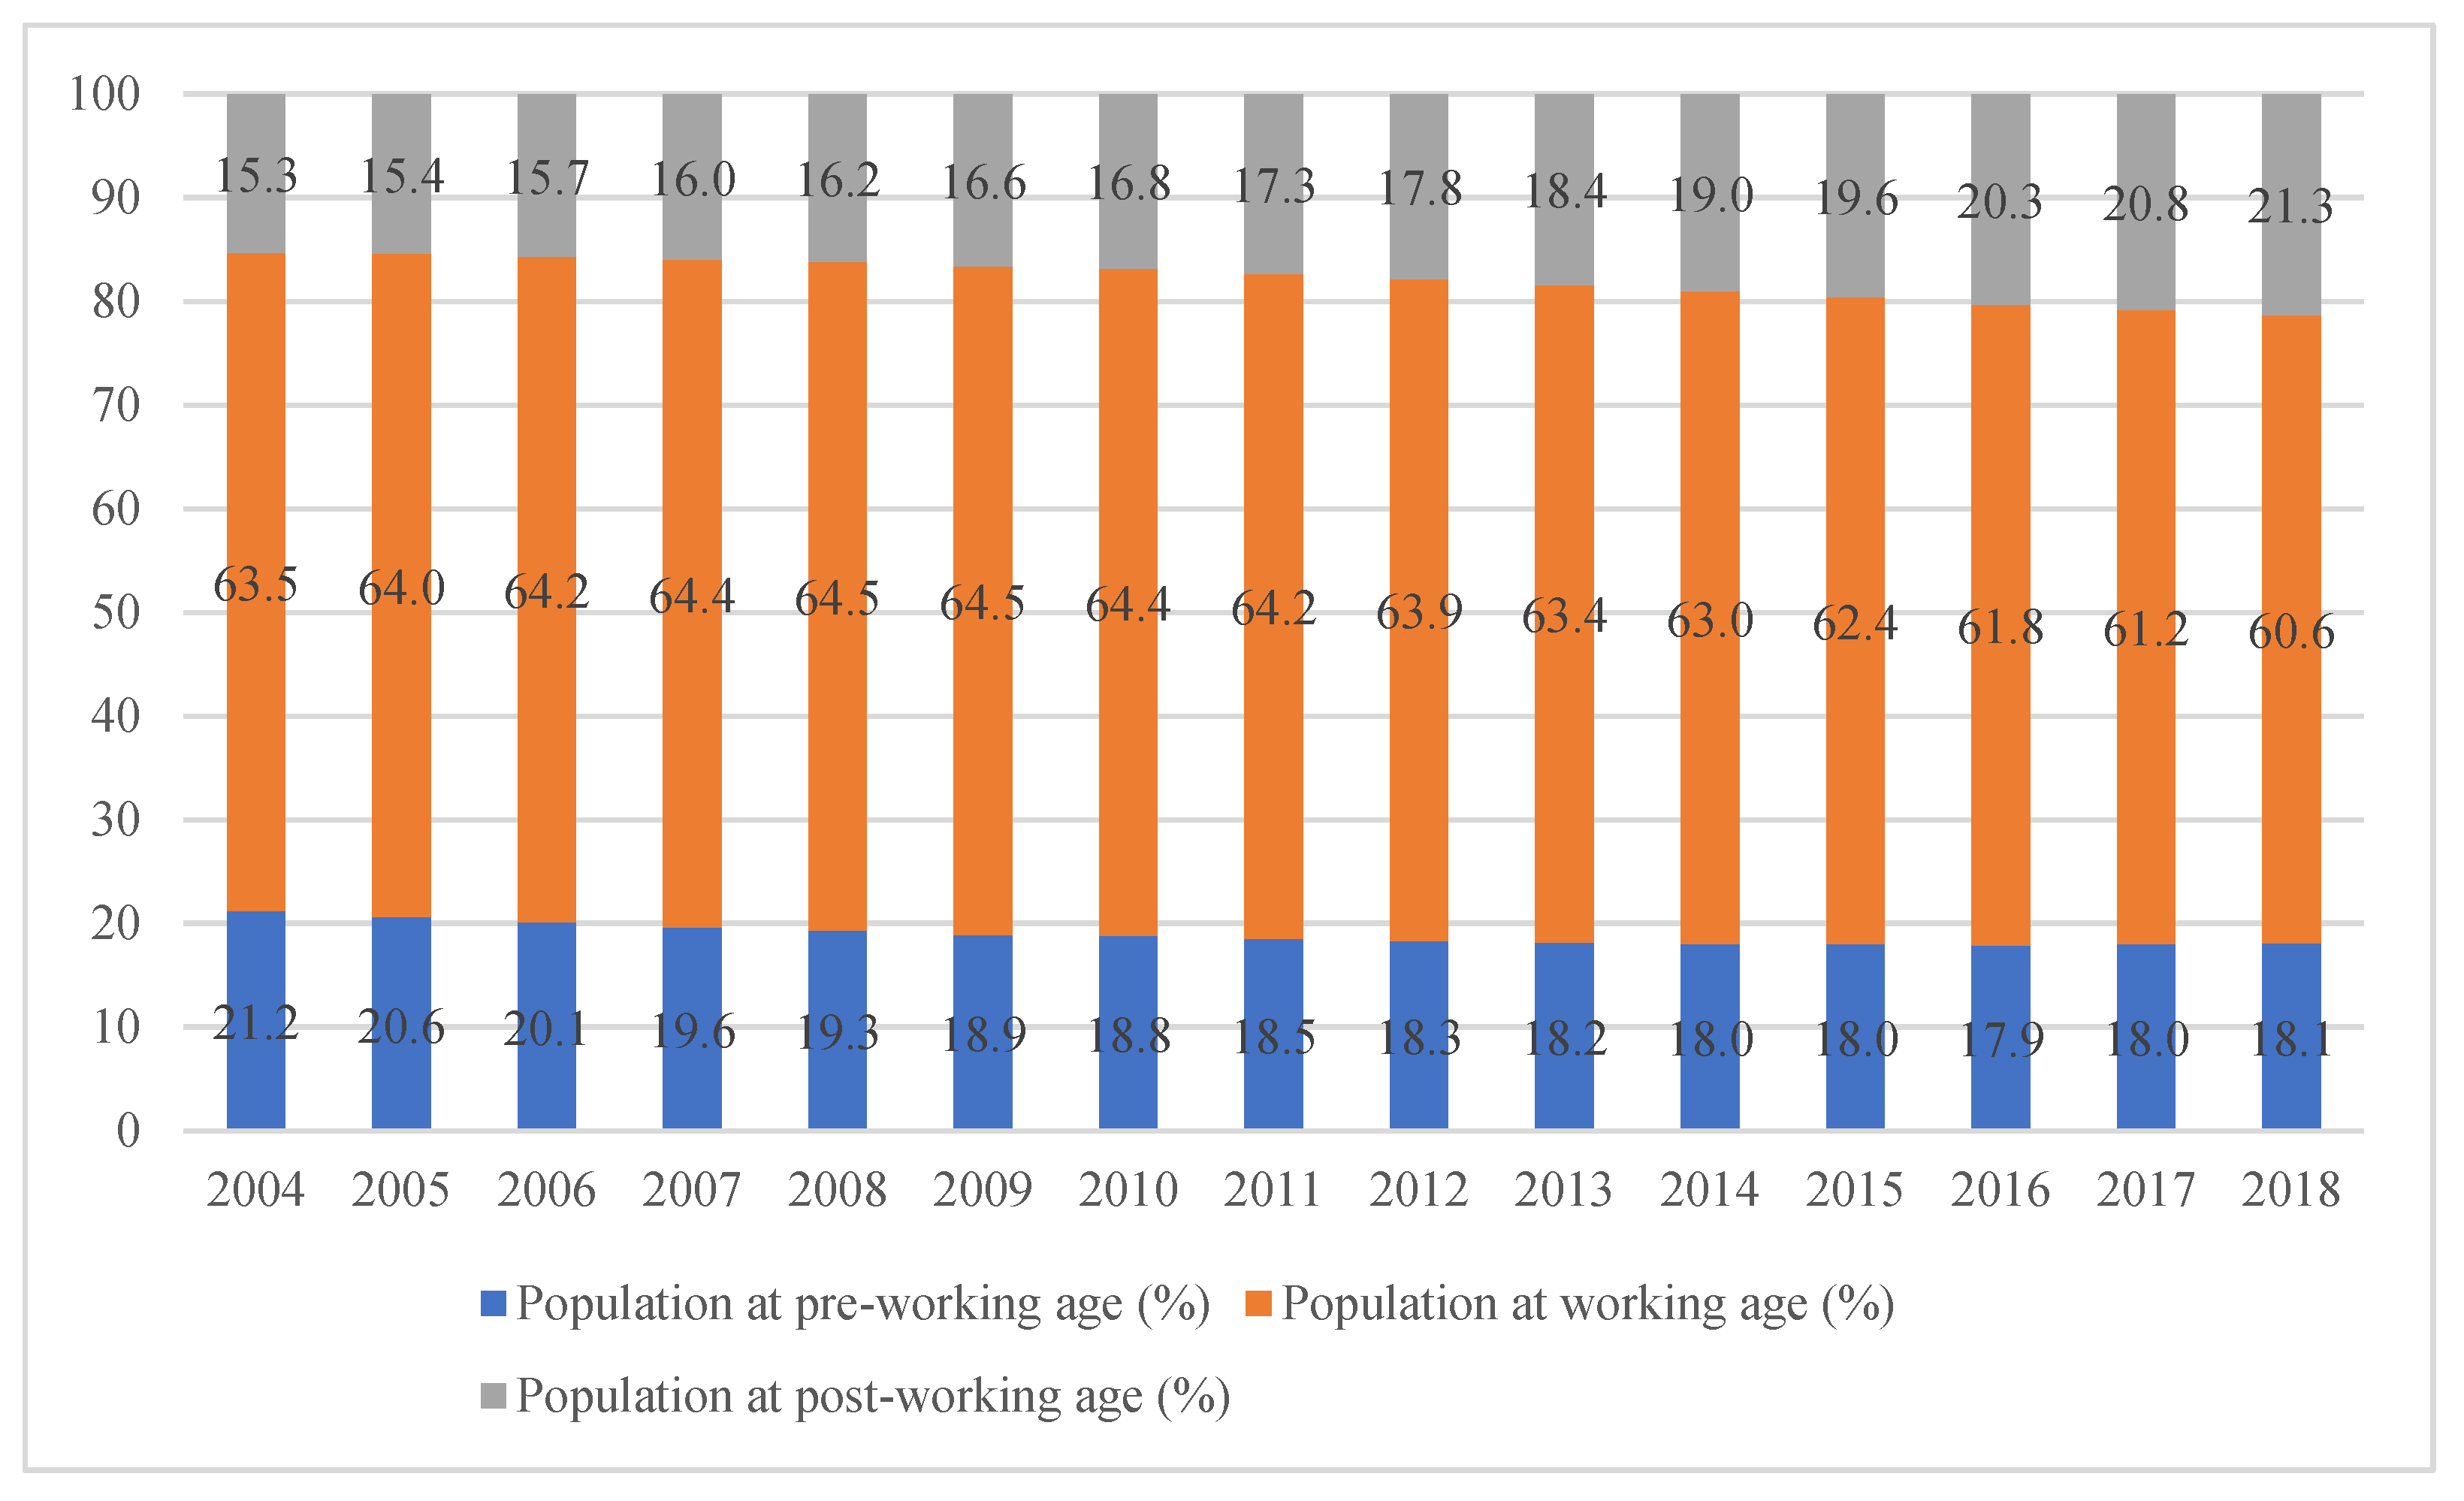
An ongoing population aging in Poland can be observed by analyzing population structure based on economic age groups (Figure 2). The share of post-working age population was systematically increasing year by year. In the analyzed period, this increase amounted to as much as 6% points. In turn, the share decline was recorded in the other two groups. The share of the working age population dropped by 2.9% points, and the share of pre-working age population was lower by 3.1% points.
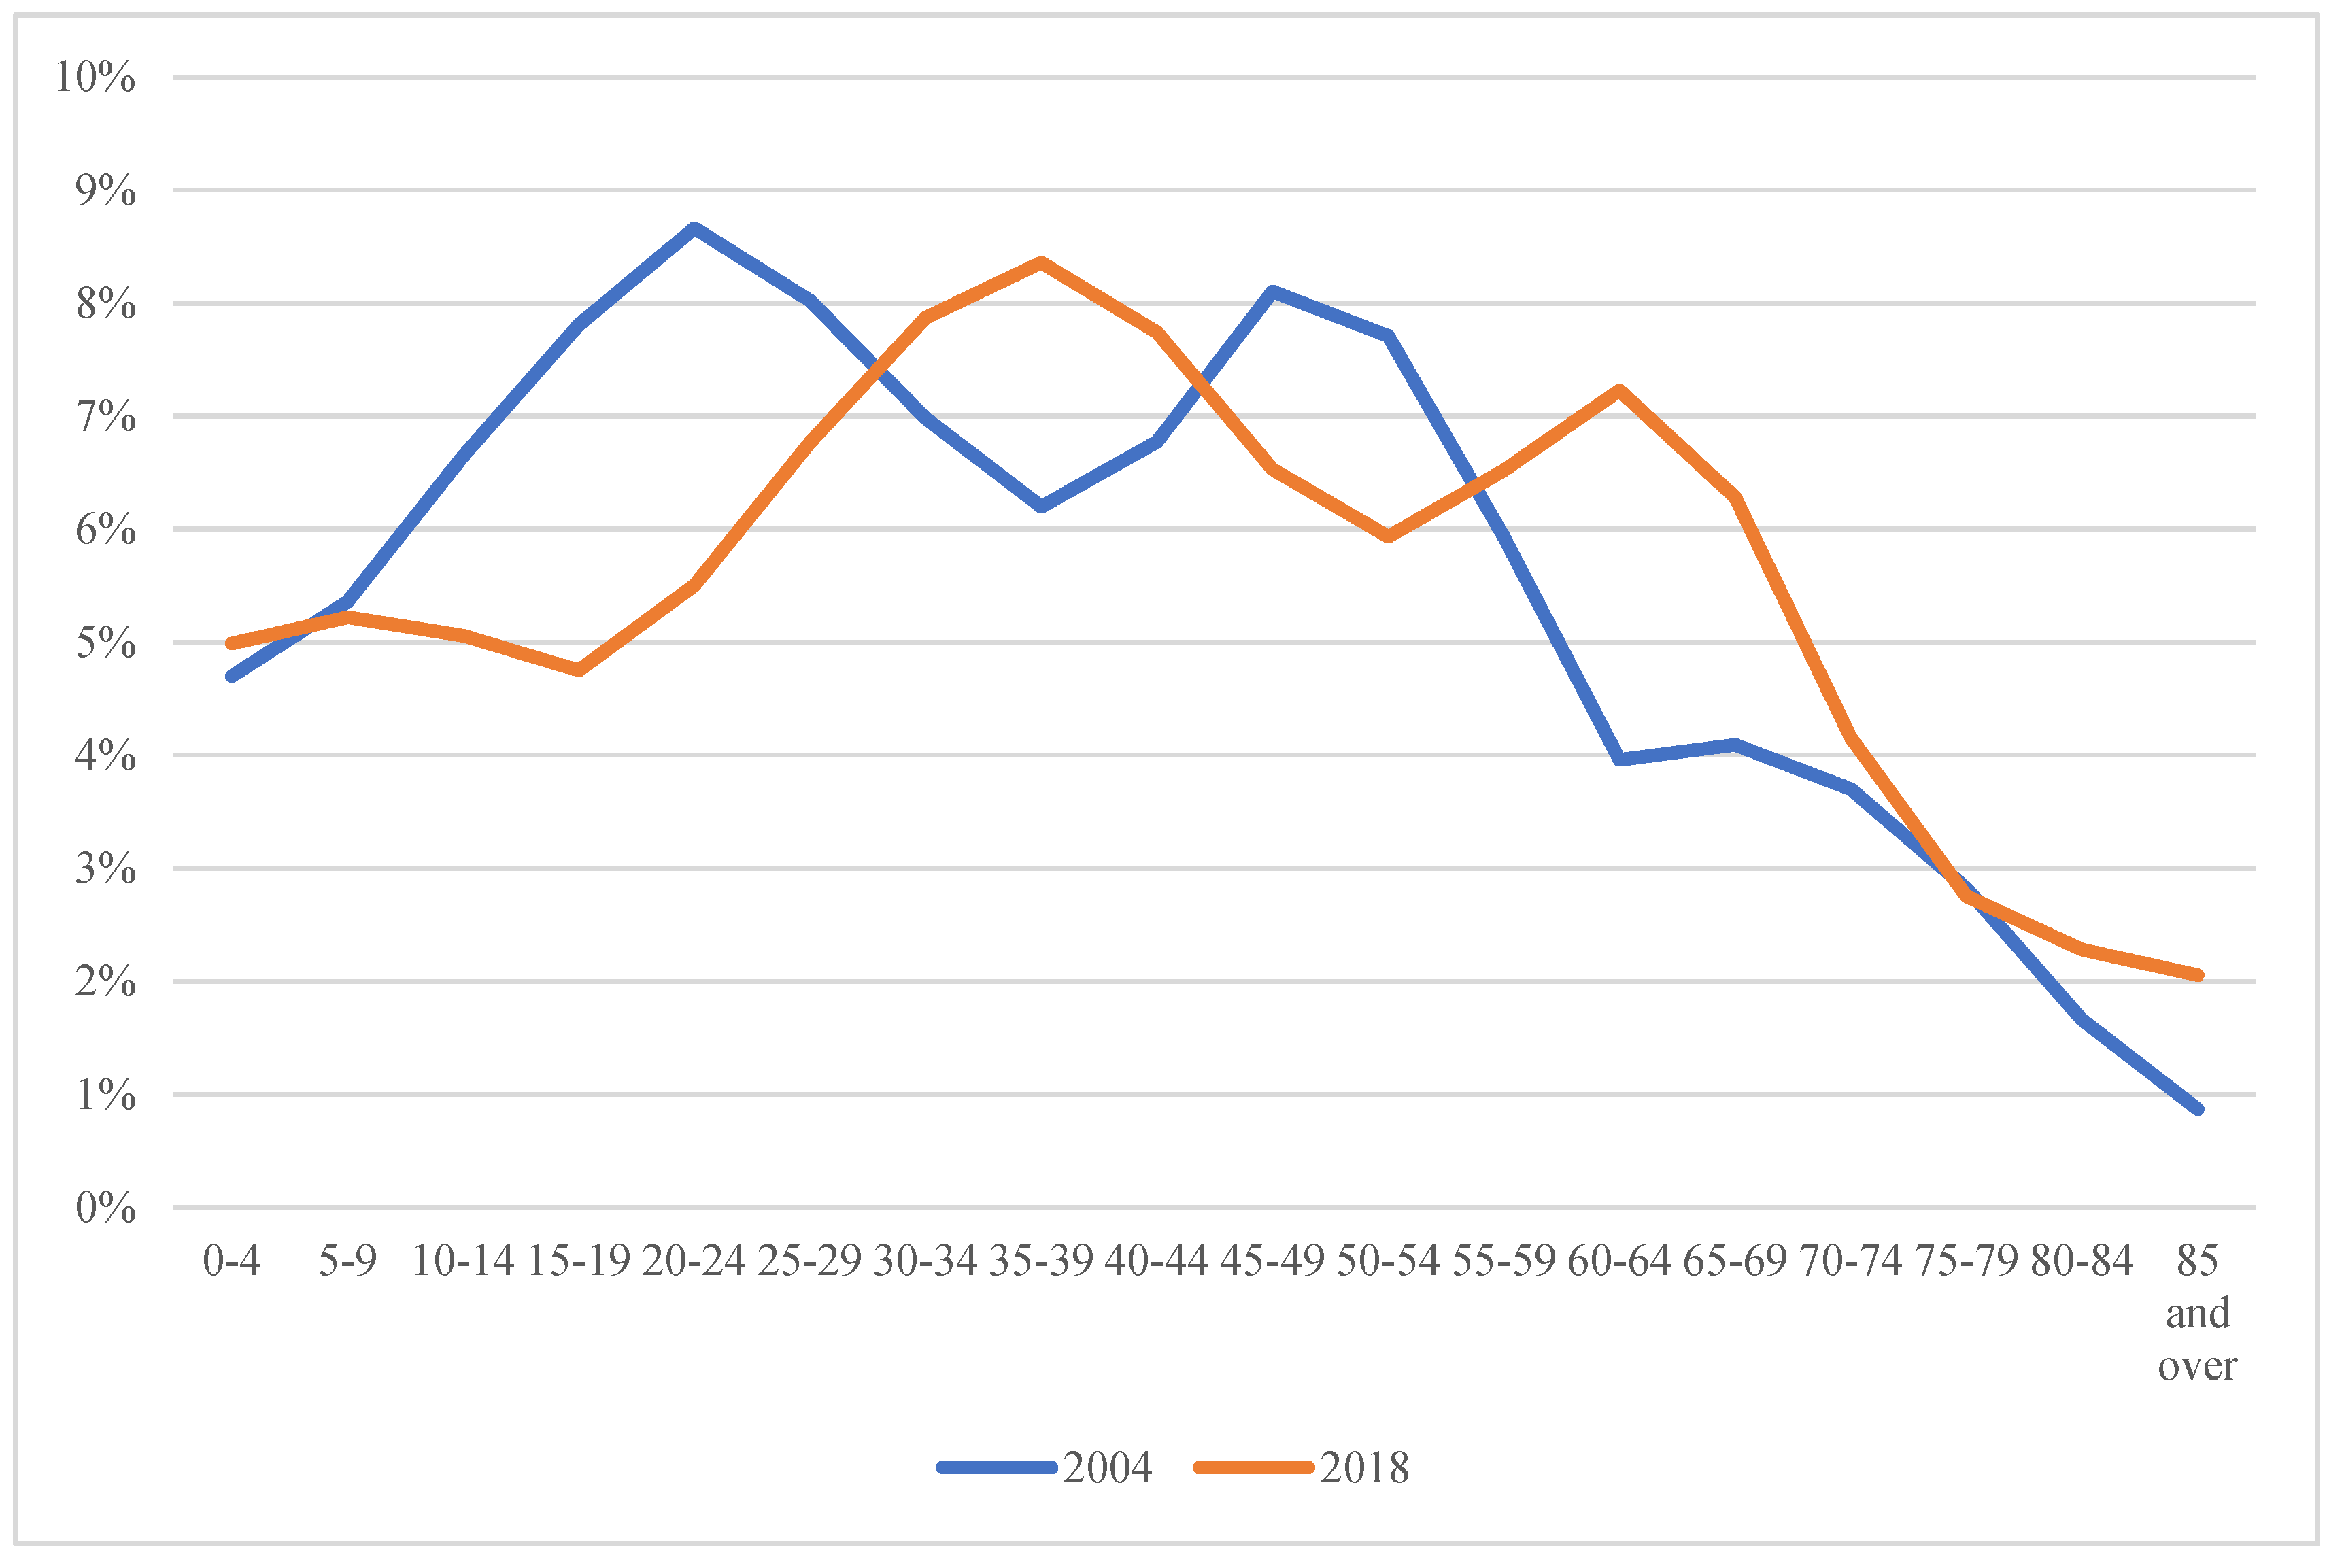
Polish society aging was also confirmed by analysing population shares in individual age groups in 2004 and 2018 (Figure 3). In 2018 against 2004, the share of the population aged 55 and over definitely increased, whereas the share of the population aged 85 and over doubled.
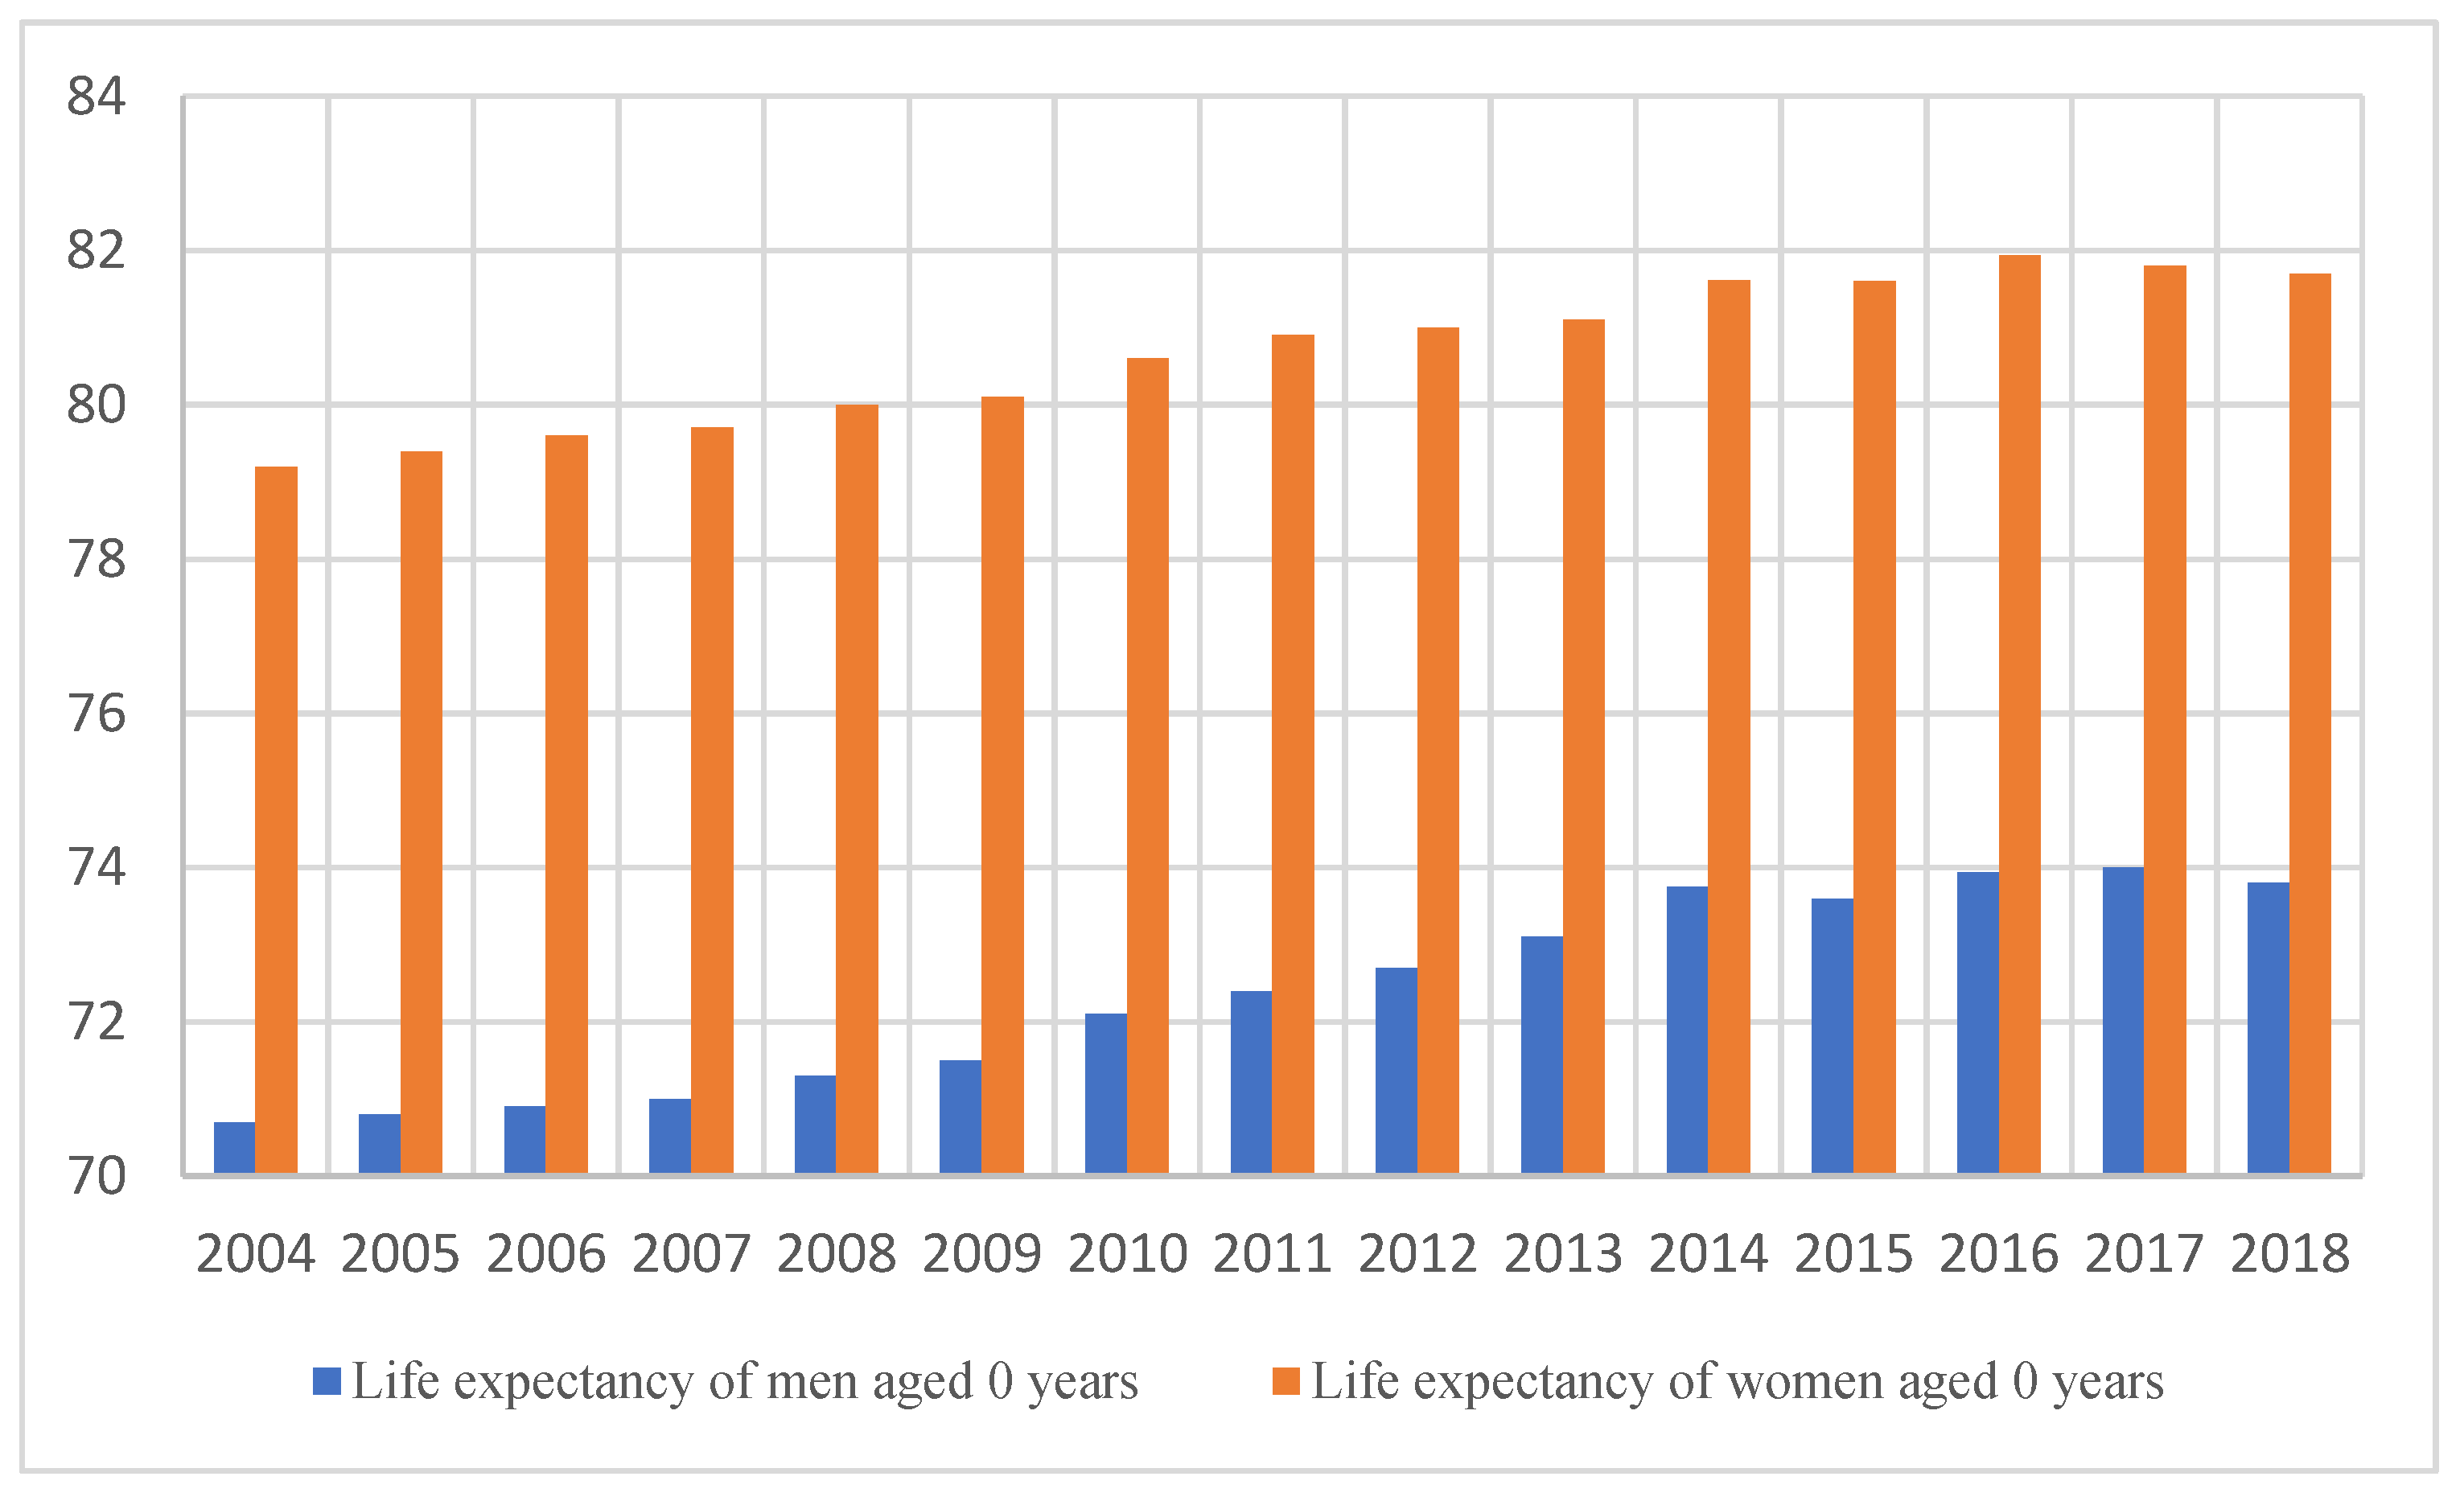
Polish society aging can also be confirmed by analysing life expectancy at birth (Figure 4). This value went up for both women and men. In the case of women, life expectancy was 2.5 years and 3.1 years for men. It should be emphasized, however, that the maximum value for women was reached in 2016 and for men a year later. The values of both indicators show an upward trend. In the case of men, this increase was higher and amounted to almost 3 months on average per year, whereas for women the average annual increase was 2 months.
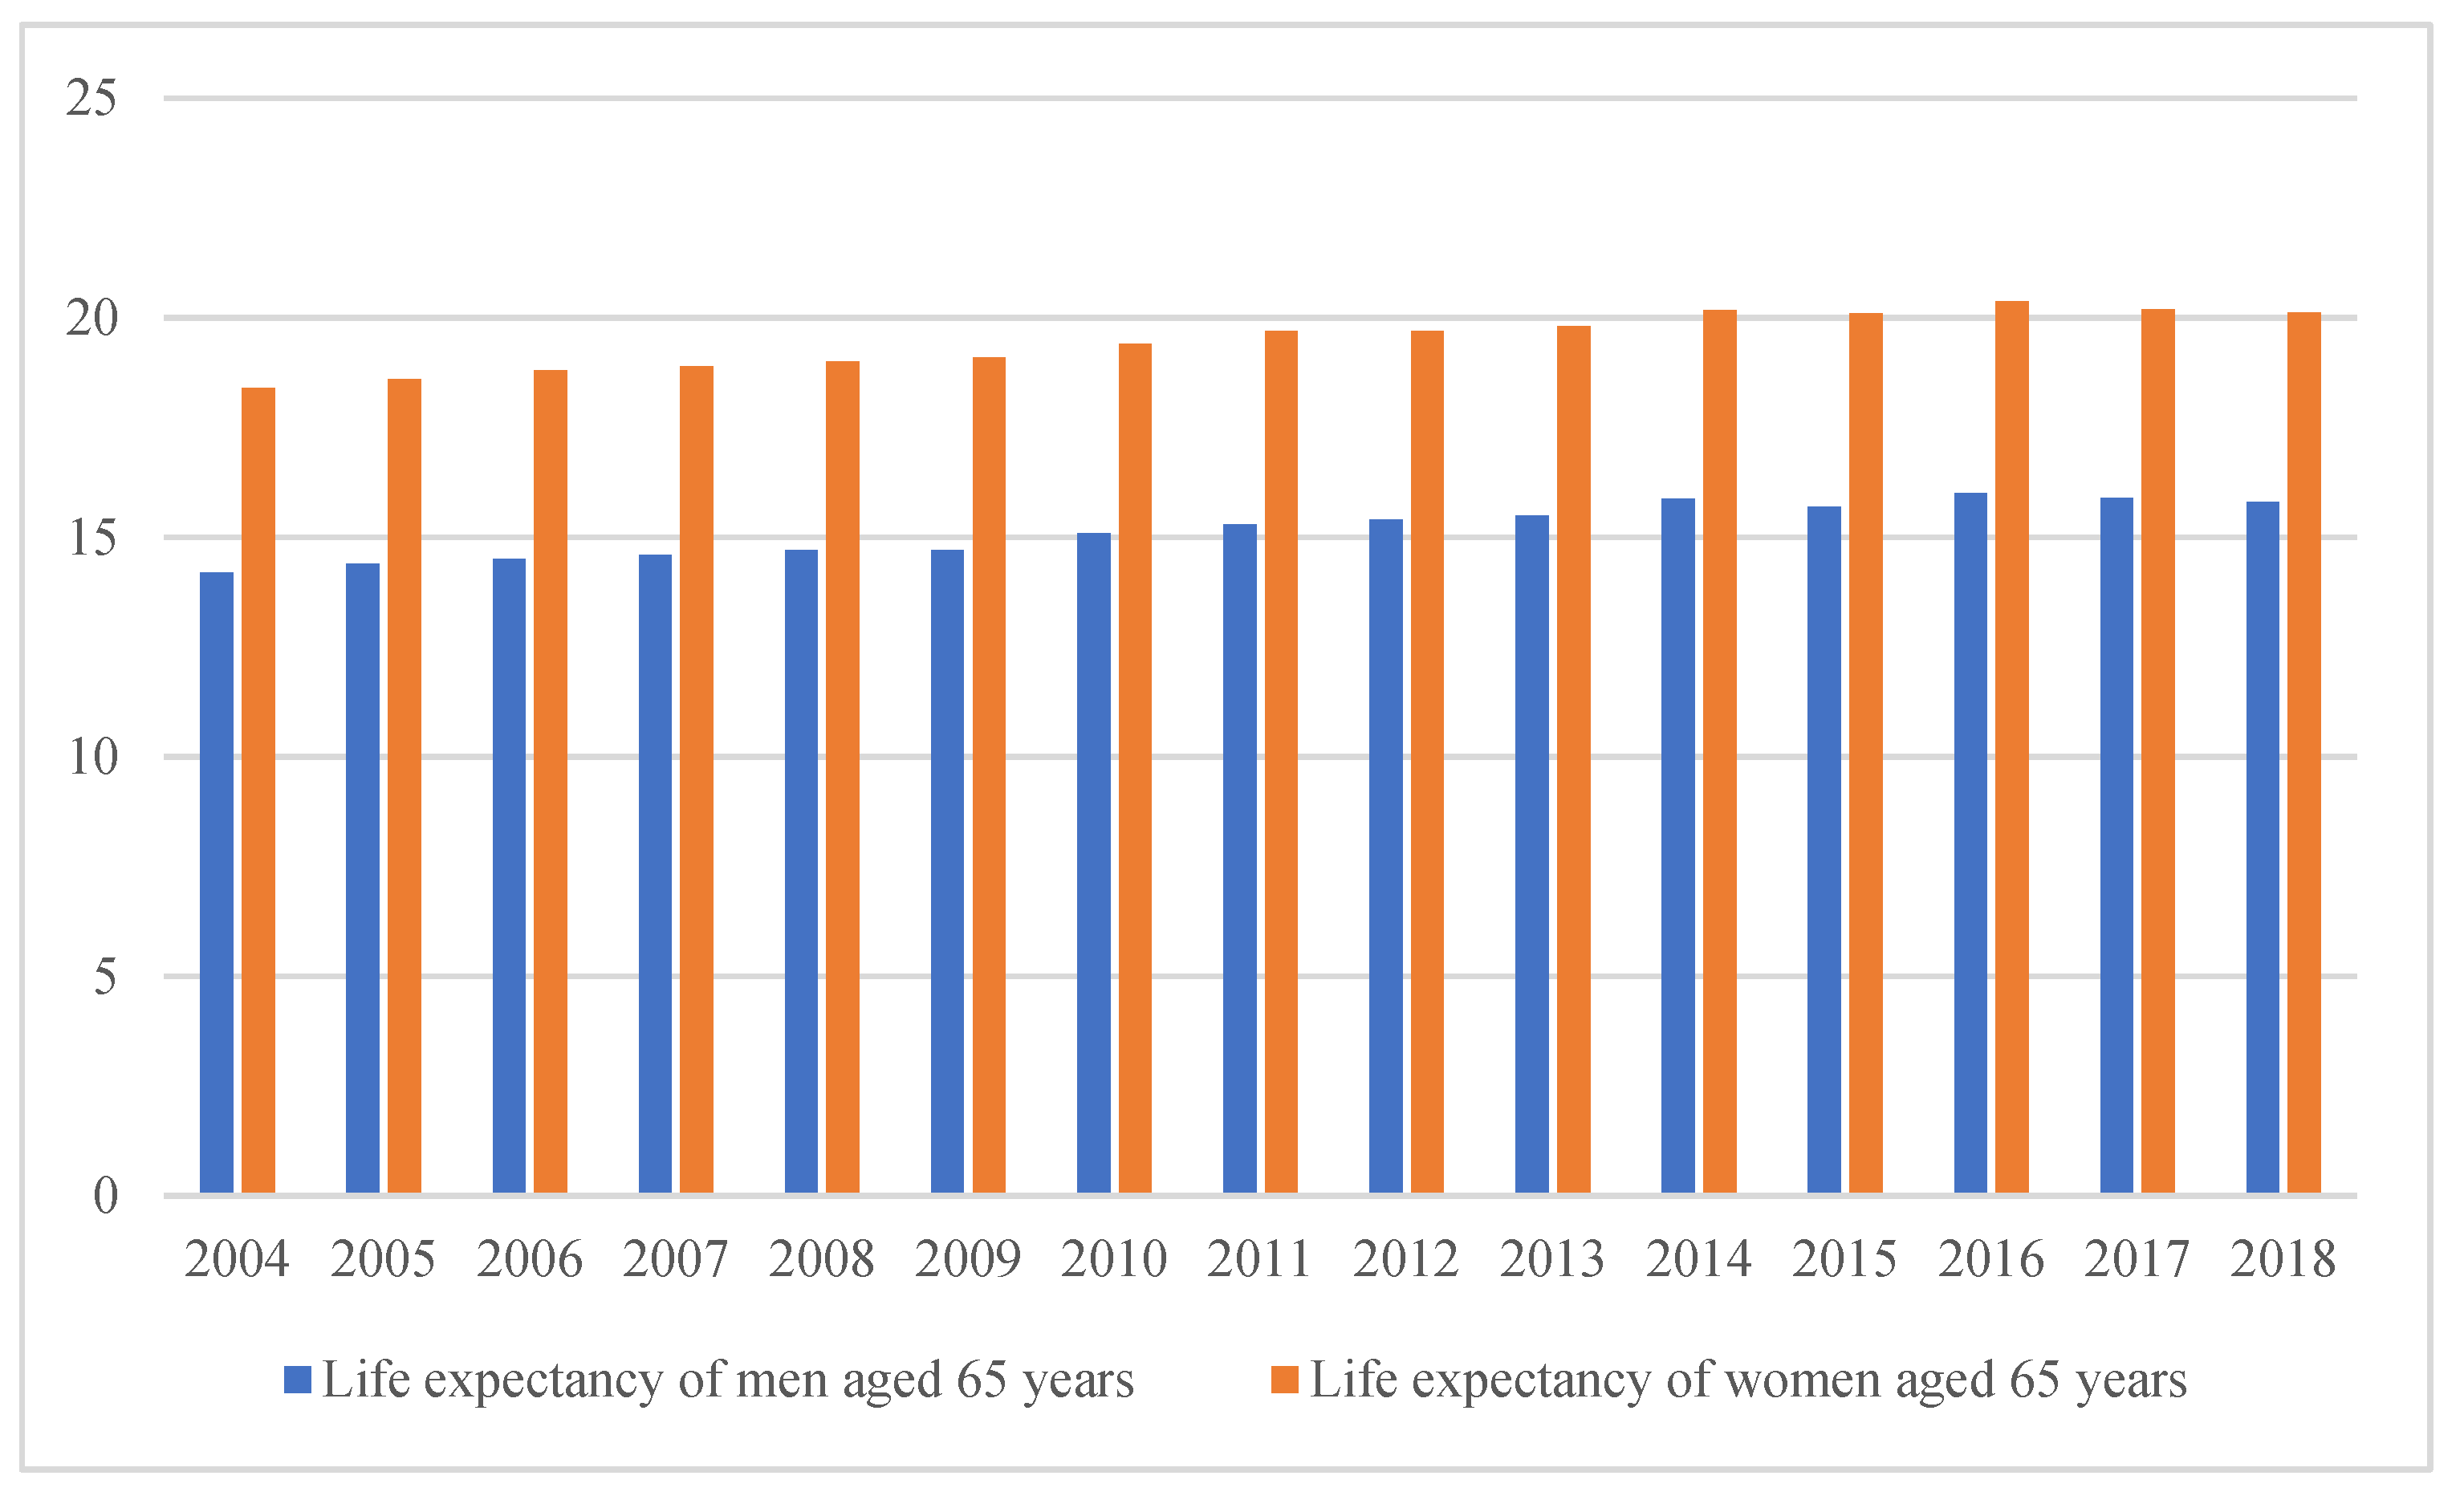
Life expectancy of the population aged 65 and over was also increasing (Figure 5). In the analyzed period, in the case of women, this increase was 1.7 years, and 1.6 years for men. In both cases an upward trend was recorded.
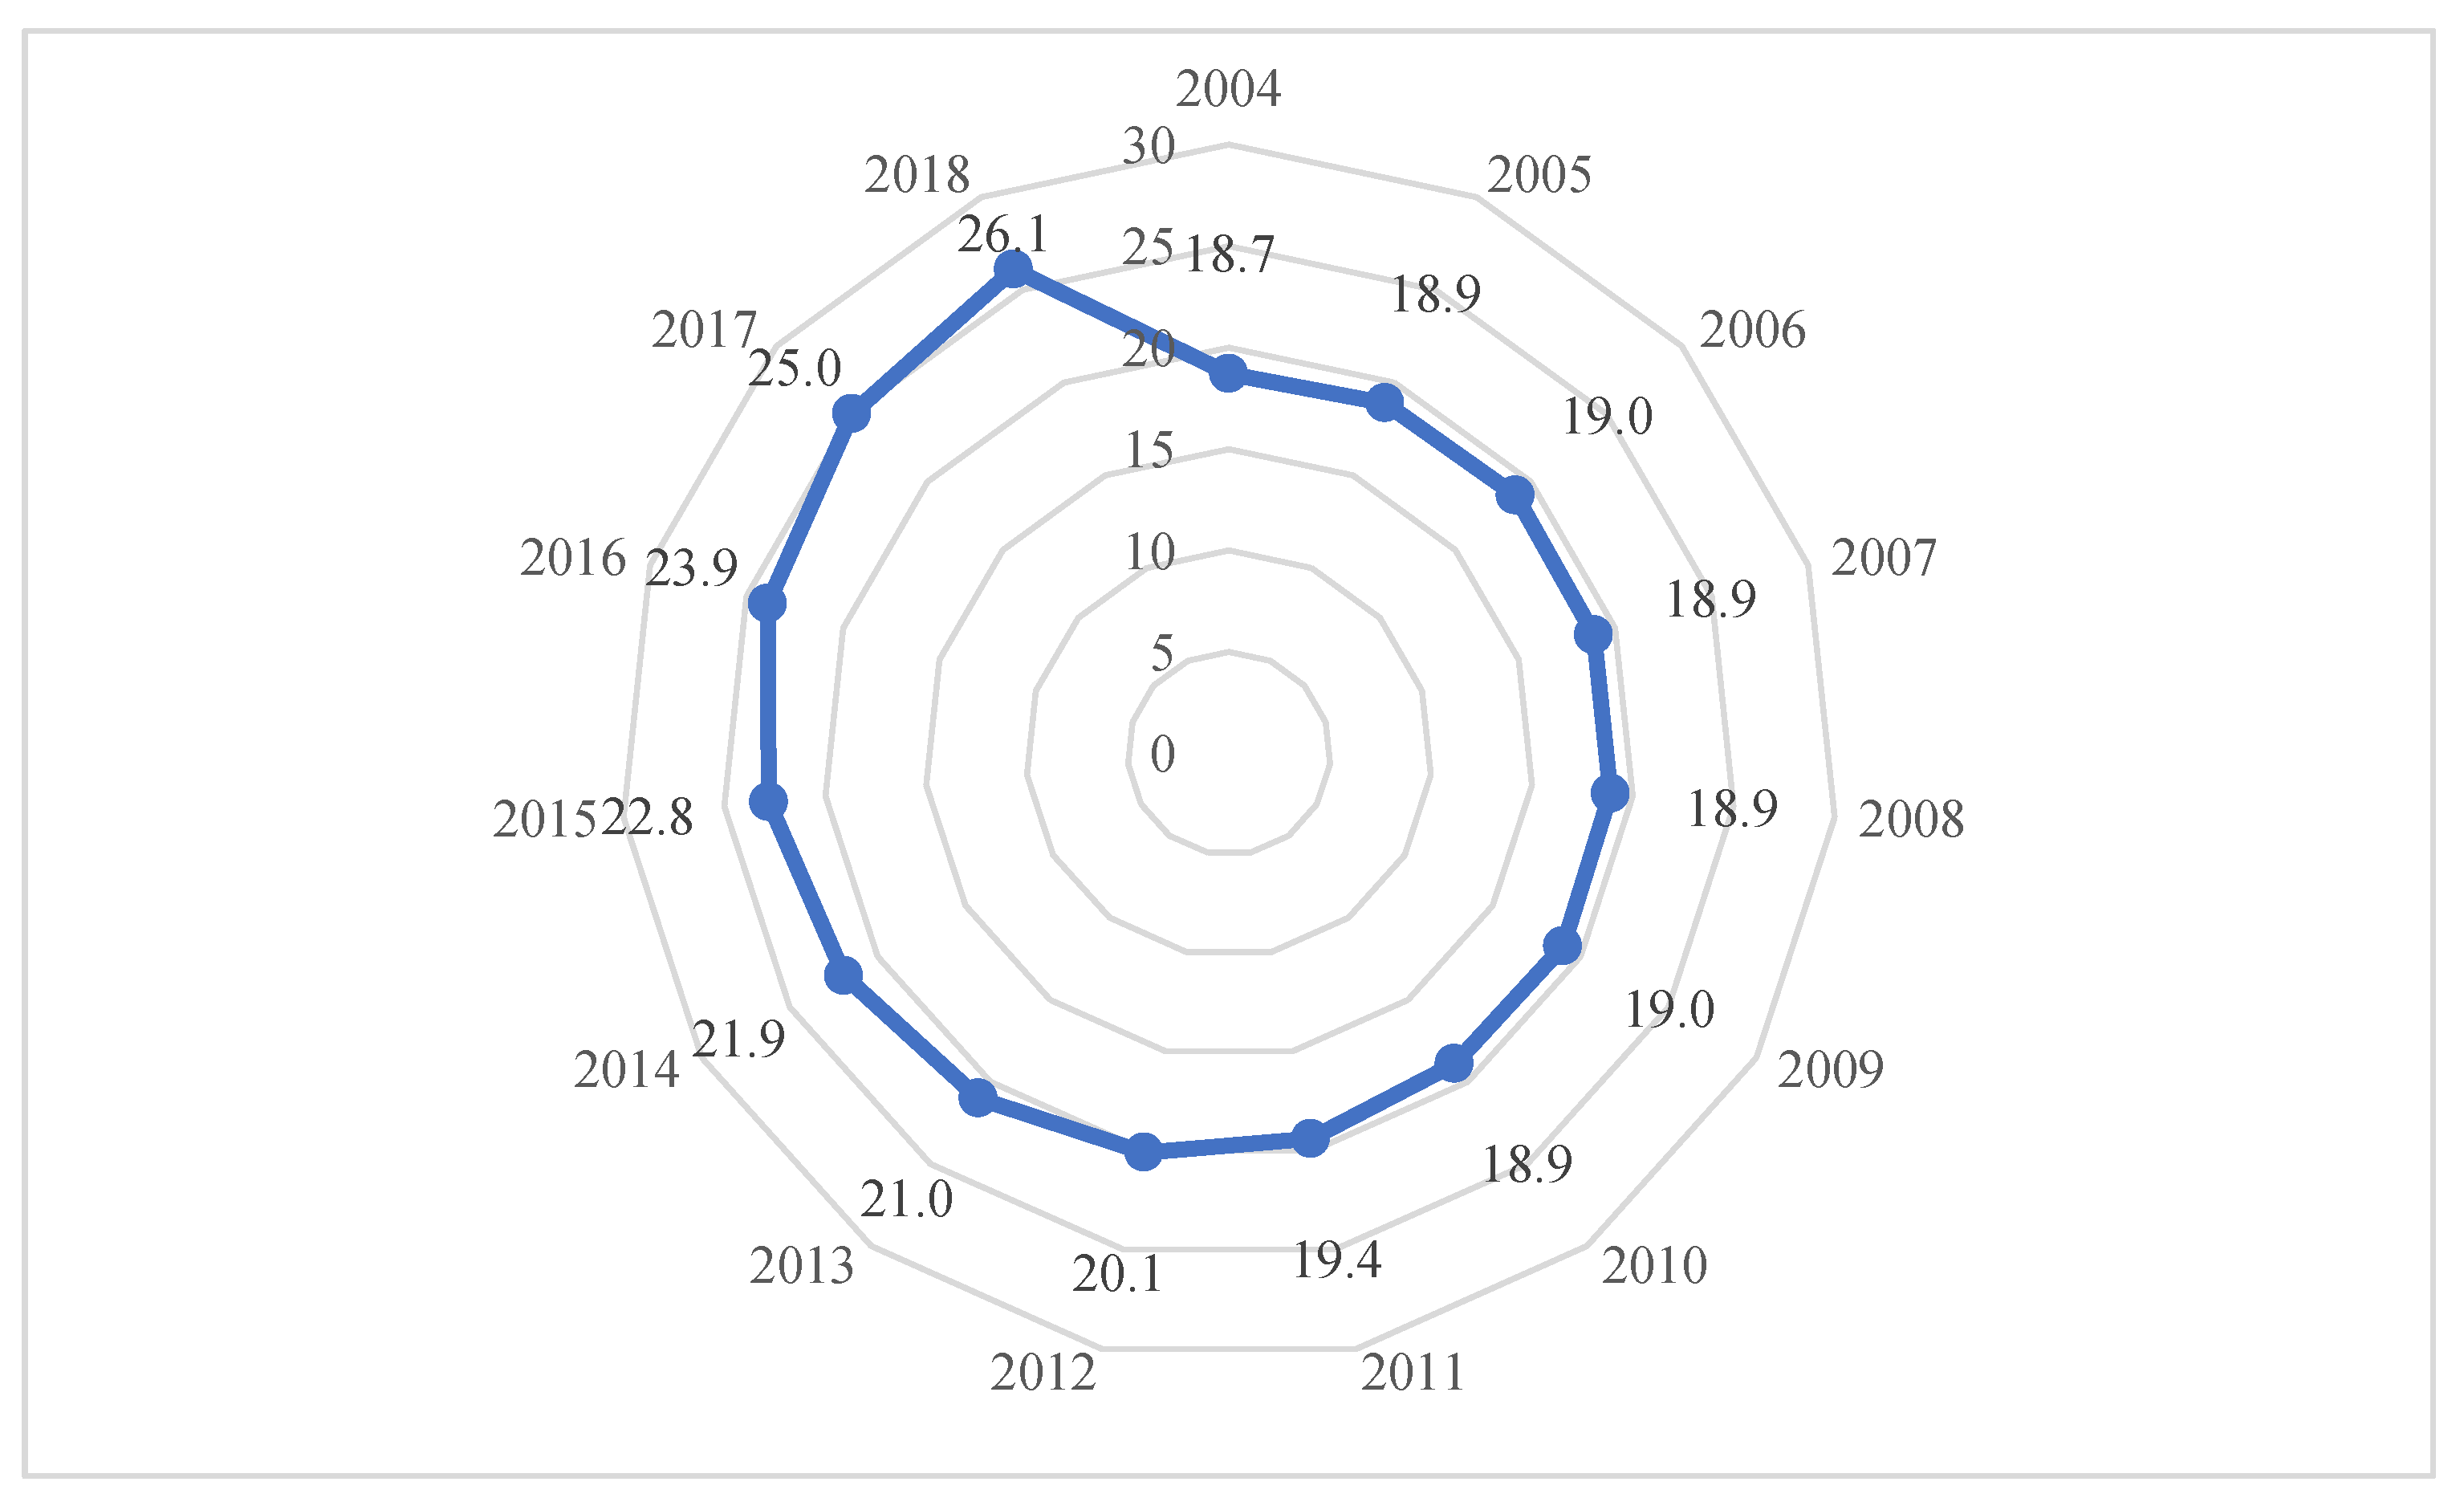
The analysis of old-age dependency ratio provides very interesting information (Figure 6). This indicator is defined as the number of the elderly (aged 65 and over) per 100 persons aged 15–64. The value of this indicator was increasing every year. When comparing 2018 to 2004, an almost 40% increase, from 18.7 in 2004 to 26.1 in 2018, was recorded.
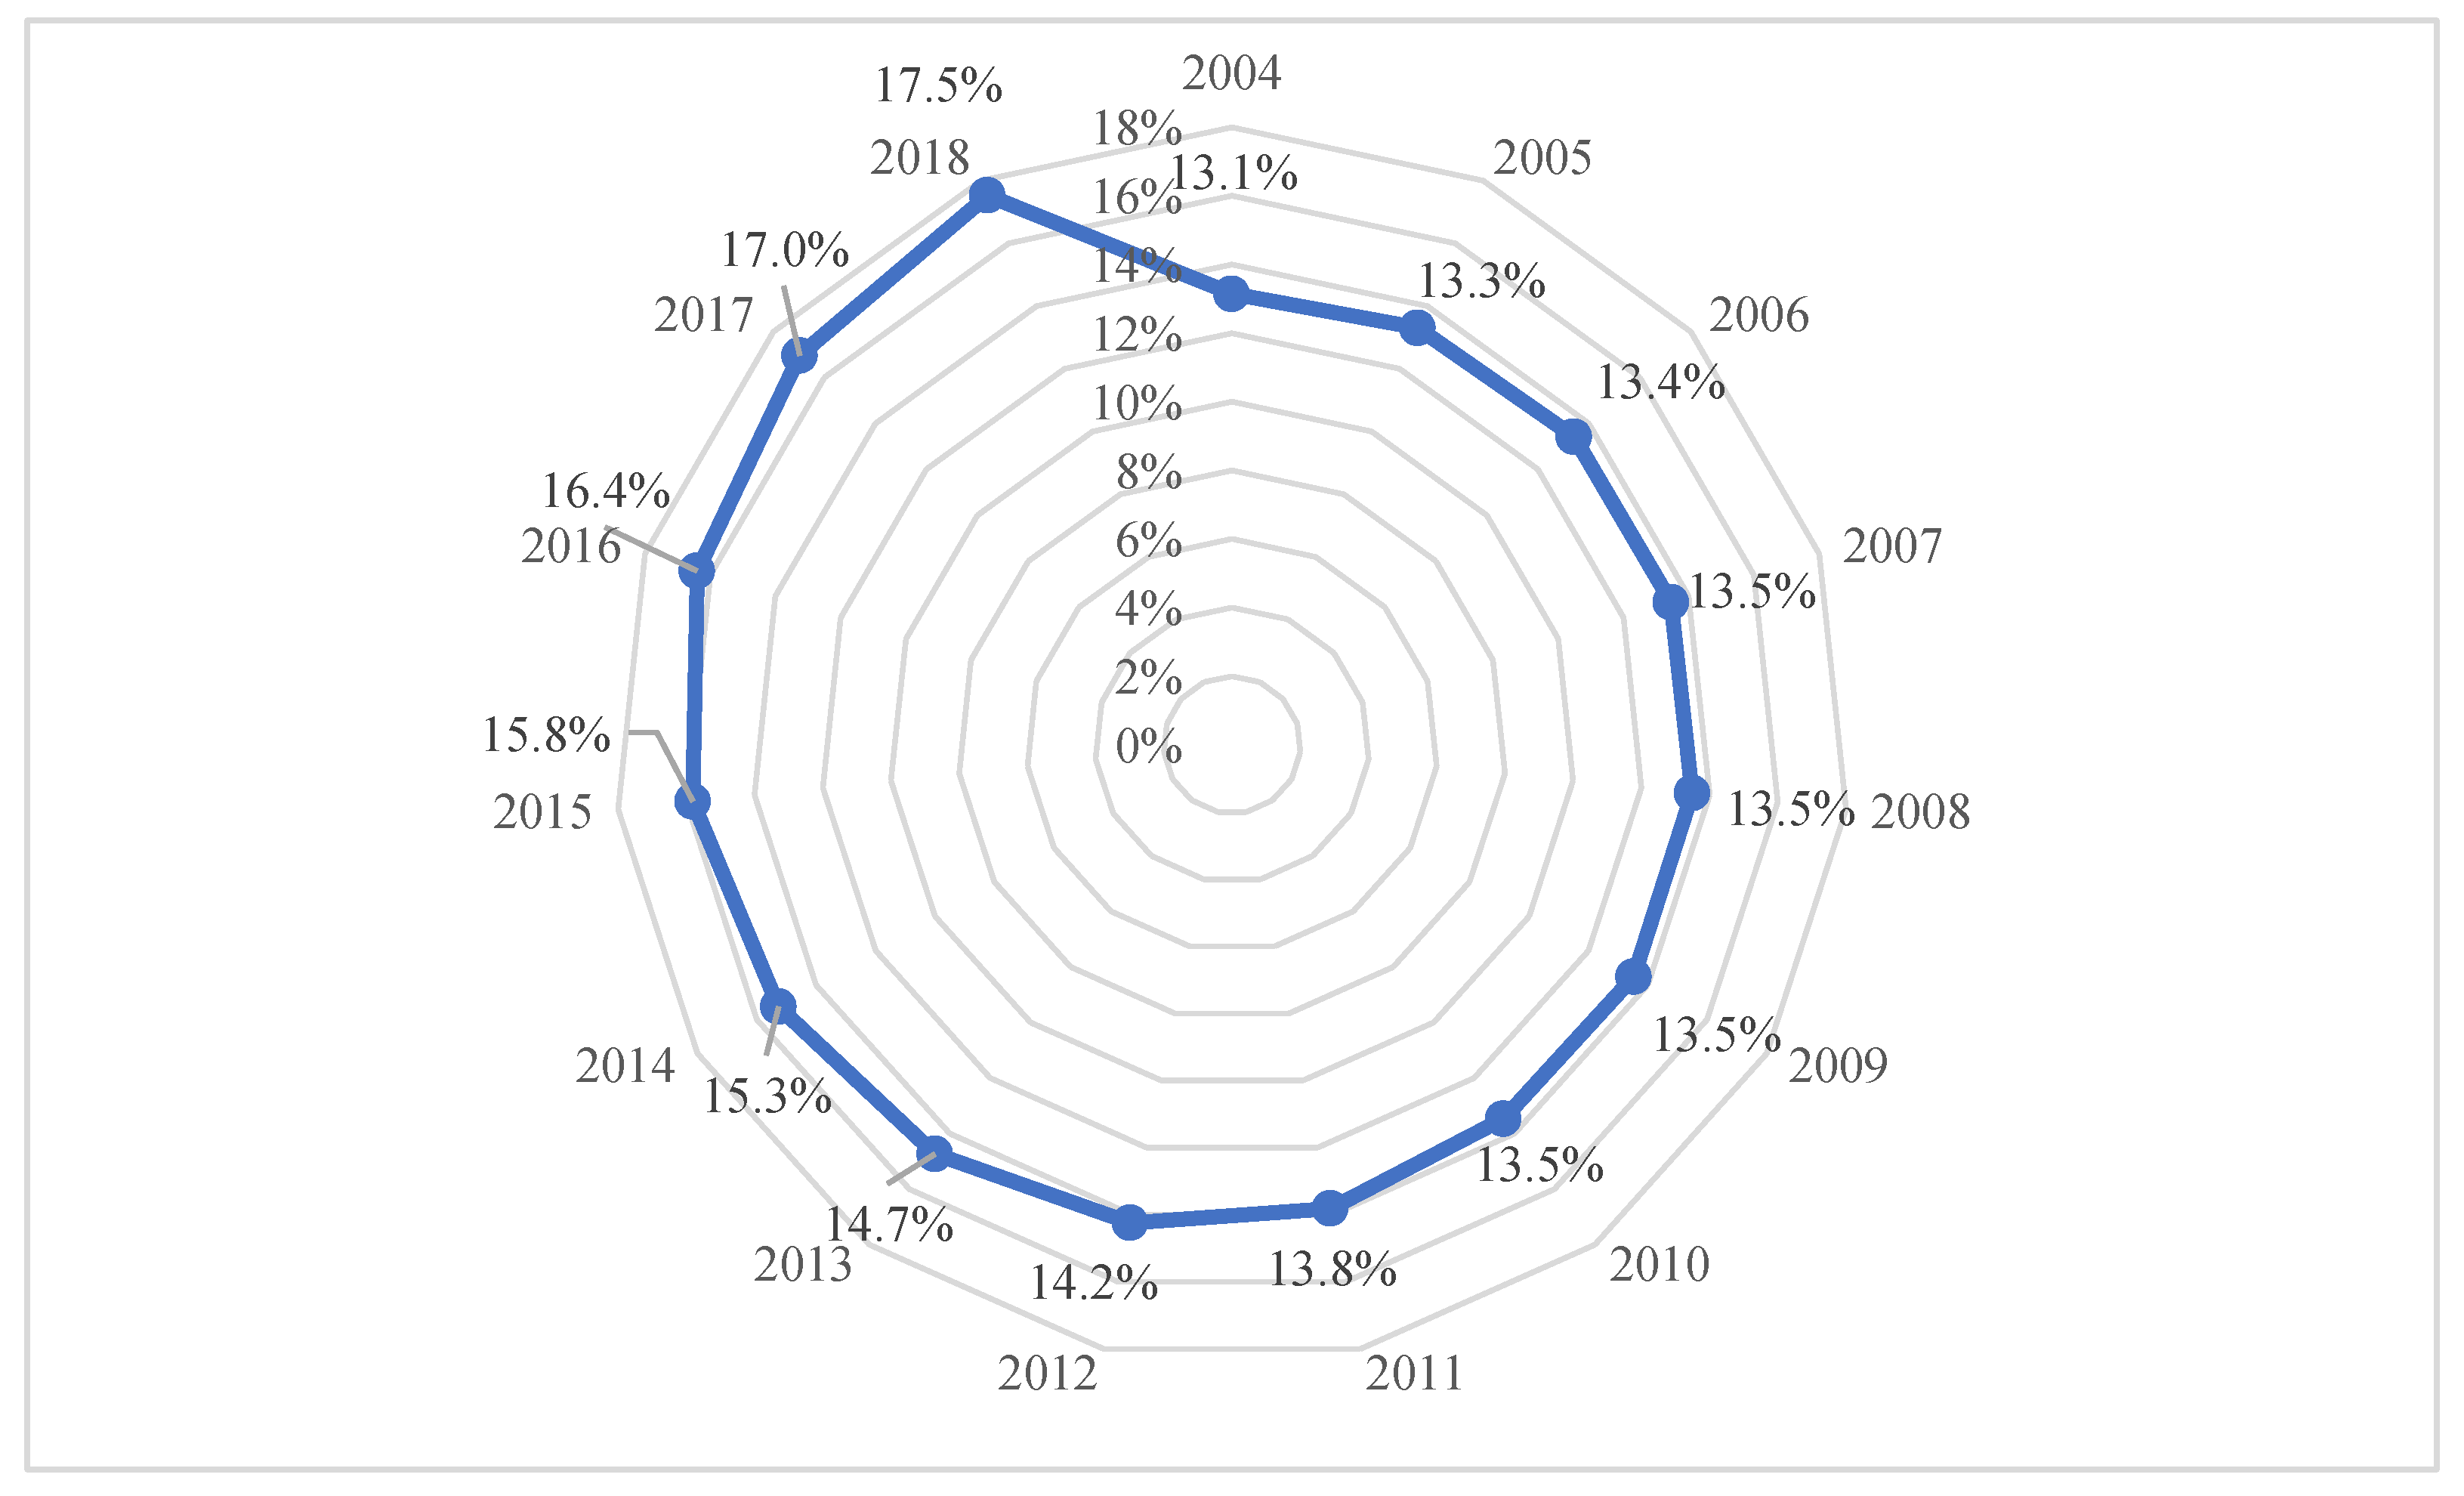
Similar conclusions regarding Polish population aging can be drawn by analysing the value of demographic aging rate, i.e., the share of people aged 65 and over in the total population (Figure 7). The demographic aging rate is a classical measure defining whether a given population is old. According to the UN recommendations presented at the end of the 1950s, a community where 6% of the population reached the age of 65 can be referred to as an old society. In the entire analyzed period, this indicator value for Poland was above 6%. The lowest value of 13.1% was achieved in 2004, and later its value was systematically growing. The increase reached 4.4% points.
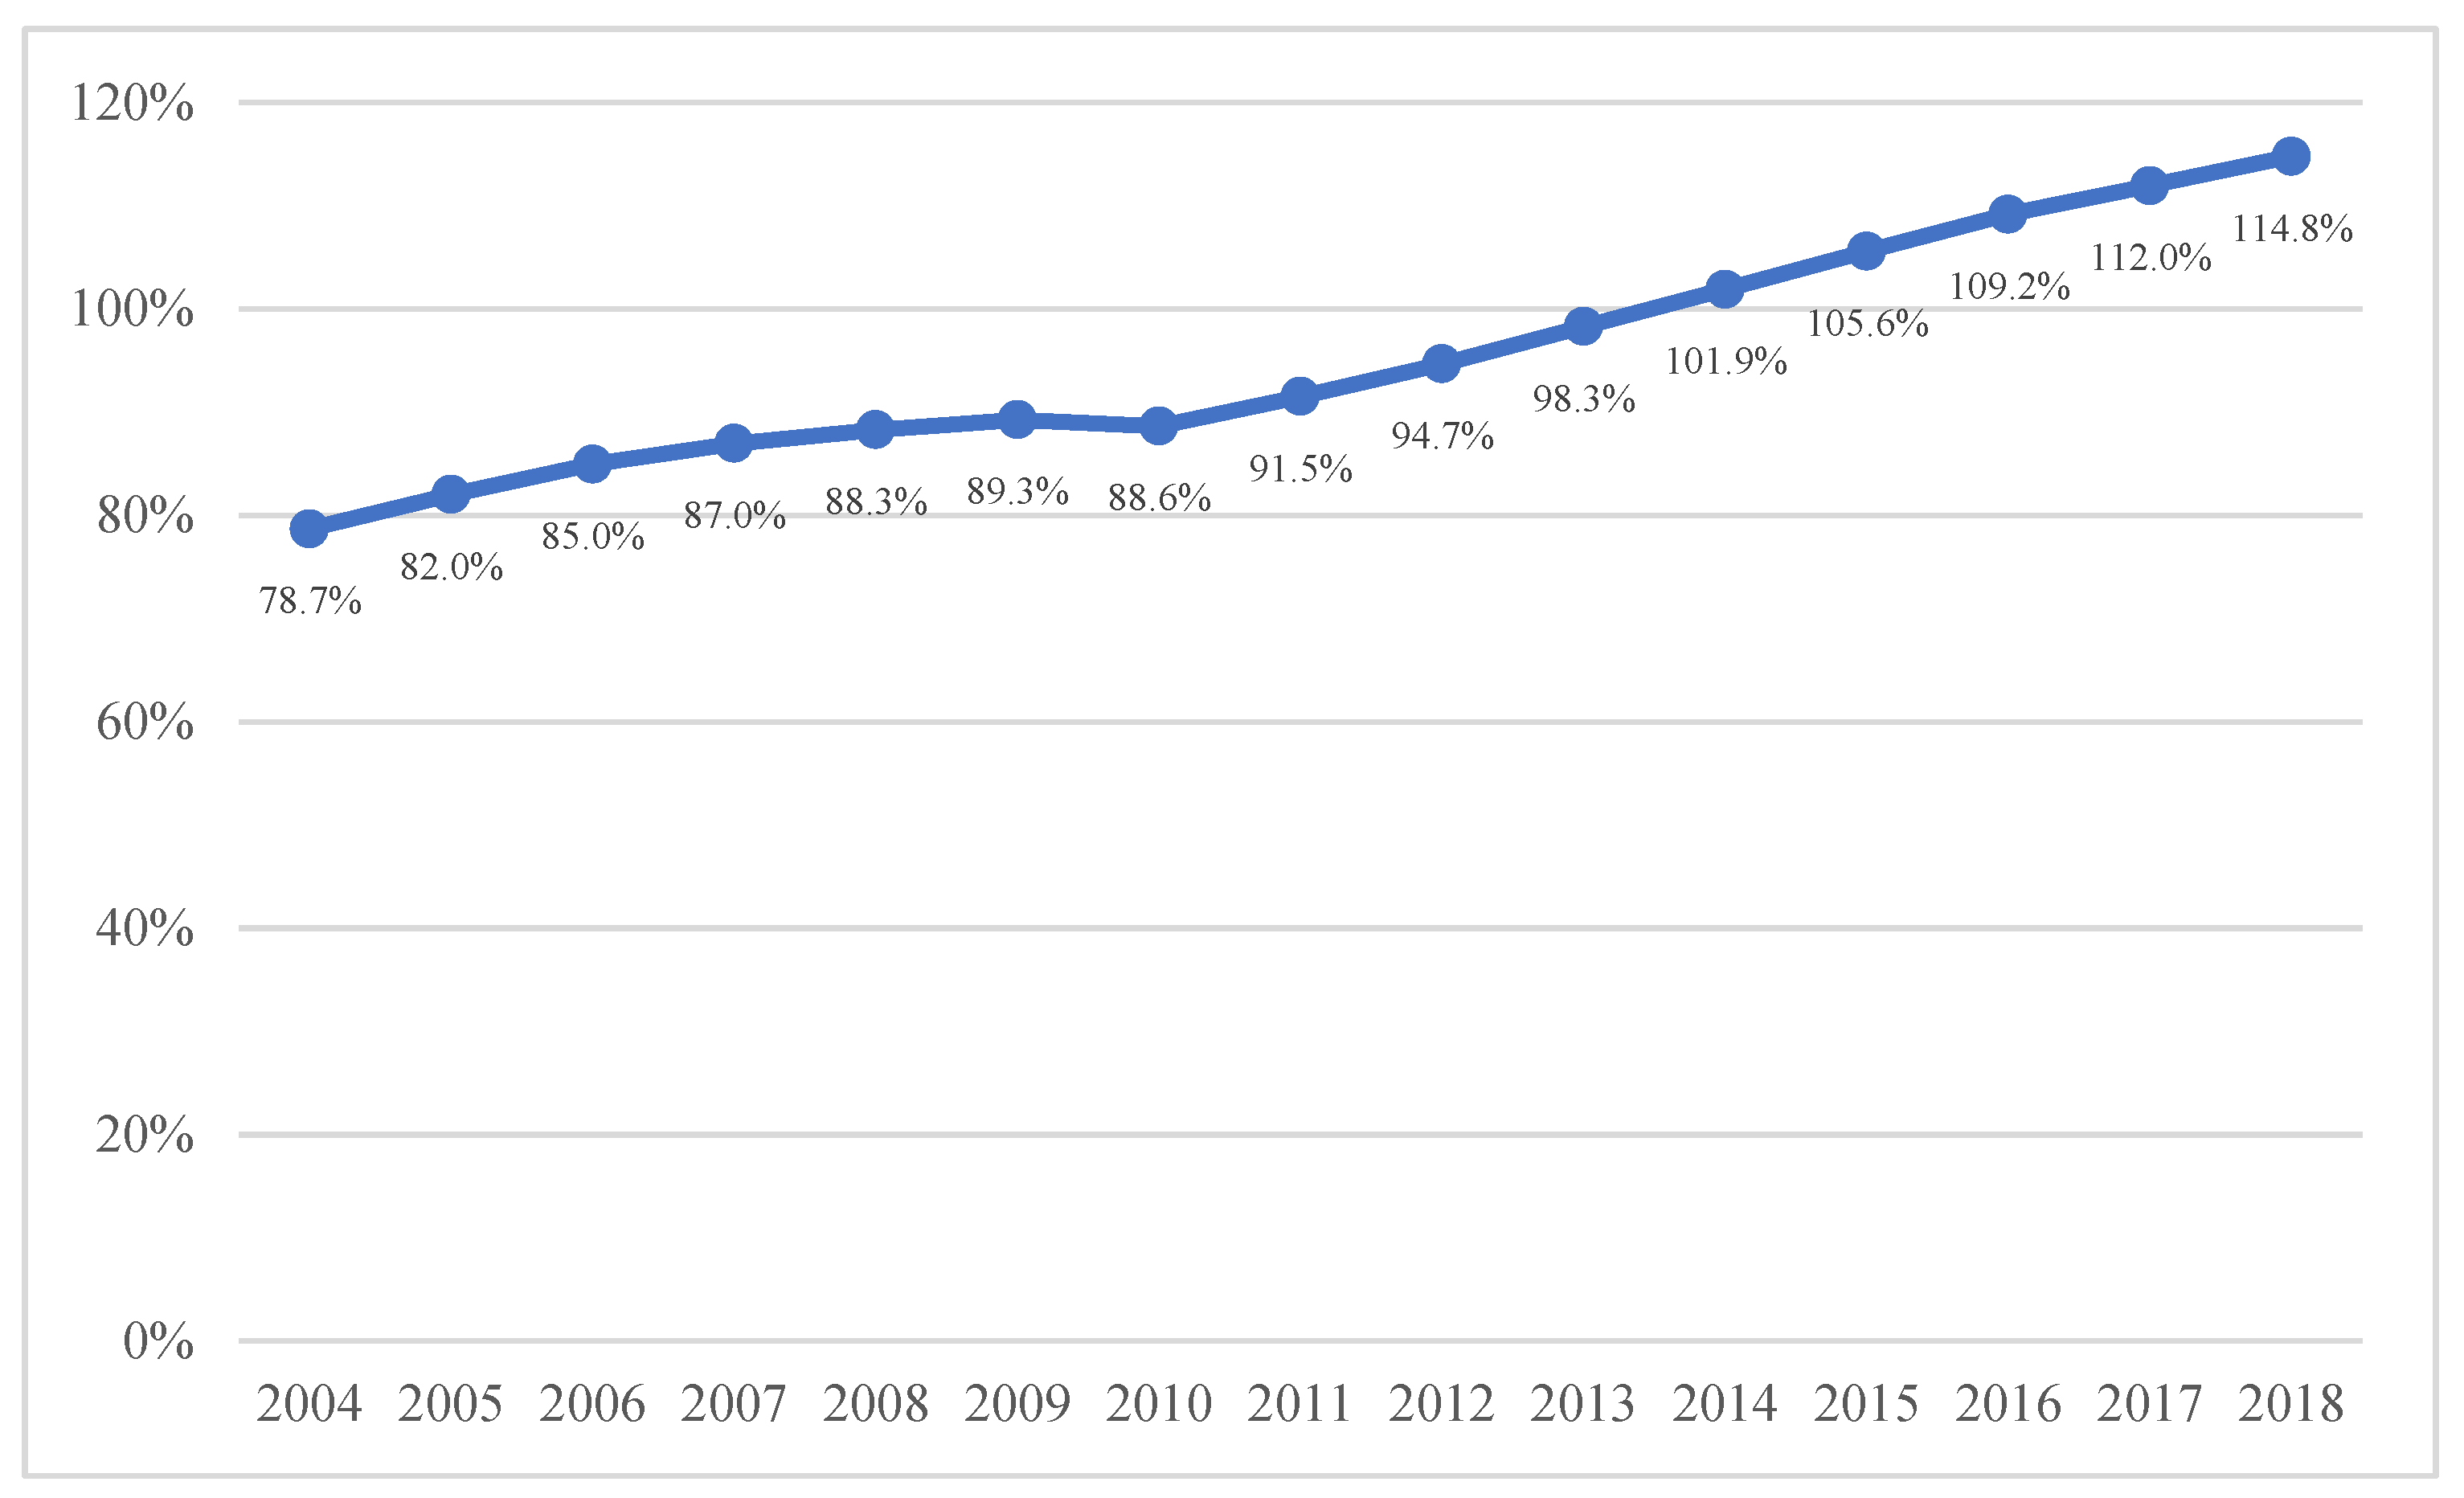
Polish society aging is also shown based on the aging index analysis, i.e., the number of people aged 65 and over per 100 people aged 0–14 (Figure 8). The aging index is said to show the number of grandparents per 100 grandchildren. The increase in its value results from longer life expectancy as well as the shift—from a group of children to older groups—of people from the last baby boom which, in turn, is not compensated by the current births. The lower its value, the better protection for senior citizens. In other words, the number of children (aged 0–14) is a “counterbalance” in terms of the population aged 65 and over. In the years 2004–2013, fewer than 100 “grandparents” fell per 100 “grandchildren”. The situation has been changing since 2014. In 2018, there were 115 “grandparents” were recorded per 100 “grandchildren.”
The degree of the aging process advancement regarding Polish society is demonstrated by the increasing share of post-working age population each consecutive year. The value of old-age dependency ratio is growing. The value of the demographic aging rate is also increasing, i.e., the share of people aged 65 and over in the total population. Polish society aging is also shown by the analysis of aging index, i.e., the number of people aged 65 and over per 100 people aged 0–14. Systematic human lifespan extension as well as low birth rate and the prevalence of deaths over births represent the essential demographic factors which determine population aging.
4. The Impact of Selected Environmental Threats on an Aging Society
Among the main phenomena occurring as a result of climate change the following are listed:
- more frequent temperature extremes (increased number of heat days);
- higher rainfall intensity which can cause floods at any time of the year (including primarily the so-called flash flooding of storm nature);
- increased frequency and intensity of storms;
- more frequent droughts and the related losses in agricultural production and higher risk of forest fires;
- more frequent occurrence of temperatures oscillating around zero [35].
In Poland, temperature measurements are carried out at 32 measuring stations. The average annual air temperatures in 2017 at all measuring stations in Poland were higher than the average values for previous multi-year periods, starting from 1971.
The highest average annual air temperature was recorded in 2017 at the Wrocław weather station (10.4 °C), while the lowest at the station in Suwałki (7.5 °C).
Maximum air temperature for the multi-annual period 1971–2017 was recorded at the stations in Kalisz (38 °C) as well as Toruń, Wrocław, and Opole (37.9 °C). Minimum air temperature for this period was recorded at the stations in Bialystok (–35.4 °C), Terespol (–34.3 °C), and in Włodawa (–34.2 °C). The highest amplitudes of extreme temperatures for the multi-annual period 1971–2017 were registered at the stations in Białystok (the amplitude was 70.9 °C), Terespol (70.5 °C), Kielce (70.3 °C), and Włodawa (70.2 °C). The lowest extreme temperature amplitudes for the multi-annual period 1971–2017 were recorded at IMiGW (Polish Institute of Meteorology and Water Management) stations in Zakopane (where the amplitude was 59.9 °C), Zielona Góra (59 °C), and Śnieżka (56.7 °C). The information for the selected four measuring stations in 2004–2017 is presented in Table 1. Hel measuring station is situated in the north of Poland on the Baltic Sea, Śnieżka station is located in the south of Poland in the mountains, and the other two are placed in the central part of the country. Such choice of locations allows the presentation of selected data covering the entire country. The analysis of values for all four measuring stations shows that the average annual temperature is systematically rising in each station. It indicates the growing development tendency. The highest average annual increase of 0.08 °C was recorded in Warszawa, and the lowest at the average annual level of 0.04 °C in Lublin.
Solar radiation studies have shown that the observed climate changes are reflected in the variability of solar conditions, especially in terms of extreme values. This requires considering their negative impact on the living conditions of the contemporary population, such as health and sometimes even life [36,37,38,39,40,41,42,43,44,45,46,47,48]. Solar radiation stimulates human body processes, intensely affecting the skin, internal organs and the nervous system [49]. The term insolation refers to the total time (hours) in a given period during which a specific place on the Earth’s surface is directly radiated by the sunlight [36,37,38,39,40,41,42,43,44,45,46,47,48]. The information on insolation at four selected measuring stations in the years 2004–2017 is presented in Table 2.
Annual precipitation sums have been calculated taking into account the daily sums based on the selected IMiGW stations and checkpoints which reflect spatial diversity of the precipitation sums in the country. The data for the years 2004–2017 indicate that the amount of precipitation in three out of four measuring stations shows an increasing tendency (Table 3).
The information on the average wind velocity recorded at four measuring stations in the years 2004–2017 is presented in Table 4. The highest average wind velocity was recorded at Śnieżka measuring station. All of the phenomena described in the context of environmental risks can have an adverse effect and threaten both health and life of the community, with particular attention to seniors.
5. Materials and Methods
Demographic changes observed in Poland indicate a progressing process of the population aging. The purpose of this part of the study is to diagnose the respective changes recorded in Poland in the years 2004–2019 and also to provide answers to the following research questions:
- Is it possible to identify the separate homogeneous development phases in the course of Polish population aging process?
- What are the boundaries of the development phases resulting from the aging process in Poland?
- Does the periodization of the population aging process allow the typology of the Polish population within the identified development phases?
- What demographic factors determined population aging to the highest extent in each development phase?
The development phase is a sub-period of undetermined length, included in the analyzed period and characterized by the fact that all features included in periodization take on values more similar to each other in a given development phase than in relation to the adjacent sub-periods.
Multidimensional statistical analysis methods including, in particular, data classification methods were applied to carry out the adopted purpose. The analysis was based on the statistical information obtained from the Statistics Poland and Eurostat databases.
The study was conducted in accordance with the following research procedure:
- Criteria selection for the periodization of the population aging process.
- Normalization of the periodization criteria values (population aging indicators) to the range [0,1] using zero unitarization method based on the minimum value and range, allowing their comparability by introducing additivity and unifying the orders of magnitude. The unitarization of variables was carried out according to the following formula:where: xti—value of the t-th period for i-th indicator (population aging indicators), zti—normalized value of the t-th period for i-th indicator. Those interested will find a lot of valuable information about the normalization of variables in: Kukuła [50], Walesiak [51], Jajuga, Walesiak [52], Zeliaś [53], and Milligan and Cooper [54].
- The diversity of the analyzed periods, in terms of the population aging indicator values, was determined using the Euclidean squared distance.
- The analyzed periods were subject to hierarchical classification by applying Ward’s hierarchical clustering method. Its results were used to determine the number of development phases of the population aging process. The criterion of the first clear increase in integration distance was used to determine the number of classes by analysing the dendrogram of connections, integration distances, and classification stages. The description of classification methods is presented in the following studies: Ward [55], Johnson [56], Anderberg [57], Hartigan [58], Sneath, Sokal [59], Aldefender, Blashfield [60], Basiura, Sokołowski [61], and Everitt et al. [62].
- The division of the analyzed period into development phases of the population aging was performed by applying k-means clustering.
- The typology of development phases was carried out using mean values of the periodization criteria.
- The key demographic factors were selected using correlation analysis.
The following indicators were used to measure the advancement phases of population aging:
- MA—median age of population,
- SA65+—demographic aging rate—share of population aged 65 and over as the percentage of total population (proportion of population aged 65 and over),
- AI—aging index, the number of the population aged 65 and over per 100 people aged 0–14, i.e., the number of grandparents per 100 grandchildren (aging index),
- TADR—total age dependency ratio, share of population aged 0–14 and aged 65 and more as the percentage of population aged 15–64 (population aged 0–14 and 65 and over to population aged 15–64),
- OADR—old-age dependency ratio of the post-working age group, share of population aged 65 and over as the percentage of population aged 15–64, (old-age dependency ratio, population 65 and over to population aged 15–64),
- YADR—young-age dependency ratio of the pre-working age group, share of population aged 0–14 as the percentage of population aged 15–64 (young-age dependency ratio, population aged 0–14 to population aged 15–64).
6. Results—Periodization of the Population Aging Process in Poland in the Years 2004–2019
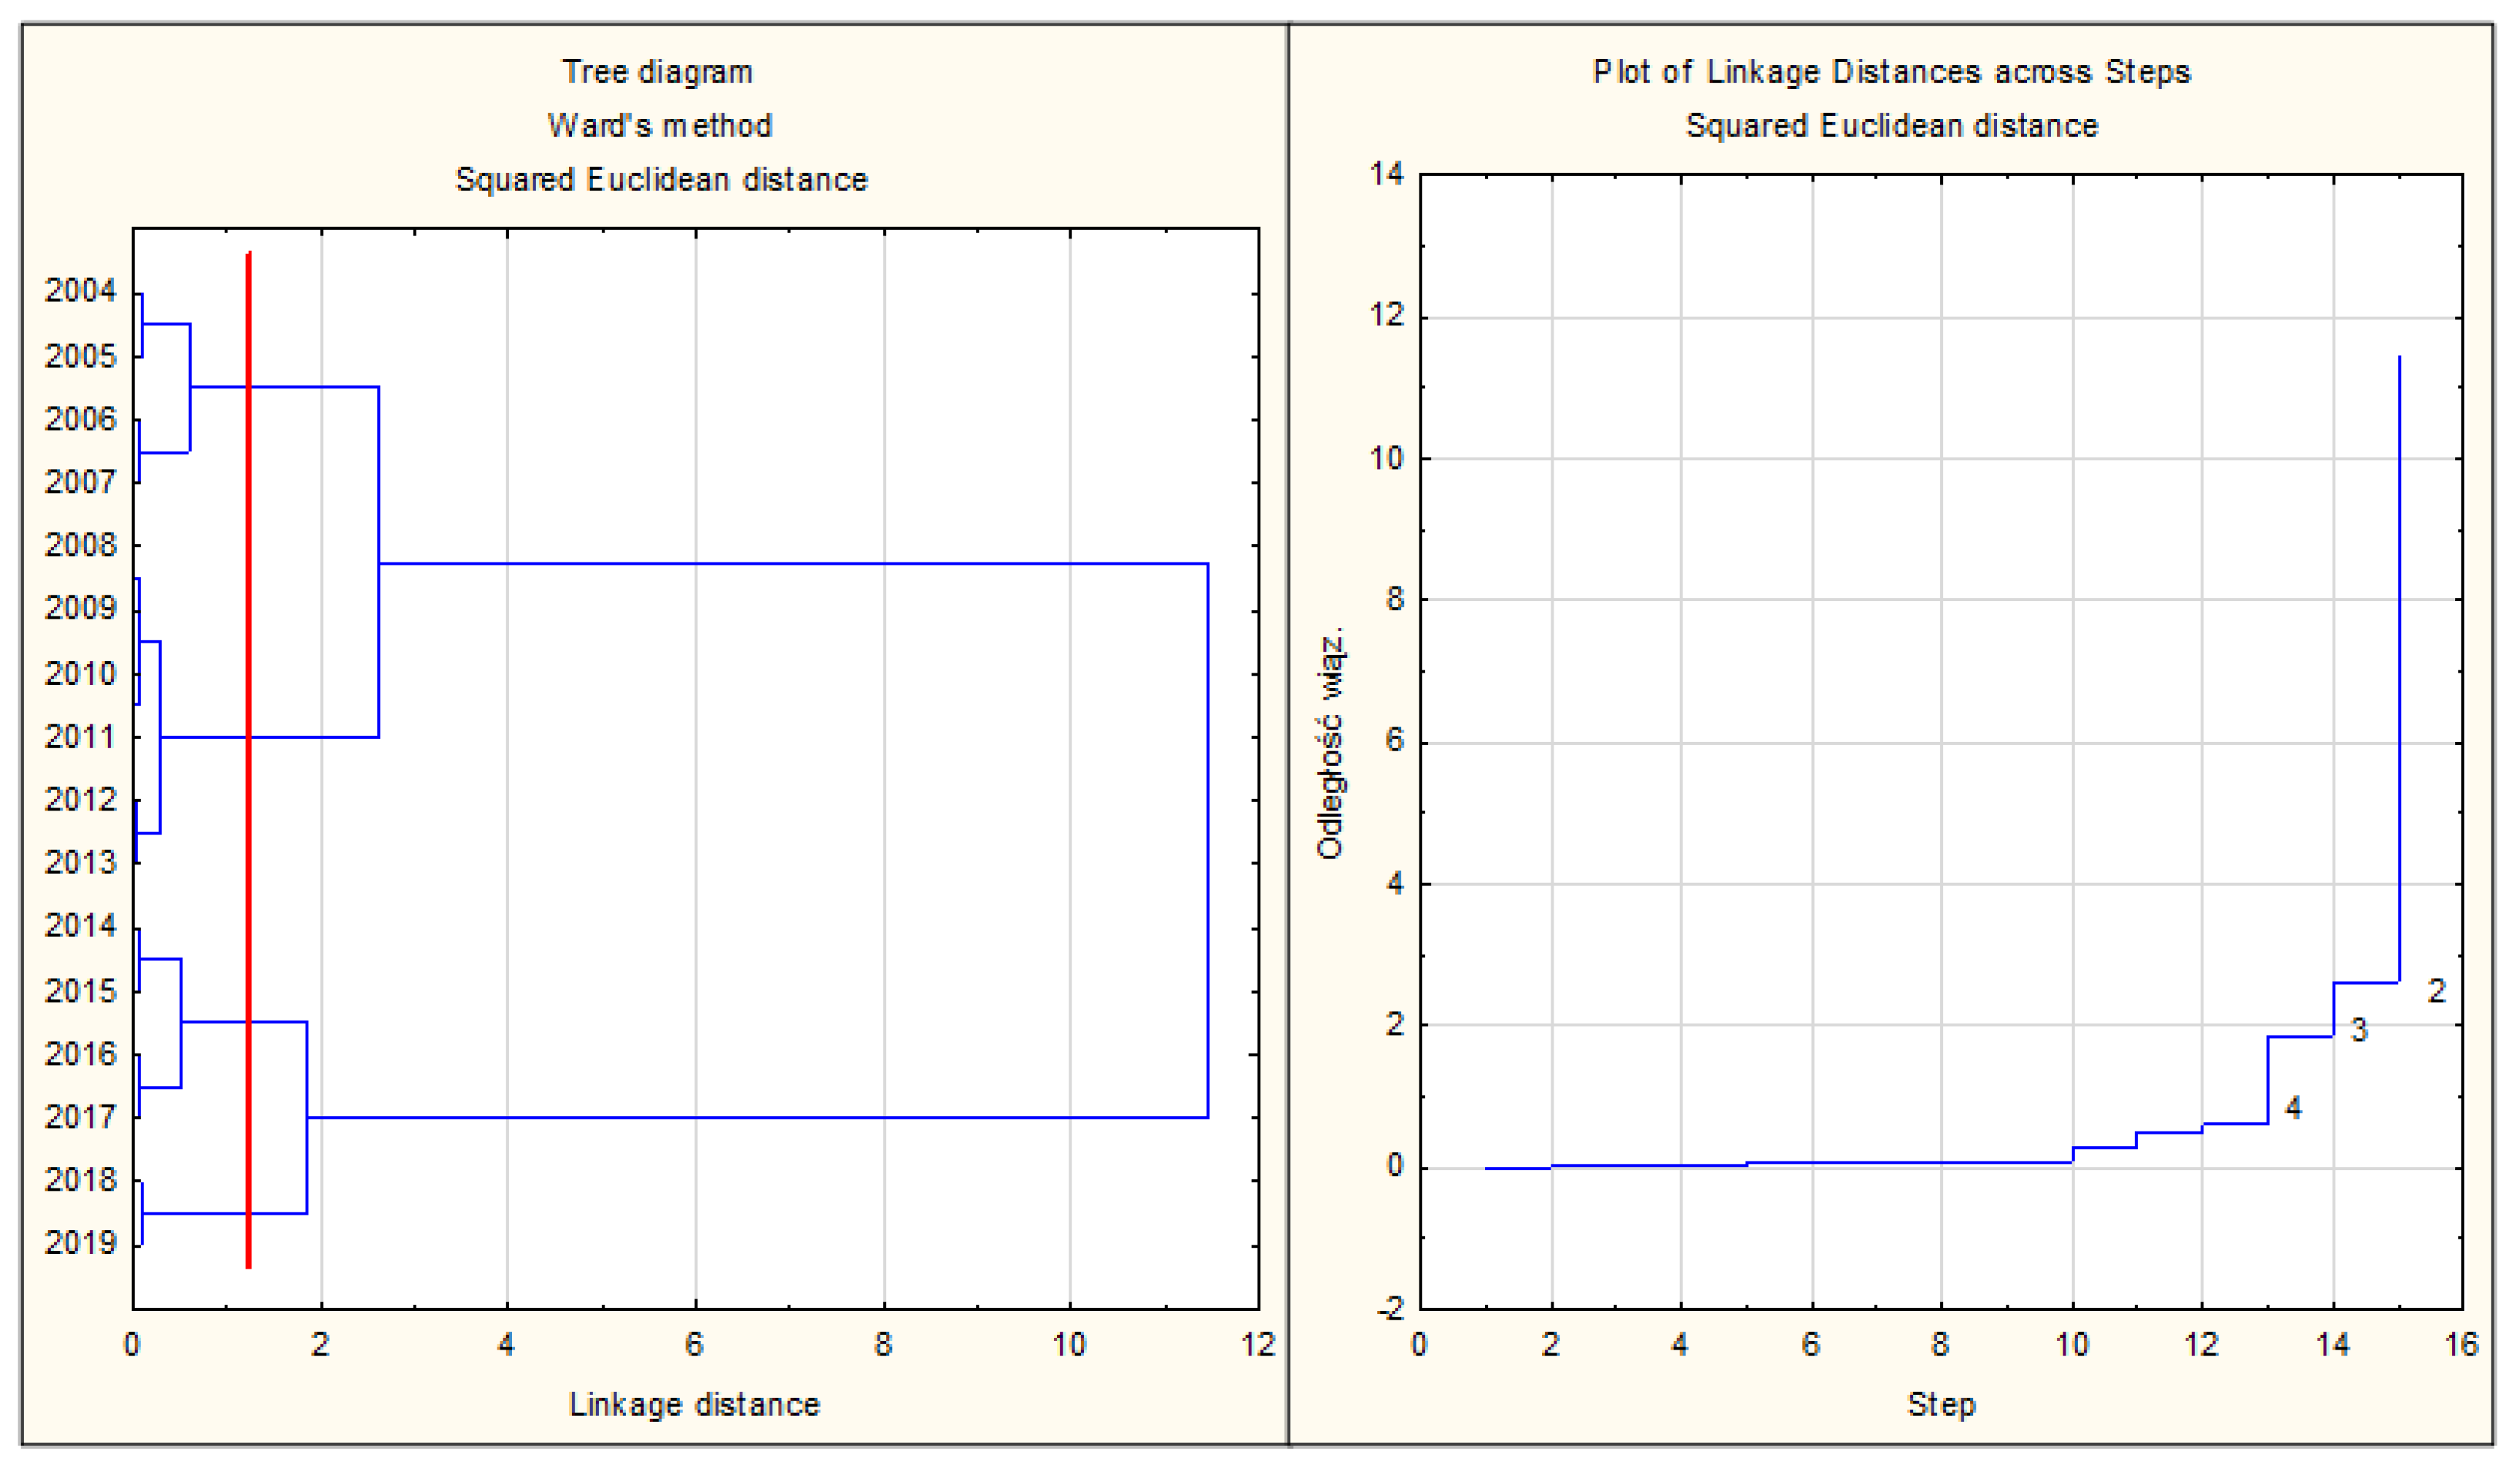
Figure 9 illustrates the hierarchical classification results of the analyzed periods in terms of 6 applied indicators of population aging in Poland using spanning trees and integration distance diagrams with regard to classification stages. On their basis, a variant division of 16 years into four classes, representing relatively homogenous phases of population aging was developed.
The analysis of the results obtained using Ward’s method shows that, in the period 2004–2019, four development phases of the Polish population aging process should be distinguished. The next step of the research procedure consisted of dividing the analyzed period, using k-means clustering, into the relatively homogeneous sub-periods called development phases.
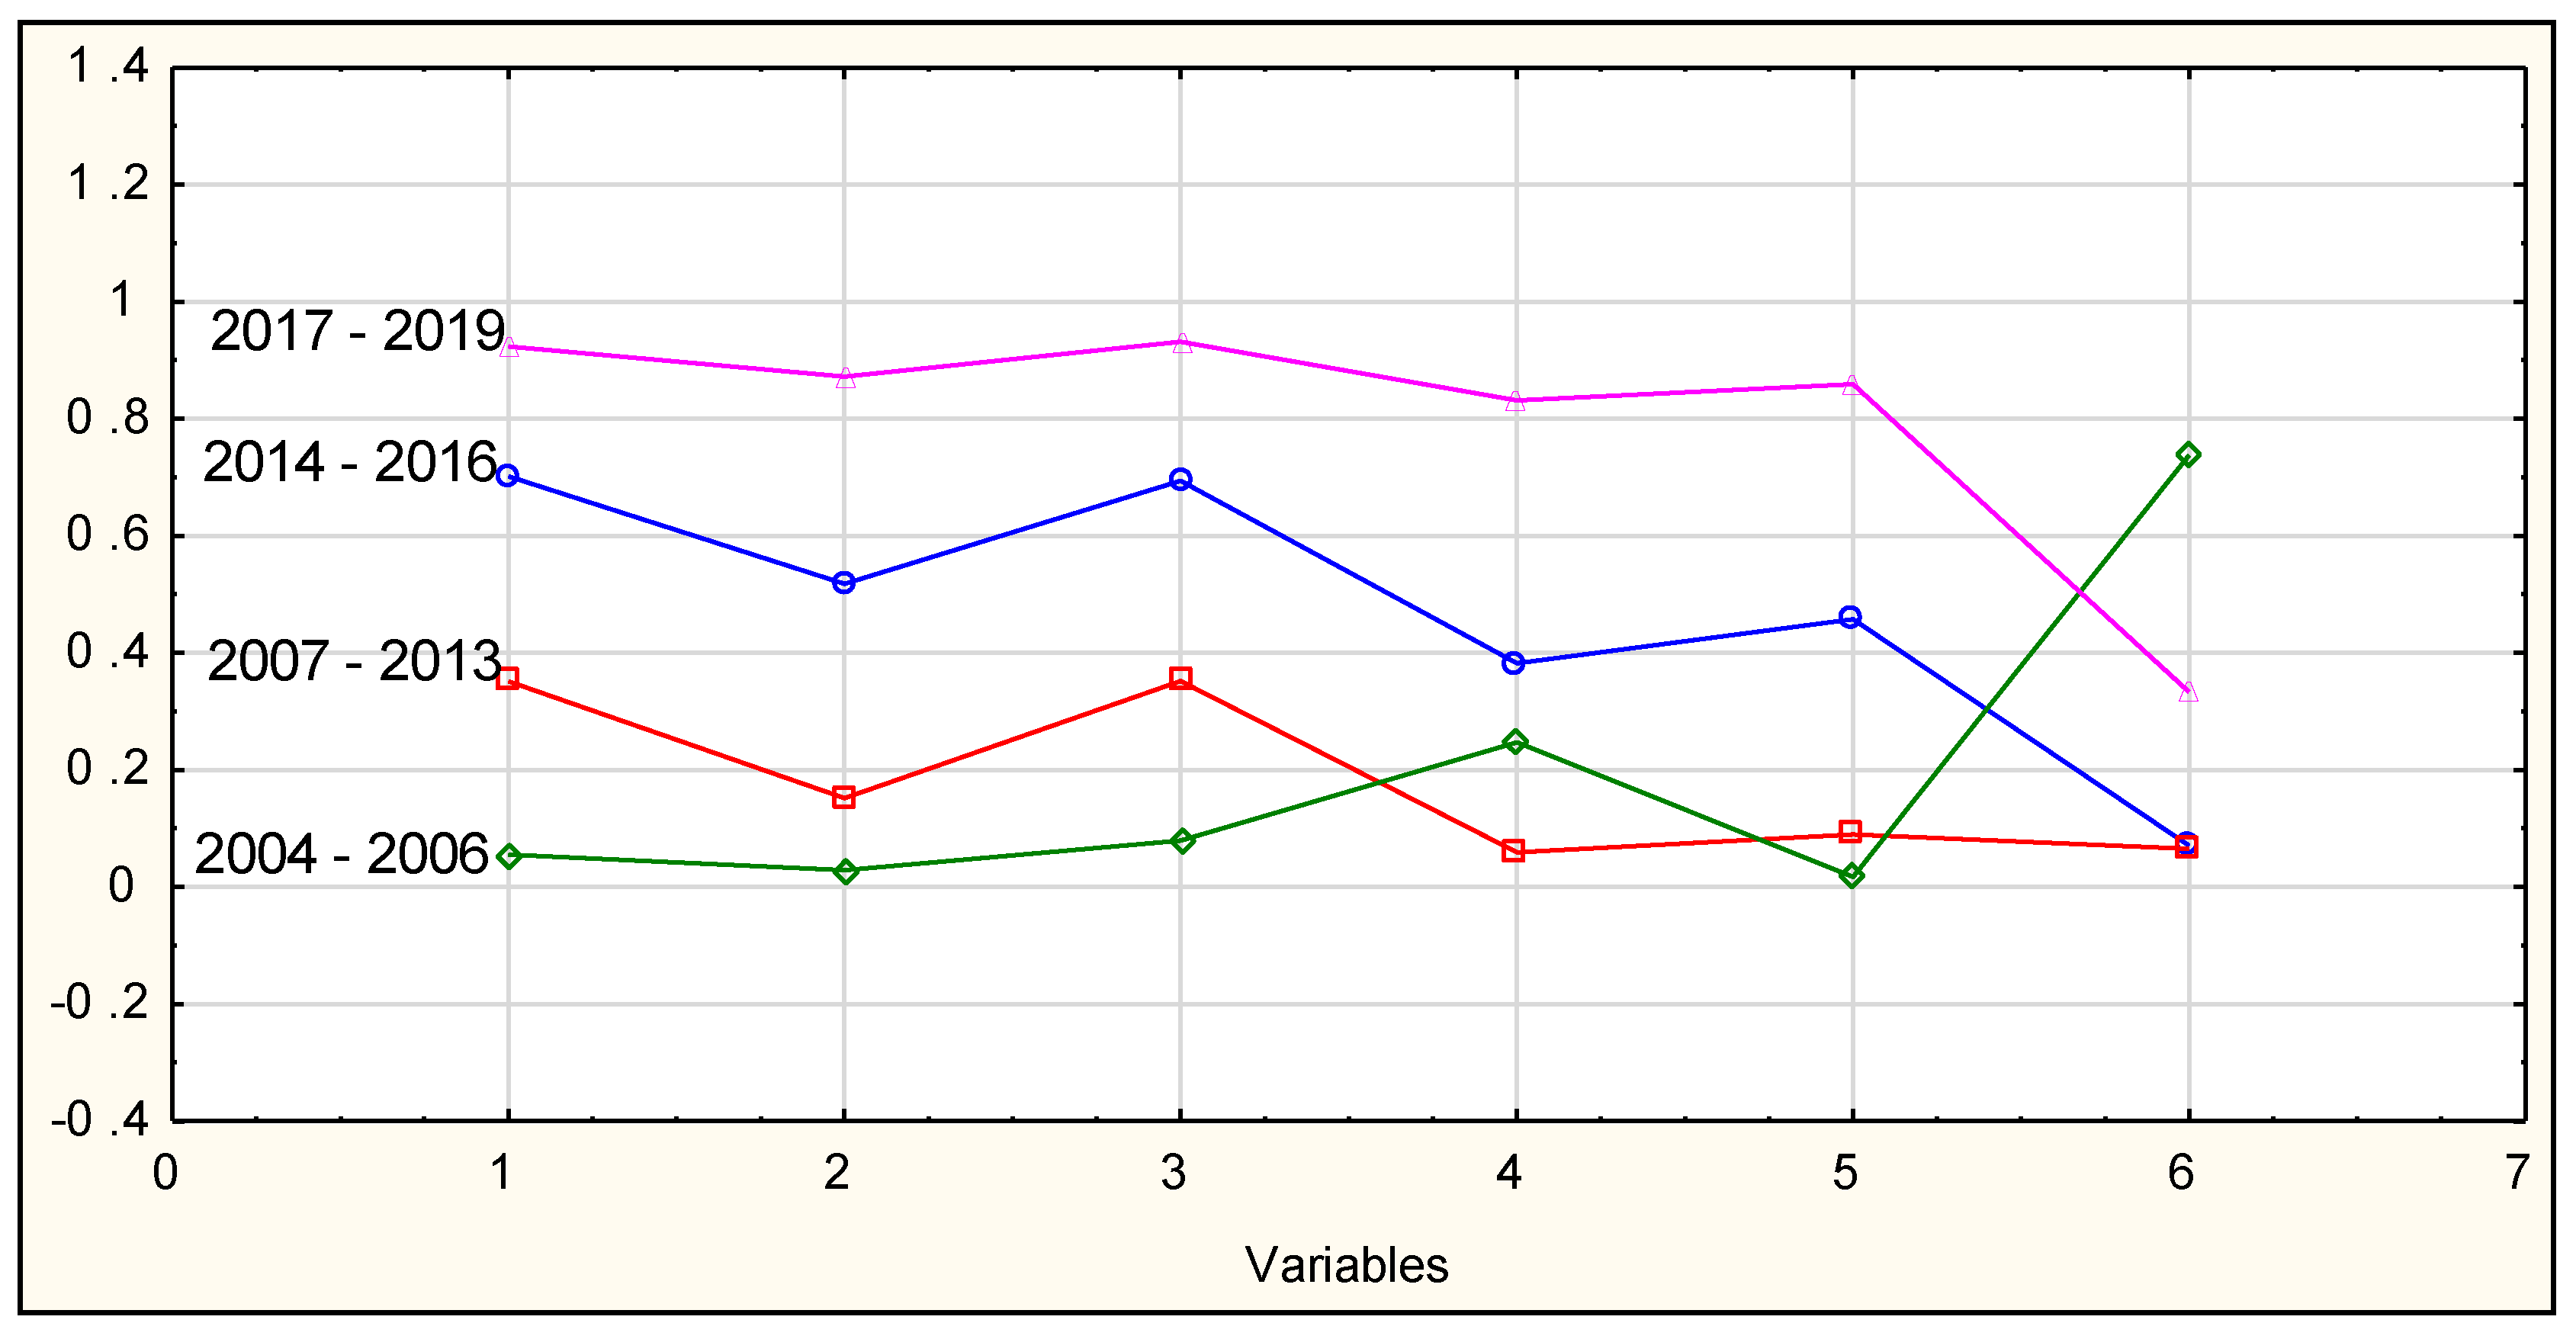
Figure 10 presents arithmetic means of the normalized values referring to the analyzed aging indicators, determined for the individual development phases. As Figure 10 shows, in the years 2004–2019, four successive relatively homogeneous sub-periods were selected: phase I—2004–2006, phase II—2007–2013, phase III—2014–2016, and phase IV. Phases I, II, and IV are characterized by the same length covering 3 years. Phase II turned out to be the longest—seven years.
The consecutive development phases were characterized by an increasing median age of population (MA), a larger share of older people aged 65 and over (SA65 +), a higher number of older people per child aged 0–14 (AI), as well as larger old-age dependency ratio of the post-working age group (OADR). This order was disturbed in the case of the total age-dependency ratio (TADR), because in the first of the sub-periods covering the years 2004–2006, it adopted a higher value than in the second phase falling in the period 2007–2013. In turn, the young-age dependency ratio of the pre-working age group (YADR) in phase I (2004–2006) was, by far, the highest among all the identified development phases in terms of population aging in Poland.
Table 5 presents the typology of the Polish population in individual development phases using mean values of the indicators determining the advancement level and the specificity of the aging process.
Based on the data analysis presented in Table 5, it is noticeable that the individual development phases differ significantly in terms of mean values referring to Polish population aging indicators covered by the study. Different types of Polish population can be assigned to individual development phases. In the first phase of development, Polish population was defined as aging, but, presenting the potential of future labour resources. The average median age in the 2004–2006 sub-period was 36.5, the share of older people (aged 65 and over) exceeded 13%, and almost 79 grandparents fell per 100 grandchildren. These indicators adopted the lowest mean values in phase I. The mean value analysis of the total age dependency ratio (TADR), determining the economic dependency on the working population age group by the groups of non-working age population (pre- and post-working age jointly) and the structure of this indicator are of particular importance in determining the population type. The mean value of the total age dependency ratio for phase I is quite high and amounts to 42.6% (the second development phase is characterized by its lower value); however, there is a favourable correlation between the components of TADR indicator. The average economic dependency on the post-working age group (OADR) is the lowest in the entire period under study and amounts to 18.7%. In turn, the dependency on the pre-working age group (YADR), approached as the potential of future labour resources and, therefore, positively assessed remains the largest and amounts to 23.8%.
The mean value of the total age dependency ratio for phase I is quite high and amounts to 42.6% (the development phase II is characterized by its lower value); however, there occurs a favourable correlation between the components of the TADR indicator. The average economic dependency on the post-working age group, i.e., old-age dependency ratio (OADR) is the lowest in the entire analyzed period and amounts to 18.7%. In turn, the economic dependency on the pre-working age group, i.e., young-age dependency ratio (YADR), approached as the potential of future labour resources and thus assessed positively, is the highest and amounts to 23.8%.
The development phase II is definitely the longest. It covers the period of seven years. It is a more advanced sub-period than the previous one regarding the population aging process in Poland. The sub-period 2007–2013 is characterized by the type of population advanced in the aging process, with a lower but structurally unfavourable total age dependency ratio. The average median age in this development phase is higher than in the case of phase I by almost 1.5 years. The demographic aging rate (SA65 +) went up by 0.6, and the aging index (AI) by as much as 10.7% points. The improvement in the mean value of the total age dependency ratio (a decline by 1.7% points) was accompanied by a deteriorating correlation between the partial indicators. However, this relationship continued to remain favourable in the development phase II, because the average dependency of the post-working age group was lower than the pre-working age group (the difference is over 2 % points).
In phase III, Polish population was defined as highly advanced in the aging process, characterized by higher and structurally unfavourable dependency. In the course of this three-year sub-period, the aging of the Polish population was significantly accelerated. The average median age increased by almost 2 years (1.7) compared to phase II and the old-age dependency ratio by 1.7% points. A significant rise in the mean value of the aging index (AI) was also recorded, i.e., almost 14 grandparents per 100 grandchildren. Phase III also presented an increase in the average total age dependency ratio by almost 3% points and, most importantly, for the first time in this phase, the economic dependency on the post-working age group was higher than with the pre-working age group. The assessment of this correlation between the partial indicators of the dependency ratio is negative.
In the final development phase IV, Polish population was defined as old and heavily dependent on the non-working age group with the majority of older people (TADR—47.8%). This phase was characterized by an increase in mean values of all population aging indicators. Moreover, in this sub-period, all mean indicator values turned out to be the highest. Median age reached the level of almost 41 years, the share of seniors in the population increased by 1.7% points, and the number of grandparents per 100 grandchildren grew by over 9. In the last aging phase, the average economic dependency on the working age population was very high as it amounted to almost 48% and increased by 4% points compared to the previous sub-period. The correlation between the partial indicators of economic dependency can also be assessed very negatively. The dependency of seniors on the working age group increased by more than 2% points and reached 25.3%. The pre-working age group dependency was lower (22.5%); however, it was also higher.
The next step of the research procedure was to identify the key demographic factors influencing the process of population aging. Substantive analysis was used to determine the initial set of demographic factors, having adapted that it should include diagnostic features describing the basic demographic phenomena affecting the population aging process. Based on the availability of statistical data, time range of the diagnostic features covers the years 2004–2018. A preliminary list of 10 demographic factors selected in this way is presented below:
- (1)
- DD—rate of demographic dynamics (number of births per 1 death),
- (2)
- NI—natural increase per 1000 population,
- (3)
- LB—live births per 1000 population,
- (4)
- TF—rate of total fertility (number of children per 1 woman),
- (5)
- GR—rate of gross reproduction (number of born female children per 1 woman of childbearing age),
- (6)
- LEF0—life expectancy at birth for females,
- (7)
- LEF65—life expectancy at 65 for females,
- (8)
- LEM0—life expectancy at birth for males,
- (9)
- LEM65—life expectancy at 65 for males,
- (10)
- TNM—total net migration per 1000 population.
The purpose of this research stage was to identify the key factors of demographic development which differentiate the identified development phases of the population aging process in Poland. It was adopted that the features presenting the highest information value and not duplicating the same information should be selected. As a consequence, the key factors of demographic development should include the features strongly correlated with the population aging indicators and insignificantly correlated with each other. The reduction of the initial set of diagnostic features, characterizing demographic development and determining the population aging processes was of iterative nature. The feature most strongly correlated with all population aging indicators (maximum value of the modules’ sum of the correlation coefficients referring to the given feature with all population aging indicators) was selected in the course of the first stage. In the second stage, the diagnostic features significantly correlated with the feature selected in the first stage were removed to eliminate the repeated information. The critical value of the correlation coefficient was set at r* = 0.641 (for n = 15 α = 0.01). Steps one and two were repeated until the last diagnostic feature was eliminated.
The demographic factors determining the average life expectancy LEF0, LEF65, LEM0, and LEM65, showed a very strong positive correlation with all the indicators referring to population aging. Among them, male life expectancy rate (LEM0) turned out to be the demographic factor most closely correlated with the population aging indicators. The remaining indicators, determining the average life expectancy, were eliminated from further analysis as very strongly correlated with LEM0.
In the next iteration, gross reproduction was the demographic factor most closely correlated with population aging, whereas such features as live births per 100 population (LB) and total fertility (TF) were significantly correlated with it.
In subsequent iterations, natural increase (NI) and total net migration (TNM) were selected as the features most closely correlated with the aging indicators. The rate of demographic dynamics (DD) was rejected as strongly correlated with the natural increase.
Ultimately, after reducing the initial set of diagnostic features, the following characteristics were considered the key demographic factors, most differentiating the development phases of the population aging process in Poland in 2004–2019: natural increase (NI), gross reproduction (GR), average life expectancy at birth for males (LEM0), and total net migration (TNM).
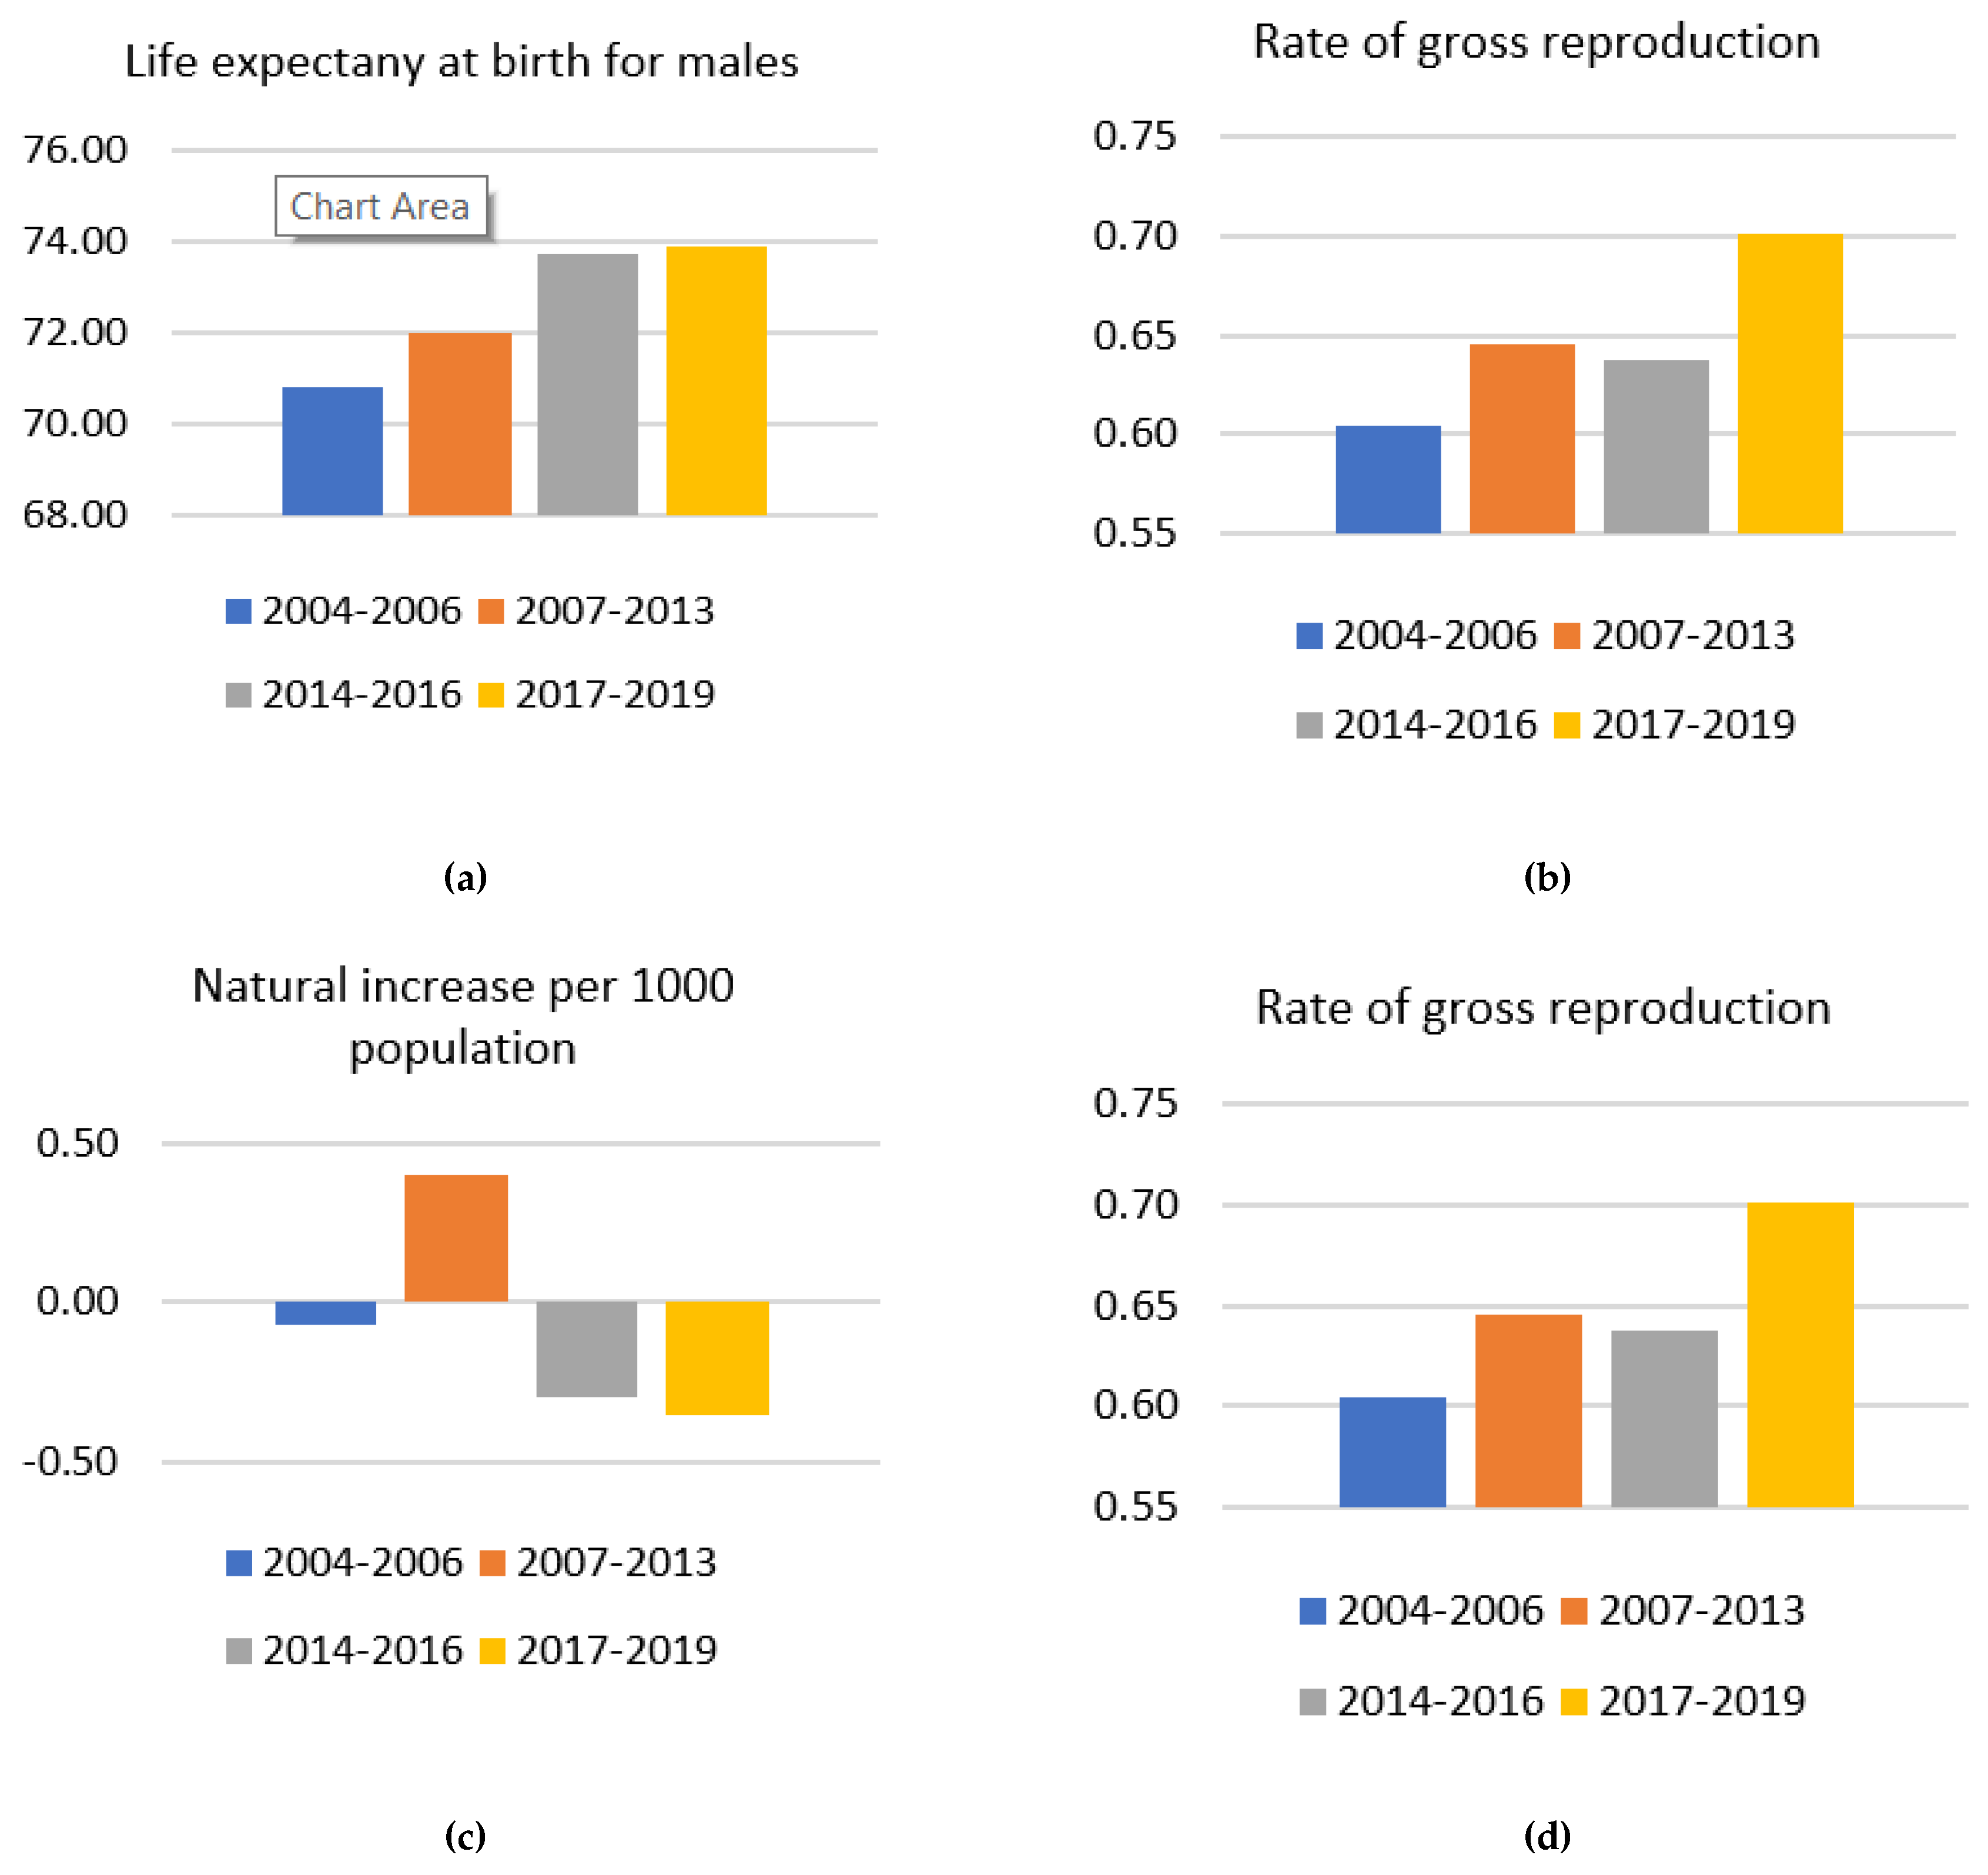
Table 6 and Figure 11 present mean values of the key demographic development factors which differentiate the development phases of the population aging process in Poland.
The expected average life expectancy at birth for males, increasing in the subsequent development phases was by far the most determining demographic factor responsible for the aging process of the Polish population in 2004–2019.
It appeared that this variable was most strongly correlated with the population aging indicators. In addition, other demographic factors related to life expectancy or further life span were also strongly correlated with this demographic factor (correlation coefficients exceed 0,99) (LEF0, LEF65, LEM65).
Other demographic factors differentiating the individual development phases of the aging process, arranged by their decreasing significance are as follows: gross reproduction (GR), natural increase (NI) and total net migration (TNM).
The rate of gross reproduction is determined by the population replacement rate ingrained in the society. The subsequent development phases of the aging process in Poland were characterized by the increasing mean values of the reproduction rate, which should be considered a favorable trend in demographic development. The exception is phase II, in the course of which this indicator value presented a slight decline. However, the values of GR rate in any of the distinguished development phases did not guarantee a simple population replacement, resulted in the continued narrowed reproduction and thus deteriorating age structure of the population in Poland. Live births (LB) and total fertility (TF) were strongly correlated with the simple reproduction rate.
Natural increase was another key factor determining the development phases of the population aging in Poland. Only during the longest, II development phase, covering the years 2007–2013, characterized by a slowdown in the population aging process, was the mean value of the natural increase positive and amounted to approx. 0.4%. The remaining phases showed a negative birth rate, the lowest one was recorded in the last phase.
The total net migration (TNM) is the last of the identified demographic factors influencing the development phases of the population aging process in Poland and also the one of the least importance. The first three development phases were characterized by a negative total migration balance (in phase II and phase III this ratio was very similar). In the fourth development phase, there was a slight immigration surplus over emigration. Population migrations have an impact on the demographic development, since usually it is young people who are leaving, hence the negative migration balance results in population aging.
7. Discussion
At this point, it is worth investigating the main causes of death in Poland [67]. Basically, they include cardiovascular diseases and malignant tumours. In 2016, they were responsible for approximately 70% of all deaths. Almost every second person in Poland dies from heart and vascular diseases, approximately 25% from cancer. Young people die more often as a result of accidents, suicides, and crimes. It can be adopted that men are at the highest risk of developing cardiovascular diseases and to a lesser extent, cancer. In the case of women, these proportions are slightly different. Malignant neoplasms are the most dangerous for those under the age of 75, and it is only at the oldest age that cardiovascular diseases become the number one threat. The health condition of Poles, which requires improvement, is primarily influenced by the growing epidemic of excess weight and obesity, smoking, lack of exercise, improper eating habits, and fairly high alcohol consumption among men. In general, in relation to the European Union countries, Poland is distinguished by a low level of physical activity of the population and a high prevalence of the smoking addiction among men. The systemic causes of the society’s health situation, partly responsible for its aging process, were summarized highlighting, in particular, the insufficient funds, imprecise legal regulations, lack of care standards, and resource allocation mechanisms. In general, the system was identified as inappropriately adapted to the actual health needs of the society. The reasons for this situation are perceived in insufficient expenditure on health care compared to other European countries. Concerns are raised by the level of infant mortality in Poland, which is higher than the average one for the European Union. In Poland, each year in the years 2015–2017, before the end of the first year of life, 40 children died out of every 10,000 live births, whereas the average for the EU countries was 36 (in 2016). The population of Poland is still, on average, younger than the population of most European Union countries, but Eurostat forecasts indicate that this favourable difference will slowly disappear and in the middle of the current century both the median age and the percentage of people aged 65 and over will be higher in Poland than the average in the European Union Member States. In view of the aforementioned forecasts, there is now still time to take up the respective countermeasures.
Based on the conducted studies and analyses, a set of several recommendations aimed at supporting the functioning of seniors and counteracting environmental threats can be put forward:
- Actions should be taken to reduce greenhouse gas emissions, which include thermomodernization of residential and public utility buildings, more extensive use of natural gas at the expense of coal including production plants, modernization of the heating networks, improving the energy efficiency of lighting, electronic equipment, the reduction of methane emissions, using public transport, taking advantage of the renewable energy sources, more effective municipal waste and wastewater management, planting trees, recycling, improving infrastructure for cyclists and pedestrians, imposing stricter emission standards for internal combustion engines [68].
- Investments are required to improve the condition of flood protection infrastructure [69,70] combined with an effective warning system against threats within the framework of crisis management in the local government units. Further investments in road infrastructure, the construction of ring roads resulting in the reduction of traffic noise and vibrations of building are needed. In terms of the groundwater exploitation, it is necessary to consistently take care of the hydrogeological balance, which is part of the environmental area of sustainable development.
- In Poland, air pollution constitutes one of the essential environmental problems, which has a disastrous effect on senior citizens. This pollution type has a negative impact on health as a result of both long- and short-term exposure. It is caused by so-called low emission, which has its sources in domestic furnaces and local coal-fired boilers responsible for inefficient coal combustion and also in combustion transport (cars). It is easy to guess that the remedy to this problem is the transition from coal-fired buildings to more economical ones as well as the reduction of exhaust emissions.
- Natural resources should be exploited in a rational and thoughtful way. Their stock is not unlimited. Great importance should also be attached to biodiversity which strengthens our national ecosystem. In addition, afforestation is a process that should be continued at least at the current intensity level.
- Two issues are important in the process focused on extending lifespan of the society in full health: the level of medical care, with particular attention paid to check-ups and preventive measures and also the promotion of a healthy lifestyle [71]. The respective activities and financial resources should be allocated to prevention, education in the field of cardiovascular diseases, diabetes, obesity [72,73], and cancer. The country residents are living longer and longer, therefore it is necessary to activate older people but also to draw on their knowledge and life experience. NGOs can be helpful in this regard.
- One of the most important ways to counteract the phenomenon of aging is to promote pro-family policy and the model of a large family. The elderly, in addition to avoiding the risk related to environmental hazards, should have access to high-quality medical care which should be allocated higher financial outlays. Ecological education [74] addressing the importance and impact of environmental changes on our life comfort is also helpful [75]. The education sector should be used in terms of teaching about the benefits of healthy eating habits, physical activity, good mental condition, or regeneration of older people.
8. Conclusions
The following conclusions can be drawn from the conducted empirical studies addressing periodization of the population aging process:
- The development of the population aging process in Poland is not homogeneous. In the years 2004–2019, its four development phases were identified, which means that over the analyzed period, the recorded significant changes in the advancement of the population aging process occurred four times.
- The turning points in the development of the population aging process in Poland coincide with the boundaries of the development phases defining various types of populations, differing in the degree and specificity of the aging process advancement related to Polish population. They fall at the turn of 2006/2007, 2013/2014, and 2016/2017.
- The population aging process in Poland was systematically progressing in the course of the development phase I and II; however, it definitely accelerated during the development phase III and did not slow down in phase IV.
- The population of Poland was characterized by a favourable structure of the economic dependency of working age population in the first two development phases. There occurred an excessive dependency on the pre-working age group over the post-working age group, amounting to over 5% points in the development phase I and slightly over 2% points in phase II. During phase III, the economic dependency structure of the working age population changed, for the first time, to an unfavourable one (the difference between the OADR and YADR indicators was −0.6% points. In phase IV, this negative phenomenon was strengthened (the difference between OADR and YADR went up to almost 3% points).
- In the development phase IV, the population aging process was manifested by almost half of the population economically dependent on the productive age group, including more than a quarter of senior citizens. It definitely requires state intervention and undertaking actions aimed at changing both the level and structure of the demographic burden.
- The key demographic factors differentiating the developmental phases of the population aging process in Poland in 2004–2019 include, in order of their significance, longer life expectancy of the population, narrowed gross reproduction rate, declining birth rate, and total migration balance.
- The multidimensional statistical analysis methods used in the research proved to be useful for the purposes of identifying the development phases of the population aging process in Poland, for the population typology in non-homogenous sub-periods and for determining the key demographic factors differentiating the identified development phases of the population aging process in Poland.
The research scope adopted in this study has been limited to the macroeconomic scale covering the area of Poland. Three basic directions for further research can be formulated. The first of them is the analysis and assessment of the aging processes in Poland from a regional and local perspective—at the level of cities and villages, and an attempt to identify these factors which determine the occurring differences. Another important research direction is carrying out comparative analyses relating the situation of population aging in Poland, based on the national, regional, and micro-spatial perspective, to the analogical processes taking place in the European Union countries. The studies confronting the economic and social effects of Polish population aging with the assessment of the actions taken up by the state or regional and local authorities in terms of infrastructure adaptation, the development of health services, social welfare, as well as the allocation of financial outlays in the perspective of further increase in senior citizens’ population may turn out valuable.
Climate change is an indisputable phenomenon. Despite that, however, it is very difficult to find statistical data that could clearly illustrate the level of this phenomenon. Polish public statistics lack data regarding, e.g., floods or droughts. The data on heavy rains or landslides are also missing. They are slowly being collected, but their vast majority raises reservations. The need to collect and analyze this type of data is necessary as the discussed phenomena affect people’s health and lives. The elderly are particularly vulnerable in this respect.
Author Contributions
All authors designed the research, analyzed the data and wrote the paper. All authors have read and agreed to the published version of the manuscript.
Funding
The project is financed by the Ministry of Science and Higher Education in Poland under the program “Regional Initiative of Excellence” 2019–2022 project number 015/RID/2018/19 total funding amount 10 721 040,00 PLN.
Conflicts of Interest
The authors declare no conflicts of interest.
References
- Doh, J.P.; Guay, T.R. Corporate social responsibility, public policy, and NGO activism in Europe and the United States: An institutional-stakeholder perspective. J. Manag. Stud. 2006, 43, 47–73. [Google Scholar] [CrossRef]
- Cichowicz, E.; Rollnik-Sadowska, E. Inclusive Growth in CEE Countries as a Determinant of Sustainable Development. Sustainability 2018, 10, 3973. [Google Scholar] [CrossRef] [Green Version]
- Hełdak, M.; Raszka, B. Evaluation of the Local Spatial Policy in Poland with Regard to Sustainable Development. Pol. J. Environ. Stud. 2013, 22, 395–402. [Google Scholar]
- Smith, B. Good Governance and Development; Palgrave Macmillan: New York, NY, USA, 2007; ISBN 978-0230525665. [Google Scholar]
- Leszko, M.; Zając-Lamparska, L.; Trempala, J. Aging in Poland. Gerontologist 2015, 55, 707–715. [Google Scholar] [CrossRef] [Green Version]
- Robbins, J. Aging Societies, Civil Societies, and the Role of the Past: Active Aging beyond Demography in Contemporary Poland. East Eur. Politics Soc. 2020. [Google Scholar] [CrossRef]
- Stimson, R.; Stough, R.; Roberts, B. Regional Economic Development. Analysis and Planning Strategy; Springer: Heidelberg, Germany, 2006; ISBN 978-3540348290. [Google Scholar]
- Raszkowski, A.; Bartniczak, B. Towards Sustainable Regional Development: Economy, Society, Environment, Good Governance Based on the Example of Polish Regions. Transform Bus. Econ. 2018, 17, 225–245. [Google Scholar]
- Raszkowski, A.; Bartniczak, B. On the Road to Sustainability: Implementation of the 2030 Agenda Sustainable Development Goals (SDG) in Poland. Sustainability 2019, 11, 366. [Google Scholar] [CrossRef] [Green Version]
- Raszkowski, A.; Bartniczak, B. Sustainable Development in the Central and Eastern European Countries (CEECs): Challenges and Opportunities. Sustainability 2019, 11, 1180. [Google Scholar] [CrossRef] [Green Version]
- Starr, F. Corporate Responsibility for Cultural Heritage: Conservation, Sustainable Development, and Corporate Reputation; Routledge Studies of Heritage, Routledge: New York, NY, USA, 2013; ISBN 978-0415656191. [Google Scholar]
- Johnston, P.; Everard, M.; Santillo, D.; Robert, K. Reclaiming the definition of sustainability. Environ. Sci. Pollut. Res. 2007, 14, 60–66. [Google Scholar]
- Bartniczak, B.; Raszkowski, A. Sustainable Development in African Countries: An Indicator-Based Approach and Recommendations for the Future. Sustainability 2019, 11, 22. [Google Scholar] [CrossRef] [Green Version]
- Bartniczak, B.; Raszkowski, A. Sustainable development in Asian countries–indicator-based approach. Probl. Ekorozw. Probl. Sustain. Dev. 2019, 14, 29–42. [Google Scholar]
- Coulson, A.; Campbell, A. Local government in central and Eastern Europe: Introduction. Local Gov. Stud. 2006, 32, 539–541. [Google Scholar] [CrossRef]
- Edwards, M.; Hulme, D. NGO Performance and Accountability. Introduction and Overview. In Non-Governmental Organisations. Performance and Accountability. Beyond the Magic Bullet; Edwards, M., Hulme, D., Eds.; Earthscan Publications: London, UK, 1995; ISBN 978-1853833106. [Google Scholar]
- Agere, S. Promoting Good Governance: Principles, Practices and Perspectives; Commonwealth Secretariat: Management Service Training Division: London, UK, 2000; ISBN 978-0850926293. [Google Scholar]
- Raszkowski, A.; Sobczak, E. Sustainability in the Baltic States: Towards the implementation of sustainable development goals (SDG). In The 13th International Days of Statistics and Economics; Löster, T., Pavelka, T., Eds.; Libuše Macáková, Melandrium: Prague, Czech Republic, 2019; pp. 1253–1262. [Google Scholar]
- Bartniczak, B.; Raszkowski, A. Sustainable development in the Russian Federation–indicator-based approach. Probl. Ekorozw. Probl. Sustain. Dev. 2017, 12, 133–142. [Google Scholar]
- Pawłowski, A. Sustainable Development as a Civilizational Revolution: A Multidisciplinary Approach to the Challenges of the 21st Century; CRC Press: Boca Raton, FL, USA; Taylor & Francis Group: London, UK, 2011; ISBN 978-0415578608. [Google Scholar]
- Galic, N.; Schmolke, A.; Forbes, V.; Baveco, H.; Brink, P.J. The role of ecological models in linking ecological risk assessment to ecosystem services in agroecosystems. Sci. Total Environ. 2012, 415, 93–100. [Google Scholar] [CrossRef] [Green Version]
- Heberle, L. Sustainable Urban Development: Local Strategies and Global Solutions. In Local Sustainable Urban Development in a Globalized World. Urban Planning and Environment; Heberle, L., Opp, S., Eds.; Ashgate Publishing: Farnham, UK, 2008; pp. 1–8. ISBN 978-0754649946. [Google Scholar]
- Connelly, A.; Carter, J.; Handley, J.F.; Hincks, S. Enhancing the practical utility of risk assessments in climate change adaptation. Sustainability 2018, 10, 1399. [Google Scholar] [CrossRef] [Green Version]
- Kelly, P.M.; Adger, W.N. Theory and practice in assessing vulnerability to climate change and facilitating adaptation. Clim. Chang. 2000, 47, 325–352. [Google Scholar] [CrossRef]
- Michałowski, A. Ecosystem services in the light of a sustainable knowledge-based economy. Probl. Ekorozw. Probl. Sustain. Dev. 2012, 7, 97–106. [Google Scholar]
- Salonen, A.; Siirilä, J.; Valtonen, M. Sustainable Living in Finland: Combating Climate Change in Everyday Life. Sustainability 2018, 10, 104. [Google Scholar] [CrossRef] [Green Version]
- Bartniczak, B.; Raszkowski, A. Sustainable forest management in Poland. Manag. Environ. Qual. Int. J. 2018, 29, 666–677. [Google Scholar] [CrossRef]
- Fischer, A.P.; Paveglio, T.; Brenkert-Smith, H.; Carroll, M.; Murphy, D. Assessing social vulnerability to climate change in human communities near public forests and grasslands: A framework for resource managers and planners. J. For. 2013, 111, 357–365. [Google Scholar] [CrossRef] [Green Version]
- Schmithüsen, F.; Kaiser, B.; Schmidhauser, A.; Mellinghoff, S.; Perchthaler, K.; Kammerhofer, A. Entrepreneurship and Management in Forestry and Wood Processing: Principles of Business Economics and Management Processes; Routledge Explorations in Environmental Economics, Routledge: New York, NY, USA, 2014; ISBN 978-1138675230. [Google Scholar]
- Czaja, S.; Bacla, A. Ekologiczne Podstawy Procesów Gospodarowania; Wydawnictwo Akademii Ekonomicznej: Wrocław, Polska, 2002; ISBN 8370118365. [Google Scholar]
- Jones, R.N. An environmental risk assessment/management framework for climate change impact assessments. Nat. Hazards 2001, 23, 197–230. [Google Scholar] [CrossRef]
- Staniszewski, J.; Czyżewski, A. Economic factors underpinning the structural genotypes of agriculture development in the European Union after 2004. J. Agribus. Rural Dev. 2018, 50, 445–454. [Google Scholar] [CrossRef]
- Markowski, T. Territorial dimensions of integrated development policy—Expectations and challenges concerning planning and institutional systems. Stud. Reg. 2013, 35, 51–64. [Google Scholar]
- Statistics Poland, Local Data Bank. Available online: https://bdl.stat.gov.pl/BDL/start (accessed on 20 April 2020).
- Polityka Ekologiczna Państwa 2030; Ministerstwo Środowiska: Warszawa, Poland, 2019. Available online: https://www.gov.pl/web/srodowisko/polityka-ekologiczna-panstwa-polityka-ekologiczna-panstwa-2030 (accessed on 5 June 2020).
- Environment 2018; Statistics Poland: Warsaw, Poland, 2018; p. 28. Available online: https://stat.gov.pl/en/topics/environment-energy/environment/environment-2018,1,10.html (accessed on 5 June 2020).
- Environment 2017; Central Statistical Office: Warsaw, Poland, 2017; p. 104. Available online: https://stat.gov.pl/en/topics/environment-energy/environment/environment-2017,1,9.html (accessed on 5 June 2020).
- Environment 2016; Central Statistical Office: Warsaw, Poland, 2016; p. 104. Available online: https://stat.gov.pl/en/topics/environment-energy/environment/environment-2016,1,8.html (accessed on 5 June 2020).
- Environment 2015; Central Statistical Office: Warsaw, Poland, 2015; p. 104. Available online: https://stat.gov.pl/en/topics/environment-energy/environment/environment-2015,1,7.html (accessed on 5 June 2020).
- Environment 2014; Central Statistical Office: Warsaw, Poland, 2014; p. 107. Available online: https://stat.gov.pl/en/topics/environment-energy/environment/environment-2014,1,5.html (accessed on 5 June 2020).
- Environment 2013; Central Statistical Office: Warsaw, Poland, 2013; p. 91. Available online: https://stat.gov.pl/en/topics/environment-energy/environment/environment-2013,1,6.html (accessed on 5 June 2020).
- Environment 2012; Central Statistical Office: Warsaw, Poland, 2012; p. 91. Available online: https://stat.gov.pl/en/topics/environment-energy/environment/environment-2012,1,4.html (accessed on 5 June 2020).
- Environment 2011; Central Statistical Office: Warsaw, Poland, 2011; p. 91. Available online: https://stat.gov.pl/en/topics/environment-energy/environment/environment-2011,1,3.html (accessed on 5 June 2020).
- Environment 2010; Central Statistical Office: Warsaw, Poland, 2010; p. 91. Available online: https://stat.gov.pl/en/topics/environment-energy/environment/environment-2010,1,2.html (accessed on 5 June 2020).
- Environment 2009; Central Statistical Office: Warsaw, Poland, 2009; p. 91. Available online: https://stat.gov.pl/en/topics/environment-energy/environment/environment-protection-2009,1,1.html (accessed on 5 June 2020).
- Statistics Poland. Environment 2008; Central Statistical Office: Warsaw, Poland, 2008; p. 99.
- Statistics Poland. Environment 2007; Central Statistical Office: Warsaw, Poland, 2007; p. 97.
- Statistics Poland. Environment 2006; Central Statistical Office: Warsaw, Poland, 2006; p. 95.
- Błażejczyk, K.; Kunert, A. Bioclimatic Principles of Recreation and Tourism in Poland; Polish Academy of Sciences, Stanisław Leszczycki Institute of Geography and Spatial Organization: Warsaw, Poland, 2011; ISBN 978-83-61590-47-7. [Google Scholar]
- Kukuła, K. Metoda Unitaryzacji Zerowanej; Wydawnictwo Naukowe PWN: Warszawa, Polska, 2000; ISBN 8301130970. [Google Scholar]
- Walesiak, M. Uogólniona Miara Odległości w Statystycznej Analizie Wielowymiarowej; Wydawnictwo Akademii Ekonomicznej: Wrocław, Polska, 2006; ISBN 8370118186. [Google Scholar]
- Jajuga, K.; Walesiak, M. Standardisation of data set under different measurement scales. In Classification and Information Processing at the Turn of the Millennium; Decker, R., Gaul, W., Eds.; Springer: Berlin/Heidelberg, Germany, 2000; pp. 105–112. ISBN 978-3540675891. [Google Scholar]
- Zeliaś, A. Some Notes on the Selection of Normalisation of Diagnostic Variables. Stat. Transit. 2002, 5, 787–802. [Google Scholar]
- Milligan, G.W.; Cooper, M.C. A Study of Standardization of Variables in Cluster Analysis. J. Classif. 1988, 5, 181–204. [Google Scholar] [CrossRef]
- Ward, J.H. Hierarchical Grouping of Optimize an Objective Function. J. Am. Stat. Assoc. 1963, 58, 236–244. [Google Scholar] [CrossRef]
- Johnson, S.C. Hierarchical clustering schemes. Psychometrika 1967, 39, 241–254. [Google Scholar] [CrossRef]
- Anderberg, M.R. Cluster Analysis for Application; Academic Press: New York, NY, USA; San Francisco, CA, USA; London, UK, 1973; ISBN 978-1483191393. [Google Scholar]
- Hartigan, J.A. Clustering Algorithms; John Wiley & Sons: New York, NY, USA, 1975; ISBN 978-0-471-35645-5. [Google Scholar]
- Sneath, P.H.A.; Sokal, R.R. Numerical Taxonomy. The Principles and Practice of Numerical Classification; W.H. Freeman and Company: San Francisco, CA, USA, 1973; ISBN 978-0716706977. [Google Scholar]
- Aldefender, M.S.; Blashfield, R.K. Cluster Analysis; Sage Press: Beverly Hills, CA, USA; Los Angeles, CA, USA, 1984; ISBN 978-0803923768. [Google Scholar]
- Basiura, B.; Sokołowski, A. The clustering effectiveness in Ward’s method. Folia Oeconomica Crac. 2007, 46–47, 53–64. [Google Scholar]
- Everitt, B.S.; Landau, S.; Leese, M.; Stahl, D. Cluster Analysis; John Wiley & Sons: Chichester, UK, 2011; ISBN 978-9462094048. [Google Scholar]
- Sobczak, E. Segmentacja Rynków Zagranicznych; Wydawnictwo Uniwersytetu Ekonomicznego we Wrocławiu: Wrocław, Polska, 2010; ISBN 978-8376950228. [Google Scholar]
- Hellwig, Z. Wielowymiarowa analiza porównawcza i jej zastosowanie w badaniach wielocechowych obiektów gospodarczych. In W: Metody i Modele Matematyczno-Ekonomiczne w Doskonaleniu Zarządzania Gospodarką Socjalistyczną; Welfe, W., Ed.; Wydawnictwo Naukowe PWN: Warszawa, Polska, 1981; ISBN 978-8320800425. [Google Scholar]
- Statistics Poland. Available online: https://stat.gov.pl/en/ (accessed on 14 April 2020).
- Eurostat Database. Available online: https://ec.europa.eu/eurostat/data/database (accessed on 14 April 2020).
- Wojtyniak, B.; Goryński, P. (Eds.) Health Status of Polish Population and Its Determinants; National Institute of Public Health, National Institute of Hygiene: Warsaw, Poland, 2018; ISBN 978-8365870162. [Google Scholar]
- Füssel, H.-M.; Klein, R.J. Climate change vulnerability assessments: An evolution of conceptual thinking. Clim. Chang. 2006, 75, 301–329. [Google Scholar] [CrossRef]
- Szewrański, S.; Kazak, J.; Szkaradkiewicz, M.; Sasik, J. Flood risk factors in suburban area in the context of climate change adaptation policies—Case study of Wroclaw, Poland. J. Ecol. Eng. 2015, 16, 13–18. [Google Scholar] [CrossRef]
- Szewrański, S.; Świąder, M.; Kazak, J.; Tokarczyk-Dorociak, K.; Van Hoof, J. Socio-Environmental Vulnerability Mapping for Environmental and Flood Resilience Assessment: The Case of Ageing and Poverty in the City of Wroclaw, Poland. Integr. Environ. Assesment Manag. 2018, 14, 592–597. [Google Scholar] [CrossRef] [PubMed] [Green Version]
- Kerr, J.; Rosenberg, D.; Frank, L. The role of the built environment in healthy aging: Community design, physical activity, and health among older adults. J. Plan. Lit. 2012, 27, 43–60. [Google Scholar] [CrossRef]
- Marteau, T.M.; Hollands, G.J.; Fletcher, P.C. Changing human behavior to prevent disease: The importance of targeting automatic processes. Science 2012, 337, 1492–1495. [Google Scholar] [CrossRef] [PubMed] [Green Version]
- Sallis, J.F.; Floyd, M.F.; Rodríguez, D.A.; Saelens, B.E. Role of built environments in physical activity, obesity and cardiovascular disease. Circulation 2012, 125, 729–737. [Google Scholar] [CrossRef]
- Judson, G. Engaging Imagination in Environmental Education: Practical Strategies for Teachers; University of British Columbia Press: Vancouver, BC, Canada, 2017; ISBN 978-1926966755. [Google Scholar]
- Ramanathan, V.; Han, H.; Matlock, T. Education Children to Bend the Curve: For a Stable Climate, Sustainable Nature and Sustainable Humanity. In Children and Sustainable Development: Ecological Education in a Globalized World; Battro, A., Léna, P., Sorondo, M., Braun, J., Eds.; Springer International Publishing: Cham, Germany, 2017; pp. 3–16. ISBN 978-3319471297. [Google Scholar]
Figure 1.
Natural increase rate and net migration in the years 2004–2018 [34].
Figure 1.
Natural increase rate and net migration in the years 2004–2018 [34].

Figure 2.
Population by economic age groups in the years 2004–2018 (%) [34].
Figure 2.
Population by economic age groups in the years 2004–2018 (%) [34].

Figure 3.
Share of the population by age groups in 2004 and 2018 [34].
Figure 3.
Share of the population by age groups in 2004 and 2018 [34].

Figure 4.
Life expectancy at birth in the years 2004–2018 [34].
Figure 4.
Life expectancy at birth in the years 2004–2018 [34].

Figure 5.
Life expectancy at the age of 65 in the years 2004–2018 [34].
Figure 5.
Life expectancy at the age of 65 in the years 2004–2018 [34].

Figure 6.
Old-age dependency ratio [34].
Figure 6.
Old-age dependency ratio [34].

Figure 7.
Demographic aging rate in the years 2004–2018 (%) [34].
Figure 7.
Demographic aging rate in the years 2004–2018 (%) [34].

Figure 8.
Aging index in the years 2004–2018 [34].
Figure 8.
Aging index in the years 2004–2018 [34].

Figure 9.
Dendrogram of connections, integration distances, and classification stages using Ward’s method for the years 2004–2019 regarding measure values of population aging in Poland. Authors’ compilation based on [65,66] applying STATISTICA 13.1 PL statistical package, StatSoft Polska Ltd., Cracow.

Figure 10.
Mean values of the normalized population aging indicators in Poland in the identified development phases in the years 2004–2019. Authors’ compilation based on [65,66] applying STATISTICA 13.1 PL statistical package, StatSoft Polska Ltd., Cracow.

Figure 11.
Mean values of demographic factors differentiating the development phases of the population aging process in Poland in the years 2004–2019 [65,66].


Table 1.
Average air temperatures in the years 2004–2017.
| Meteorological Stations | 2004 | 2005 | 2006 | 2007 | 2008 | 2009 | 2010 | 2011 | 2012 | 2013 | 2014 | 2015 | 2016 | 2017 |
|---|---|---|---|---|---|---|---|---|---|---|---|---|---|---|
| Hel | 8.4 | 8.5 | 9.1 | 9.5 | 9.3 | 8.6 | 7.4 | 8.8 | 8.4 | 8.7 | 9.4 | 9.6 | 9.5 | 9.0 |
| Warszawa | 8.4 | 8.6 | 9 | 9.6 | 9.8 | 8.9 | 8 | 9.1 | 8.8 | 8.9 | 9.8 | 10.3 | 9.8 | 9.4 |
| Lublin | 7.8 | 7.8 | 8 | 8.8 | 8.9 | 8.2 | 7.5 | 8.3 | 8.1 | 8.1 | 9 | 9.4 | 8.7 | 8.4 |
| Śnieżka | 0.7 | 0.9 | 2.1 | 1.9 | 1.7 | 1.6 | 0.1 | 2 | 1.3 | 0.9 | 2.7 | 2.4 | 1.7 | 1.4 |
Table 2.
Insolation in the years 2004–2017.
| Meteorological Stations | 2004 | 2005 | 2006 | 2007 | 2008 | 2009 | 2010 | 2011 | 2012 | 2013 | 2014 | 2015 | 2016 | 2017 |
|---|---|---|---|---|---|---|---|---|---|---|---|---|---|---|
| Hel | 1790 | 1986 | 1993 | 1797 | 1923 | 1901 | 1856 | 2087 | 1951 | 1905 | 1778 | - | 2021 | 1903 |
| Warszawa | 2259 | 2460 | 2502 | 2305 | 2241 | 2258 | 2204 | 2418 | 2393 | 2234 | 2278 | 1931 | 1836 | 1351 |
| Lublin | 1738 | 1559 | 1714 | 1756 | 1772 | 1823 | 1689 | 1906 | 1786 | 1649 | 1828 | 2012 | 1872 | 1783 |
| Śnieżka | 1285 | 1273 | 1685 | 1550 | 1408 | - | 1406 | 1767 | 1625 | 1330 | 1411 | 1721 | 1374 | 1456 |
Table 3.
Total annual precipitation in mm in the years 2004–2017.
| Meteorological Stations | 2004 | 2005 | 2006 | 2007 | 2008 | 2009 | 2010 | 2011 | 2012 | 2013 | 2014 | 2015 | 2016 | 2017 |
|---|---|---|---|---|---|---|---|---|---|---|---|---|---|---|
| Hel | 690 | 500 | 562 | 691 | 616 | 673 | 779 | 521 | 695 | 583 | 455 | 519 | 703 | 826 |
| Warszawa | 523 | 490 | 479 | 602 | 537 | 652 | 798 | 604 | 519 | 613 | 555 | 404 | 593 | 705 |
| Lublin | 590 | 559 | 521 | 662 | 649 | 681 | 751 | 502 | 503 | 650 | 790 | 532 | 698 | 612 |
| Śnieżka | 1036 | 1273 | 1072 | 1272 | 983 | 1213 | 1316 | 928 | 1008 | 1222 | 887 | 897 | 995 | 1258 |
Table 4.
Wind velocity in the years 2004–2017.
| Meteorological Stations | 2004 | 2005 | 2006 | 2007 | 2008 | 2009 | 2010 | 2011 | 2012 | 2013 | 2014 | 2015 | 2016 | 2017 |
|---|---|---|---|---|---|---|---|---|---|---|---|---|---|---|
| Hel | 4 | 3.8 | 3.6 | 4 | 3.9 | 3.6 | 3.6 | 3.9 | 3.7 | 3.5 | 3.3 | 4.2 | 4.2 | 4.5 |
| Warszawa | 3.9 | 3.8 | 3.6 | 4 | 3.9 | 3 | 3.2 | 3.1 | 3.1 | 3 | 3.2 | 3.5 | 3.4 | 3.5 |
| Lublin | 3.2 | 3.1 | 2.9 | 3.1 | 3.1 | 2.8 | 3 | 3.2 | 3.2 | 3.1 | 2.9 | 3 | 2.9 | 3 |
| Śnieżka | 14.5 | 12.9 | 14.4 | 14.4 | 15.3 | 10 | 10.6 | 11.3 | 11.2 | 10.3 | 10.5 | 11.4 | 10.5 | 11.9 |
Table 5.
Development phases of the population aging process in Poland and the population types identified in the years 2004–2019.
Table 5.
Development phases of the population aging process in Poland and the population types identified in the years 2004–2019.
| Development Phases (Years) | Population Type | MA (Years) | SA65+ (%) | AI (%) | TADR (%) | OADR (%) | YADR (%) |
|---|---|---|---|---|---|---|---|
| Mean Values of Indicators | |||||||
| Phase I 2004–2006 (3) | Aging population with the potential of future labour resources | 36.5 | 13.1 | 78.7 | 42.6 | 18.7 | 23.8 |
| Phase II 2007–2013 (7) | Advanced in the aging process, with reduced but structurally unfavourable total dependency | 37.9 | 13.7 | 89.4 | 40.9 | 19.3 | 21.6 |
| Phase III 2014–2016 (3) | Highly advanced in the aging process, with increased and structurally unfavourable dependency | 39.6 | 15.4 | 10.9 | 43.8 | 22.2 | 21.6 |
| Phase IV 2017–2019 (3) | Old, presenting the highest dependency ratio of people in non-working age, with the increasing predominance of seniors | 40.6 | 17.1 | 112.2 | 47.8 | 25.3 | 22.5 |
Table 6.
Mean values of demographic factors differentiating the development phases of the population aging process in Poland in the years 2004–2019.
Table 6.
Mean values of demographic factors differentiating the development phases of the population aging process in Poland in the years 2004–2019.
| Development Phases (Years) | Population Type | LEM0 | GR | NI | TNM |
|---|---|---|---|---|---|
| Mean Values of Demographic Factors | |||||
| Phase I 2004–2006 (3) | Aging population with the potential of future labour resources | 70.80 | 0.60 | –0.07 | –0.47 |
| Phase II 2007–2013 (7) | Advanced in the aging process, with reduced but structurally unfavourable total dependency | 72.01 | 0.65 | 0.40 | –0.26 |
| Phase III 2014–2016 (3) | Highly advanced in the aging process, with increased and structurally unfavourable dependency | 73.76 | 0.64 | –0.30 | –0.27 |
| Phase IV 2017–2019 (3) | Old, presenting the highest dependency ratio of people in non-working age, with the increasing predominance of seniors | 73.90 | 0.70 | -0.35 | 0.05 |
© 2020 by the authors. Licensee MDPI, Basel, Switzerland. This article is an open access article distributed under the terms and conditions of the Creative Commons Attribution (CC BY) license (http://creativecommons.org/licenses/by/4.0/).
Share and Cite
MDPI and ACS Style
Sobczak, E.; Bartniczak, B.; Raszkowski, A. Aging Society and the Selected Aspects of Environmental Threats: Evidence from Poland. Sustainability 2020, 12, 4648. https://0-doi-org.brum.beds.ac.uk/10.3390/su12114648
AMA Style
Sobczak E, Bartniczak B, Raszkowski A. Aging Society and the Selected Aspects of Environmental Threats: Evidence from Poland. Sustainability. 2020; 12(11):4648. https://0-doi-org.brum.beds.ac.uk/10.3390/su12114648
Chicago/Turabian StyleSobczak, Elżbieta, Bartosz Bartniczak, and Andrzej Raszkowski. 2020. "Aging Society and the Selected Aspects of Environmental Threats: Evidence from Poland" Sustainability 12, no. 11: 4648. https://0-doi-org.brum.beds.ac.uk/10.3390/su12114648
Note that from the first issue of 2016, this journal uses article numbers instead of page numbers. See further details here.