1. Introduction
To establish a circular economy in society, it is crucial to incorporate life-cycle analysis (LCA) in the design process of products. The largest potential for improvement of a product is early in the design process when fewer design choices and parameters have been established. However, this leads to the well-recognized problem of the design paradox when conducting LCA in the design process [
1,
2]. Early in the design phase it is easy to make changes, but less information is available. Late in the process there is more information, but it is difficult to make changes [
3]. The design paradox is not a problem specific to LCA but the wide system perspective of LCA makes it more apparent. There will be many uncertainties to manage when conducting LCA for use as a decision-support tool in the design process [
4].
Although there is an awareness that LCA provides results that are uncertain, many studies present their results as point estimates [
5]. To get reliable results and information from the calculations that will assist decision makers in choosing the final design, these uncertainties must be considered as well. In [
6] the types of uncertainties are grouped as:
The main difference between stochastic and choice uncertainties is that choice uncertainties are discrete, which means that there are several relevant options available, but no values in between the options. Stochastic uncertainty can be represented with, e.g., possibility distributions and is closely related to parameter uncertainty, since variability and data gaps can be managed by stochastic methods.
There are numerous research studies regarding uncertainties in LCA for buildings, e.g., [
7,
8,
9,
10,
11]. Many of these studies focus on how to calculate parametric uncertainties once they have been identified and how to take them into consideration when evaluating the results. This is also what is generally referred to when discussing uncertainties in life-cycle studies [
12]. There are therefore several methods described in the literature on how to manage stochastic uncertainty, of which Monte Carlo simulation, Taylor series expansion and fuzzy variables are frequently occurring. These methods are described and compared in [
13]. However, these methods will be less effective in the evaluation of design options when there are large uncertainties about how the production systems are structured, which can be the case when there are several design choices yet to be made. Satisfactorily evaluating all possible alternatives might not be feasible with the available resources in a project and the current design is usually explored in more detail than the alternatives [
14]. Since unknown environmental issues are generally omitted in LCAs, this can make alternative designs appear more favorable in an LCA than the current design [
14]. However, only considering parametric uncertainties when large parts of the studied system are unknown might provide results of low quality. To increase the value of LCA as decision support, more aspects of uncertainty need to be considered in the design process [
15]. Many of these uncertainties are of a different nature than stochastic uncertainty in the available data and are instead related to choices, e.g., decision criteria, design choices, modelling choices and system boundaries. Different results may be obtained depending on which option is selected in each choice [
16,
17]. Previously, conducted research on uncertainties in LCA show the need for methods to highlight choice uncertainty when presenting the results of an LCA. This paper presents and evaluates a procedure to manage choice uncertainties together with stochastic uncertainties to make a more informed and efficient decision regarding product design.
Integrating uncertainty analysis into an LCA can make different model structures and approaches suitable than those fitting for a deterministic study. When carrying out an LCA as a design decision tool and taking into account the possible uncertainties, it is necessary to reflect on, and likely alter the design of, the LCA and simulation models used in the calculations. This in turn affects how the results are presented and which conclusions are drawn from the results. This study investigated how the consequences of necessary, but subjective, choices can affect the outcome of an LCA. It also explored how the possible choices could be presented in a concise manner to get an overview of the problem’s complexity. The study addressed two issues: (1) how to decide between design options when uncertainties are considered, and (2) how to structure and present available choices in life-cycle studies. The suggested procedure can be carried out together with stochastic methods such as Monte Carlo analysis or uncertainty propagations calculations to strengthen the results as decision support for targeted decision makers.
To make the study more tangible, the procedure was developed with the targeted application of decisions regarding the design of buildings. Buildings are often built as one or several units, with new combinations of both building techniques and actors each time. This, together with a usage phase often spanning more than 50 years [
18,
19], qualifies a building to be a representative example of a complex product with a high degree of uncertainty during its life cycle.
2. Method
To demonstrate and evaluate the procedure, a simplified case study was carried out based on a study of a real building. The data regarding product and material amounts, contents, service life, spillage, man-hours, transport and maintenance were provided by the on-site contractors to get reliable data. More details of the original study can be found in [
20]. The inventory data and calculations from the study are also provided in the
Supplementary File. The studied object is a nine-storey office building in which the lower seven stories have a framework initially designed in concrete and the top two stories have a wooden framework. The question from the client was whether the wooden framework is a better design than the concrete framework from an environmental perspective. In the original study several issues were identified that are affected by decisions made by the LCA practitioner together with the stakeholders. To limit the case study, five identified issues were chosen to be addressed here. Each issue was analyzed to identify likely examples of available choices and how these would affect the design of an LCA. The chosen issues were the question the study should answer for the client, design decision rules, confidence level of the results, future scenario of the studied system and functional unit. The available choices were then managed and structured according to the developed procedure, DCP. To consider all kinds of uncertainties was not in the scope of the study. Adding more choice or parameter uncertainties might affect the conclusions in the case study but not the evaluation of DCP, which was the purpose of the case study.
To show how the available choices can affect the conclusions and how the procedure can be combined with stochastic methods, some selected combinations of options from the choices were evaluated using Monte Carlo simulations. All possible combinations were not calculated since the chosen selection was sufficient to evaluate the developed procedure and including all combinations would have made the case study unnecessarily large and difficult to overview. The calculations were performed using both point estimates and confidence intervals to also illustrate the difference in evaluating the results from a deterministic and a probabilistic study. Uncertainties regarding the data for material amounts and each product environmental impact factor had large impact in the original study and were therefore chosen for the Monte Carlo simulations in this study. The life-cycle of the building was divided according to EN 15804 [
21] and the included life-cycle phases for the study were A1–A5, B4, B6 and C1–C4. The material amounts for the concrete design alternative were assumed to have a normal distribution with a standard deviation of 10%, which was deemed reasonable after studying the data from the original study. Since the alternative design is usually less investigated, it was assumed that the material amounts for the wooden alternative had a larger degree of uncertainty, with a standard deviation of 15%. The impact factor for each product was estimated to be normally distributed, with a standard deviation of 15%. The investigated impact categories were global warming potential (GWP), eutrophication potential (EP), acidification potential (AP), stratospheric ozone depletion potential (ODP) and photochemical oxidants creation potential (POCP). The calculations were performed by randomly creating 5000 values for each amount and environmental factor according to their probability distribution, multiplying the amount and environmental factor for each product and finally summarizing the total impact for each design alternative.
As is common in design studies of buildings there were many choices to be made in the study design that would likely affect the conclusions to be made from the LCA. There was a need to manage these choices and their options in a structured way to obtain focused and constructive discussions. An outline of a procedure to was established by consulting previous research regarding choice uncertainties. The procedure was then assessed and updated with representatives from the Swedish building industry to develop a procedure that is applicable in practice for the industry. The literature investigations and assessments with the industry were carried out in an iterative process until the final procedure was developed. The general approach for the developed procedure was named Decision Choices Procedure (DCP) and consists of the following steps:
Identify the choice preferences and decision criteria to ensure that the decisions made are in line with the expectations of the stakeholders.
Map out a choice palette or a decision tree to get an understanding of the complexity of the problem.
Present and discuss the choice palette or decision tree to show the complexity of the problem to the stakeholders.
Choose a combination of options, one option for each question, and explain why this selection is preferred.
Calculate the results for the chosen combination or combinations.
Compare the calculated results against the decision criteria to obtain a design choice.
2.1. Application of the Decision Choices Procedure
The questions to be answered when comparing design alternatives are usually whether one design option is better than another or which alternative, among many, is the best. When the results are used as a decision-support tool it is crucial to quantify the decision criteria for the question to be able to verify its fulfilment. These decisions will affect which models are suitable to be used and therefore have a large impact on model uncertainties.
To choose between design options, decision criteria must be established. Otherwise, there is a clear risk that choices will be made on subjective and arbitrary grounds, which counteracts the purpose of carrying out a life-cycle study as a decision-support tool. It is also beneficial to make sure that only one design option can be chosen for every possible outcome, i.e., it should be decided which design option to choose when two or more options have the same or very similar environmental impact. An example of this could be that the current design (or a reference design) has precedence over alternative designs, or that the design alternatives are ranked based on other parameters than those investigated. As mentioned above, there is usually less information about the alternative designs and unknown environmental emissions are disregarded, which will make the alternative designs look more favorable. This could be an argument for choosing the current design if the results of the life-cycle study do not promote any other design option.
The first step is to decide which parameters are to be considered for evaluation, i.e., which types of emission or environmental impact categories. Thereafter, the thresholds for the parameters should be declared. If one parameter is chosen and it is a deterministic study, it would be natural to choose the design option with the lowest value. If several parameters are considered, a decision criterion for this must also be established, e.g., all parameters must be below the decided thresholds, the thresholds for a majority of the parameters must be met, or the thresholds for a specific parameter with a majority of the remaining parameters must be met. Another common solution is to assign weights to each parameter to indicate its importance. This is equivalent to considering a single parameter, as the assessment parameters are aggregated into a single value.
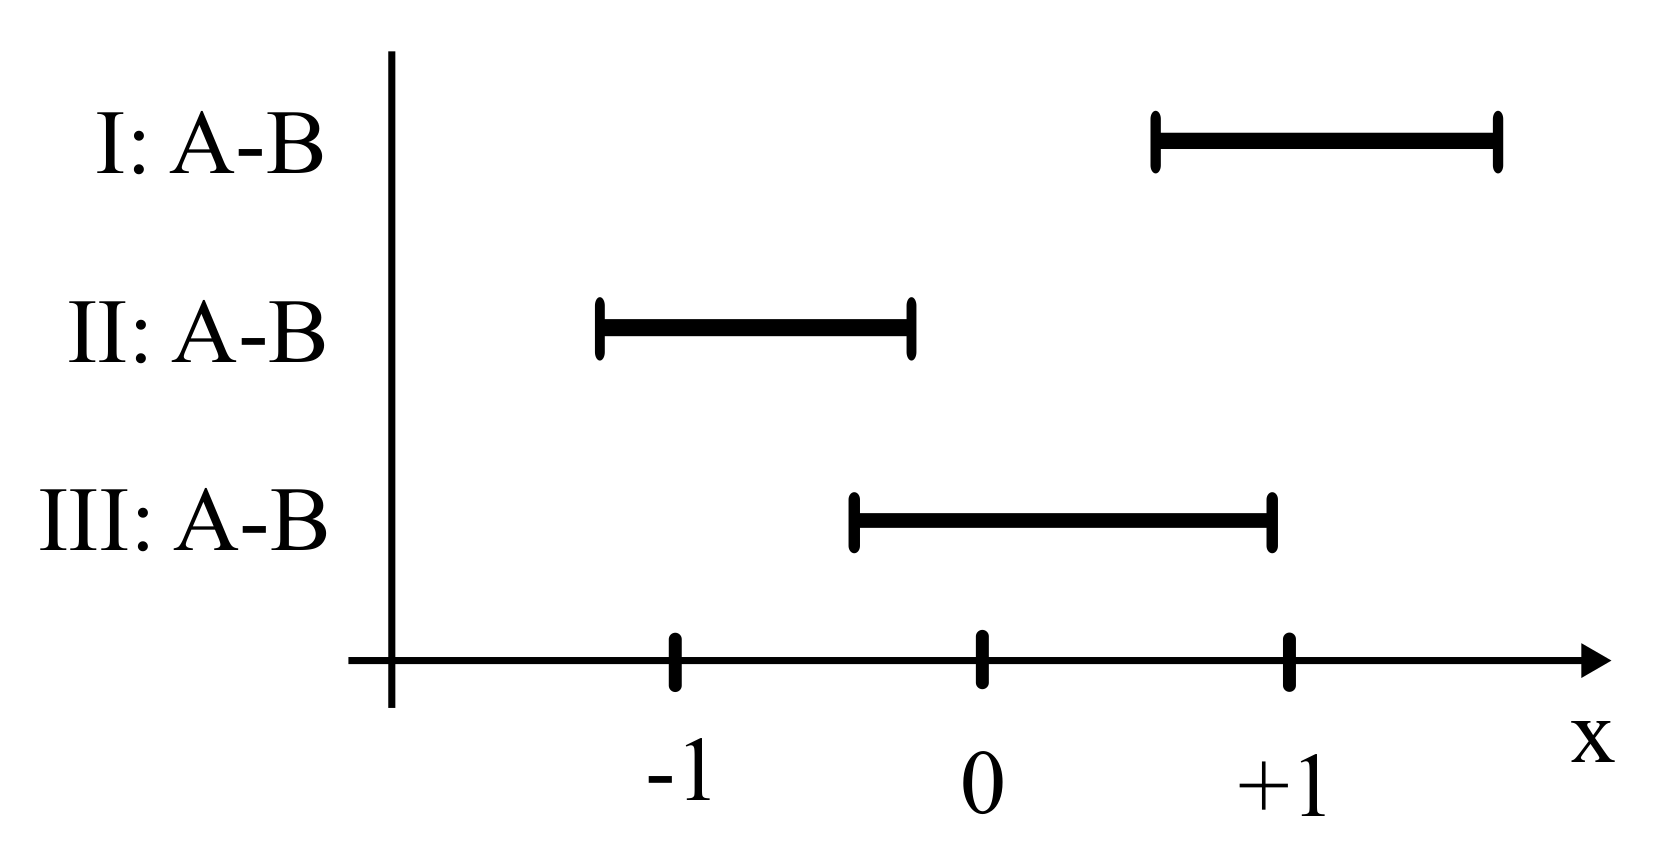
When conducting a probabilistic study, it is also necessary to consider the statistical significance of the results. For a study with a high confidence level it would be more demanding to gather data with a sufficiently high level of precision than it would be to conduct the same study with a lower confidence level. Choosing a high confidence level will lead to a higher certainty of drawn conclusions, but it will also increase the risk of getting non-conclusive results if data are lacking or not sufficiently precise. The reason for this is that higher confidence levels with the same data and calculation methods mean wider ranges of possible values. This increases the risk of overlapping intervals among the different design alternatives. When comparing two design alternatives it is possible to construct a confidence interval to evaluate the difference between them. If the confidence interval of alternative A–alternative B only contains positive values, it is interpreted that A is larger than B for all possible values of A and B at the chosen significance level. If the confidence interval of A–B only contains negative values, it means that B is larger than A for all possible values of A and B at the chose significance level. However, if the confidence interval of A–B contains both positive and negative values, the calculations fail to show a significant difference between A and B at the chosen significance level. The reason for this is that some possible values of A and B show that A is larger than B, while other possible values show that B is larger than A. A confidence interval containing both positive and negative values will always include the value zero, while positive or negative confidence intervals do not. This makes the value zero a good indicator to check if the confidence interval shows a statistically significant difference; see example in
Figure 1.
For more than two design alternatives the alternatives can be compared in pairs. It is also possible to compare the confidence interval for each alternative directly. See
Figure 2 for an example with three design alternatives.
There are usually many choices to be made in life-cycle studies, especially early in the design process. In order to structure the study and communicate with the stakeholders it will be beneficial to organize the available choices in a decision tree, or in what we have chosen to call a choice palette; see
Figure 3 and
Table 1. A decision tree makes it possible to get an overview of available choices and the dependency between the options. However, it might quickly become impractically large if there are many choices in the conducted study. It is also not certain that a clear dependency exists between the options. A more suitable solution would then be a choice palette. While it will not show the dependency, the choice palette is easier to create than the decision tree and provides a more compact way to illustrate available choices. These benefits will likely make the choice palette the preferred choice early in an LCA. If necessary, it can then later be complemented with a decision tree. A benefit the decision tree and choice palette have in common is the possibility for concise notation of the constructed scenario. Each question is given a number and each option in every question a letter. It is then possible represent each scenario with a number and letter string combination. For example, 1b2c3a is the scenario in which option b is chosen for choice 1, option c for choice 2 and option a for choice 3. If preferable, delimiters can be added to make the string easier to read, e.g., 1b|2c|3a, 1b–2c–3a or 1b_2c_3a.
The decision tree and choice palette can then be used as an informative tool to show which choices and options are available in order to communicate the complexity of the study, both when it is conducted and in conjunction with the results. It can also be valuable to people who want to repeat and/or expand the study afterwards. Although the procedure is described as a linear process here, it can be conducted as an iterative process as well if need be. However, it should be ensured that the choices are not adjusted to obtain expected results, as such adjustments counteract the purpose of an objective decision-support tool.
2.2. Step 1: Identify the Choice Preferences and Decision Criteria to Ensure That the Decisions Made Are in Line with the Expectations of the Stakeholders
The aim of the study was to make an objective comparison between the two design alternatives. This means that efforts were made to not make decisions that would favor one alternative over another. It is important to clarify which question the LCA is intended to answer, since this will influence the goal and scope [
12]. Although it might be unclear to the client, an experienced LCA practitioner understands the importance of formulating the question in an unambiguous way. The term ‘better’ is subjective and can be interpreted in several ways. Some possible formulations of the question are:
Does a wooden framework have lower emissions than a concrete framework?
Does the wooden framework have lower emissions than the concrete framework in the building under consideration?
Does the wooden framework have a lower environmental impact than the concrete framework in the building under consideration?
Does the wooden framework have a 50% lower environmental impact than the concrete framework in the building under consideration?
Formulation a indicates that the study is not restricted to the studied object, which could be the case if the conclusions are intended to be used for certain types of buildings. The difference between formulations b and c could be that in b specific emissions are targeted, e.g., CO, while in c all the emissions are classified to estimate their potential environmental impact. A lot of resources and money might be needed to change from the current design to an alternative design. Thus, the difference in environmental impact between the alternatives must be sufficiently large to be worth the effort of switching the design, which is indicated in formulation d. It could also be the case that shifting design would increase one environmental target but lower another. In order to justify the shift, the relation between the change in each objective must be two to one. Depending on which question is considered in the LCA, the design of the study, the results, and therefore also the conclusions, will be different.
In conjunction with the question, it should be decided which parameters are to be considered for the evaluation, i.e., which types of emission or environmental impact categories. There are of course many choices available, but to limit the complexity of the example, this parameter has been set to the impact categories GWP, AP, EP, POCP and ODP, as was agreed in the original study. Thereafter, the thresholds for the parameters should be declared. If only one environmental parameter is chosen, it would be natural to choose the design option with the lowest value. In this case, several parameters are considered together and a decision rule for this must be established, e.g.,:
All parameters must be below the decided thresholds.
The thresholds for most of the parameters must be met.
The thresholds for a specific parameter and for most of the remaining parameters must be met.
Another common solution is to assign weights to each parameter to indicate its importance. This is equivalent to considering a single parameter, as the assessment parameters are aggregated into a single value.
When conducting a probabilistic study, it is also necessary to consider the statistical significance of the results. For a study with a 99% level of significance, it will be more demanding to gather data with a sufficiently high level of precision than it would be for the same study with only a 95% level of significance. Choosing a high significance level will lead to a higher level of certainty in the drawn conclusions, but it will also increase the risk of getting non-conclusive results if data are lacking. The precision of the data might be too low to allow for results that show a significant difference between the design options at the desired confidence level. The material amounts were presented as normal distributions, since it was assumed that the reported value is the most likely and the amount can be more or less with equal probability. Because the material amounts are represented as normal distributions, the probability of the numerical results from the Monte Carlo simulations will also be normally distributed. The confidence levels 70%, 95% and 99% roughly correspond to one, two and three standard deviations, respectively, for a normal probability distribution [
22]. As the concept of confidence level might be difficult to understand for the targeted stakeholders, it could be communicated in a more qualitative way, e.g., that the results should be highly or fairly certain. In this study, suitable confidence levels were identified as:
An indication is enough (point estimates).
The results should be somewhat certain (70% confidence level).
The results should be fairly certain (95% confidence level).
The results should be highly certain (99% confidence level).
As the design options are part of a larger system, they can be affected by changes in this larger system. It is, therefore, important to decide the future scenario for the building when evaluating the design options. This is a complex issue that could be broken down into different scenarios for different parts of the system. However, there are often three general principles to consider:
The building’s expected user patterns and other relevant properties will remain constant for the expected service life.
The building’s performance will improve over time, e.g., due to technology advancements.
The building will deteriorate, and its performance will decrease over time.
A building has many functions and therefore many possible functional units. The Swedish building code provides criteria on the lowest functional performance a building needs to fulfil regarding aspects such as fire safety, moisture protection, accessibility, indoor climate and energy consumption. It was therefore decided that the requirement according to Swedish building code [
23] must be fulfilled and therefore the building code should be included to ensure that these functions are included in the functional unit. The choice of the functional unit is likely to affect the conclusions that can be drawn. There can also be a dependence of the functional units from the stated question that the LCA is supposed to answer. Some suitable functional units that were identified in this study were:
One building floor that complies with the current Swedish building codes for 50 years.
A building of X m that complies with the current Swedish building codes for 50 years.
1 m of building area that complies with the current Swedish building codes for 50 years.
One building floor that complies with the current Swedish building codes for 100 years.
A building of X m that complies with the current Swedish building codes for 100 years.
1 m of building area that complies with the current Swedish building codes for 100 years.
2.3. Step 2: Map Out a Choice Palette or a Decision Tree in Order to Get an Understanding of the Complexity of the Problem
In this case, there is little dependence between the alternatives, i.e., a choice made for one parameter will not greatly affect the available choices for a subsequent parameter as they are formulated in such a general way in this study. Since the dependency between parameters is low, it was decided to illustrate the possible choices in the study using a choice palette; see
Table 2. This means that the decisions to be made for the LCA leads to 864 possible combinations of options.
2.4. Step 3: Present and Discuss the Choice Palette or Decision Tree to Show the Complexity of the Problem to the Stakeholders
Creating a choice palette was beneficial for the LCA practitioner as it provided a means of getting an overview and understanding of the technical choices in the system when discussing the system with technical experts. It was also perceived to be an easier way to convey to the stakeholders how the available choices would affect the extent of the study and which conclusions could be drawn from the results. An example of such discussion was the reliability of the numerical results. It is a large undertaking to change the load-bearing construction from concrete to wood and the stakeholders wanted to make sure that it would have the desired environmental effect, i.e., that differences in the calculations were not merely due to coincidences in the study. This was the reason for investigating the confidence intervals and decision rules. One reason for the facilitation of the discussion was that the choice palette made it easier to isolate the choice, but when necessary also to see how the choice would affect other choices in the study. A lesson learned from the case study was that sometimes when two or more issues interconnect it might be necessary to revise the choice palette or decision tree. This will increase the quality of the study, but it is also time consuming when discussions of options must be revisited. On the other hand, making these changes early in the process is likely to save time and resources in comparison with considering different options after the first results have been calculated.
2.5. Step 4: Choose a Combination of Options and Explain Why This Selection Is Preferred
For the calculations, the combinations 1c|2b|3a|4a|5a, 1c|2b|3b|4a|5a, 1c|2b|3c|4a|5a, 1c|2b|3d|4a|5a, 1c|2b|3b|4b|5a and 1c|2b|3c|4b|5a were studied. The combination 1c|2b|3a|4a|5a represents the following set of options for the study:
Question: Does the wooden framework have a lower environmental impact than the concrete framework in the building under consideration?
Decision rules: The thresholds for most of the parameters must be met.
Confidence level: An indication is enough (point estimates).
System scenario: The building’s expected user patterns and other relevant properties will remain constant for the expected service life.
Functional unit: One building floor that complies with the current Swedish building codes for 50 years.
For the combinations 1c|2b|3b|4a|5a, 1c|2b|3c|4a|5a and 1c|2b|3d|4a|5a, the difference is that the confidence level is 70%, 95% and 99% respectively. The combinations 1c|2b|3b|4b|5a, 1c|2b|3c|4b|5a was chosen to investigate how it would affect the calculations if the environmental impact of replacement was reduced to half due to improved manufacturing processes in the future. This would only reduce the impact of the wooden alternative as the concrete alternative does not require any replacement during the investigated time period.
The project’s stakeholders were interested in the environmental impact but had no preference concerning the importance of each impact included in the study, which made the choices for point 1 and 2 most appropriate. The effect of confidence levels was deemed interesting for further investigation and therefore all alternatives were investigated in point 3. The products included in the study were not deemed likely to have large performance changes during the investigated time period. An except was that environmental impact for manufacturing of building products might be lowered due to raised awareness in the building industry. Thus, both the case of constant system scenario and the scenario with future improvements were considered in point 4. The functional unit is intrinsically linked to the purpose of an LCA and a key aspect in how to structure the study. This means that there can be an interdependency between the choice of functional unit and other choices. If the purpose is to compare the results with other LCAs, it is important that the functional unit of the studies coincide and there might not be a choice to make. In this case study the purpose was to compare different design alternatives. The functional unit must therefore be considered carefully to permit a fair comparison between the design alternatives. This was the reason that several viable options for the functional unit was considered. Different floors in the building had different layouts and functions so it was concluded that making calculations with changed materials for the whole building would have induced cascading changes. This would have required a complete design makeover of the building to get a fair comparison between the material alternatives. Implementation would then have required resources not available in the building project. It was furthermore concluded that considering one building floor would capture enough of the complexity of using different construction methods to enable a fair comparison. The results could have been normalized against 1 m
of building area instead but this would only scale the numeric results in this case. The choice of expected service life of the building can influence the results of the calculations. The common praxis in in Sweden is to use 50 years, although the real service life of buildings can be different. 50 years is also used as reference study period in [
24]. An expected service life of 50 years was agreed to be used in the original study and was therefore also used in this study. For these reasons, one building floor for 50 years was chosen as the most suitable functional unit in point 5.
2.6. Step 5: Calculate the Results for the Chosen Combination or Combinations
In the discussion regarding functional unit it was decided that the most suitable would be to make the comparison for a representative floor of the building. Since the floors made mainly of concrete or wood has large differences regarding the geometrical design, it was not possible to compare them directly. Instead a representative geometrical floor of the building was chosen and existing constructions in the building of either concrete or wood was used in the calculations. This ensured that the evaluated constructions fulfilled the specifications of the building and compared with the same prerequisites. The sizes of the construction parts on the investigated floor are presented in
Table 3. There were differences in the thermal properties and thickness between the constructions in the concrete and wooden framework. Minor adjustments in the insulation thickness was made to obtain similar thickness and energy properties. A rough calculation was made in the original study which showed that the difference of energy consumption after these alterations was below 1%, and energy consumption was therefore not included in the calculations.
3. Results and Discussion of the Case Study
The preferred design should have lower values at the chosen confidence level for a majority of the investigated environmental impacts. If the results were indecisive, the stakeholders would keep the current design with concrete framework. Their reasoning being that the effort of changing design could not be justified if there was no significant environmental benefit. When using point estimates in 1c|2b|3a|4a|5a, it is highly unlikely that the design options would have the same results in each environmental impact factor studied. This can be seen in
Figure 4. The wooden alternative has a higher impact in AP and EP, while the concrete option has a higher impact in the other studied impact categories. The decision regarding which design option to use is directly dependent on the decision rule for all impact categories combined. In this case, the chosen design would be the wooden construction, as most of the impact categories are lower for this design alternative.
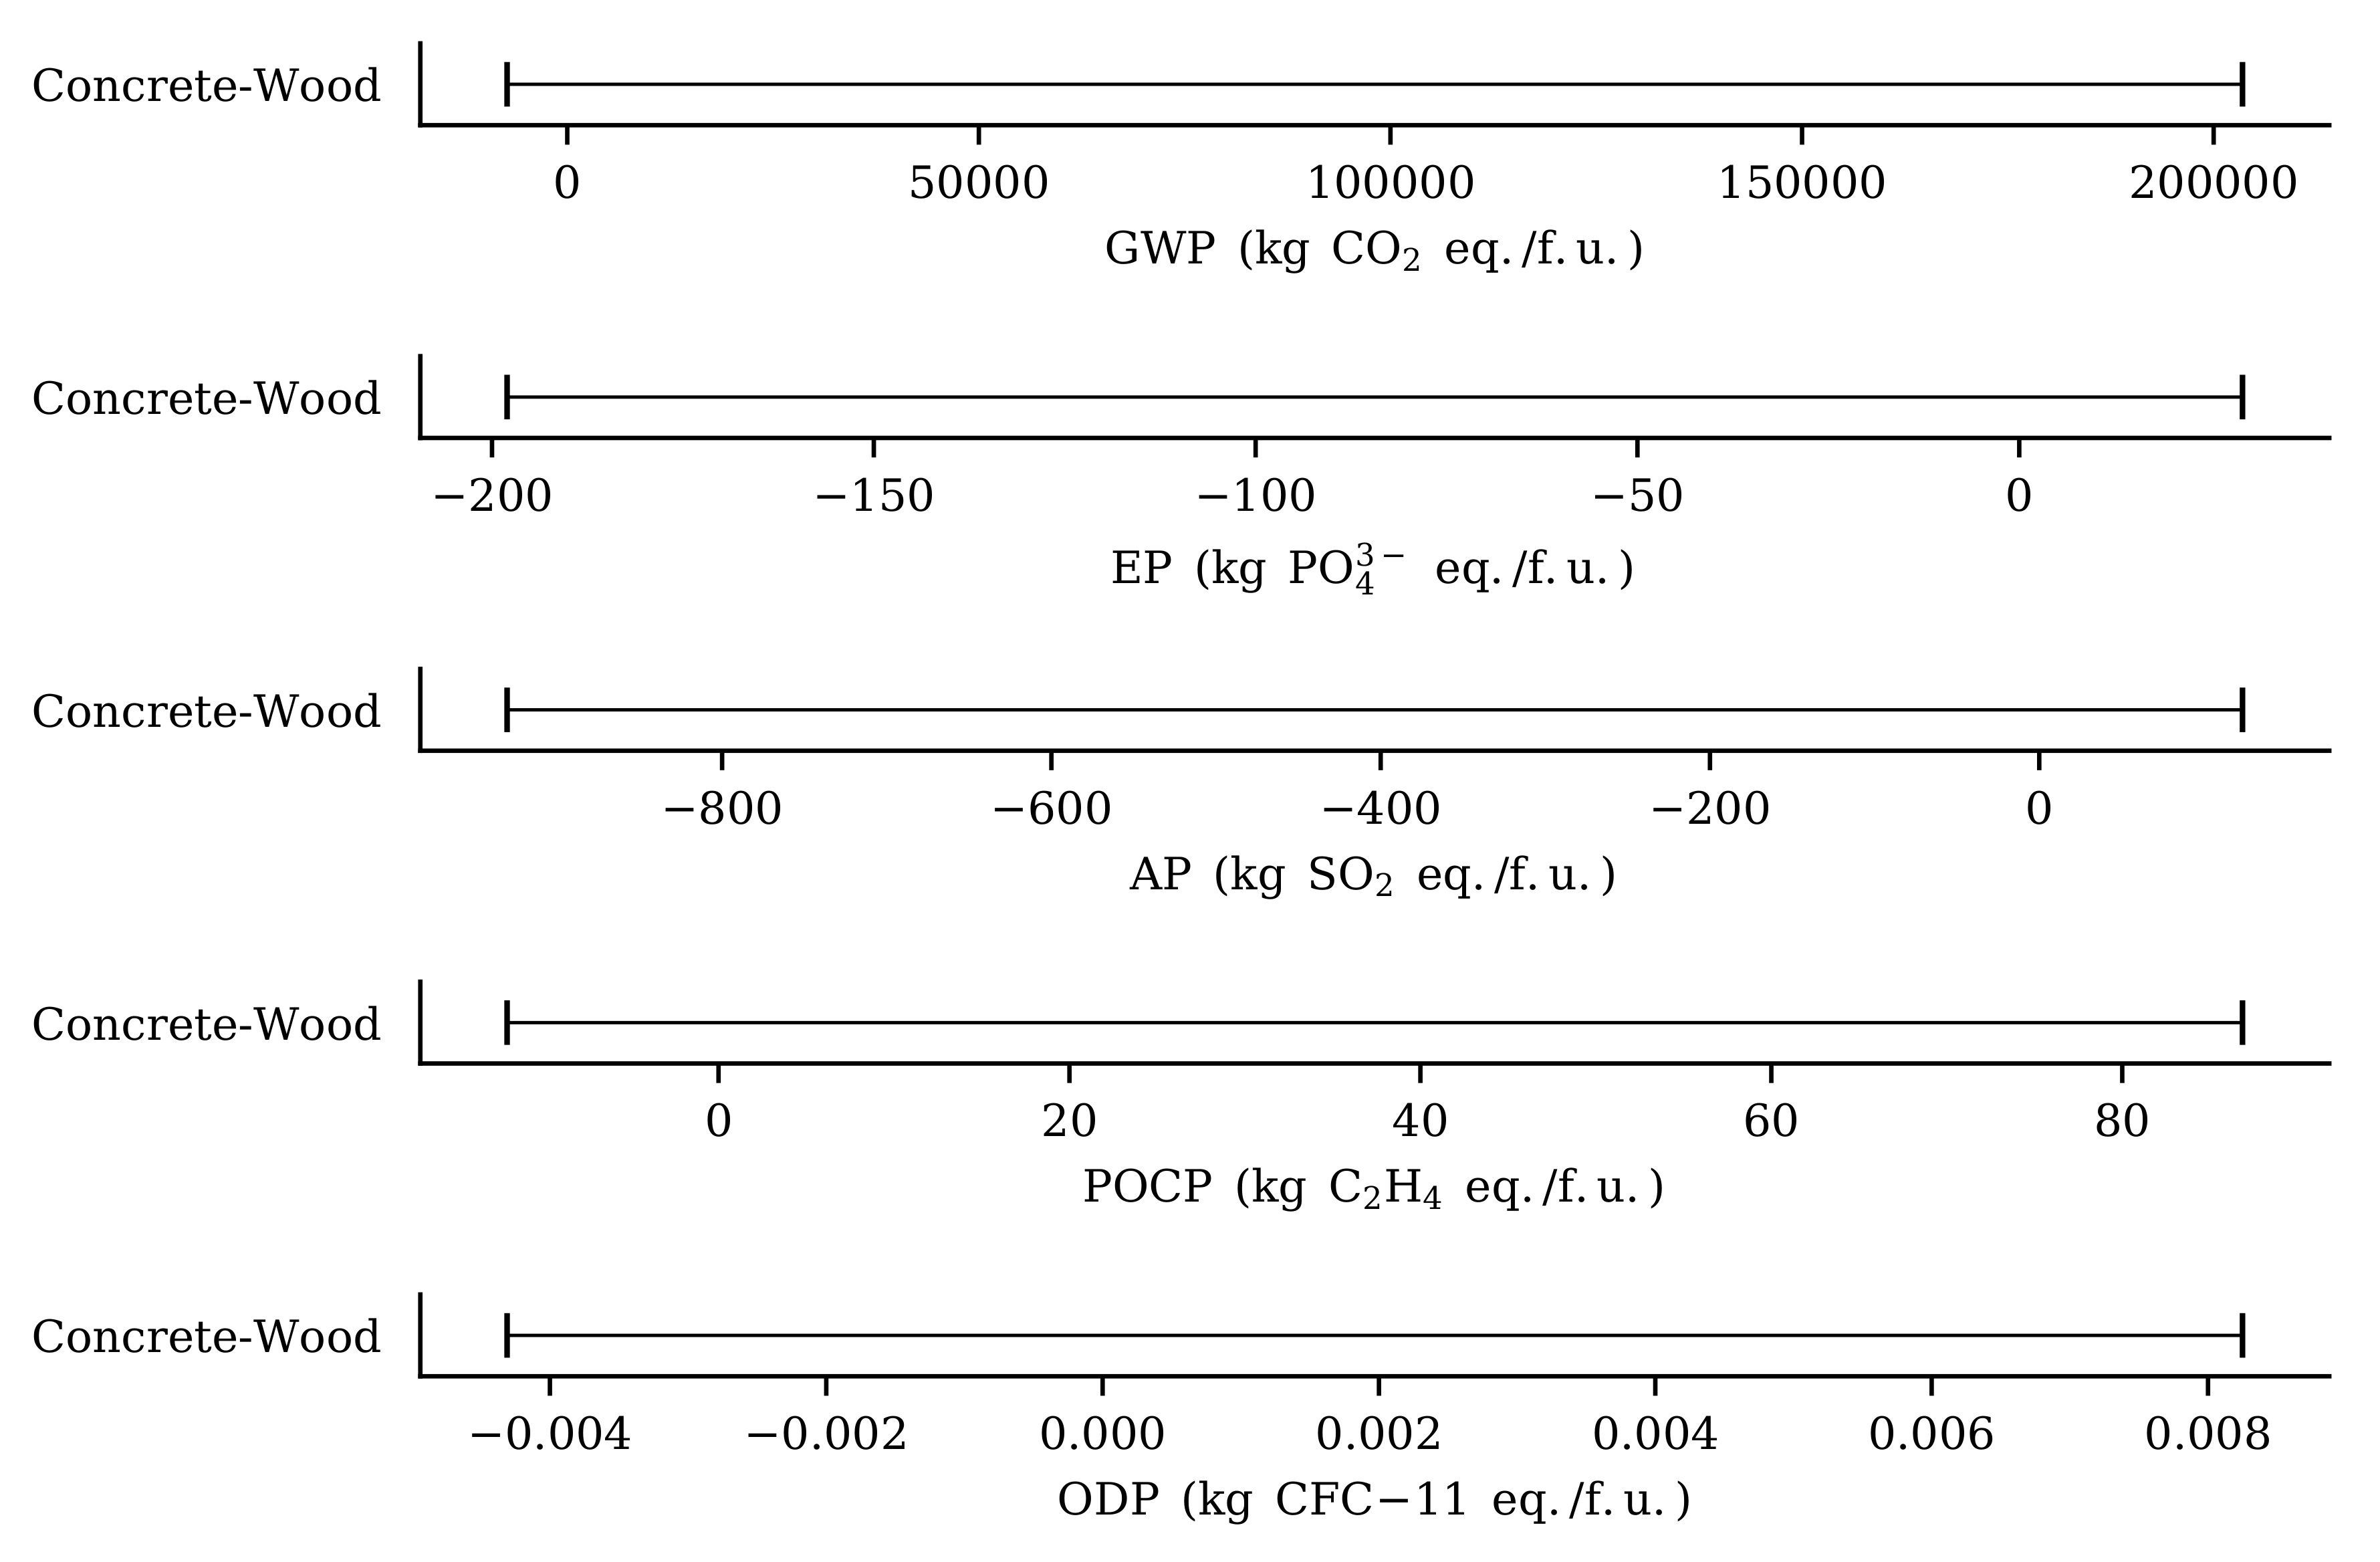
In
Figure 5,
Figure 6,
Figure 7 and
Figure 8, the results are presented as confidence intervals for each environmental impact category. The size of the confidence interval is dependent on the chosen confidence level. As can be seen in
Figure 5, the high confidence level at 99% makes the results inconclusive. The confidence intervals for all impact categories overlap, which means that the results show no significant differences between the alternatives for these impact categories at this confidence level. In this study, it was decided that the current design would be used if the results show a preference for the alternative design in most of the impact categories. Since this criterion was not met, the chosen design alternative is the concrete framework for this set of options.
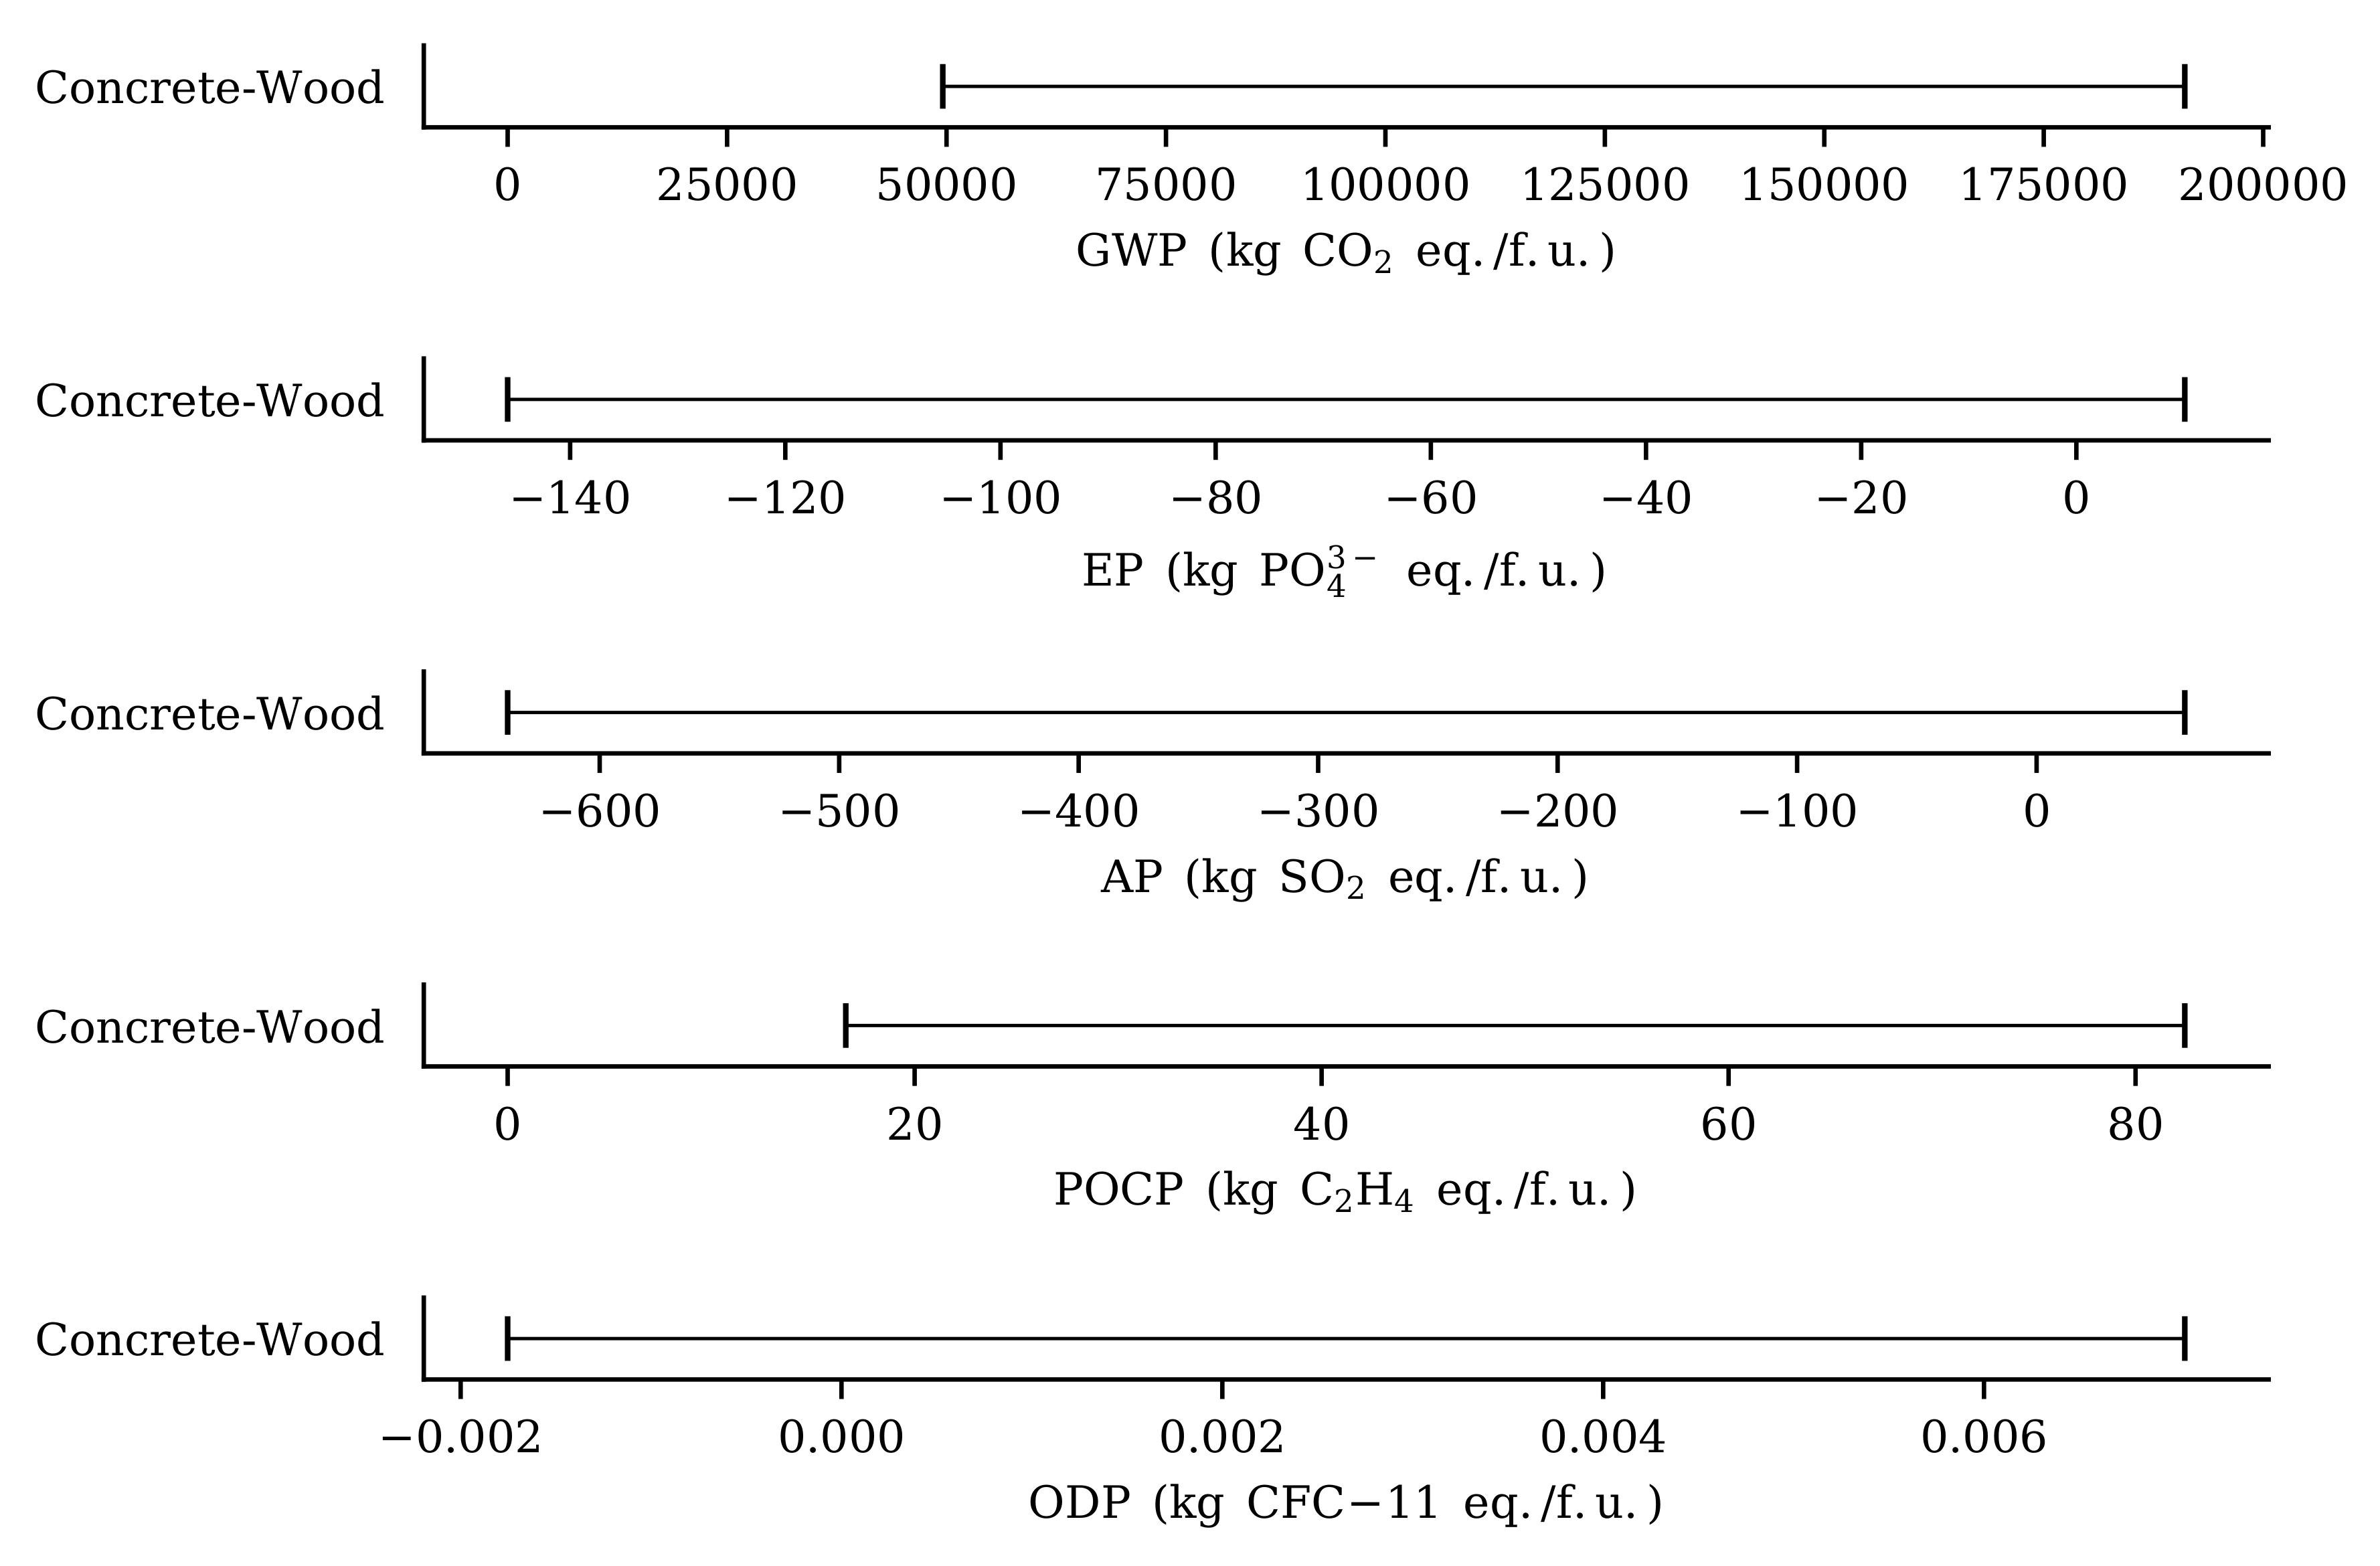
With a lower confidence level of 95% there is a significant difference for all impact categories except ODP, as can be seen in
Figure 6. However, since both design alternatives have a lower environmental impact in two categories each, the results are still inconclusive. With the same reasoning regarding reference design, the chosen design alternative is the concrete framework.
The results with a confidence level of 70% are shown in
Figure 7. The calculations with the provided data and assumed uncertainty show a significant difference for all the investigated impact categories at the confidence interval 70%. Three of the categories have higher values for the concrete framework and wood is the favorable framework design with this set of options.
Figure 8 and
Figure 9 show the results with an alternate scenario for future production. If a confidence level of 95% was chosen but assumptions regarding environmental impact from future manufacturing of building products were taken into account, the numerical results will be different than with the maintained future scenario. Then additional two impact categories would be indecisive. However, it will not change the design decision, as the results were indecisive in the constant future scenario as well. For 70% confidence level there is a significant difference for all impact categories and the wooden alternative has a lower impact in three out of five categories, which can be seen in
Figure 9. The design choice will therefore be the wooden alternative. This is expected as the wooden framework was the favorable design at the constant future scenario and the option with improved manufacturing methods only affect the wooden design alternative.
Step 6: Compare the Calculated Results against the Decision Criteria to Obtain a Design Choice
The results from the calculations are summarized in
Table 4. Since different design alternatives are chosen depending on the combinations of options, the suggested procedure DCP highlights which choices can tip the scale and where more information is needed to narrow the choice to only one option. In this case study, one possibility would be to gather sufficiently precise data on material amounts and each product’s environmental impact that there will be no intervals including zero in the results. However, obtaining such high-precision data might not be a viable option. Another approach would be to further discuss the need for high confidence levels or to gather information on how likely it is that future replacement would have a lower environmental impact than the current situation. This shows the value of combining traditional stochastic methods with the DCP as it provides more tools to analyze and resolve uncertainty issues in the results. If no changes are made to the case study, e.g., due to lack of resources, the conclusion regarding the building design options is that the study fails to show any significant difference between the options with the set prerequisites. The choice of design then must be made using other criteria, e.g., economic or architectural aspects. It is worth pointing out that failing to show a significant difference is not the same as showing that they are similar. Showing that they have a similar environmental impact would require structuring the study in another way.
4. Discussion of the Procedure and the Effect on the Design Decisions
The developed procedure provides structured means to organize and manage choices usually available in early LCA to construct probabilistic decision support when making designing complex products. The novelty of the DCP is to manage choice uncertainty and combine it with existing methods for parameter uncertainties when using LCA as decision support for building design. The structure of the procedure has been adapted in this study to make the procedure easier to apply in building projects. Established methods and procedures were strived for in each step of the procedure to further facilitate its use. One exception is the choice palette in step 2 that also was introduced in this study, while the decision tree is a well-known concept. The general steps to test a hypothesis about parameters in statistical mathematics are: (1) state the null and alternate hypothesis, (2) select the level of significance, (3) select the test statistic, (4) state the decision rule, (5) calculate and make a decision regarding the hypotheses, (6) Interpret the results of the decision [
22]. This aligns with step 1,5, and 6 in the DCP. To communicate with the stakeholders is an advised practice when conducting LCA [
25]. This was formalized within this study in step 3 and 4 in the DCP. These steps were found to ease the communication of available choices and their consequences with stakeholders of different specializations. Using DCP makes it easier to get an overview of the possible choices and how they might interact within the study, and furthermore enables important choices to be isolated in order to investigate them in more detail. It also helps the LCA practitioner communicate the complexity of these kinds of studies to the stakeholder. This makes it a useful complementary tool to be used together with existing tools for uncertainty assessment of LCA. However, it will not solve the issue of uncertainties in LCA completely.
A case study was examined and applied to evaluate and update the DCP with tangible issues and results. This provided a procedure that suits the tested case study and similar studies regarding building design. It also demonstrated that the procedure is practically feasible. When conduction LCA of buildings there are numerous uncertainties that will affect the numerical results, e.g., user behavior, material properties, choice future energy mix, maintenance policies, local climate, climate change, data gaps, etcetera. To consider all these kinds of uncertainties would be an interesting research project, but out of scope in this study. Adding more choice or parameter uncertainties might affect the conclusions in the case study but not the evaluation of DCP, which was the purpose of the case study. However, using DCP for other types of product design might lead to unforeseen issues. Since the development of DCP is closely connected to the case study, the available data and chosen calculation methods may have affected the conclusions made regarding the DCP. An alternative would have been to develop a procedure through theoretical reasoning of problems and solutions in these kinds of life-cycle studies. This might have led to a more general-purpose procedure, but might also have led to a procedure that is too complex to be useful in practice or that overlooks critical issues.
The case study was carried out with two design alternatives which were compared numerically with confidence intervals to show a complete example of the DCP. The procedure can be adapted with other forms of numerical comparisons, such as comparing other statistics of the resulting distributions, and there is no restriction on the number of design cases that can be investigated. In the conducted case study, a simplified study with only five choices and only a few options for each choice was investigated. This still, however, led to 864 possible combinations of options to evaluate. Although the DCP will increase the quality of an LCA, a drawback is that it takes time and resources to conduct the analysis. Creating a decision tree, in particular, can be an arduous task for complicated systems. This was considered in the development of the procedure and mitigated by introducing the choice palette. In practice, it is likely that it might be possible to map out a choice palette but, in order to limit the resources necessary, not completely evaluate all possible options. Some of these issues can be mitigated by using software that automates the process of, e.g., constructing decision trees and evaluating all combinations. However, the time to setup the software will also become more complex as more choices and options are added to the study. Another issue that emerged is that DCP is described as several separate steps to convey it in a structured manner to the reader. However, when carrying out the case study it was realized that in reality the steps are more intertwined and iterated throughout a study. This indicates that the outline of the procedure might have to be investigated and further developed in future research.
A common application of LCA is to identify environmental hotspots to find possible improvements of products. In the carried-out case study aggregated results of the whole life-cycle were compared to make a final decision. However, before the final comparison is made it could be beneficial to divide the results, e.g., into the phases A, B and C, to evaluate if improvements could be made for one or more design alternatives. This will mitigate the risk of comparing a sub-optimal design alternative with an optimized alternative. For example, changing the manufacturer of the concrete or wooden framework might provide different results and conclusions.
The purpose of an LCA as decision support is to provide information to make decisions based on facts or logical analyses instead of mere hunches. The suggested procedure will show the complexity and identify the different aspects of the decision to be made. It could be a good idea to map out and decide on subjective parameters before any preliminary results are presented. Otherwise, there is an apparent risk that the choices will be influenced depending on how the preliminary results are presented, which contradicts the purpose of a decision-support tool. In the conducted case study, the only environmental impact that had a significantly lower result at the 95% significance level was GWP. Had it not been decided beforehand that most of the impact categories should be lower, the wooden framework might have been chosen instead since it was the only category with a clear difference. However, this would have contradicted the intention of the LCA, since the decision would then have been made based on whatever data that was available instead of on the identified environmental information that was needed for the design alternatives. The decision criterion had then arbitrarily changed from lower results in a majority of the investigated environmental impacts to lower results in at least one category. An issue with this suggested approach is that it might be difficult to understand the choices and their options for people involved in the LCA if the impact on the results is not clear. An example of this would be to demand that the results should have unnecessarily high confidence levels, thinking that the higher the better, but not realizing the risk of inconclusive results.
As mentioned in the introduction, it is usually parameter uncertainties that are evaluated during sensitivity and uncertainty analyses. The results presented here show that the benefit of evaluating parameter uncertainties might be small when compared to other uncertainties, such as choice and scenario uncertainties, which is also discussed in [
26]. Performing a Monte Carlo simulation, for example, will certainly provide additional information about the studied system. However, there is a risk that not including an analysis or estimation of other types of uncertainties might overestimate the statistical significance of the conclusions. The results and conclusion can be affected by subjective choices, such as the decision criteria and confidence level, even if the same inventory data is used. The possible choices presented here cannot objectively be called right or wrong. It is up to the stakeholders and LCA practitioner to use their best judgement. It is possible to get diverging conclusions depending on which branch is chosen in the choice palette or decision tree. This implies that gathering more extensive and accurate data will not solve the issue of different life-cycle studies of similar topics arriving at different conclusions. These subjective choices are likely one reason for the criticism that it is possible in life-cycle studies to obtain any conclusions one desires. One way to mitigate this issue would be to highlight these choices to raise awareness among the stakeholders involved in the life-cycle study. Stochastic methods such as sensitivity analyses and Monte Carlo simulations would help identify which part of a study needs higher-precision data. In a similar way, the procedure presented here would help to identify important decisions that need more investigation to reach a consensus. Including a choice palette or decision tree, as presented in this article, together with the results from stochastic uncertainty methods would make it more apparent what the results represent. This would provide more credibility to the performed LCA.


