Article

Estimating Multidimensional Poverty among Cassava Producers in Nigeria: Patterns and Socioeconomic Determinants

by
Luke Oyesola Olarinde
1,
Adebayo Busura Abass
2,*,
Tahirou Abdoulaye
3,
Adebusola Adenike Adepoju
1,
Emmanuel Gbenga Fanifosi
1,
Matthew Olufemi Adio
1,
Obadiah Adekunle Adeniyi
1 and
Awoyale Wasiu
3,4
1
Department of Agricultural Economics, Ladoke Akintola University of Technology, PMB 4000, Ogbomoso 210214, Oyo State, Nigeria
2
International Institute of Tropical Agriculture (IITA), Regional Hub for Eastern Africa, Dar es Salaam PO Box 34441, Tanzania
3
International Institute of Tropical Agriculture (IITA), PMB 5320, Oyo Road 200001, Ibadan, Nigeria
4
Department of Food Science & Technology, Kwara State University, Malete, Ilorin PMB 1530, Kwara State, Nigeria
*
Author to whom correspondence should be addressed.
Sustainability 2020, 12(13), 5366; https://0-doi-org.brum.beds.ac.uk/10.3390/su12135366
Submission received: 23 April 2020 / Revised: 30 May 2020 / Accepted: 1 June 2020 / Published: 2 July 2020

Abstract

:
The scourge of poverty, including its correlates, has been witnessing an incremental sequence over the years in Nigeria despite the natural endowment of the country. Efforts by various stakeholders to address this problem have not yielded tangible results. Using cross-sectional data collected in 2015 on 775 cassava farmers spread across four geographical zones, this study estimates multidimensional poverty of cassava producers in Nigeria. This is to determine the factors responsible for poverty increase and contribution(s) of these factors to poverty. The study found that about 74% of the respondents were multidimensionally poor. Assets and public/housing utility were the main contributors to aggregate multidimensional poverty index (MPI), while education and health contributed most to povertyreduction. The results also showed major contributing indicators to MPI to be formal employment, school enrolment, years of schooling, frequency of hospital visits, and household assets’ ownership. The South-eastzone of Nigeria had the highest adjusted headcount of poverty among cassava producers. The estimated coefficient of age, farming experience, years of schooling, household size, and access to informal credit were significant determinants of poverty in the study area. In conclusion, the results suggest that although Nigeria is a federation of more than 30 states that continue to rely on nation-wide policy initiatives of the central government, policies on cassava aiming to lift millions of people out of poverty should instead vary according to the peculiar poverty dimensions of each federation unit. We suggest reform in the agriculture sector that will emphasize facilitation and access to incentives (credits, training, extension, cooperate system, etc.) by younger farmers to engage in modern cassava farming, thereby, enhancing the chances of rural cassava growers to move out of poverty.

1. Introduction

Poverty in Nigeria has many dimensions and manifestations, including joblessness, over-indebtedness, economic dependence, lack of freedom, inability to provide the basic needs, or own assets. As a result of poverty, many Nigerians are constrained toinhabit localities with despicable situations that put significant pressure on the physical environment contributing to environmental degradation. The poor, especially farmers, perceive their economic circumstances to be fraught with uncertainty affected by events over which they have no control. These economic circumstances are, for example, primary commodity prices, the volume of rainfall, pest attacks, fire outbreaks, changes in soil condition, and social conflicts. Of all these, lack of food is the most critical dimension of poverty (CBN, 2005) [1]. Other characteristics of poverty are low income and investment racket, underutilized and/or unutilized natural resources, rapidly increasing populations, near absence of social infrastructures, such as potable water, schools, and access roads, pervasive gullibility, powerlessness, disease, insecurity, and ignorance, and a high level of general vulnerability (Lele et al. [2]).
The most difficult challenge facing Nigeria and its people and the greatest obstacle to the pursuit of sustainable socioeconomic growth is the issue of poverty reduction. Though the agricultural sector has the highest potential for reducing poverty and inequality (since the sector accounts for about 41% of GDP and 60% of total employment), that potential has not been effectively utilized. According to the National Bureau of Statistics, NBS [3] that is the reason why despite being the largest contributor to economic growth, the agricultural sector (including especially the farming households) has the highest incidence of poverty compared to other sectors within the economy. This is partly because though the agricultural sector is correctly targeted as the engine of growth for the Nigerian economy; sectoral actors (farmers, processors, fabricators, etc.) that move that engine are not properly targeted.
Despite the fact that cassava has been found to contribute to poverty alleviation and despite Nigeria’s great resource endowments, Nigerians, according to Nsikakabasi and Obasi [4], are among the poorest people in the world. In spite of the oil wealth and revenues amounting to over 300 billion US Dollars since the 1970s (as revealed by the Central Bank of Nigeria, CBN), Nigeria is still a poor country where per capita income averaged only $1075 in 2009, CBN [5]. Since non-oil export receipts are small, export revenues are greatly influenced by oil and gas prices. Government’s fiscal policy that depends on oil and gas price fluctuations in line with these prices. The major challenges facing the country (according to the United Nations’ Development Program, UNDP) are stabilizing expenditures and ensuring the government’s ability to meet social and human development goals (UNDP [6]). The human development report by the UNDP [7] revealed that Nigeria is one of the poorest among poor nations of the world. With a human poverty index HPI-1 value of 38.8%, Nigeria is ranked 75th among 103 developing countries. About 52% of Nigerians live in poverty and about 70 million people live on less than one (1 $) dollar a day, according to the National Bureau of Statistics (NBS) [3].
Regardless of the series of anti-poverty programs by successive Nigerian governments, poverty reduction still remains an arduous task, which seems to misrepresent all previous poverty measures as a banality of efforts, especially among cassava producers in Nigeria. While the high rate of poverty appears to cast doubts on the effect of previous anti-poverty measures, it could be camouflaged by the fact that potential dimensions are omitted. This is because previous studies, such as Ibrahim et al., Omonona, Nsikakabasi and Obasi, and Anyawu [4,8,9,10] in Nigeria have employed largely income-consumption-based approach, which does not account for other necessary well-being variables, like health and living conditions of the people. Hence, monetary-based antipoverty policies were proffered. Little is known about the other welfare attributes. These uni-dimensional poverty measures, at best, only lead to a partial understanding of poverty and often do not give holistic information about the poor, especially in terms of other attributes. It, therefore, leads to partial knowledge of the problem since the different dimensions of poverty and the correlates are not known [11]. To the best of our knowledge, most of the studies on poverty in Nigeria have only focused on measuring poverty as a one-dimensional incident. Although Adeoti [12] investigated poverty levels over time using the multidimensional approach with the National Living Standard Survey (NLSS) data of 2004 and 2010, the estimates were only done for Oyo State. We also noticed that, though the study explored multidimentional poverty, it fails to critically observe the deprivation of the audience based on empowerment. This is vital to measuring people’s well-being. In effect, our study is designed to fill this gap. This paper, therefore, aims at providing estimates of multidimensional poverty at disaggregated levels in four geographical regions of Nigeria. This study also provides an improvement on existing literature as we have also estimated the marginal effect of converting to one poverty level as related to the other. This is important as it will afford policy and stakeholders opportunities of putting in place measures aimed at preventing cassava producers from falling back to worse poverty situations.

1.1. Theory of Multidimensional Poverty

A couple of approaches to measuring poverty exist in the literature. One of the common methods is the popular monetary method. Despite the vast popularity of the monetary approach to poverty measurement in recent years, new poverty measurement approaches through non-monetary vision emerged. Particularly, the scientific works of the Indian economist Amartya Sen [13] playa very important role inthe multidimensional nature of poverty concept. The “utility” and “Rawls” approaches used for the study of equality were criticized. The reason behind these critics was related to the idea that these approaches were lacking the notion of capacity of a person to do the basic things. In his book “Development as freedom”, Sen [13] introduced the capability approach in order to reveal the multidimensional nature of poverty. He defines functioning as various states of human beings and activities that an individual can undertake. Capabilities are defined as an individual’s freedoms or opportunities to choose between different combinations of functioning that an individual has reason to value. In this context, poverty is defined as a lack of freedom due to the deprivation of capabilities and correspondingly, multidimensional in nature. In recent years, the multidimensional poverty approach has been widely applied to cross-country and country-specific studies of poverty. These are found in Alkire and Santos, Deutsch and Silber, Dewilde, and Furne et al. [14,15,16,17,18].
The capabilities theory and multidimensional poverty approach allow us to focus on a particular aspect of life as well as overall well-being. They also allow us to examine its associations with multiple dimensions of poverty that deprive an individual of capabilities related to that aspect of life. In effect, there is currently no universal consensus on the definition or the measurement of poverty, (Bourguignon et al. [19]).

1.2. Concepts of Multidimensional Poverty

Poverty is a multidimensional concept. Poverty encompasses different dimensions of deprivation that relate to human capabilities, including consumption and food security, health, education, rights, voice, security, dignity, and decent work (Maleta [20]). Multidimensional measures provide an alternative lens through which poverty may be viewed and understood (Alkire and Foster [21]). According to Bourguignon and Fields [22], the issue of the multidimensionality of poverty arises because individuals, social observers, or policymakers want to define a poverty limit on each individual attribute, for example, income, health, education, etc.
The Human Poverty Approach has been advanced by the United Nations Development Program (UNDP) in its Human Development Reports, UNDP [23]. UNDP uses this conceptual framework to specify some basic human capabilities, which, if absent, could result in poverty. It includes the capability to “lead a long, healthy, creative life and to enjoy a decent standard of living, freedom, dignity, self-respect, and the respect of others”.
The measurement index method of conceptualizing poverty has also been recognized in the literature, e.g., Rocha, Maxwell, and Ajakaiye [24,25,26]. As observed by Ajakaiye [26] and Omotola [27], measuring poverty through a herculean task has become the rule. In terms of measurement, UNDP maintained that defining the relevant and operational poverty concepts and choosing adequate measurement procedures are the result of a sensible and informed analysis of social reality. This is corroborated by Rocha [24].

1.3. Estimation Strategy of Multidimensional Poverty

In measuring multidimensional poverty, five dimensions have been selected, namely empowerment, education, health, asset, and public utility. These five dimensions comprised a total of 13 indicators. The description of dimensions, indicators and the weight to each indicator is shown in Table 1.
Following the identification of the dimensions and indicators, the weights assigned to each dimension and indicator are critical in multidimensional poverty. A large and growing literature on multidimensional poverty, multidimensional well-being, social exclusion, and composite indices invariably used both continuous and dichotomous data and varying weighting structure [28]. Following Maleta [20], this study has adopted the method of computing multidimensional poverty by assigning weights based on a normative approach. Equal weight has been assigned to each dimension. In other words, multidimensional poverty index (MPI) was computed using the dual cut-off method based on the counting approach developed by [20]. This method, according to Bidyadhar and Sanjay [29] is gaining popularity and has been disseminated by UNDP in the Human Development Report (HDR). The total weighted deprivation score ranges from 0 to1 and a household is multidimensionally poor if and only if the weighted deprivation score is equal to or greater than 33.33% (or one-third of the total weighted deprivation) of the total weighted deprivation.
To derive multidimensional poverty index, the head count ratio (H) and intensity of poverty (A) are computed, following Bidyadhar and Sanjay [29].The headcount ratio is the proportion of the population who are multidimensionally poor. The headcount ratio is computed as:
H = n t
where, n is the number of multidimensionally poor, t is the total population.
The intensity of poverty (A) or the breadth of deprivation captures the average weighted count of deprivations experienced by the multidimensionally poor. The intensity of poverty (A) is computed as:
A = 1 n c n
where, c is the total weighted deprivations experienced by the poor.
The multidimensional poverty index (MPI) is the product of the headcount ratio (H) and the intensity of poverty (A). It is also referred to as the adjusted headcount ratio. The MPI is computedas:
MPI = H A

2. Materials and Methods

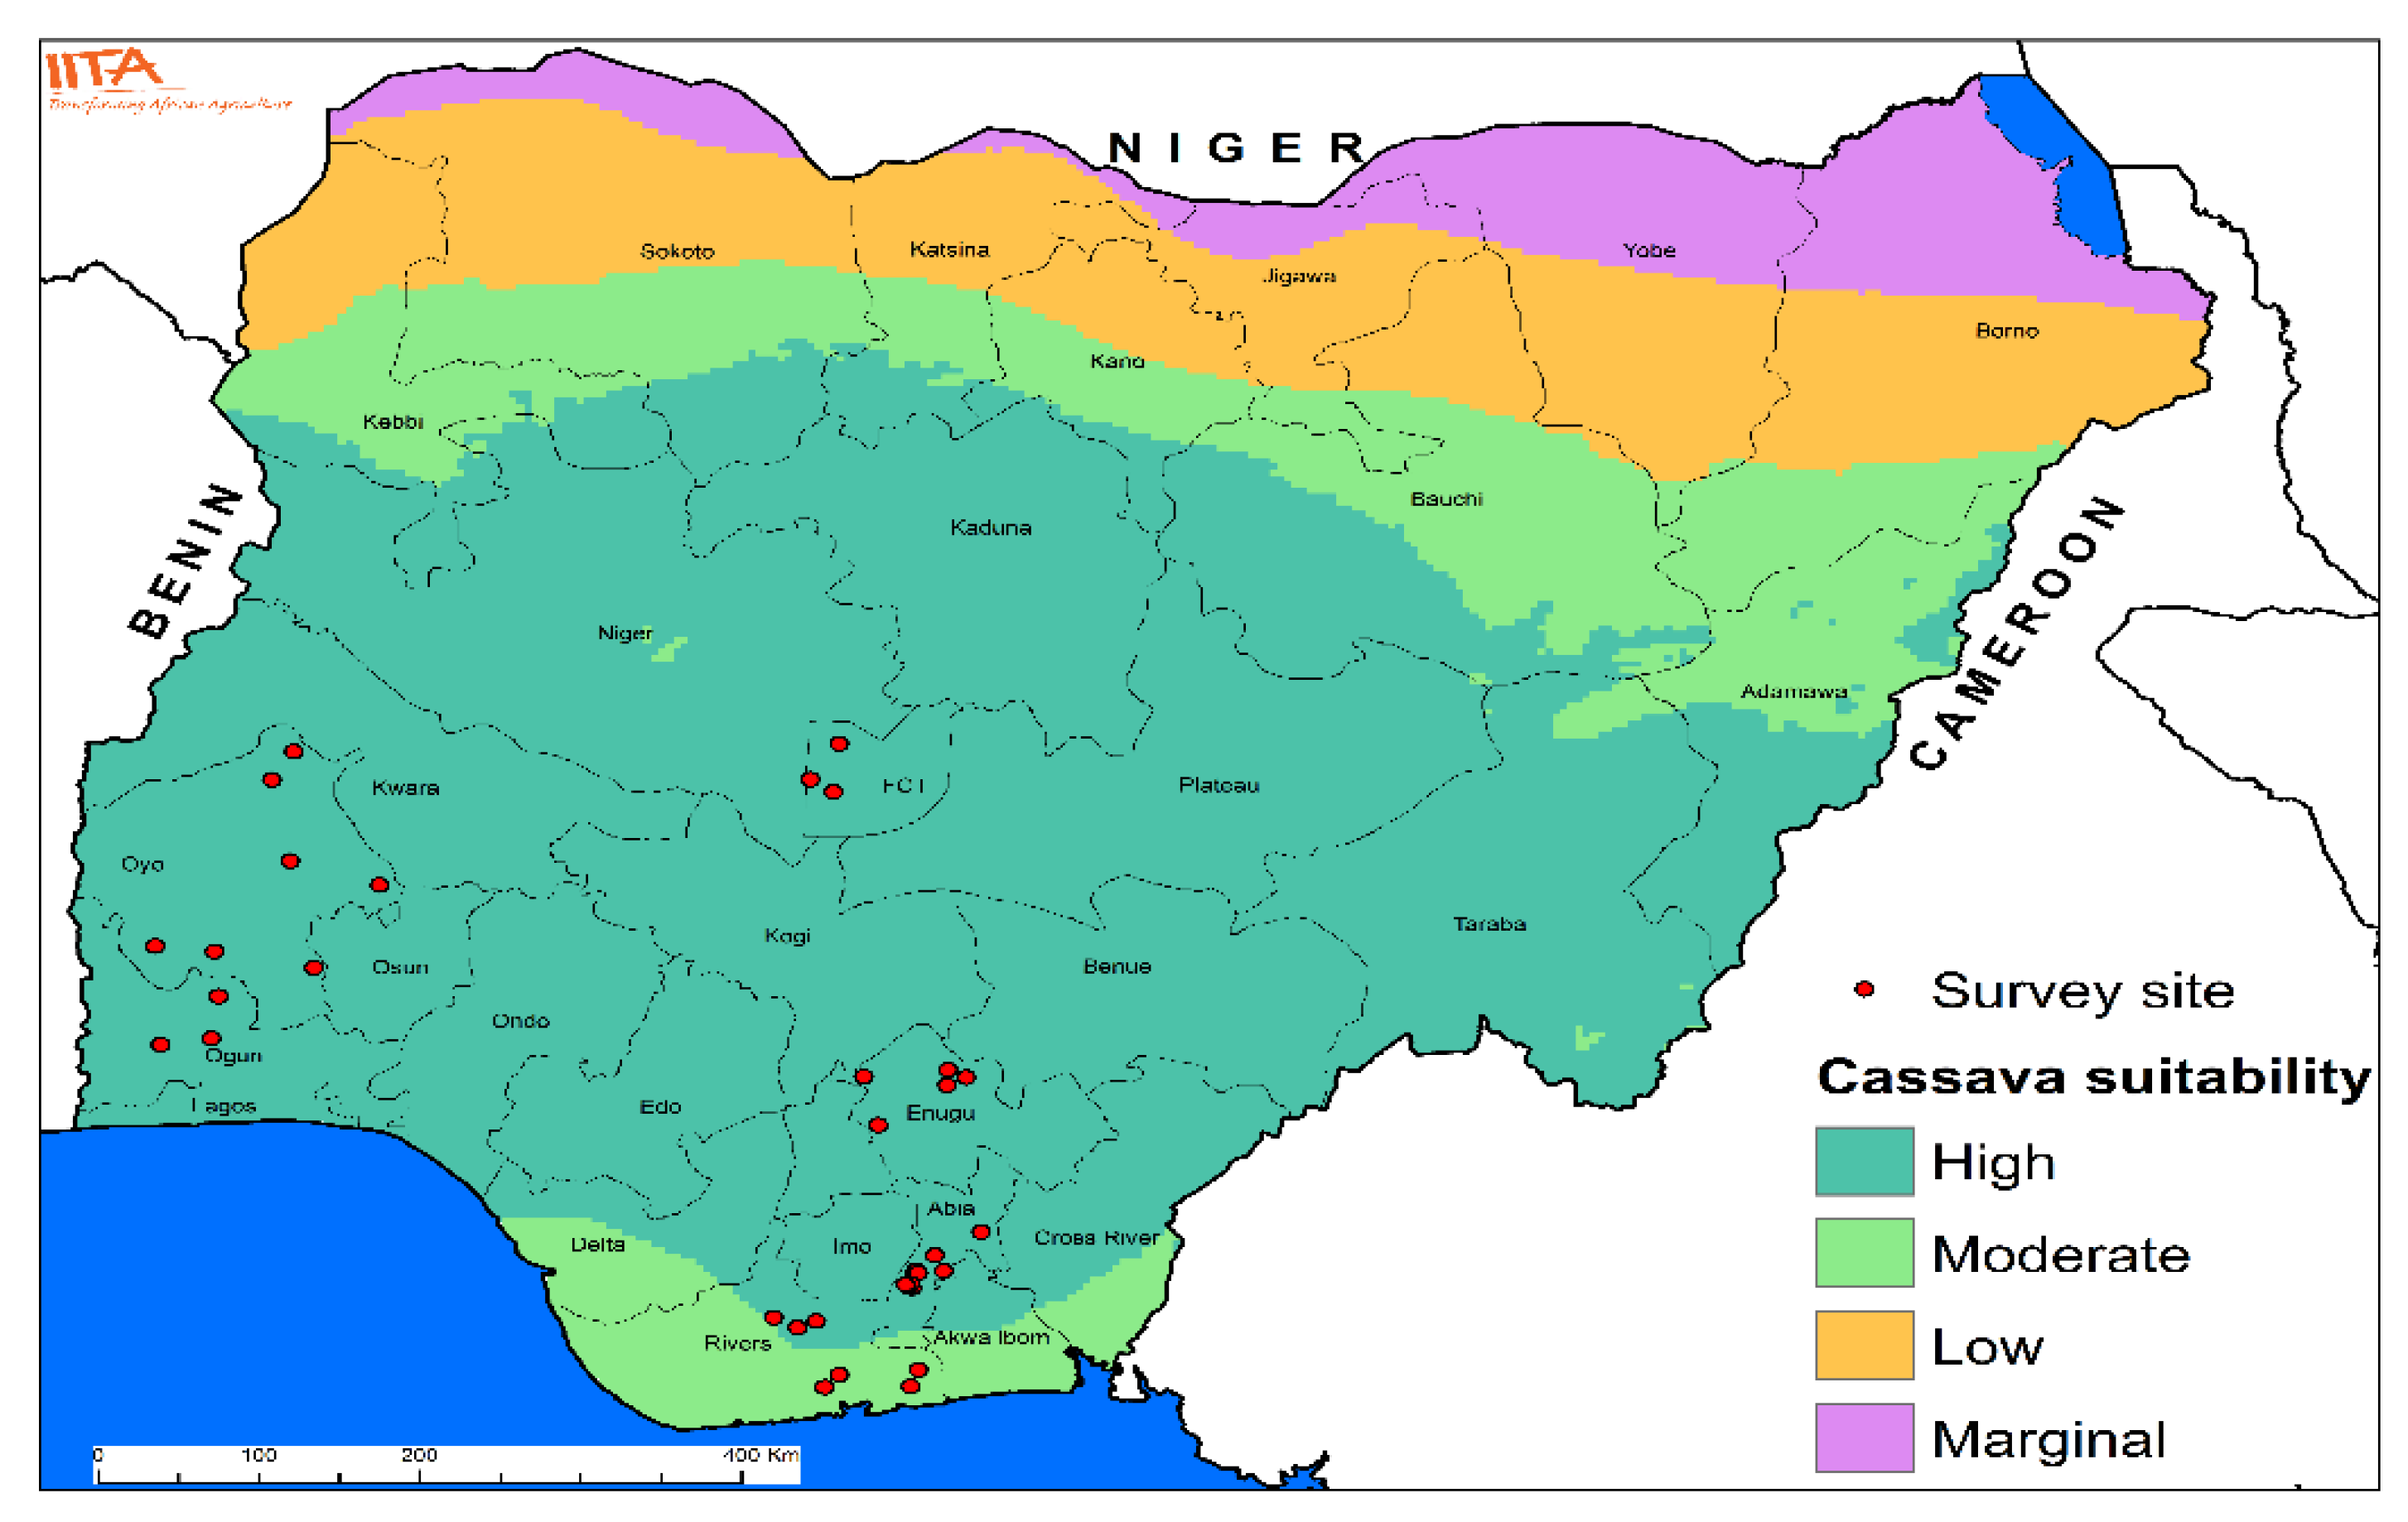
2.1. Description of the Study Area and Sampling

This study was carried out in four geographical zones of Nigeria (North-central, South-east, South-south and South-west) (The study area and location of the selected survey sites are shown in Figure 1). Nigeria is bordered to the north by the Niger Republic, to the north-east by Chad, to the east by Cameroon, to the west by the Benin Republic and to the south by approximately 800 km of the Atlantic Ocean.Approximately two-thirds of the population lives in rural areas (defined by the National Population Commission-NPC-as single geographic settings or communities with a population of fewerthan 20,000 people). There are more than 350 ethnic and linguistic groups in the country (though there are three predominant groups). Nigeria is a democratic Federal Republic consisting of 36 states and the Federal Capital Territory. The states and the FCT are organized for political administration and are further divided into 774 Local Government Areas.
Multi-stage sampling technique was employed in selecting respondents for this study. First, four geographical zones (North-central, South-east, South-south, and South-west) out of the six geographical zones of Nigeria were purposively selected (the predominance of cassava farms and farmers in the selected zones formed the basis for the selection). Secondly, a random selection of the following was made: One State in the North-central (FCT), two States in the South-east (Abia and Enugu), one State from the South-south (Rivers) and two states from the South-west (Oyo and Ogun). The third stage was the random selection of local governments areas (LGAs). The fourth stage was the random selection of villages and localities/enumeration areas (EAs). In the final stage, the cassava producing households were randomly selected by way of proportionate and representative sampling. A total sample of 775 cassava producers had earlier been pre-determined through a confidence interval approach. The survey for data collection was conducted in 2015 as part of the implementation of the IITA/IFAD project on “Enhancing the Competitiveness of High-Quality Cassava Flour (HQCF) in Nigeria”.

2.2. Data Description, Sources and Collection Methods

Primary data were collected with the use of a structured questionnaire containing both open and close-ended items. The questionnaire administration was cross-sectional in nature. Secondary data were extracted from IITA database and other documented reports such as journals, bulletins, as well as other books on related issues. Data and variables which include demographic characteristics, livelihood variables, household assets, housing structures, public utilities, health facilities, among others, were collected.

2.3. Analysis of Determinants of Poverty

The multidimensional poverty categorized the farming households into poor and non-poor status, hence, the determinants of poverty were estimated using logit Equation (4), a dichotomous (binary) regression analysis model. The logit fits a logit model for a binaryresponse by maximum likelihood.It models the probability of a positive outcome given a set of regressors. In this study, our outcome variable, i.e., poverty status, which is a binary response variable is well amenable to the logit model. The model, as adapted from Israel and Hakim [11], is modified and stated as follows:
W i = a 0 + j = 1 k a k x i j + ε i
Wi is the poverty status of the ith household, entailing (for a dummy) 1 for poor, 0 if otherwise; j = 1, 2, …, k are the vectors of the predictor variables explaining poverty; a0, ak are the parameters to be estimated while ε i is the error term. The predictor Xs are the socioeconomic variables.

3. Results and Discussion

3.1. Multidimensional Poverty Indicators and Dimensions

The dimensions and indicators considered are listed in Table 2. The multidimensional poverty estimates are based on five dimensions: Empowerment, education, health, assets, and public utilities, as earlier shown in Table 1, with equal weights assigned to all. For each dimension, thresholds were set, which is the first cut off to identify if the household is deprived in that dimension. A second cut off was set which states the number of dimensions in which a household can be deprived to be considered MPI poor. The table also shows the means and the standard deviations (SD).

3.2. Indices of Multidimensional Poverty in Nigeria

Table 3 presents multidimensional poverty in Nigeria. The table showed the aggregate MPI headcount (H) with the value of 0.742, the adjusted headcount (Mo) of 0.366 and the intensity (A) of poverty of 0.493. The results implied that about 74% of the respondents were multidimensionally poor when the poverty cut-off (k) was 0.3. When the poverty cut-off (k) was 0.5, the poverty headcount was 0.327 and the Mo was 0.201 and the intensity (A) was 0.615. Moreover, when the poverty cut-off was 0.7, the value of H was estimated to be 0.064 and Mo was 0.049 while the intensity was 0.770. The results showed decreasing poverty measures as the poverty cut-off (k) was increasing, this is consistent with the findings of Adeoti and Popoola [30]. The increasing value of the intensity (A) indicated that the share of dimensions in which the poor were deprived increased as the poverty cut-off (k) increased, though the number of poor cassava producers reduced with increase in poverty cut-off (k), but the intensity of poverty increased.Consequentially, this would increase continual disempowerment, denial of creative and healthy living, and/or an improved standard of living.
The MPI was decomposed on the basis of geographical zones in Nigeria. The results revealed the poverty headcount of 0.750, 0.782, 0.732, and 0.718 for North-central, South-east, South-South and South-west respectively when the poverty cut-off (k) was 0.3. At k = 0.5, the headcounts were 0.325, 0.338, 0.294, and 0.334, respectively, for the above mentioned zones, and when the k = 0.7, the headcount was estimated at 0.025, 0.068, 0.046, and 0.073 for the zones as mentioned earlier. Results further showed the adjusted headcount (Mo) for the zones to be 0.345, 0.389, 0.343, and 0.363 when the poverty cut-off (k) was 0.3. In the same vein, the Mo when k = 0.5 were 0.185, 0.210, 0.172, and 0.210 while it was estimated at 0.018, 0.052, 0.033 and 0.057 for North-central, South-east, South-south and South-west, respectively. The results indicated that South-east and South-west have the highest number of deprived cassava producers in the country. The intensity of poverty was observed to be increasing with an increase in cut-off (k), these depicted the intensity of poverty of cassava producers in Nigeria. Therefore, when k = 0.3, the poverty intensity stood at 0.460 for the North-central, and in the South-east of the country the intensity of poverty was estimated to be 0.497, while those of South-south and South-west stood at 0.469 and 0.506, respectively. When k = 0.5, the intensity of poverty was 0.569, 0.621, 0.585, and 0.629 for North-central, South-east, South-south, and South-west, respectively. Lastly, when k = 0.7, the intensity of poverty was 0.720, 0.765, 0.717, and 0.781 for each of the considered zones.

3.3. Contribution of Dimension to Multidimensional Poverty of Cassava Producers in Nigeria

Table 4 shows the contribution of the dimension to the overall multidimensional poverty in Nigeria. Both the aggregate estimation of adjusted headcount (Mo) of poverty and the decomposed contribution by the geographical zones in the country are shown. The results indicate that there is an increasing value of the contribution of both education and health as the cut-off (k) increases, while empowerment, assets, and public and housing utility showed decreasing trend as the cut-off (k) increases. Assets and public and housing utility were the main contributors to aggregate MPI at k = 0.3 and k = 0.5 with the value of 0.247 and 0.232, respectively. However, when k = 0.7, education and health contribute most to MPI. This suggests that asset and public and housing utility, education, and health contributed massively to MPI.
Decomposing the contribution of the dimension based on the geographical zones in Nigeria, the results on the table shows the Mo of the North-central to be 0.261 for empowerment, 0.196 for education, 0.123 for health, 0.181 for assets and 0.238 for public and housing utility when k = 0.3. This implies that empowerment contributed the highest value to MPI followed by public and housing utility, education, asset, and health. When k = 0.7, it is observed that empowerment, health, and asset contributed most to MPI. However, education has no contribution to MPI at this point. This might be a result of increasing investment of the North-central to education compared to other zones in the country. In the South-east, results show that empowerment contributed the highest value to MPI in this zone followed by asset and public and housing utility when k = 0.3. The trend was also observed when the cut-off was raised to 0.7, except that health contributes more than public and housing utility. The case of south-south was different as the asset (0.257) was the largest contributor to MPI in this region followed by education (0.237) and public and housing utility (0.190 when k = 0.7). This suggests that the foregoing are the major contributors to MPI in this zone. In the South-western zone of the country, the results revealed that education (0.253) is the lead contributor to MPI in the region followed by health (0.233) and pubic and housing utility (0.170).

3.4. Contribution of the Indicators to Multidimensional Poverty of Cassava Producers in Nigeria

The contribution of each indicator to multidimensional poverty is presented in Table 5. The table contains the results for both the aggregate and the decomposed indicators by the geographical zones in the country. The results for the aggregate MPI show that adjusted headcount based on long-time of employment, ownership of phone, household, asset, land, access to potable water, non-convenient cooking fuel, roofing material and wall materials was decreasing as the poverty cut-off (k) increases, while others showed increased values with increase in the poverty cut-off (k).
The results for the North-central zone showed that long time of employment, formal employment, access to hospital and frequency of hospital visits have the highest contribution to MPI in the study area when k = 0.7. These variables are of policy relevance, and they need the attention of the corresponding policy and other stakeholders. In the South-east zone of the country, long time of employment, formal employment, frequency of hospital visits, and household asset ownership were the main indicators contributing the highest values to MPI in the zone when the poverty cut-off (k) was 0.7. The results for the south-south zone showed formal employment, school enrolment, frequency of hospital visits, and household asset ownership with the highest contribution to MPI when k = 0.7, whereas the results differ in the South-west zone of the country where formal employment, school enrolment, years spent in school, access to hospital, and frequency of hospital visits were the major contributing indicators to MPI. The results suggest that these indicators need urgent attention in order to pull many cassava producers out of poverty in the study area.
The incidence of deprivation across the poverty indicators was also analyzed (results in Table 6). The variable on access to hospital had the lowest incidence of deprivation (16.08%) followed by years of schooling, school enrolment, formal employment, frequency of hospital visits, ownership of phone, and roofing materials. The incidences of deprivation were, however, higher i.e., more than 50% with long-time employment, wall materials, cooking fuel, access to potable drinking water, land ownership, and household asset ownership. Ataguba et al. [31] showed the incidence of deprivation to be 40.6% for health and 23.7% for employment. The study employedtwo known measures of poverty, i.e., the money-metric (unidimensional measure) and the multidimensional measures to poverty which considered household endowment of resources to estimate their poverty status. The study establishedthe integration of the two methods of estimating poverty.

3.5. Determinants of Poverty among Cassava Producers in Nigeria: Logit Estimations

The estimation of the socioeconomic determinants of poverty among cassava producers in Nigeria was done using the logit model (Table 7). The MPI obtained from the poverty cut-off, k = 3 (0.366) for the aggregate model and (0.346, 0.389, 0.343, and 0.363) for the North-central, South-east, south-south, and South-west zones, respectively, were taken as the poverty line, and this was used to classify cassava producers in the study area as poor and non-poor. The results are presented for the aggregate model, and the disaggregated models for the four regions (North-central, South-east, South-south, and South-west). The diagnostic statistics of each model are presented in the table alongside the marginal effects of the variables. The likelihood ratio chi-square value of the logit model was significant at 1% level for the aggregate model, indicating that the model is a good fit for the data. Factors which include age, marital status, years of formal education, food expenditure, access to formal and informal credit were the significant determinants of poverty. Cassava producers are more likely to be poorer with the advancement in age. This implies that aged respondents tend to be poorer than the younger ones. This is because of the diminishing strength of the farmers for farming activities as they grow older. The study of Adeoti and Popoola [30] lends credence to our findings here. However, with appreciable years of formal education, the cassava producers have a reduced chance of becoming poor. This is an indication that longer years of formal education played a significant role in poverty reduction among cassava producers. Moreover, access to informal credit reduces the probability of becoming poor, indicating that the more the cassava producers obtained credit from informal sources, the more their chances of moving out of poverty. The results also showed that age, marital status, farming experience, remittance, and access to informal credit were significant determinants of poverty among the South-eastern cassava producers. Advancement in age of the cassava producers increases the probability of being poor by 0.018 (p < 1%), while the marital status, farming experience, remittance, and access to informal credit were found to reduce the chance of the respondents to be poor. The results indicated that marital status, farming experience, remittance, and access to informal credit significantly reduce poverty. It is evident that married household heads will be more responsible and strive harder in order to adequately cater for their household members, which, in most cases, are large, particularly in the North-central zone of the study area. That explains why marital status plays a key role in poverty reduction. Remittances also add to the household income, thereby increasing the family’s wealth resources. The results contrasted the findings of Nzemwa and Oboh [32], whose work is limited to the use of the traditional money-metric approach to estimate poverty and which doesnot consider non-moneymetric indicators that could as well predict poverty.
In the south-south, the significant determinants of poverty were age of the respondents, marital status, years of education, household size, farming experience, and food expenditure. The estimates for the South-west zone showed that age, years of education, farming experience, remittance, and access to formal and informal credit were statistically significant determinants of poverty in the region, signaling that most of the cassava producers in the area obtain credit from both formal and informal sources. Lastly, in the north-central, the coefficients of years of formal education, household size, farming experience, remittance, and access to informal credit were significant determinants of poverty, indicating that a change in these variables will lead to a change in the likelihood of the cassava farmers becoming poor. Generally, large household size has been found to reduce welfare in most regions of Nigeria. Large household size has also been found to increase household poverty [8,33,34,35,36]. Our study differs from this assertion and in this regard, notes that in rural Africa and specifically in our study (e.g., in the North-central zone), members of a large household can equally be used as laborers in other farms and thus creating avenues for more income to augment the conventional household income. The labor income can sometimes more than off-set the expenses on the additional household members, which might, in turn, reduce the poverty level. Some of the variables which showed no significant relationship with farmers’ poverty status can be assumed not to be important in their effects on poverty in the study area. They may, however, be important determinants of poverty in other environments which were not considered by this study.

4. Conclusions and Recommendations

This study investigated the multidimensional poverty status among cassava producers in Nigeria. Four out of the six geographical zones in the country were selected for the study. Using the Alkire and Foster MPI methodology, the study found out that adjusted headcount poverty decreasedas the poverty cut-off increased. The MPI and the adjusted headcount poverty levelswere higher in the South-east zone of Nigeria compared to other zones. Education and health were the main contributors to the MPI. Moreover, indicators such as formal employment, school enrolment, years of schooling, frequency of hospital visits, and household asset ownership were the most prominent indicators contributing to MPI in the study area. Lastly, the estimated coefficient of age, farming experience, years of schooling, household size, and access to informal credit were significant determinants of poverty in the study area.
In conclusion, concerning povertyreduction practicality, our study suggests that policies should focus on providing incentives such as credits to younger, and specially educated, people, to engage in cassava farming. Young people are more likely to adopt more financially rewarding farming methods. Constant training and provision of extension services to young people will enhance their farming efficiency and potentials to get out of poverty. As our results suggest, being married and having access to informal credit and remittances promote the chances of moving out of poverty. We recommend a formalization of the informal credit sources and strengthening of the agriculture extension system. Introduction of farmers’ cooperative system will enhance access to agriculture loans from the formal credit institutions. Finally, a mix of federal or centralized policy and zone-specific policy initiatives that take into account the peculiar poverty dimensions of each zone is likely to be effective in lifting millions of farming population in Nigeria out of poverty.

Author Contributions

Conceptualization, L.O.O. and A.B.A.; data curation, L.O.O., M.O.A., E.G.F., and O.A.A.; formal analysis, E.G.F., M.O.A., A.A.A., and O.A.A.; funding acquisition, A.B.A.; methodology, L.O.O. and E.G.F.; project administration, A.B.A. and L.O.O.; supervision, L.O.O.; writing—original draft, E.G.F., A.A.A., M.O.A., and O.A.A.; writing—review &editing, E.G.F., L.O.O., T.A., A.W., and A.B.A. All authors have read and agreed to the published version of the manuscript.

Funding

The authors acknowledge the financial assistance of the International Fund for Agricultural Development (IFAD) through the International Institute of Tropical Agriculture (IITA) under the High-Quality Cassava Flour (HQCF) Project number 2000000175.

Conflicts of Interest

The authors declare no conflict of interest.

References

  1. Central Bank of Nigeria. Statistical Bulletin; Central Bank of Nigeria: Abuja, Nigeria, 2005; Volume 16.
  2. Lele, U.; Adu-Nyako, K. Integrated Strategy Approach for Poverty Alleviation: A Paramount Priority for Africa. Afr. Dev. Rev. 1991, 3, 1–29. [Google Scholar] [CrossRef]
  3. National Bureau of Statistics. Poverty Profile for Nigeria, National Bureau of Statistics, Lagos. 2005. Available online: https://catalog.ihsn.org/index.php/catalog/3322/download/48492 (accessed on 3 June 2020).
  4. Nsikakabasi, A.E.; Obasi, O.U. Analysis of Poverty Profile of Rural Households: Evidence from South-south Nigeria. J. Agric. Soc. Sci. 2010, 6, 48–52. [Google Scholar]
  5. Central Bank of Nigeria. Annual Report and Statement of Account; Central Bank of Nigeria: Abuja, Nigeria, 2009.
  6. United Nations Development Programme. Human Development Report; Oxford University Press: New York, NY, USA, 2008. [Google Scholar]
  7. United Nations Development Programme. Human Development Report; Oxford University Press: New York, NY, USA, 2005. [Google Scholar]
  8. Ibrahim, H.; Umar, H.S. Determinants of Poverty among Farming Households in Nasarawa State, Nigeria. Prod. Agric. Technol. (PAT) 2008, 4, 11–21. [Google Scholar]
  9. Omonoma, B.T. Quantitative Analysis of Rural Poverty in Nigeria; Brief No. 17; The Nigeria Strategy Support program (NSSP) of the International Food Policy Research Institute, IFPRI-Abuja, International Food Policy Research Institute, c/o International Center for Soil Fertility and Agriculture Development: Abuja, Nigeria, 2010; p. 17. [Google Scholar]
  10. Anyawu, J.C. The correlates of poverty in Nigeria and policy implications. Afr. J. Econ. Sustain. Dev. 2013, 2, 23–52. [Google Scholar] [CrossRef]
  11. Israel, A.O.; Hakim, A.R. Multidimensional Poverty Assessments in Rural Farm Household, South-West of Nigeria: Evidence form Oyo State Farm Settlements. Bus. Econ. J. 2015, 6, 1. [Google Scholar]
  12. Adeoti, A.I. Trend and determinants of multidimensional poverty in rural Nigeria. J. Dev. Agric. Econ. 2014, 6, 220–231. [Google Scholar] [CrossRef] [Green Version]
  13. Amartya, S. Development as Freedom, 1st ed.; Oxford University Press: New York, NY, USA, 1999; ISBN 9780198297581. Available online: http://www.c3l.uni-oldenburg.de/cde/OMDE625/Sen/Sen-intro.pdf (accessed on 3 June 2020).
  14. Alkire, S.; Santos, M.M. Acute Multidimensional Poverty: A New Index for Developing Countries; Human Development Research Paper 2010/2011; Oxford poverty and Human Development Initiative (OPHI), Oxford Department of International Development, Queen Elizabeth House (QEH), University of Oxford: Oxford, UK, 2010. [Google Scholar]
  15. Deutsch, J.; Silber, J. Measuring multidimensional poverty: An empirical Comparison of various approaches. Rev. Income Wealth 2005, 51, 145–174. [Google Scholar] [CrossRef]
  16. Dewilde, C. The multidimensional measurement of poverty in Belgium and Britain: A categorical approach. Soc. Indic. Res. 2004, 68, 331–369. [Google Scholar] [CrossRef]
  17. Furne, C.A.; Groot, W.; An den Brink, H.M. The health effects of education: A meta-analysis. Eur. J. Public Health 2008, 18, 417–421. [Google Scholar] [CrossRef] [Green Version]
  18. Wagl, U.R. Multidimensional poverty: An alternative measurement approach for the United States? Soc. Sci. Res. 2008, 37, 559–580. [Google Scholar] [CrossRef]
  19. Bourguignon, F.; Chakravarty, S. The measurement of multidimensional poverty. J. Econ. Inequal. 2003, 1, 25–49. [Google Scholar] [CrossRef]
  20. Maleta, K. Undernutrition. Malawi Med. J. 2006, 18, 189–205. [Google Scholar]
  21. Alkire, S.; Foster, J. Counting and Multidimensional Poverty Measurement. J. Public Econ. 2011, 95, 476–487. [Google Scholar] [CrossRef]
  22. Bourguignon, F.; Fields, G.S. Discontinuous losses from poverty, generalized Pα measures, and optimal transfers to the poor. J. Public Econ. 1997, 63, 155–175. [Google Scholar] [CrossRef] [Green Version]
  23. UNDP. Poverty Reduction and Human Rights—A Practice Note; New York, NY, USA, 2003. Available online: https://www.undp.org/content/dam/aplaws/publication/en/publications/democratic-governance/dg-publications-for-website/poverty-reduction-and-human-rights-practice-note/HRPN(poverty)En.pdf (accessed on 2 June 2020).
  24. Rocha, S. On Statistical Mapping of Poverty: Social Reality, Concepts and Measurement; Background Paper Prepared for the Expert Group Meeting on Poverty Statistics: Santiago, Chile, 1998. [Google Scholar]
  25. Maxwell, S. The Meaning and Measurement of Poverty; Overseas Development Institute (Odi) Poverty Briefing 3; Overseas Development Institute: 1999. Available online: https://www.odi.org/sites/odi.org.uk/files/odi-assets/publications-opinion-files/3095.pdf (accessed on 2 June 2020).
  26. Ajakaiye, O. Overview of the Current Poverty Eradication Programme in Nigeria. In The Poverty Eradication Programmes in Nigeria: Problems and Prospects; Jega, A., Wakili, H., Eds.; CDRT: Kano, Nigeria, 2002; pp. 8–33. [Google Scholar]
  27. Omotola, J.S. Combating Poverty for Sustainable Human Development in Nigeria: The Continuing Struggle. J. Poverty 2008, 12, 496–517. [Google Scholar] [CrossRef]
  28. Mishra, U.S.; Shukla, V. Welfare comparison with multidimensional wellbeing indicators: An Indian Illustration. Soc. Indic. Res. 2015, 129, 505–525. [Google Scholar] [CrossRef] [Green Version]
  29. Bidyadhar, D.; Sanjay, K.M. Regional Estimates of Multidimensional Poverty in India. Open Access Open Assess. E J. 2015, 9, 1–35. [Google Scholar] [CrossRef] [Green Version]
  30. Adeoti, A.; Popoola, O. Determinant of Child poverty in rural Nigeria: A multidimensional approach. Glob. J. Hum. Soc. Sci. Art Humanit. 2012, 12, 38–54. [Google Scholar]
  31. Ataguba, J.; Fonta, W.M.; Ichoku, H.E. The Determinants of Multidimensional Poverty in Nsukka; Nigeria PEP Policy Briefs 164434; Partnership for Economic Policy (PEP), PEP Global Secretariat Duduville Campus: Nairobi, Kenya, 2011. [Google Scholar]
  32. Nzenwa, G.C.; Oboh, V.U. Effects of household endowments on poverty among farmers in Benue State. In Proceedings of the 39th Conference of the Agricultural Society of Nigeria, Benin, Nigeria, 9–13 October 2005; pp. 308–311. [Google Scholar]
  33. Lipton, M. Growing points in poverty research. Int. Inst. Labour 1999, 6, 5–10. [Google Scholar]
  34. Schoummaker, B. Poverty and Fertility in Sub-Saharan Africa: Evidence from 25 Countries. 2004. Available online: http://www.brunoschoumaker.be/PAA2004schoumaker.pdf (accessed on 16 June 2011).
  35. Aassve, A.; Engllehardt, H.; Francavilla, F.; Kedir, A.; Kim, J.; Mealli, F.; Mencarini, L.; Pudney, S.; Prskawetz, A. Poverty and fertility dynamics: A comparative analysis. Popul. Rev. 2006, 45, 1–23. [Google Scholar] [CrossRef]
  36. Kates, R.W.; Dasgupta, P. African poverty: A grand challenge for sustainability Science. Proc. Natl. Acad. Sci. USA 2007, 104, 16747–16750. [Google Scholar] [CrossRef] [PubMed] [Green Version]
Figure 1. Study area.
Sustainability 12 05366 g001
Table 1. Dimensions, indicators and weights used in computation of multidimensional poverty index (MPI).
S/nDimensionsDescription of IndicatorsWeights
1.EmpowermentLong-time employment: Absence of long-time employment (at least five years).0.1
Formal employment: No formal employment in agriculture or non-agriculture0.1
2.EducationSchool enrolment: No access to formal education0.1
Years of Schooling: Household head has not completed six years of schooling0.1
3.HealthAccess to hospital: No access to hospital0.1
Frequency of hospital visits: No hospital visits for medical check-up per annum0.1
4.AssetOwnership of phones: No ownership of mobile or fixed phone0.1
Household asset ownership: No ownership of two household assets 0.1
5.Public and housing utilityLand ownership: No land ownership0.04
Access to potable drinking water: No access to potable drinking water or no access covered well with pumping machine and presence of only open well, streams, lakes etc.,0.04
Non-convenient cooking fuels: Use of sawdust and fuel wood and no usage of kerosene and/or gas0.04
Roofing material: Use of thatched roof and no usage of galvanized and/or aluminium0.04
Wall material: Use of thatched roof and no usage of concrete wall0.04
Table 2. Socioeconomic/demographic characteristics and poverty indicators.
Variables Description Mean (SD)
Household sizeRespondents household size (number of family members provided for by the household head)8.98 (3.99)
Gender1 if the respondent is male, otherwise 00.68 (0.47)
Marital status1 if the respondent is married, otherwise 00.89 (0.307)
Years of formal educationYears of education (Number of years spent in school)6.92 (4.938)
Age Age of the respondents (years)49.36 (14.70)
Years of farming experienceFarming experience (number of years in farming)17.36 (9.71)
Remittance1 if the respondent has received remittance, otherwise 00.20 (0.40)
Formal credit1 if the respondent has used formal credit, otherwise 00.44 (0.21)
Informal credit 1 if the respondent has used informal credit, otherwise 00.25 (0.43)
Cash saving1 if the respondent saved, otherwise 00.59 (0.49)
Food expenditureTotal amount spent on food item (in Naira)0.345 (0.476)
Poverty dimension 1 5 = Empowerment, 1 5   = education, 1 5 = health, 1 5 = assets, 1 5   = public utilities and housing 0.54 (0.15)
Poverty status(dummy) 1 = poor, 0 = non poor0.80 (0.39)
Source: Authors’ computation, 2018.
Table 3. Multidimensional poverty in Nigeria: Regional and pooled samples.
K = 0.3K = 0.5K = 0.7
Variable MO
(H*A)
HAMO
(H*A)
HAMO
(H*A)
HA
Aggregate MPI0.3660.7420.4930.2010.3270.6150.0490.0640.770
Decomposition of MPI by Regions
North-central0.3450.7500.4600.1850.3250.5690.0180.0250.720
South-east0.3890.7820.4970.2100.3380.6210.0520.0680.765
South-South0.3430.7320.4690.1720.2940.5850.0330.0460.717
South-west0.3630.7180.5060.2100.3340.6290.0570.0730.781
Source: Authors’ computation, 2018.
Table 4. Contribution of the poverty dimensions to MPI: Aggregate and by regions.
RegionsNorth-CentralSouth-EastSouth-SouthSouth-WestAggregate MPI
Cut-offK = 0.3K = 0.5K = 0.7K = 0.3K = 0.5K = 0.7K = 0.3K = 0.5K = 0.7K = 0.3K = 0.5K = 0.7K = 0.3K = 0.5K = 0.7
MPI/DimensionsMO (H*A)MO (H*A)MO (H*A)MO (H*A)MO (H*A)MO (H*A)MO (H*A)MO (H*A)MO (H*A)MO (H*A)MO (H*A)MO (*A)MO (H*A)MO (H*A)MO (H*A)
Empowerment0.2610.2300.2780.2850.2770.2460.1600.1560.1380.1840.1800.1820.2160.2090.199
Education 0.1960.2170.0000.0990.1200.1560.0920.137 0.2370.1920.2050.2530.1440.1670.215
Health0.1230.1490.2780.1420.1850.2050.1790.1830.1780.1380.1940.2330.1460.1870.217
Asset0.1810.200.2780.2530.2340.2300.3030.3040.2570.2270.2060.1620.2470.2320.199
Public and housing utility0.2380.2010.1670.2220.1830.164 0.2660.2210.1900.2580.2140.1700.2470.2050.171
Source: Authors’ computation, 2018.
Table 5. Contribution of each indicator to MPI: Aggregate and by regions.
RegionsNorth-CentralSouth-EastSouth-SouthSouth-WestAggregate MPI
CutoffK = 0.3K = 0.5K = 0.7K = 0.3K = 0.5K = 0.7K = 0.3K = 0.5K = 0.7K = 0.3K = 0.5K = 0.7K = 0.3K = 0.5K = 0.7
MPI/IndicatorsMO (H*A)MO (H*A)MO (H*A)MO (H*A)MO (H*A)MO (H*A)MO (H*A)MO (H*A)MO (H*A)MO (H*A)MO (H*A)MO (H*A)MO (H*A)MO (H*A)MO (H*A)
Long-time employment0.1740.1490.1390.1750.1450.1150.0100.0110.0000.1070.0730.0560.1140.0890.069
Formal employment0.0870.0810.1390.1100.1320.1310.1510.1440.1380.0780.1070.1270.1020.1200.130
School enrolment 0.0940.1080.0000.0530.065 0.0820.0480.0720.1380.0960.1030.1270.0730.0860.111
Years of schooling0.1020.1080.0000.0460.0550.0740.0440.0650.0990.0960.1030.1270.0710.0810.103
Access to Hospital0.0360.0680.1390.0320.0530.0740.0290.0380.0400.0600.0870.1060.0440.0670.087
Frequency of hospital visits0.0870.0810.1390.1100.1320.1310.1510.1440.1380.0780.1070.1270.1020.1200.130
Ownership of phone0.0650.0810.1390.1010.0960.0980.1390.1480.1380.0840.0800.0660.0990.0970.087
Household asset ownership0.1160.1220.1390.1520.1390.1310.1640.1560.1190.1430.1260.0960.1490.1350.111
Land ownership0.0290.0270.0560.0520.0430.0390.0470.0490.0400.0640.0510.0360.0550.0470.038
Access to potable drinking water0.0490.0330.0000.0680.0540.0490.0530.0460.0550.0470.0420.0340.0550.0460.041
Non-convenient cooking fuel0.0730.0700.0560.0460.0380.0300.0630.0500.0320.0550.0430.0360.0540.0440.034
Roofing materials0.0000.0000.0280.0000.0000.0000.0820.0640.0550.0370.0340.0000.0310.0270.022
Wall materials0.0870.0700.0560.0560.0470.0460.020.0120.0080.0560.0440.0340.0510.0410.035
Source: Authors’ computation, 2018.
Table 6. Percentage of individuals whose indicator values are below the threshold.
S/NDimensionsDescription of IndicatorsWeightsDeprived (%)
1.EmpowermentLong-time employment0.152.01
Formal employment0.137.61
2.EducationSchool enrolment0.127.49
Years of Schooling0.126.07
3.HealthAccess to hospital0.116.08
Frequency of hospital visits0.137.61
4.AssetOwnership of phones0.139.04
Household asset ownership0.165.62
5.Public and housing utilityLand ownership0.0465.49
Access to potable drinking water0.0463.42
Non-convenient cooking fuels0.0460.96
Roofing material0.0442.80
Wall material0.0457.45
Source: Author’s computation, 2018.
Table 7. Logit estimation of the determinants of poverty among cassava producers in Nigeria: Regional and pooled samples.
North-CentralSouth-EastSouth-SouthSouth-WestAggregate
Variable CoefficientMarginal EffectsCoefficientMarginal EffectsCoefficientMarginal EffectsCoefficientMarginal EffectsCoefficientMarginal Effects
Constant−2.807(1.045) *** 2.600(0.898) *** 4.138(1.712) ** −4.147(2.038) *** 1.077 (0.392) ***
Age−0.009(0.060)−0.002(0.013)0.089(0.017) ***0.018(0.003)−0.020(0.008) ***−0.004(0.003)0.005(0.003) *0.000(0.001)0.025(0.070) ***0.006(0.002)
Gender1.012(1.159)0.229(0.282)0.307(0.319)0.062(0.063)−0.347(0.435)−0.075(0.091)−0.264(0.379)−0.020(0.028)0.166(0.170)0.038(0.039)
Marital status−0.684(0.062)−0.134(0.161)−0.745(0.407) *−0.168(0.123)−0.862(0.590) *−0.165(0.095)0.399(0.551)0.037(0.058)−0.188(0.109) *−0.041(0.058)
Years of formal education−0.161(0.062) ***−0.013(0.133)0.043(0.036)0.009(0.007)−0.123(0.039) ***−0.027(0.009)−0.171(0.032) ***−0.014(0.003)−0.093(0.016) ***−0.021(0.004)
Household size−0.004(0.002) **−0.001(0.022)−0.089(0.068)−0.018(0.013)0.045(0.022) **0.010(0.012)−0.016(0.034)−0.001(0.003)0.006(0.020)0.000(0.005)
Years of farming experience−0.093(0.041) **−0.195(0.015)−0.788(0.022) ***−0.016(0.005)0.049(0.027) *0.011(0.006)−0.040(0.021) *−0.003(0.002)−0.005 (0.011)−0.001(0.002)
Remittance−0.697(0.223) ***−0.844(0.075)−1.152(0.638) *−0.200(0.149)0.201(1.031)0.044(0.224)−0.767(0.349) **−0.998(0.001)−1.609 (1.185)−0.375(0.262)
Food expenditure0.183(0.242)0.038(0.089)0.078(0.171)0.016(0.035)−0.189(0.054) ***−0.542(0.154)0.286(0.182)0.023(0.015)0.331(0.090) ***0.02(0.020)
Informal Credit−0.666(0.352) *−0.949(0.015)−0.738(0.343) **−0.162(0.242)0.783(1.058)0.164(0.205)0.768(0.248) ***0.834(0.040)−1.975(1.169) *−0.354(0.153)
Cash saving1.191(1.162)0.269(0.276)−0.255(0.369)−0.053(0.078)−0.121(0.397)−0.027(0.087)0.289(0.338)0.024(0.028)−0.023(0.164)−0.005(0.037)
Formal Credit−0.620(1.145)−0.138(0.270)−0.134(0.996)−0.027(0.192)−0.408(0.847)−0.095(0.204)0.571(0.289) **0.212(0.029)1.793(1.079) *0.276(0.092)
Diagnostics
Pseudo R20.1689 0.1276 0.1028 0.1331 0.0660
Prob > chi20.0000 ** 0.0002 *** 0.0310 *** 0.0000 *** 0.0000 ***
LR chi2319.62 35.87 15.75 627.42 66.37
N42 232 153 334 771
Source: Authors’ computation, 2018. Figures in parenthesis are the standard error. *** 1% level of significance, ** 5% level of significance, * 10% level of significance.

