Article

Design, Modeling, and Experimental Investigation of Active Water Cooling Concentrating Photovoltaic System

1
Mechanical Engineering Department, Benha Faculty of Engineering, Benha University, Benha Z.C. 13512, Egypt
2
Mechanical Engineering Department, Faculty of Engineering, Al-Hussein Bin Talal University, Ma’an 71111, Jordan
3
Systems Engineering Department, King Fahd University of Petroleum & Minerals, Dhahran 31261, Saudi Arabia
4
Department of Alternative Energy Technology, Faulty of Engineering and Technology, Al-Zaytoonah University, Amman 11733, Jordan
5
Department of Mechanical Engineering, Tafila Technical University, Tafila 66110, Jordan
6
College of Engineering at Wadi Addawaser, Prince Sattam Bin Abdulaziz University, Wadi Addawaser 11991, Saudi Arabia
7
Electrical Engineering Department, Faculty of Engineering, Minia University, Minia 61517, Egypt
*
Authors to whom correspondence should be addressed.
Sustainability 2020, 12(13), 5392; https://0-doi-org.brum.beds.ac.uk/10.3390/su12135392
Submission received: 11 June 2020 / Revised: 28 June 2020 / Accepted: 29 June 2020 / Published: 3 July 2020
(This article belongs to the Special Issue Solar Systems and Sustainability)

Abstract

:
This work presents performance study of a concentrating photovoltaic/thermal (CPV/T) collector and its efficiency to produce electric and thermal power under different operating conditions. The study covers a detailed description of flat photovoltaic/thermal (PV/T) and CPV/T systems using water as a cooling working fluid, numerical model analysis, and qualitative evaluation of thermal and electrical output. The aim of this study was to achieve higher efficiency of the photovoltaic (PV) system while reducing the cost of generating power. Concentrating photovoltaic (CPV) cells with low-cost reflectors were used to enhance the efficiency of the PV system and simultaneously reduce the cost of electricity generation. For this purpose, a linear Fresnel flat mirror (LFFM) integrated with a PV system was used for low-concentration PV cells (LCPV). To achieve the maximum benefit, water as a coolant fluid was used to study the ability of actively cooling PV cells, since the electrical power of the CPV system is significantly affected by the temperature of the PV cells. This system was characterized over the traditional PV systems via producing more electrical energy due to concentrating the solar radiation as well as cooling the PV modules and at the same time producing thermal energy that can be used in domestic applications. During the analysis of the results of the proposed system, it was found that the maximum electrical and thermal energy obtained were 170 W and 580 W, respectively, under solar concentration ratio 3 and the flow rate of the cooling water 1 kg/min. A good agreement between the theoretical and experimental results was confirmed.

1. Introduction

At present, 80 percent of the world’s energy is produced from fossil fuels [1]. The exhaust products of using these resources affect the environment, mainly through global warming and acid rain. Currently, oil provides more than 35% of the global primary energy, coal and natural gas add 23% and 21%, respectively [2,3,4]. The fossil fuel distribution around the world is uneven, whereas, more than half of the global supply is obtained from the Middle East. This leads to an unbalanced economy around the world that affects the whole political geography. The burning of fossil fuel produces atmospheric emission of CO2 (carbon dioxide), where its concentration will cause an average temperature rise of 3–5 °C [3].
Considering the above, as well as the fact that oil is running out quickly, alternatives should be adopted. Renewable energy is one of the promising options for the above problems. PV (photovoltaic) panels can provide a good source of producing clean electricity. The efficiency range of solar radiation conversion is about 5%–20%, depending on the type of cell [5,6]. Most commercial PV cells are made from silicon and come in two general types, mono-crystalline and multi-crystalline. These types of PV cells are the most efficient, with approximately 15% efficiency [7,8]. The amount of solar energy converted to electrical power depends on the intensity of solar radiation falling on PV cells, as well as PV and ambient temperatures [9]. When the temperature of the PV module is increased, the efficiency drops. Depending on the PV type, the approximate descent of efficiency is around 0.5%/°C from the cell operating temperature.
The PV cells absorb up to 80% of incident solar radiation but, depending on the efficiency of the PV cell technology used, only a small part of the absorbed incident energy is converted into electricity [10]. The remainder energy that was absorbed by the PV cell is dissipated as heat and the PV cell can reach a temperature 40 °C above the ambient. The overheating reduces the efficiency of the panels dramatically.
Many ways of cooling the PV module will be presented and discussed. A steady state of a PV/T (photovoltaic/thermal) collector utilizing air and/or water cooling are some examples [11,12]. The optimum cooling solution is dependent on several factors, such as PV technology, the type of concentrating system, and weather conditions at which the system is installed. The annual performance indicated that the delivered energy from the PV modules increases by 5% during the dry and warm seasons [13,14].
To promote the production of electricity from PV units, it is a must to reduce the operating temperature to improve efficiency. Using water in the PV/T system is more efficient than using air because the thermal properties of water are better than air [12]. Othman et al. [15] provided a merge of both air and water mediums with the conventional PV/T collector. The main components fabricated in the system are two transparent PV modules connected in parallel to generate electrical power, double pass air flat plat collector, copper water tube, and reservoir for produced hot water. Experimental values of PV temperature, the air temperature on both channels, and water temperature were measured. The thermal and electric efficiency obtained under 800 W/m2 solar irradiation are 70.09% and 19.95%, respectively.
Ahmad Fudholi et al. [16] determined the electrical and thermal performance of PV cells cooled by water under solar irradiation ranging from 500 to 800 W/m2. For each solar irradiance level, a flow rate of 0.01 kg/s to 1.041 kg/s was introduced. The electrical, thermal, and total efficiency of the PV/T collectors were examined. The results showed that the spiral flow absorption was highest at 800 W/m2 solar intensity and 0.41 kg/s water flow rate, with an electrical efficiency of 13.8%, thermal efficiency of 54.6%, and overall efficiency of 68.4%.
The mixed solar PV system and solar heat collector, PV/T, is an alternative solar solution, which offers a distinct advantage of providing one-unit form thermal output, as well as an electric output with improved efficiency compared to PV stand-alone units if properly designed [17]. Other cooling mediums can be used to extract the heat from the PV, such as oils and nanofluids, which can be used in different methods. Attention has been focused on the use of practical, durable, and inexpensive reflectors to increase the electricity produced from PV cells to become price competitive in the market.
The theoretical and experimental work of a linear Fresnel reflector mirror (LFRM) with a horizontal receiver was developed by Gomaa et al. [14,18]. The thermal, electric, and total efficiency obtained were 62%, 18%, and 80%, respectively. Whereas, Wang et al. [19] proposed the use of a horizontal concentrating photovoltaic (CPV) receiver and LFRM and carried out sun-tracking error effect analysis. The normalized optical efficiency resulted, and PV efficiency experimentally was 0.62 when the deviation angle is 1° and 13.6%, respectively.
Prasad et al. [20] studied LFRM optimization with a secondary mirror and tubular receiver. The study presented a high distribution uniformity of a flux density on the tube receiver collector. Whereas, Abbas et al. [21] investigated the yearly performance of LFRMs on the thermal receiver using different shapes of mirrors.
Beltagy et al. [22] studied theoretical and experimental LFRMs with a thermal receiver that results in a daily thermal efficiency over 40%. He et al. [23] proposed an LFRM system and managed the pertinent optical analysis study. Chemisana et al. [24] developed the simulation and experimental study of a two-axis LFRM solar concentrator. The results of both revealed good agreements. Zhu and Chen’s [25] study presented several CLFRM (compact linear Fresnel reflector mirror) system designs. The experimental and simulation investigations of the CLFRM performance were carried out. In addition, Wang et al. [26] studied the optical and thermodynamic performance of a CLFRM with a combined PV/T receiver.
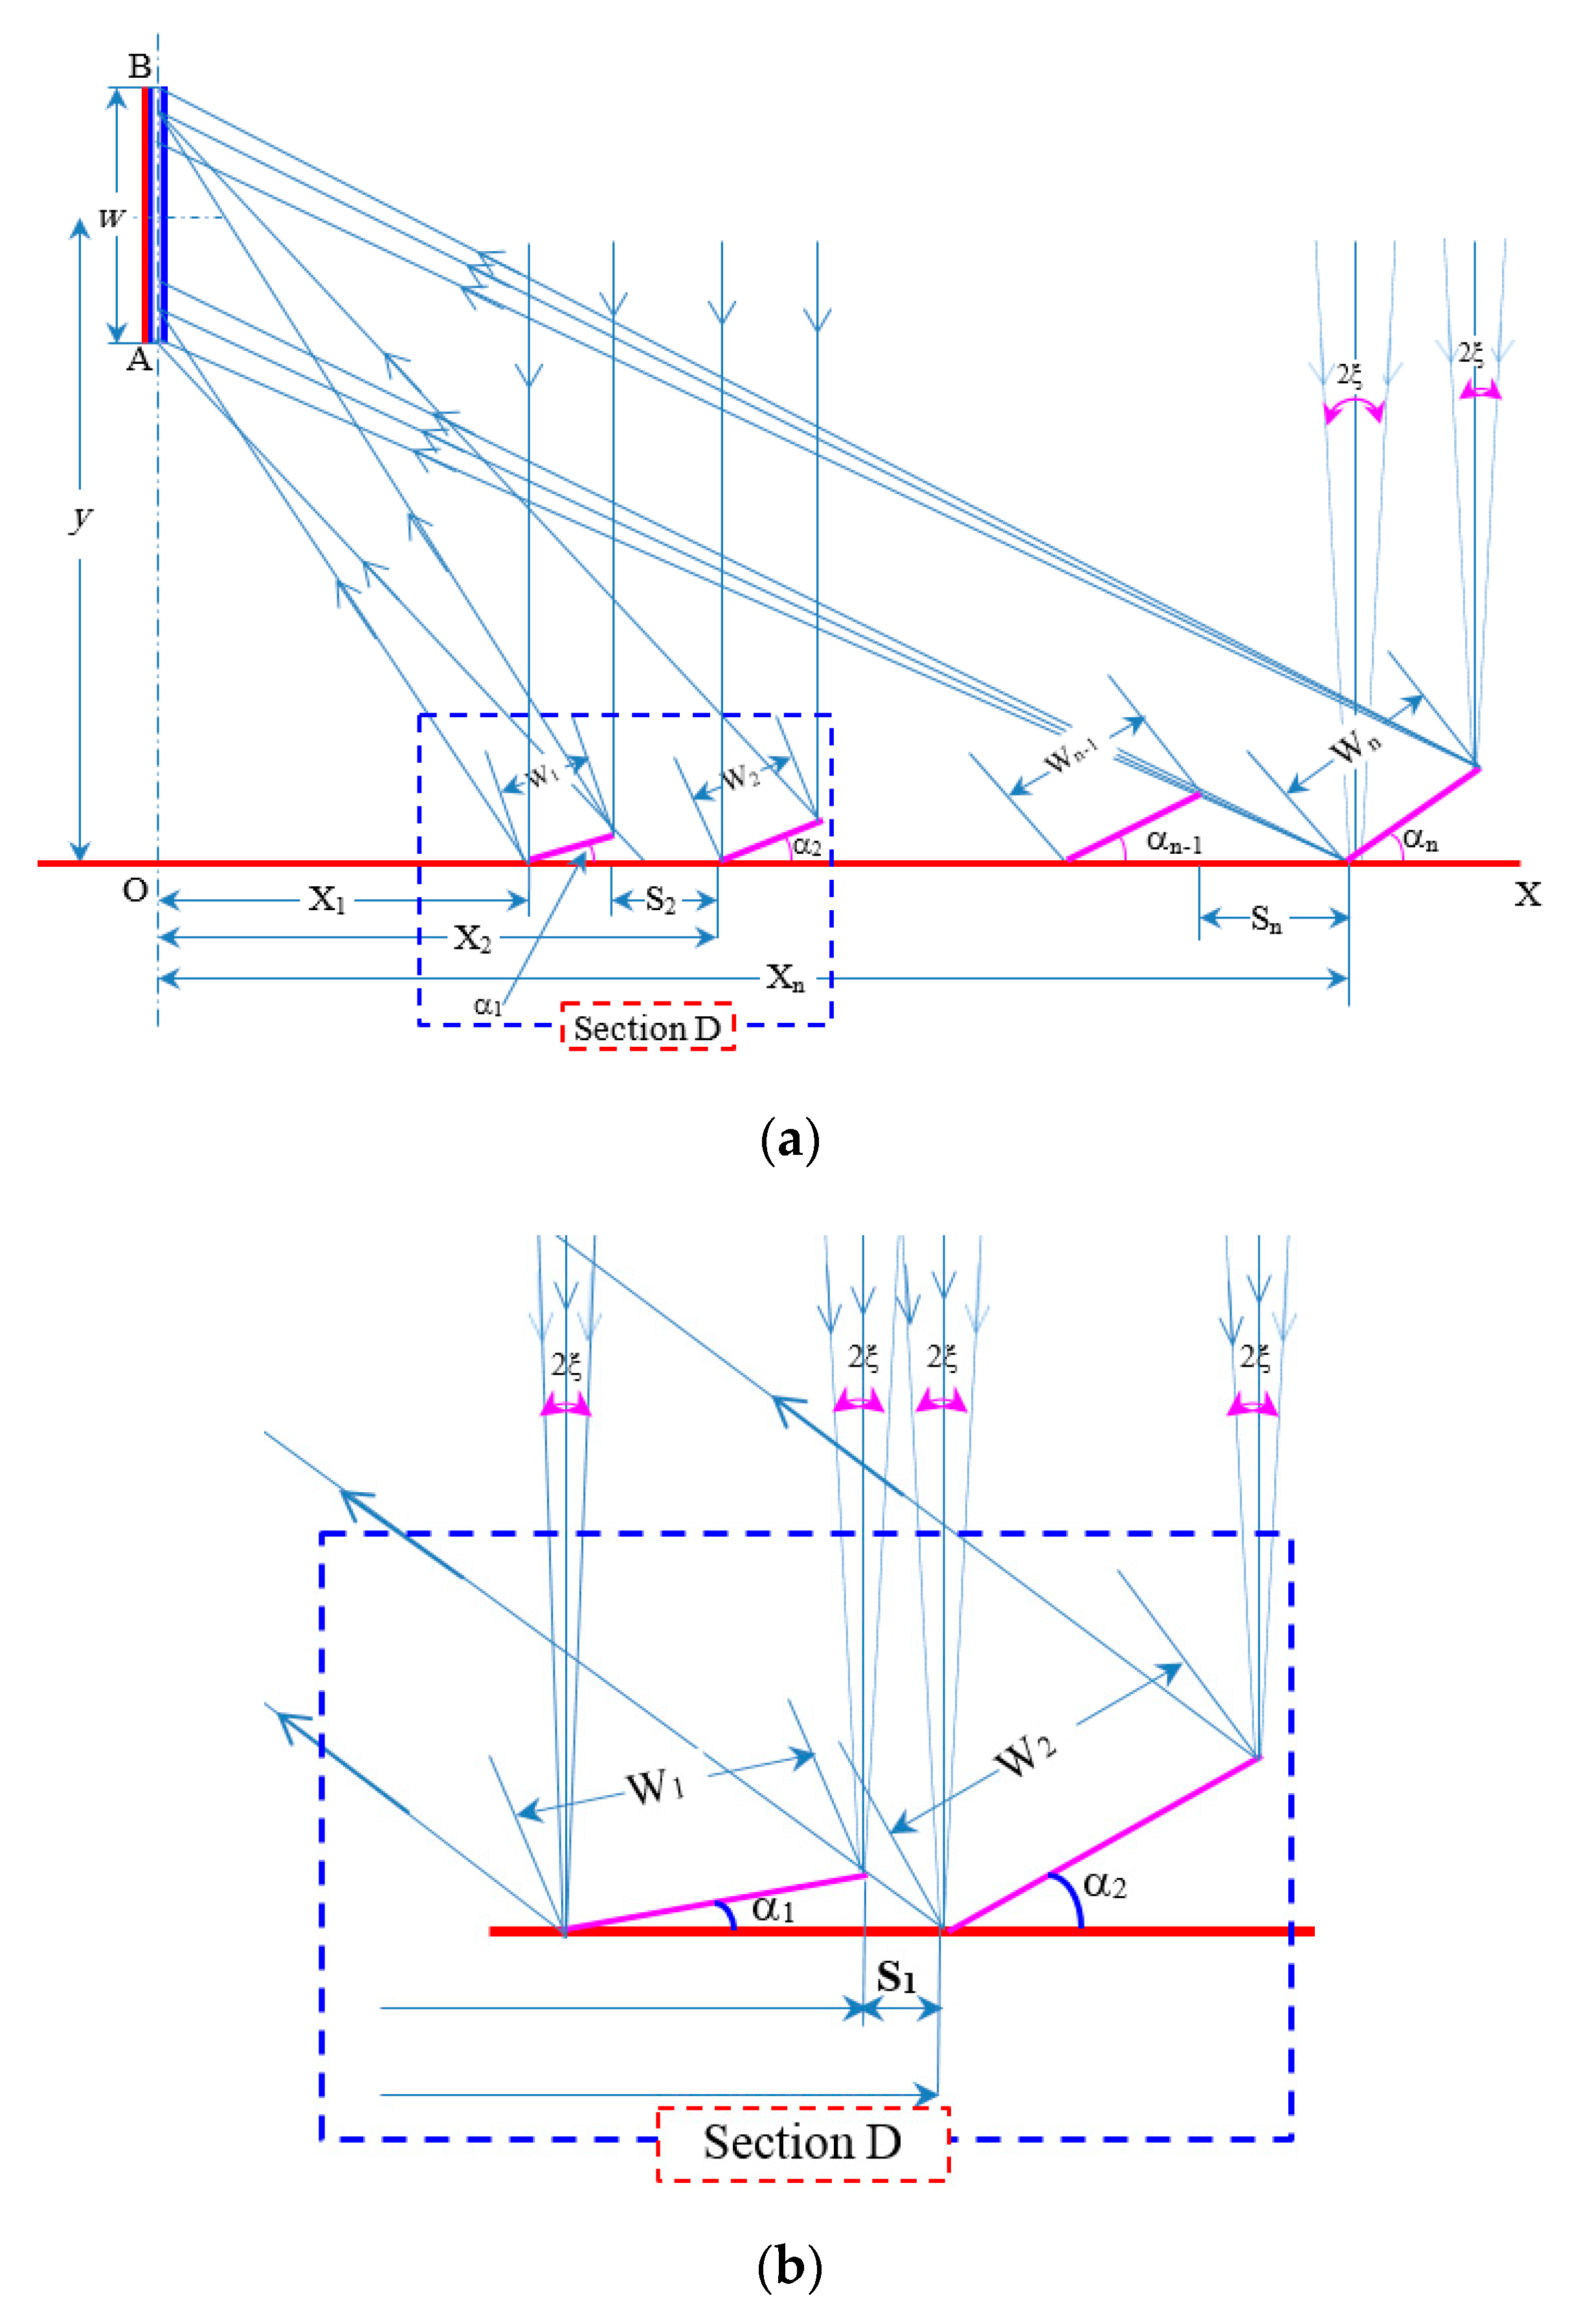
All the above-mentioned research studies have enhanced the contents of LFRM solar concentrators. However, most of these studies have been performed in the field of solar thermal use for LFRM concentrators until now. There were a few studies on solar concentrating PV systems using LFRM. In addition, when the use of LFRM in solar CPV systems is considered, it will also be helpful, by adjusting the geometrical structure of the conventional LFRM concentrator with vertical receiver instead of a horizontal one, to create large solar cell utilization and high solar concentrations uniformity and to overcome the effects of shadows and blocks on solar cells.
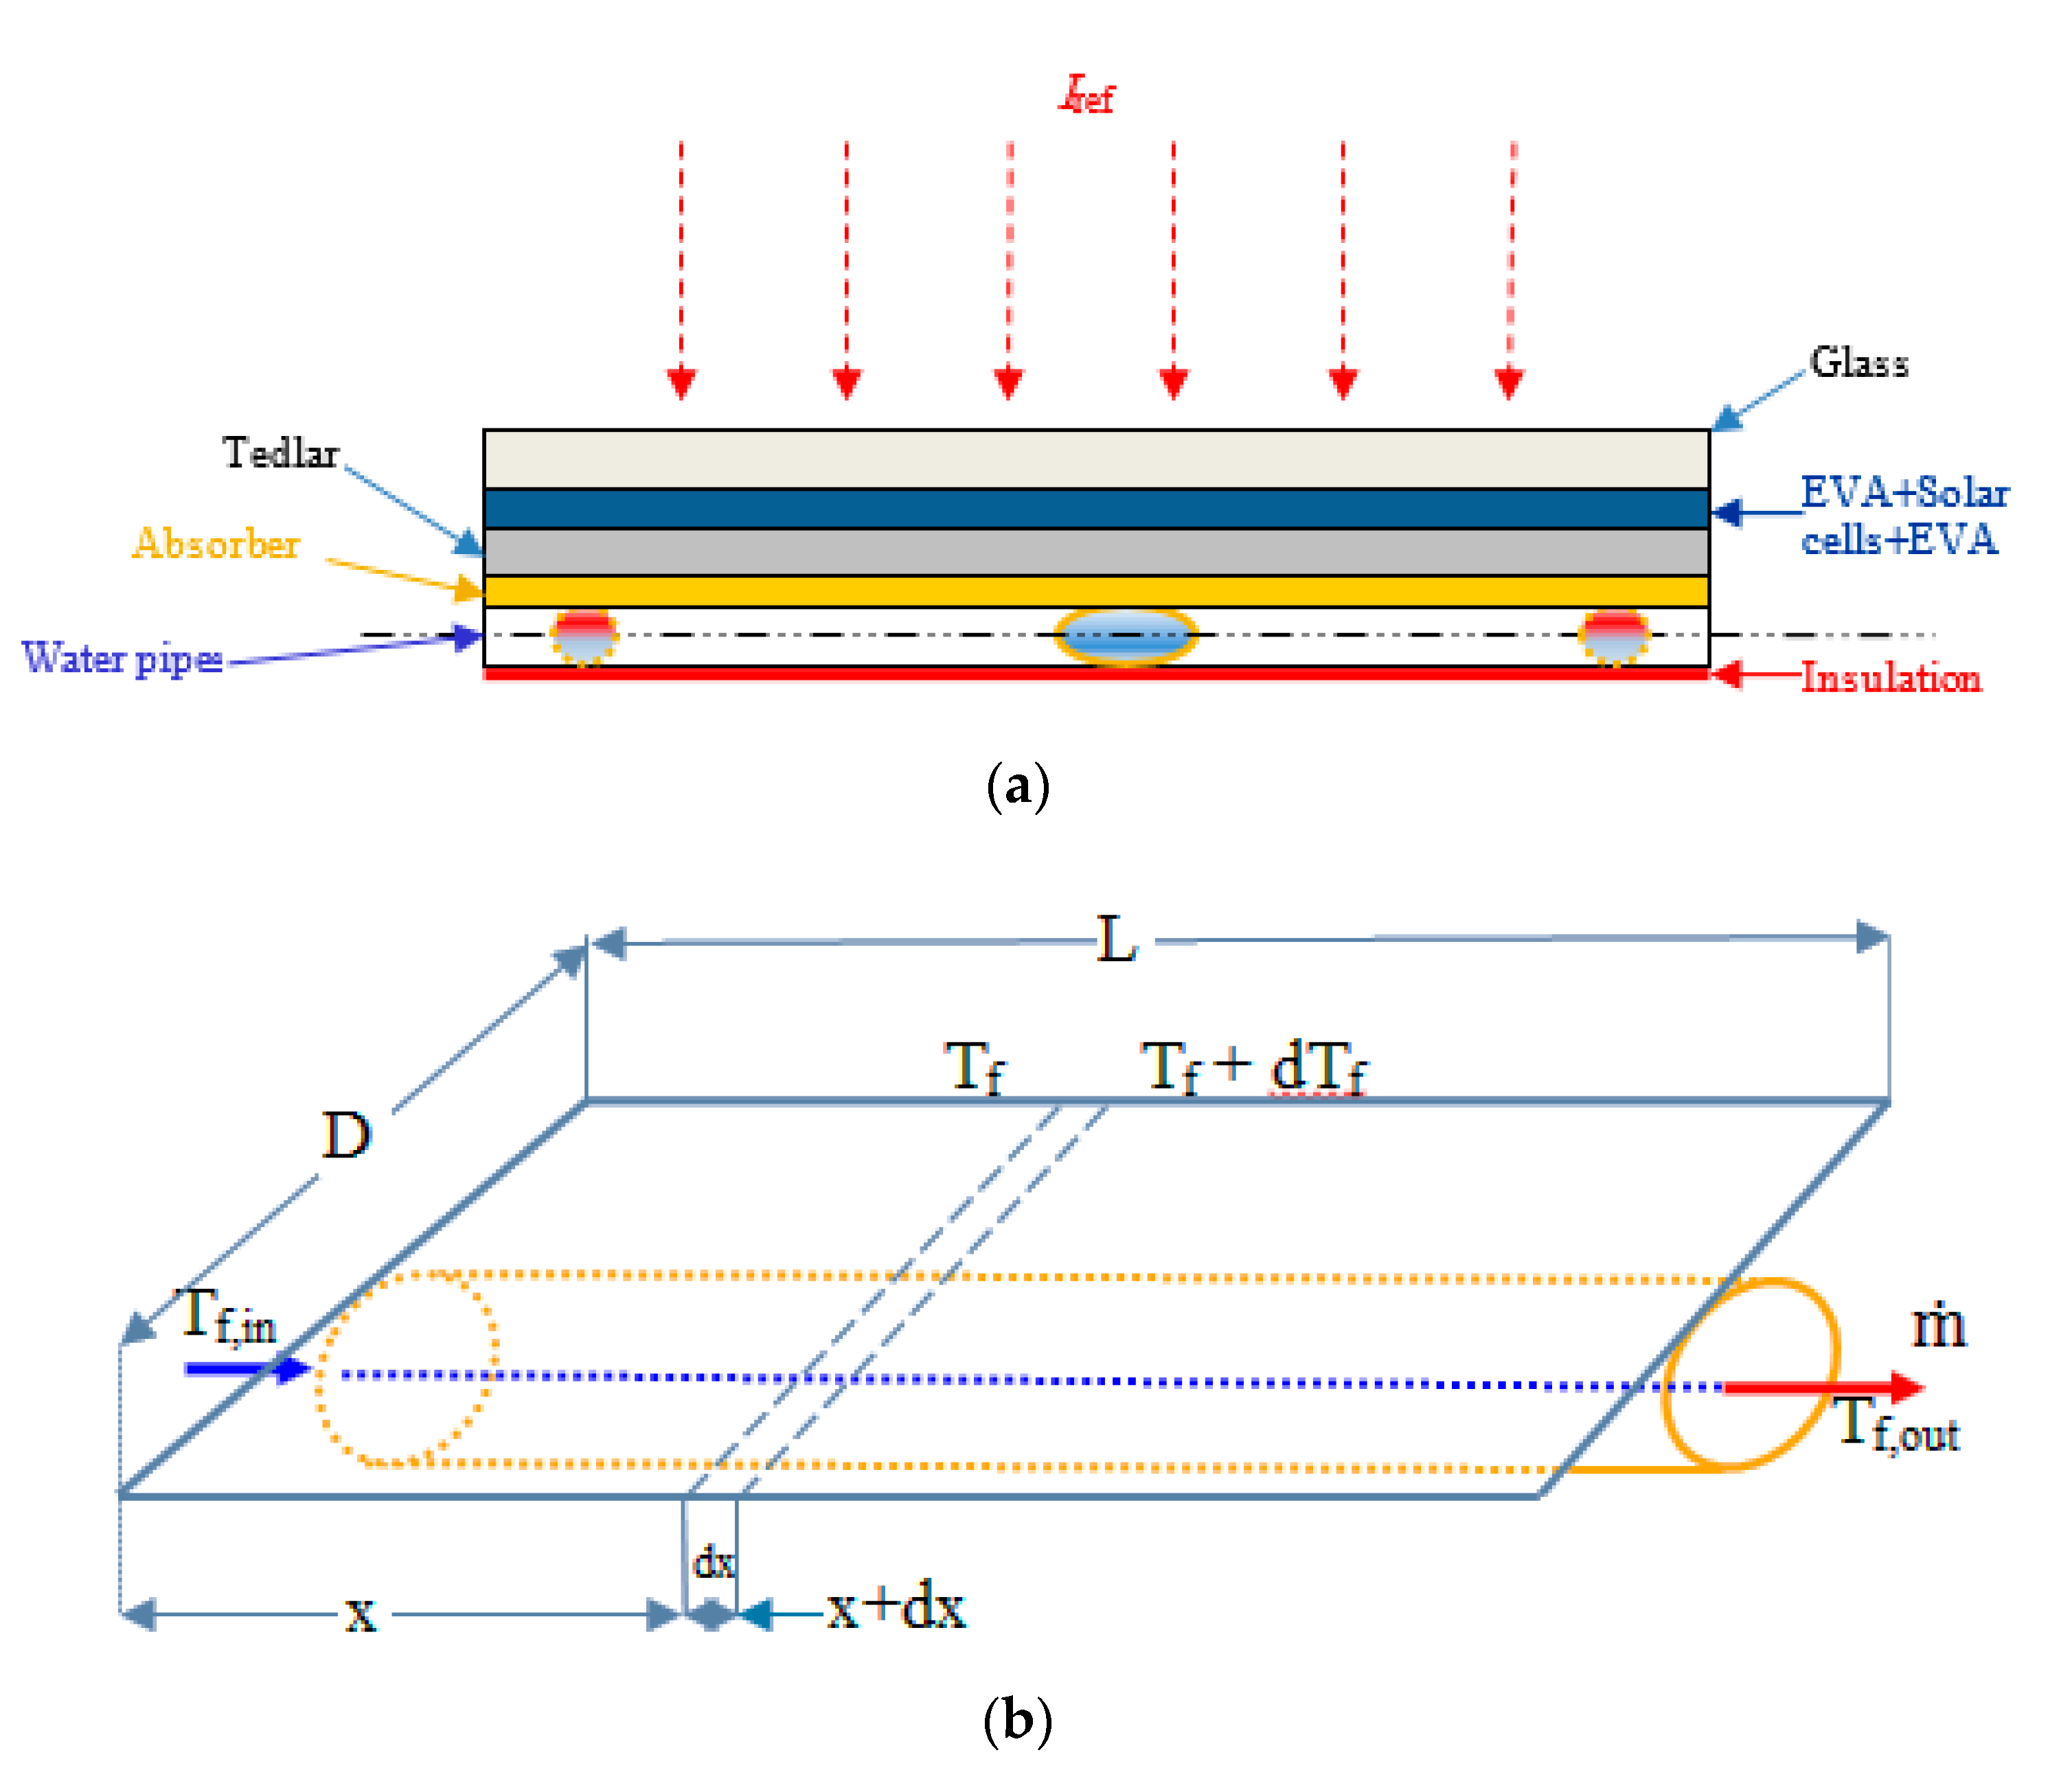
A solar CPV/thermal (CPV/T) with an LFRM concentrator was proposed for the completion of this research gap and the creation of a high solar concentration uniformity CPV/T system. The design theory of the proposed system is provided. It consists of different widths of flat mirrors and can give solar cells a high solar concentration uniformity. To carry out investigations on the actual solar concentrate properties and electric and thermal features of the proposed CPV/T device, a small-scale prototype was produced. The simulation and optical study of the solar CPV/T concentration system with the LFRM concentrator were also performed.
The remainder of the paper is organized as follows. 
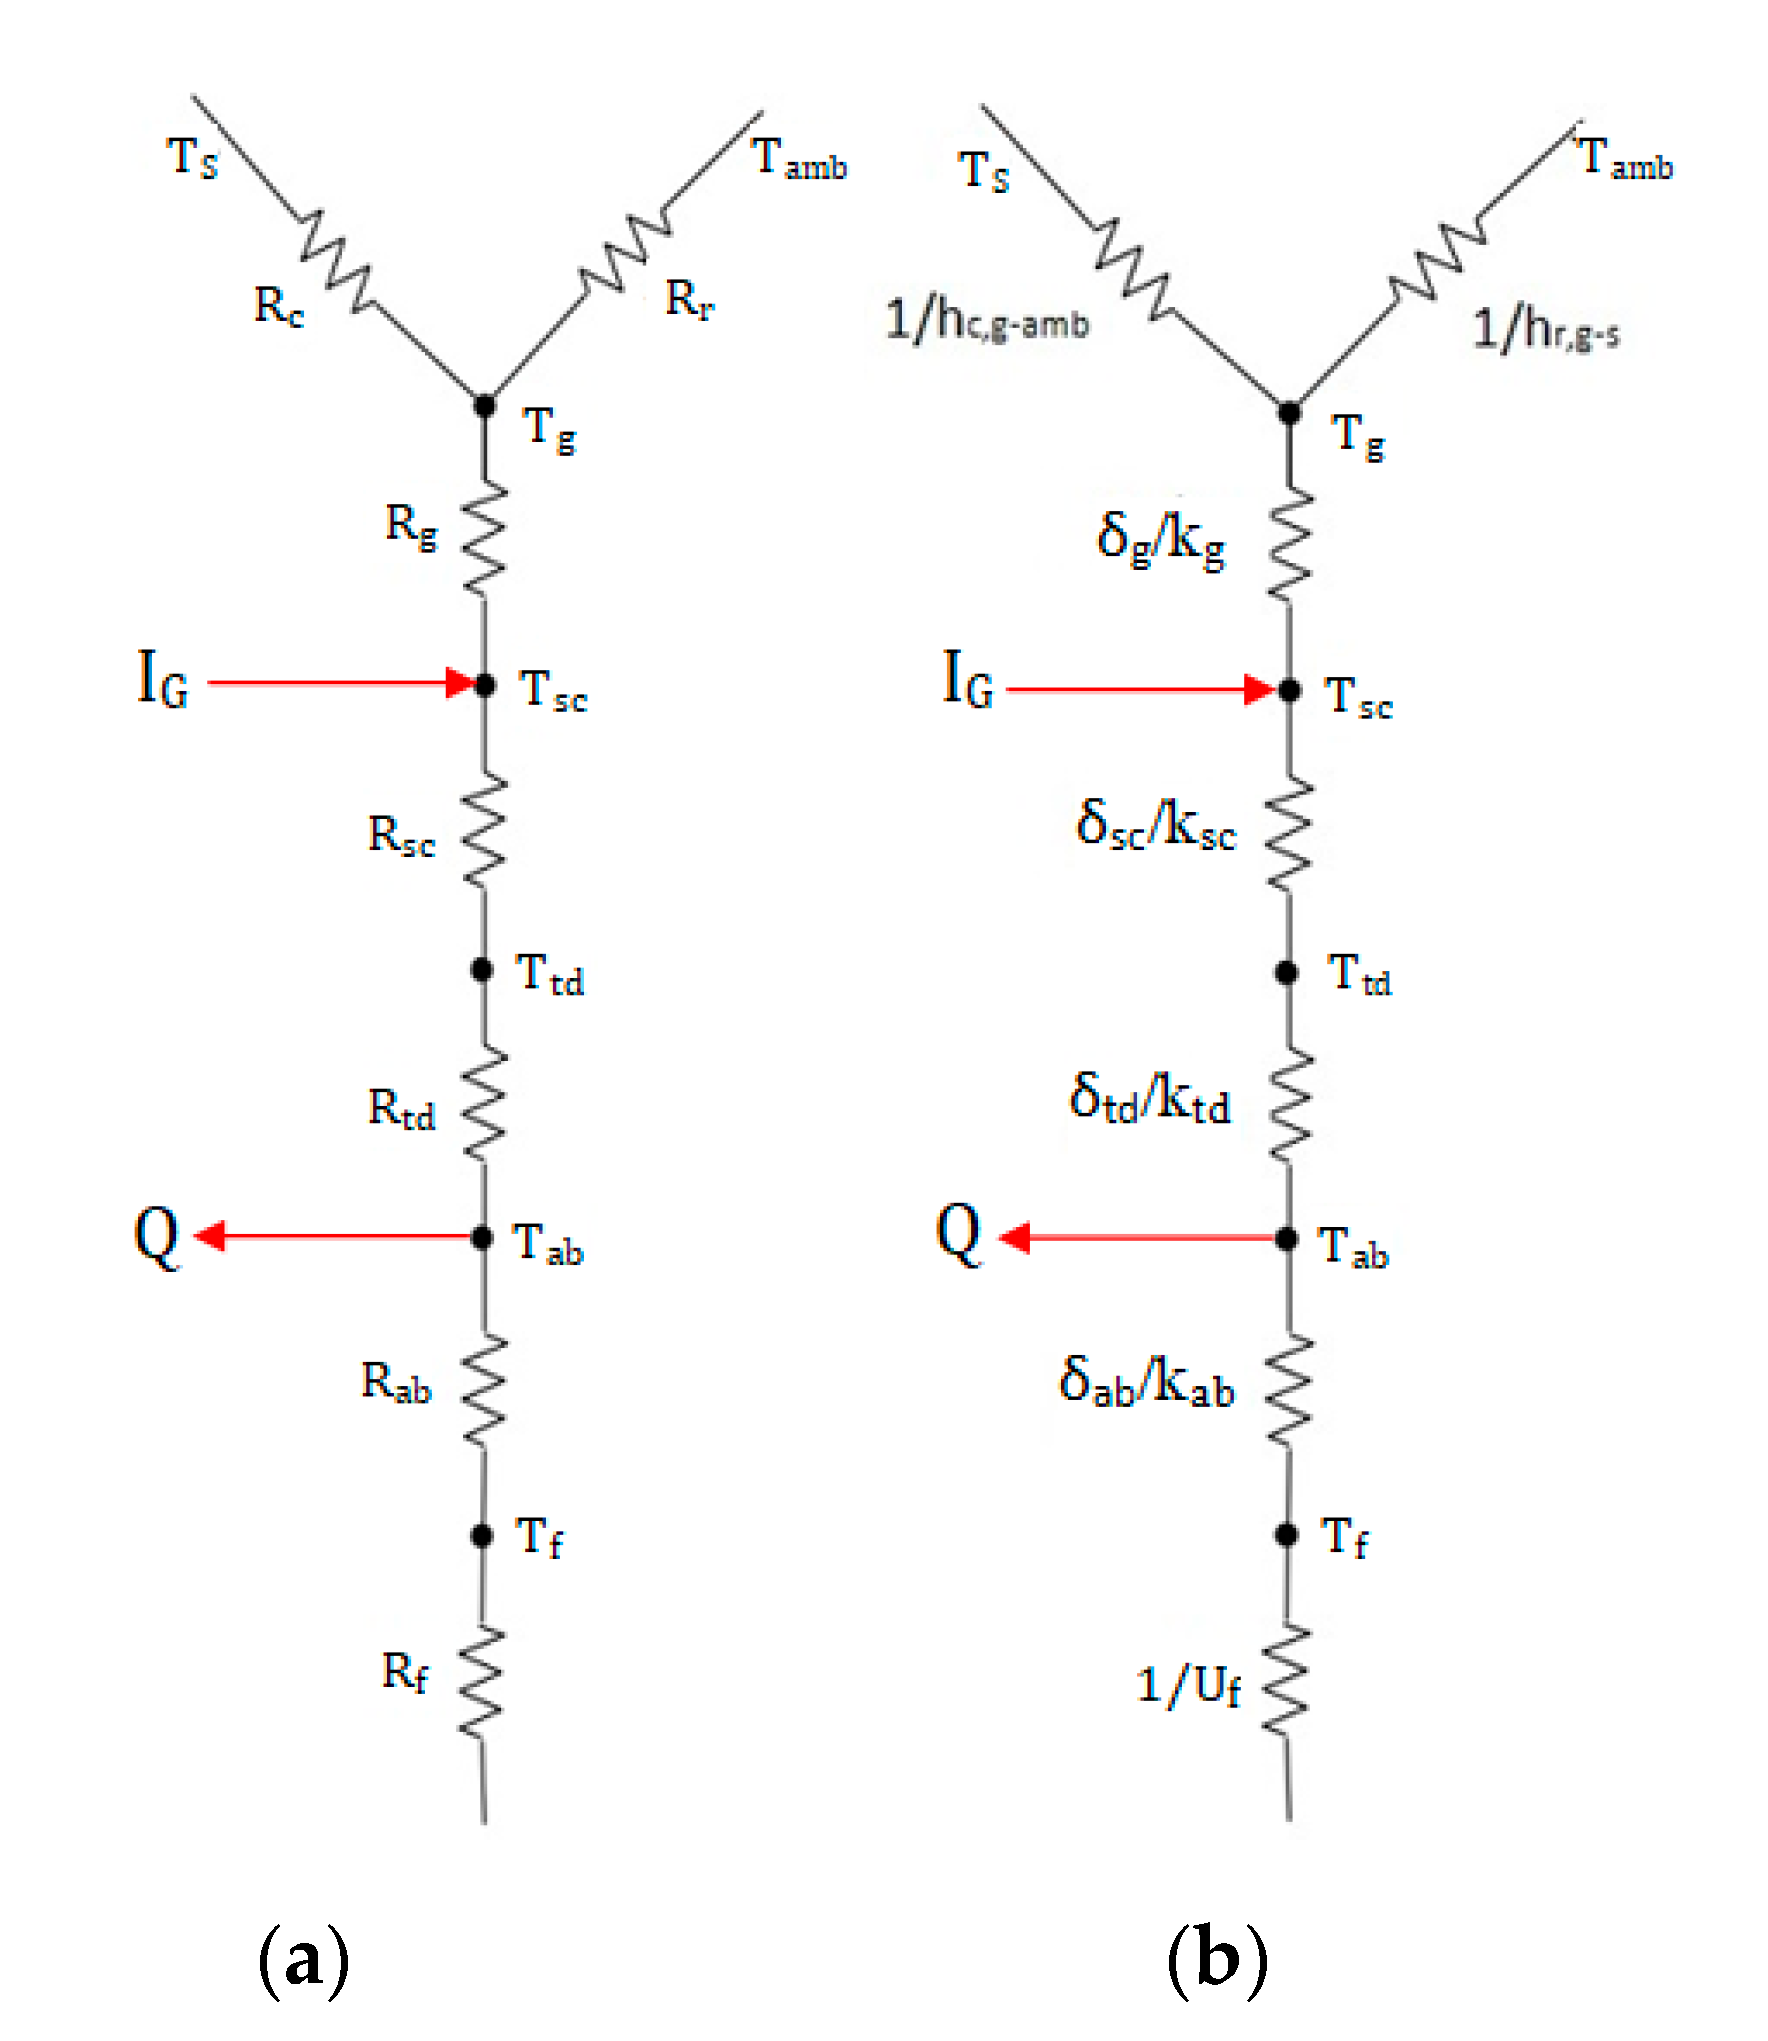
Section 2 presents the design theory and energy conversion equations for the proposed concentrating system with a vertical PV/T receiver. The contents of the experimental prototype are listed in Section 3. Section 4 presents the results and discussions of solar concentrating performance research, performance analytics, electric and thermal power, and testing validation. Finally, the main findings are concluded and highlighted in Section 5.

2. Theoretical Modeling

Based on all the above studies and research to obtain the performance of a concentrating system with a vertical PV/T receiver, that is easy to install and maintain, that produces more power than the normal systems (horizontal receiver), and that uses relatively cheap and available materials, the mathematical design model of a solar concentrating system, as well as the vertical PV/T receiver collector, respectively, are presented in the next sections.

2.1. Solar Concentrating System (SCS)

Solar energy is the most widespread and available. It is a clean source of energy, and since the solar irradiation intensity is only 500–1000 W/m2 [12], the solar concentrating system (SCS) is needed to make greater use of solar radiation. In this research, linear Fresnel reflector mirrors were chosen to be the mechanism of concentrating solar radiation, as shown in Figure 1a. The system shown in Figure 1a can be used as a domestic appliance to produce the electric and thermal energy needed. The system is established to be carried and easy to store and transmitted, with dimensions of 1.1 × 1.5 m. The LFRM concentrator system (Figure 1a,b) design equations are shown and presented in Equations (1) to (7).
The horizontal distance (X1) from the receiver to the 1st mirror is obtained from Equation (1):
X 1 = w 2 + y t a n ξ 0
where w is the width of the receiver, y is the distance from the base frame to the center of the receiver, and ξ0 is the half-angle subtended by the sun and equal to 0.27° [27].
While the horizontal distances from the receiver to the rest of mirrors are calculated from Equation (2):
X n = X n 1 + W n 1 c o s α n 1 + S n
The mirrors inclination angle αn is calculated form the presented Equation (3) as:
tan ( 2 α n ) = [ ( X n y w 2 ) ξ 0 ]
The width of each mirror (Wn) can be calculated from Equation (4):
W n = [ w s i n ( 2 α n ξ 0 ) s i n ( 2 α n + ξ 0 ) ] X n s i n   2 ξ 0 s i n ( 2 α n + ξ 0 ) c o s ( α n ξ 0 )
The Equation (5) was used to calculate the spacing between each mirror (Sn) to avoid the shading and blocking effects of the next mirror on the previous one:
S n = ( X n 1 + W n 1 cos α n 1 ) W n 1 sin α n 1 y ( W n 1 sin α n 1 ) w / 2
The reflected radiation Irefl reaching the receiver is given by the Equation (6):
I r e f l = I T . C R . ρ m
where IT is the total incident solar irradiation intensity (W/m2), CR is the concentration ratio (-), which is calculated as in Equation (7) and ρm is the mirror reflectivity:
C R = A m A r = 1 n W n cos α n w
where Am is the total mirror project area (m2) and Ar is the receiver area (m2).
The length of the receiver is the same length as the mirror to ensure the coverage of the receiver with the incidence of solar irradiation from the mirrors.
The sub-model of the concentrating system which uses LFRM is calculated from Equations (1) to (7) by MATLAB with initial value W0 = S1 = 0, α0 = 0 and X1 = X0.
The calculated parameters of the mirrors as the length, width, tilted angles, and distance between the mirrors are presented in Table 1, which depend on the receiver width and its distance from the mirrors.

2.2. Incident Solar Radiation to the Mirrors

The first step in calculating the useful energy from PV/T is to calculate the amount of solar radiation reaching the surface of the earth, whether direct, diffuse, or ground, and then exploit it to obtain the largest possible amount of thermal and electrical energy. Equations (8)–(11), calculates the direct beam incident on the mirrors and incident angles of radiation falling on a tilted base of mirrors. Figure 2 shows the angle of solar radiation falling on the tilted base of mirrors, and the important angles used to calculate the amount of solar irradiation incidence on the base of mirrors.
The direct radiation incident on the surface base is calculated as:
I b β = I b h ( c o s α s c o s α cos β + s i n α s s i n β )
where I is the direct radiation incident on the surface base (W/m2), Ibh is the direct beam radiation on a horizontal plane (W/m2), αs is the altitude of the sun from horizontal, α is the angle between surface base normal and solar beam azimuth which is equal to the angle between the solar beam and the longitude meridian (γs) minus the angle between the normal to the surface base and the local longitude meridian (γ), Figure 2 shows (γ-(-γs)), and β is the surface base angle from vertical. Equations (9) and (10) are used to calculate αs and γs [9]:
α s = s i n 1 ( c o s ϕ cos ω c o s δ + s i n ϕ s i n δ )
where ϕ, ω, and δ is the longitude, solar hour, and declination angles, respectively.
γ s = c o s 1 ( s i n ϕ c o s ω c o s δ c o s ϕ s i n δ c o s α s )
δ = δ o . s i n ( 360 ( 284 + n ) 365 )
where n is the day of the year and δ o = 23.45 o .

2.3. Solar Radiation Incident to the Receiver

Once the irradiance is calculated, electrical and thermal yields can be determined. The total solar radiation absorbed by the receiver of CPV/T system I’T is equal to the sum of direct radiation on the PV surface I’b, the sky-diffuse radiation I’d, the ground reflected radiation I’gr, and the radiation reflected from the mirrors I’refl [28].
The total incident solar radiation intensity reaching the receiver is calculated from Equation (12):
I T = I b + I d + I g r + I r e f l
where I’b is the beam absorbed radiation by the receiver and is obtained by:
  I   b = ( I T cos ( α s + β 1 ) ) ( τ α ) b  
where β1 is the base frame angle from horizontal and (τα)b is effective transmittance–absorptance product of cover for beam radiation (-).
The diffuse absorbed radiation by the receiver is calculated as:
  I   d = I d ( 1 + cos ( 270 + β 1 ) 2 ) ( τ α ) d  
The ground radiation absorbed by the receiver presented by:
I g r = ρ g r I o ( 1 c o s ( 270 + β 1 ) 2 ) ( τ α ) g r  
The reflect radiation absorbed by the receiver:
I r e f l = ρ m I T s i n ( x ) s i n ( α s + α m ) ( τ α ) b
where x is the reflected radiation angle from the receiver in the right side, and αm is the mirror angle from horizontal.

2.4. Thermal and Electric Model

The modeling analysis is based on some assumptions to obtain the energy balance of different components of PV/T water collector receiver as (1) the system is in a steady-state condition; (2) the temperature variation along the thickness is negligible; (3) the heat capacities of solar cell material, tedlar, and insulation have been neglected; and (4) the water flow through a water pipe is uniform.
Figure 3 illustrates receiver components and the length of the absorber element (dx) connected with the coolant water pipe, respectively. Figure 4 shows the equivalent thermal resistance circuit applied to the system. These resistances are calculated and used to obtain the thermal parameters and to find the PV/T water collector efficiency.
Where EVA (Ethylene Vinyl Acetate) denotes Ethylene Vinyl Acetate
Referring to Figure 4, the energy balance equations for each component of the PV/T receiver, taking into consideration the glass-tedlar component, is given as:
τ g [ α s c β s c I G + α t d ( 1 β s c ) I G ] · w · d x = [ U s c a m b )   ( T s c T a m b ) + U s c t d ( T s c T t d ) ] · w · d x + τ g β s c η e l I G · w · d x
where βsc is the packing factor (the fraction of tedlar plate area covered by the solar cells), IG is the solar intensified radiation on the receiver (W/m2), τg is the glass transmissivity (-), αsc is the solar cell absorptivity (-), αtd is the tedlar absorptivity (-), and w is the absorber width (m).
Finally, the calculated solar cell temperature as a function of back surface (absorber) temperature is deduced as:
T s c = [ ( τ α ) e f f I G + U s c a m b T a m b + U s c t d T t d ] / ( U s c t d + U s c a m b )
The outlet cooling water temperature and amount of useful heat transferred to the heat removal agent, water, are both found from Equations (19) and (20) [29]:
T w , o u t = ( T a m b + h p 1 h p 2 · [ ( τ α ) e f f I G ] U L ) ( 1 exp ( F U L · ( w · L ) · C p ) ) + T w , i n . exp ( F U L · ( w · L ) · C p )
Q u = C p ( T w , o u t T w , i n ) = C p U L [ 1 e x p ( F · U L · w · L C p ) ] [ h p 1 h p 2 ( α τ ) e f f I G U L ( T w , i n T a m b ) ]
where Tw,out is the water outlet temperature (K), Tw,in is the water inlet temperature (K), L is the absorber length (m), is the mass flow rate of water (kg/s), and CP is the specific heat capacity of water (kJ/kg.K), then:
Q u = F R · ( L · w ) [ h p 1 h p 2 · [ ( τ α ) e f f I G ] U L ( T w , i n T a m b ) ]
where FR is the heat removal efficiency factor and obtained from:
F R = C p U L · ( L · w ) [ 1 e x p ( F U L · ( L · w ) C p ) ]
The thermal efficiency is found as:
η t h = Q u [ I G · A ] = Q u [ I G ( L · w ) ] = F R I G [ h p 1 h p 2 · [ ( τ α ) e f f I G ] U L ( T w , i n T a m b ) ] = F R [ h p 1 h p 2 ( τ α ) e f f ( U L / I G ) ( T w , i n T a m b ) ]
The electrical efficiency of a PV module, ηel has been calculated from the following Equation (24) [18]:
η e l e = η e l e , r e f [ 1 μ s c ( T s c T r e f ) ]
where ηel,ref is a reference efficiency of solar cell at solar irradiance 1000 W/m2, µsc is the percentage of electrical loss per temperature degree (µsc = 0.0045) and temperature Tref = 25 °C.
The PV module performance, the maximum power point, is dependent on the temperature of the PV module. Electrical power Pele is an important parameter and is given in Equation (25):
P e l e = η e l e I T A P V
The combined PV/T efficiency of the system is the sum of photovoltaic and thermal efficiencies of the system as [18]:
η o v e r a l l = η t h + η e l
where ηoverall is the overall efficiency of the combined PV/T system.

3. Experimental Setup

The experimental setup was situated on the roof of Al-Hussein Bin Talal University’s Faculty of Engineering. The system comprised of two PV modules with the same characteristics (Figure 5c), each connected to a varying load. The characteristics of photovoltaic modules that were utilized in the experimental work are shown in Table 2. The system base is E–W horizontal axis and a seasonally tracking (N–S) system was considered. The CPV/T system and PV/T module, as a reference module, had slope angle set to 27°, and the system azimuth was 0° directed towards the south.
It was proposed to study the overall efficiency of the system shown in Figure 5, which consists of a mono-crystalline PV module mounted vertically on a base frame and subjected to solar concentration by flat mirrors. The PV module was cooled by water passing through copper pipes attached to the back surface of the module. The system will be analyzed in two parts: the first part highlights the solar concentration system and the equipment used for this purpose, which were LFRMs, and then calculates the reflective solar radiation of these mirrors. The second part will focus on the receiver, its parts, and the calculation of solar radiation reaching it from the mirrors.
The electrical parameters (current and voltage) were measured by IDM (Intelligent Digital Multimeter). The characteristics of multimeters that were used in the present work are listed in Table A1 in Appendix A.
The irradiance meter, which was used in the experiment with daily uncertainty < 3%, was positioned beside the module (reference module) with the same inclination. The meter device measures the effective solar irradiance and ambient temperature. The specification of the solar irradiance meter is illustrated in Table A2 in Appendix A. The wind velocity was measured by anemometer with an accuracy of 3% (± 0.2 ms−1).

4. Results and Discussion

4.1. Theoretical Results

The performance of the PV system was studied when changing the amount of solar irradiation from 200–1000 W/m2 and changing the amount of cooling water flow from 0.1–1 kg/min at different solar concentration ratio. In this study, the average wind speed was 2 m/s, and the temperature of the cooling water inside was 293 K.
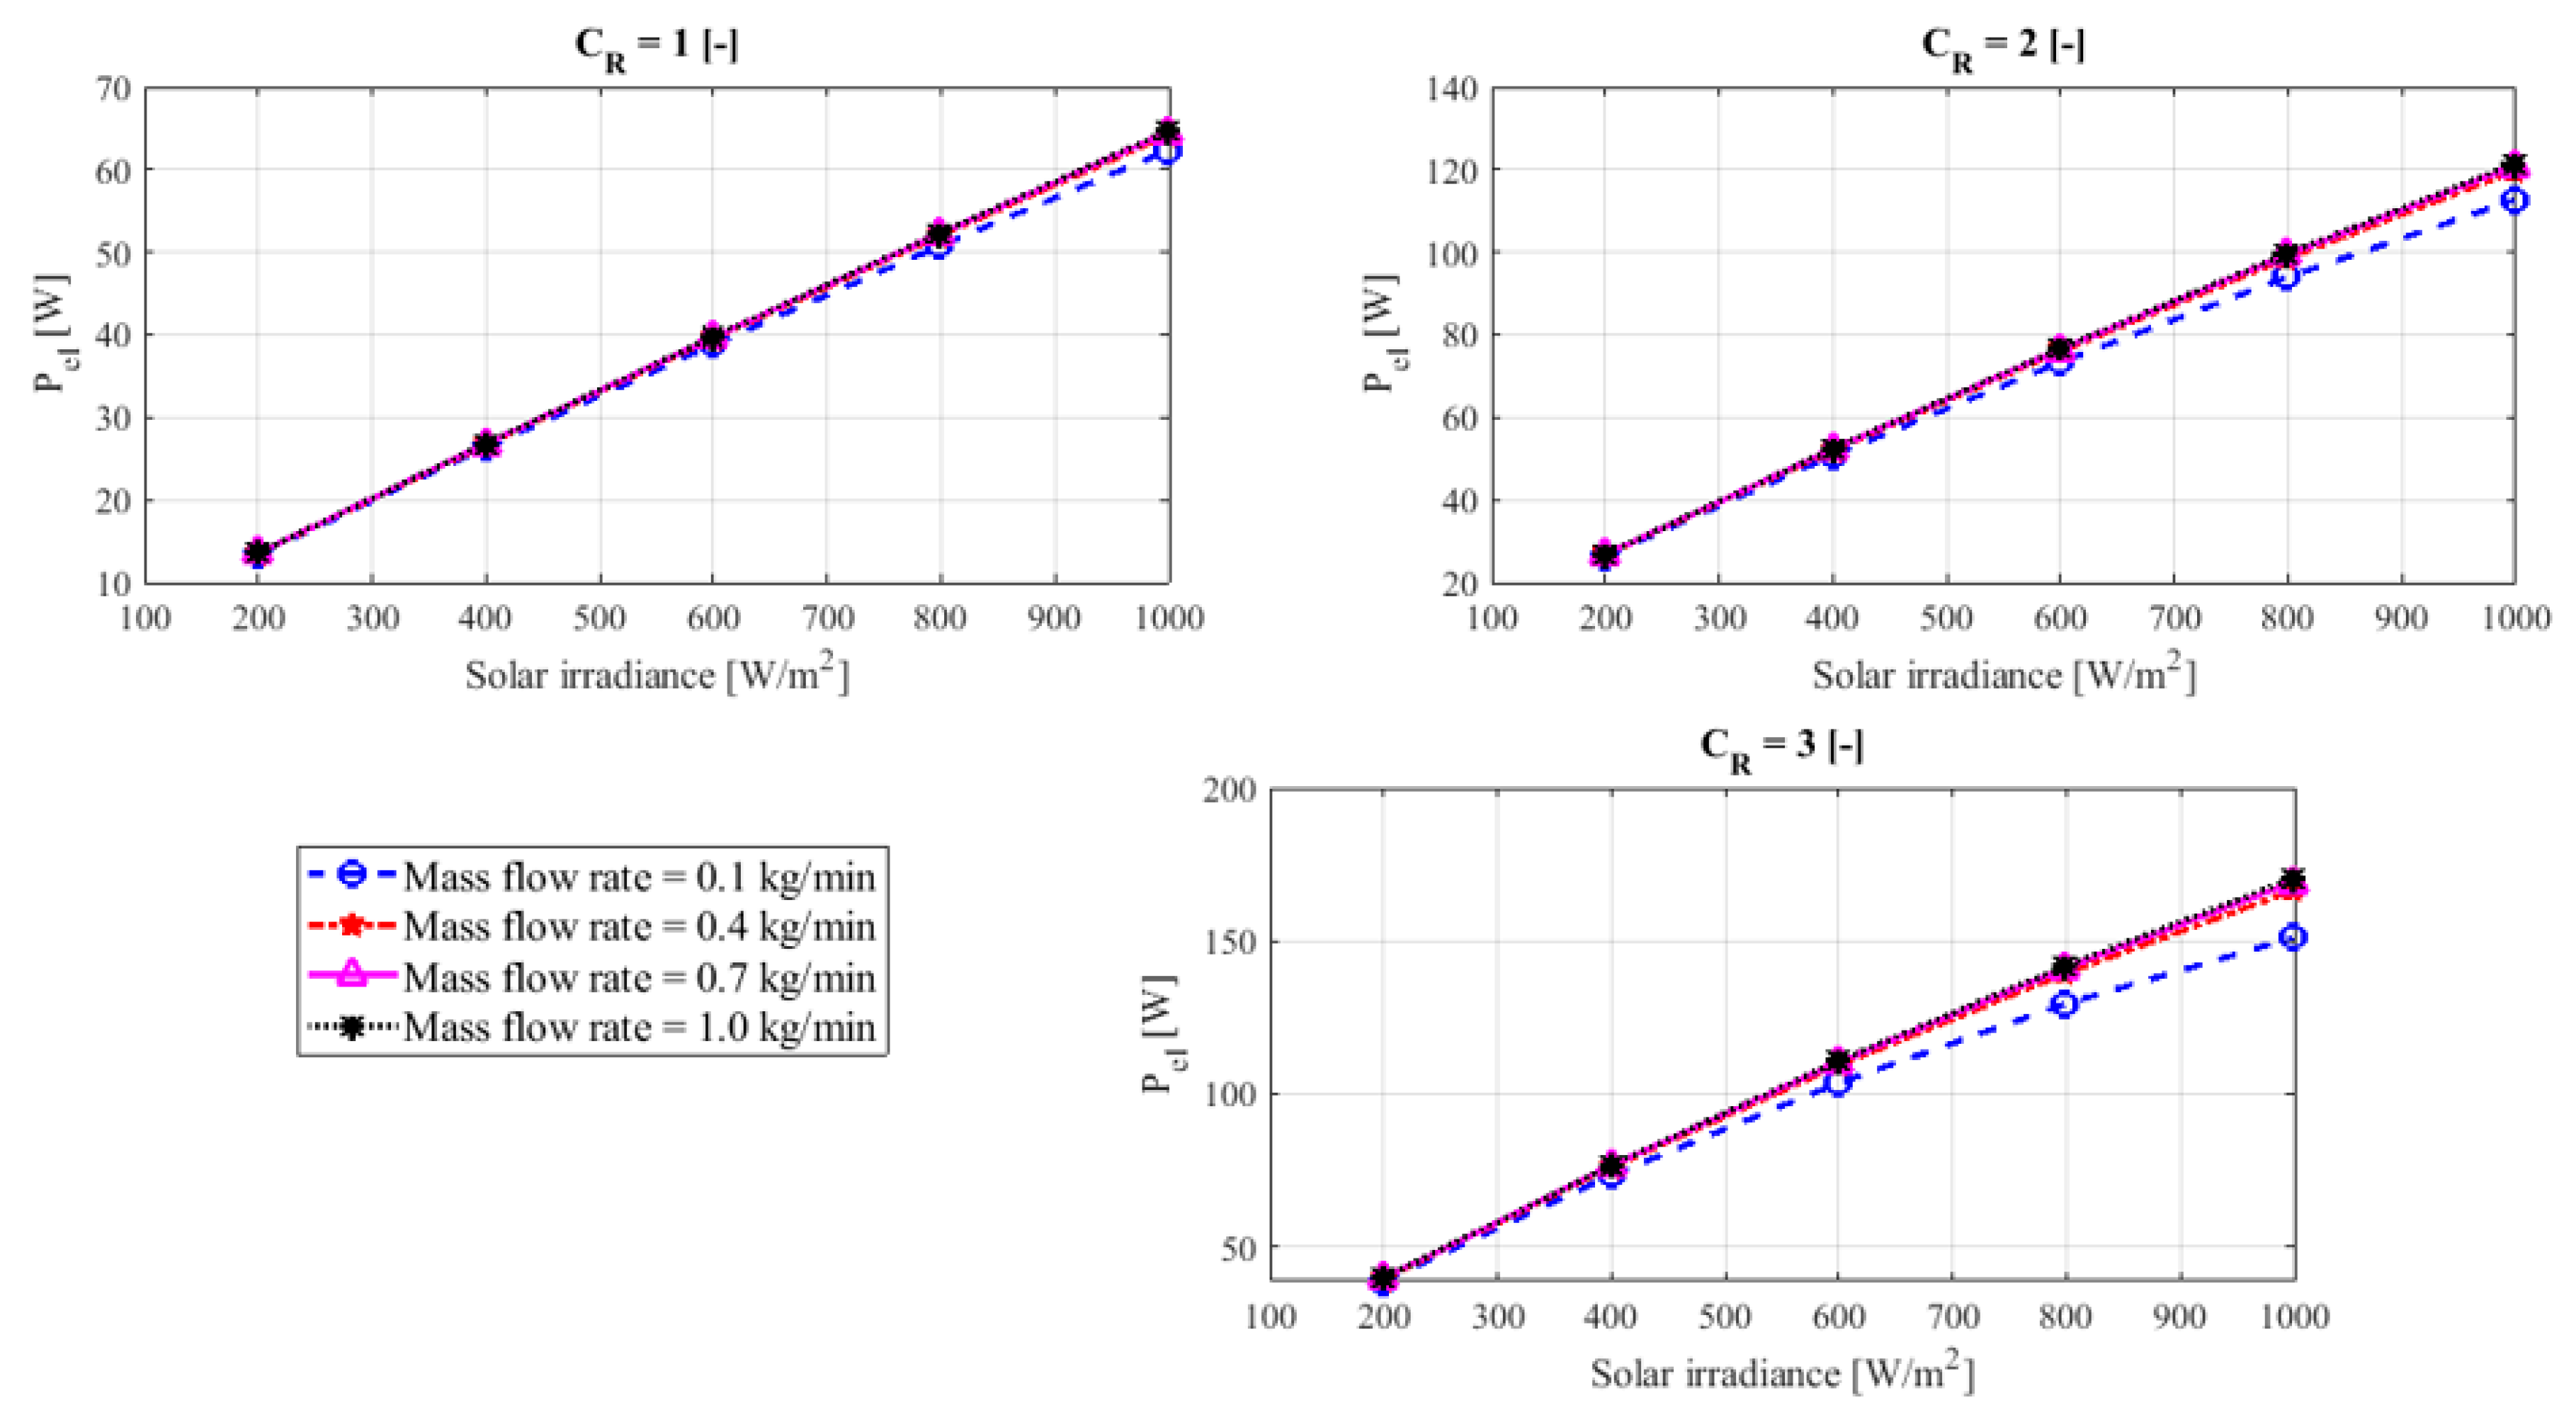
The electrical energy of this system under the influence of solar concentration ratio from 1–3 is shown in Figure 6. The amount of electrical and thermal energy produced from the system increased with increasing solar concentration and the amount of radiation falling. Where the maximum electric power produced increased from 65 W at a solar concentration ratio 1 to 170 W at the solar concentration ratio 3. Also, the figure showed that the highest amount of energy produced at the highest flow rate of 1 kg/min under different concentration ratio.
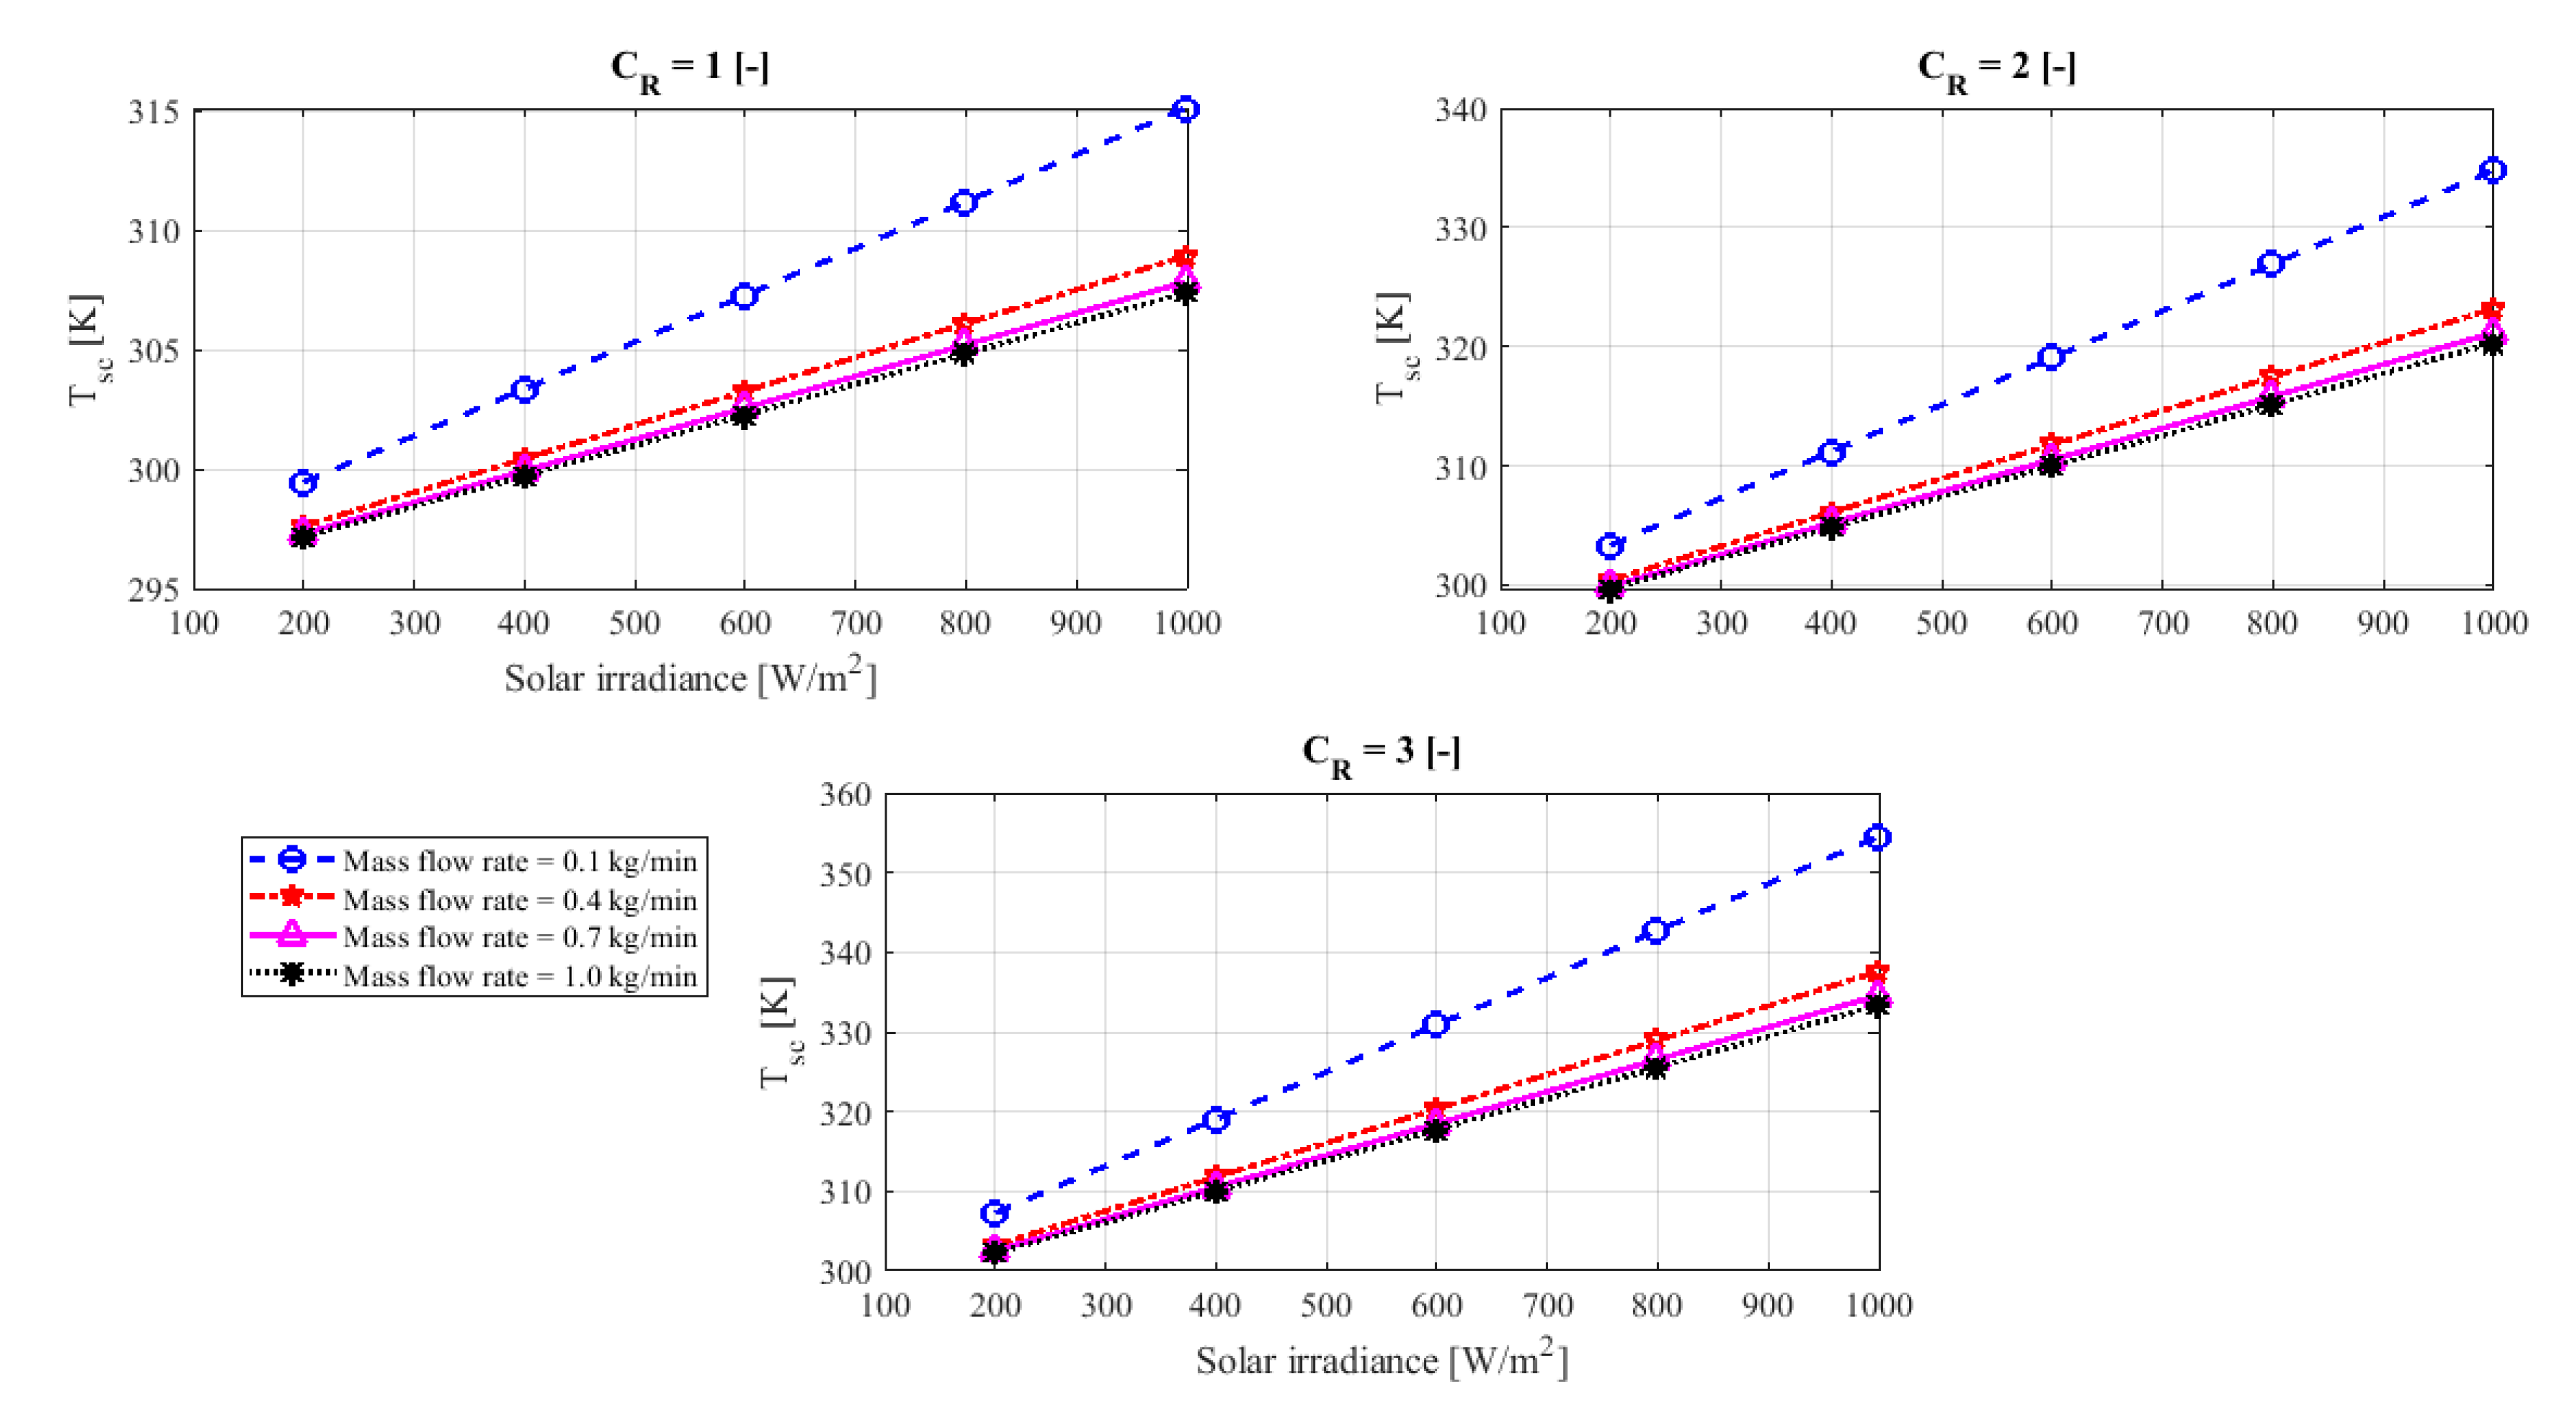
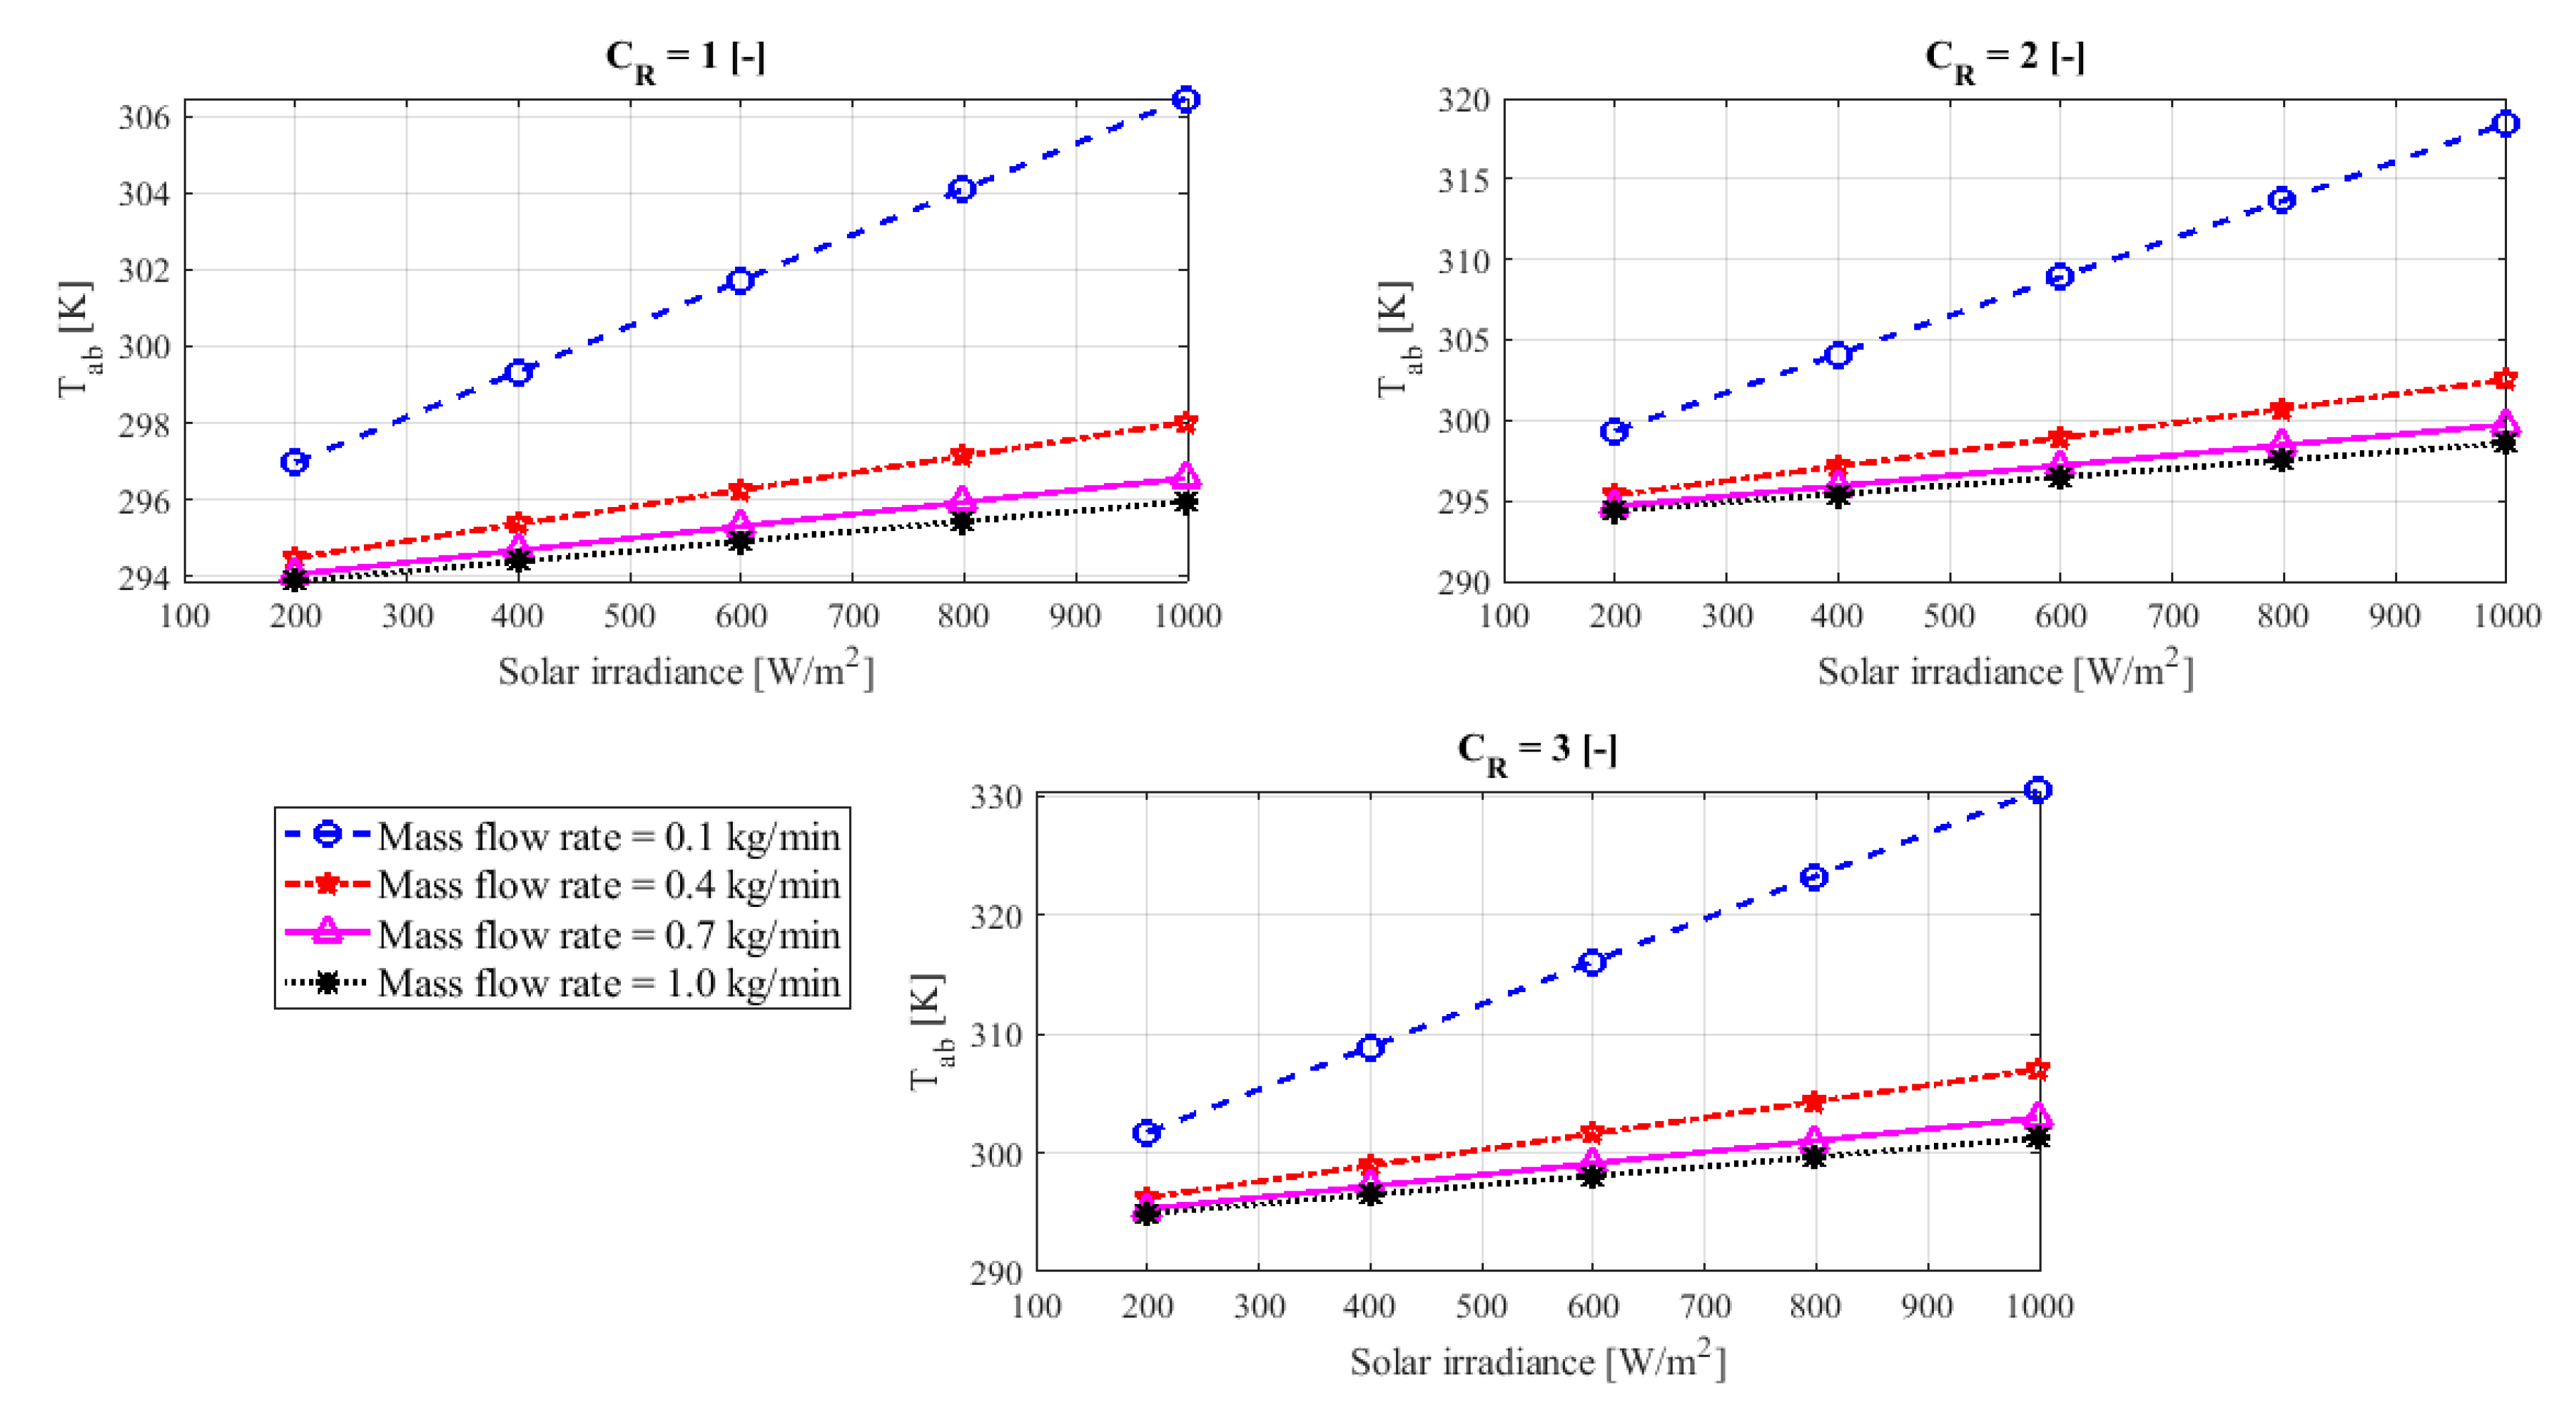
Figure 7 and Figure 8 show the change in the temperature of the solar cells and the temperature of the heat absorber, respectively, with the change in solar radiation and the solar concentration ratio. The change in the temperature of the solar cells was linked to the change in the temperature of the heat absorber. They increased together with the increase in the amount of solar radiation and solar concentration ratio and decrease together with their decrease.
The cooling of the PV module, as presented, reduced the temperature of the solar cells and the absorber. It was observed that the lower the flow, the higher the temperature of the solar cells, and the absorber plate. The temperature of the solar cells reached to 355 K and the absorber plate temperature was 330 K at the same operational conditions when the solar concentration ratio was 3, the cooling water flow rate was 0.1 kg/min, and at solar irradiance 1000 W/m2. Whereas, the PV cell temperature and absorber temperature were reduced to 333 K and 302 K, respectively, when the cooling flow rate increased to 1 kg/min.
The electrical efficiency of the system under the same operating conditions is presented in Figure 9. It shows that solar radiation negatively affects electrical efficiency. Since the solar concentration rate reflects the amount of solar radiation falling on the surface, increasing the solar concentration rate also adversely affected the electrical efficiency of the solar system.
It is also evident in Figure 9 that the electrical efficiency may decrease from 13.9% at the concentration ratio 1 and the amount of flow 0.1 kg/min to 11.2% at the same solar irradiation 1000 W/m2 and concentration ratio 3. The large decrease in electrical efficiency can be reduced by increasing the flow of cooling water, so that the electrical efficiency increases as an example from 11.2% to 13.1% if the amount of flow rate is increased from 0.1 kg/min to 1 kg/min, respectively, at the concentration ratio 3 and solar irradiation 1000 W/m2.
The same impression observed in the electrical efficiency of the system applies to thermal efficiency, as shown in Figure 10. So, increasing concentration ratio and solar radiation reduced thermal efficiency, while increasing the flow rate of cooling water reduced the efficiency deficit. Based on Figure 10, the highest thermal efficiency was 68% at unity concentration ratio, and 200 W/m2 solar irradiation with a flow rate of 1 kg/min and a lower thermal efficiency is 32% at a concentration ratio 3 and 1000 W/m2 solar irradiation with a flow rate of 0.1 kg/min.
Figure 11 shows the relationship of thermal energy with solar radiation under the influence of a variable solar concentration ratio. The results show a significant increase in thermal energy, when the solar concentration ratio and solar radiation increased, as well as increasing the flow rate of cooling water increased the thermal energy produced.
The highest recorded thermal energy quantity was 580 W at solar concentration 3, solar irradiation 1000 W/m2, and flow quantity 1 kg/min, while thermal energy at solar concentration 1 was 210 W, whereas, at solar concentration 2 was 400 W under the same operating conditions.
After studying a set of variables on the performance of the proposed solar system, it was shown that the electrical and thermal efficiencies decreased with increasing solar concentration ratio, solar radiation, and the amount of flow rate of cooling water. In contrast, the electrical and thermal energy, temperature of solar cells, and temperature of heat absorber increased with increasing solar radiation and the solar cells and absorber temperature decreased by increasing the flow rate of cooling water.

4.2. Experimental Results and Validation

The amount of change in PV power and thermal output, with water cooling under a non-concentrated and concentrated system, due to environmental effects, was calculated from the measured electrical parameters of each module. The measurements of the solar irradiance, wind speed, ambient temperatures, inlet water for PV, and exit water temperature from PV in the case of a non-concentrated and concentrated system are presented in Figure 12 for the chosen test day.
Figure 12 illustrates that the maximum and average ambient temperature were found to be 32 °C and 28 °C, respectively. In contrast, the average daily wind velocity was found to be 0.75 m/s. Whereas, the solar irradiance pattern on the high-value experiment day was 900 W/m2. In addition, Figure 12 illustrates the measured input and output temperatures of the module cooling water during the day of the test for both configurations.
Whereas the daytime progresses, the temperature of outlet cooling water increased with increasing the incident solar irradiance, until it achieved its maximum then reduced as the solar irradiation reduced. It is found that the outlet cooling water temperatures for PV/T and CPV/T systems were higher than the inlet cooling water temperatures during the test day with a maximum temperature difference of about 8 °C and 13.5 °C, respectively, under mass flow rate 0.7 kg/min and solar irradiance 900 W/m2.
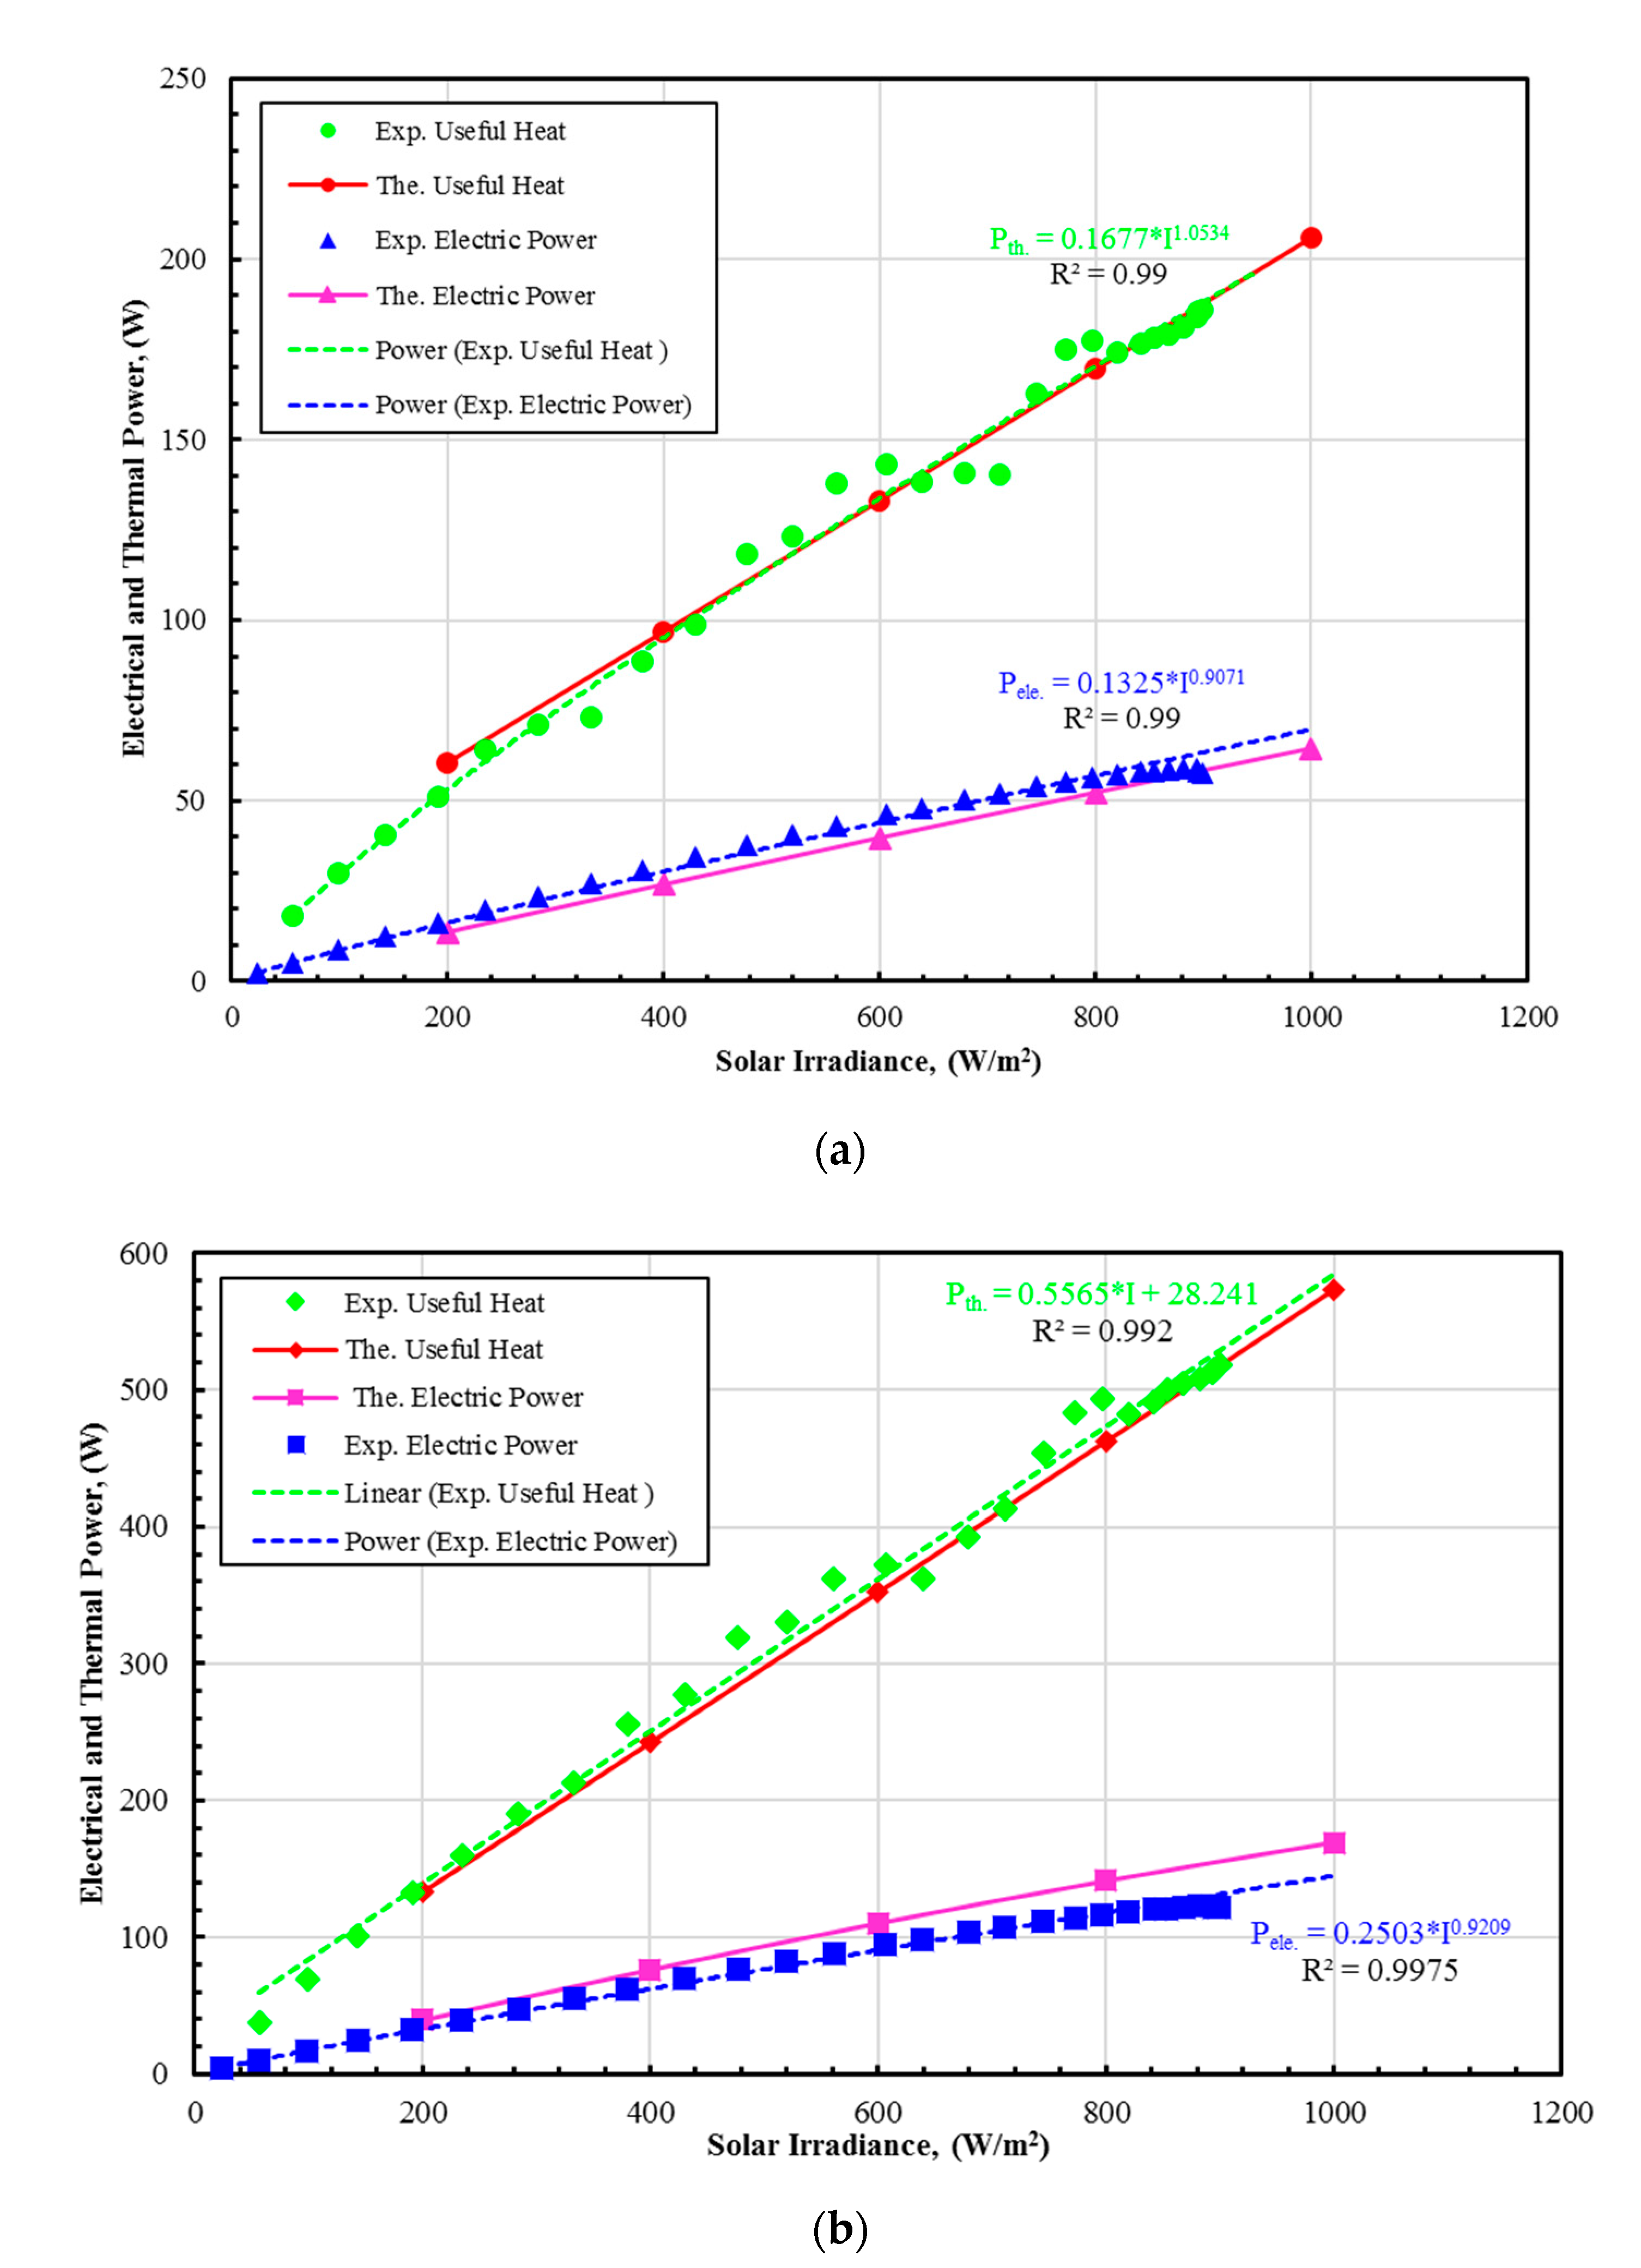
Figure 13 shows the theoretical and experimental validation of electrical and thermal power output for each configuration PV/T and CPV/T under a mass flow rate of cooling water 0.7 kg/min and different solar irradiance.
As illustrated in Figure 13a, the electrical and thermal power outputs from the PV/T module were 60 W and 185 W, respectively, under solar irradiance 900 W/m2. Whereas in Figure 13b, the geometrical concentration ratio was 3, and the produced electrical and thermal power outputs from CPV/T system were 130 W and 525 W, respectively, under 900 W/m2 solar irradiance. The small deviation in electrical power output may be from the coefficient, which was used in the theoretical model or from self-shading of the mirrors image concentrator, and this referred to reduced output power.
The CPV/T system usefulness is that it produced improvements in both electrical and thermal power output, which are suitable for domestic application as a heat pump.
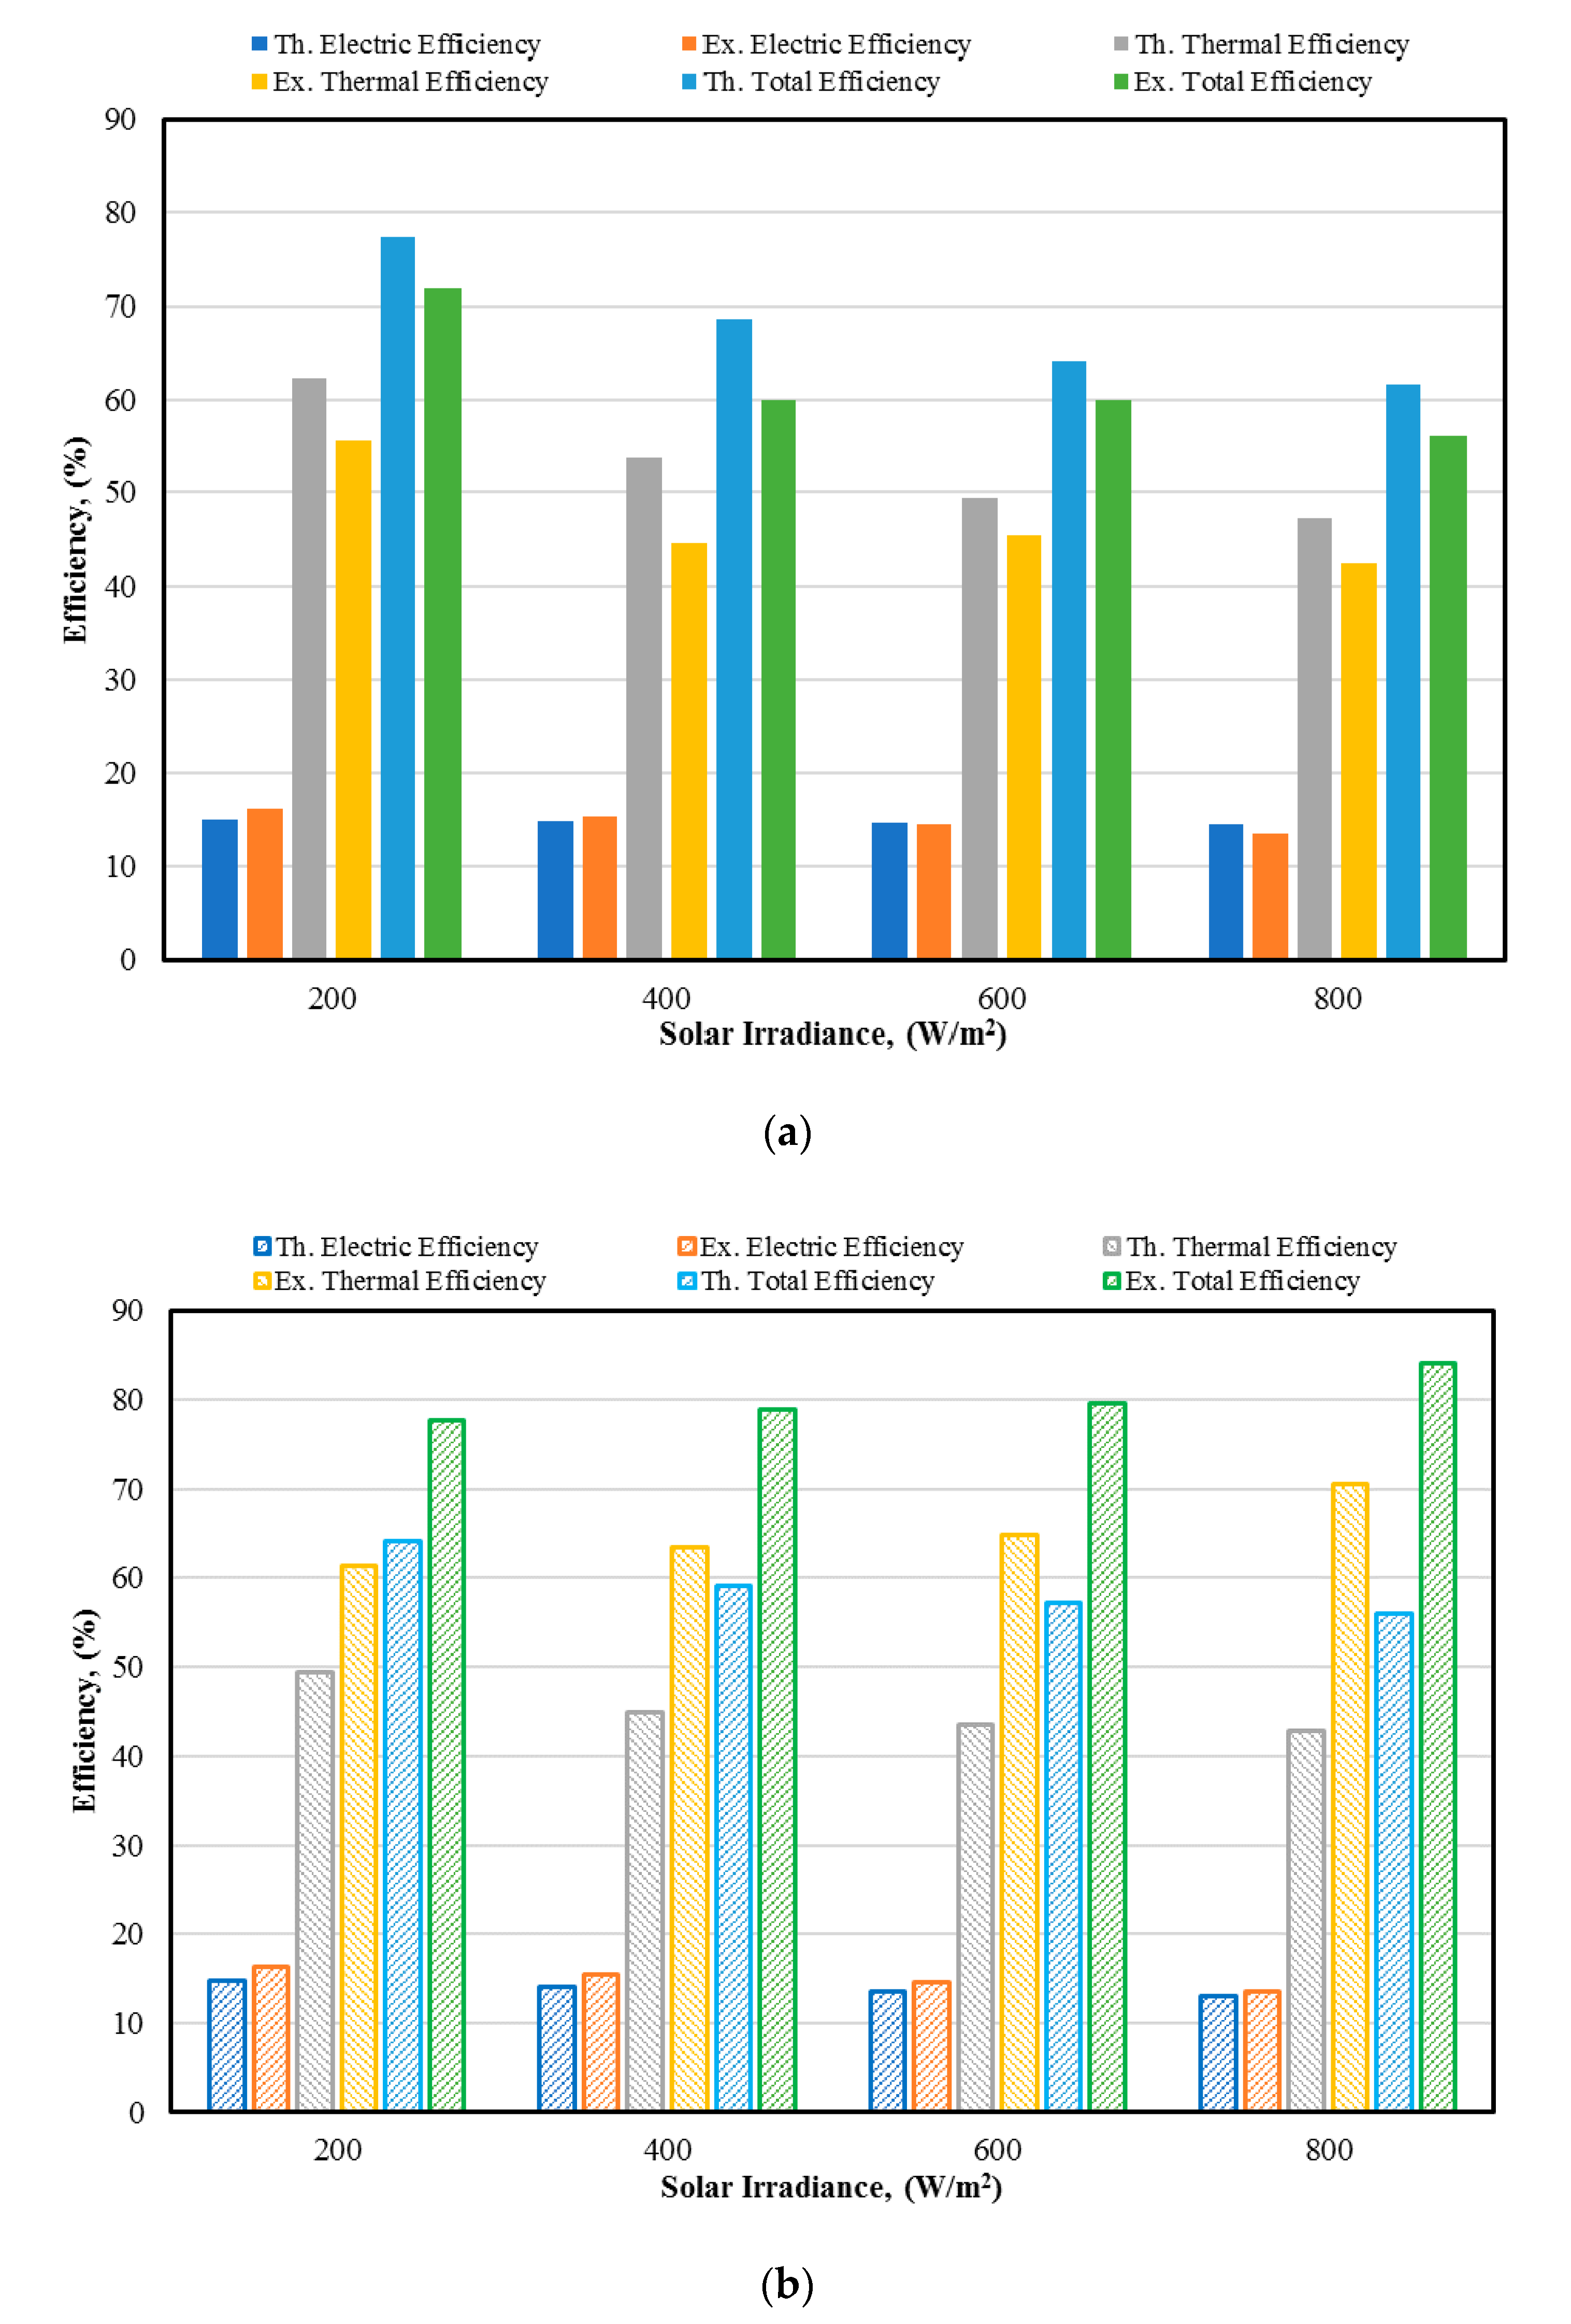
As shown in Figure 13, the total power output of the CPV/T module is, therefore, important to highlight in comparison to PV/T and how this differs in comparison to just a CPV or a flat PV only without cooling.
Here in Figure 14, it can be seen that the CPV/T and PV/T were over 60%, in comparison to the solar photovoltaic modules which typically have almost efficiencies in the range of 15% and the thermal flat plate collectors which have efficiencies in the range of about 40%. Hence, as known, the concentrator offered a significant advantage in terms of utilizing an increase of the incoming solar irradiation and converting it to useful energy.
The presented theoretical model showed the ability to predict parameters of system performance such as solar radiation received, cell and absorber temperatures, outlet cooling water temperature, and module electrical and thermal output power in respect of system input data (wind velocity, environmental temperature, and geometric system). The system output model results were validated by experimental data calculated and estimated for both CPV/T and PV/T on the same input parameters, in order to verify the numerical model.

5. Conclusions

The proposed CPV/T device is generally simple and comfortable. The merit of solar concentrate structural materials is easy to obtain, and the initial costs are not as high in comparison to solar PV cells. In addition, it presents the possibility of using thermal energy produced in domestic applications. It solves the shading issues and blocks of the conventional CPV. In this work, a theoretical and experimental analysis of a CPV/T device was presented.
The theoretical module of the system analysis results found that the maximum electrical and thermal power outputs from PV/T module were 65 W and 170 W, respectively, with cooling water flow of 1 kg/min whereas, the maximum electrical and thermal power obtained from CPV/T system were 170 W and 580 W, respectively, at the solar concentration ratio 3 and cooling water flow rate of 1 kg/min. This amount of electrical and thermal energy was approximately three times the amount produced when using a standard module (PV/T module) without concentration and coolant water flow rate 0.1 kg/min, which was estimated at 61 W and 155 W, respectively. These results showed that increasing the solar concentration, which is a reflection of the increase of solar radiation, increased the electrical and thermal power of the solar cells, as well as the solar cells and the heat absorber temperatures, which negatively affected the electrical and thermal efficiency. Increasing the amount of cooling water through both configurations of CPV/T and PV/T improved the heat recovery from the PV module and thus increases the electrical and thermal efficiency.
The theoretical model was validated by the experimental test, and the results showed a good agreement between them. The experimental results of the electrical and thermal power outputs from PV/T module were 60 W and 185 W, respectively, whereas for CPV/T system under geometrical concentration ratio of 3 are 130 W and 525 W, respectively, at cooling water flow rate of 0.7 kg/min and 900 W/m2 solar irradiance. The total power of the PV/T module was 245 W, and the CPV/T system was 655 W, with power increasing 167%.
The performance and features of the proposed CPV/T system are disclosed by all simulation and analysis results presented in this paper. This can be used as guidance and reference in the further practical applications for the design or production of the proposed CPV/T system. A large-scale testing rig is being developed for further study of the proposed CPV/T device, and research into an LFRM concentrator-driven PV and thermal hybrid system is underway.

Author Contributions

Conceptualization, M.R.G.; Data curation, M.R.G.; Formal analysis, M.A.-D.; Investigation, M.A.-D.; Methodology, A.A.; Software, A.A.; Validation, H.R.; Visualization, H.R.; Writing—original draft, M.R.G. and A.A.; Writing—review & editing, M.A.-D. and H.R. All authors have read and agreed to the published version of the manuscript.

Funding

This research received no external funding.

Acknowledgments

The authors acknowledge the support of King Fahd University of Petroleum & Minerals, Saudi Arabia.

Conflicts of Interest

The authors declare no conflict of interest.

Appendix A

Measurement Device Characteristics
Table A1. Specification of intelligent digital multimeter (multimeter with storage data).
SpecificationsRangeBest Accuracy
Model UT71B
DC Voltage (V)200 mV/2 V/20 V/200 V/1000 V±(0.05% + 5)
DC Current (A)200 μA/2000 μA/20 mA/200 mA/10 A±(0.15% + 20)
Resistance (Ω)200 Ω/2 kΩ/20 kΩ/200 kΩ/2 MΩ/20 MΩ±(0.4% + 20)
Frequency (Hz)20 Hz–200 MHz±(0.1% + 15)
Temperature (°C)−40 °C~1000 °C±(1% + 30)
General Characteristics
Data holdYes
Display Count20,000
Data storageyes (100 to feature 300)
Standard accessoriesBattery, USB interface cable, PC software CD, point contact temperature probe (option)
Table A2. Specifications of irradiance meter device.
ItemInformationItemSpecification
BrandSEAWARDIrradiance Range50–1200 W/m2
Item No.39N146Module Temp. Range0 to 80 °C
Mfr. Model No.SS200RAmbient Temp. Range0 to 70 °C
Power SourceBatteryInclinometer Range0 to 90°
Display LCDAutoInterfaceUSB

References

  1. Rezka, H.; Gomaa, M.R.; Marmoush, M.M.; Shehata, N.; Henry, J. Theoretical and experimental performance investigation of a newly combined TDD and SWH system. Appl. Therm. Eng. 2019, 161, 114156. [Google Scholar] [CrossRef]
  2. Goldemberg, J. World Energy Assessment: Energy and Challenge Sustainability; United Nations Development Programme: New York, NY, USA, 2002. [Google Scholar]
  3. Gomaa, M.R.; Al-Dmour, N.; AL-Rawashdeh, H.A.; Shalby, M. Theoretical model of a fluidized bed solar reactor design with the aid of MCRT method and synthesis gas production. Renew. Energy 2020, 148, 91–102. [Google Scholar] [CrossRef]
  4. Gomaa, M.R.; Mustafa, R.J.; Al-Dmour, N. Solar thermochemical conversion of carbonaceous materials into syngas by Co-Gasification. J. Clean. Prod. 2020, 248, 119185. [Google Scholar] [CrossRef]
  5. Mustafa, R.J.; Gomaa, M.R.; Al-Dhaifallah, M. Environmental impacts on the performance of solar photovoltaic systems. Sustainability 2020, 12, 608. [Google Scholar] [CrossRef] [Green Version]
  6. Twidell, J.; Weir, T. Renewable Energy Resources; Tayler & Francis: Milton Park, UK, 2006. [Google Scholar]
  7. Lynn, P.A. Electricity from Sunlight; John Wiley & Sons: London, UK, 2010. [Google Scholar]
  8. Rezk, H.; Ali, Z.M.; Abdalla, O.; Younis, O.; Gomaa, M.R.; Hashim, M. Hybrid moth-flame optimization algorithm and incremental conductance for tracking maximum power of solar PV/thermoelectric system under different conditions. Mathematics 2019, 7, 875. [Google Scholar] [CrossRef] [Green Version]
  9. Gomaa, M.R.; Mohamed, A.M.; Rezk, H.; Al-Dhaifallah, M.; Al-shammri, M.J. Energy Performance Analysis of On-Grid Solar Pblehotovoltaic System- a Practical Case Study. International Journal of Renewable Energy Research (IJRER) 2019, 9, 1292–1301. [Google Scholar]
  10. Ghoneim, A.A.; Mohammedein, A.M. Experimental and numerical investigation of combined photovoltaic-thermal solar system in hot climate. Br. J. Appl. Sci. Technol. 2016, 16, 1–15. [Google Scholar] [CrossRef]
  11. Bijjargi, Y.S.; Kale, S.S.; Shaikh, K.A. Cooling technique for photovoltaic module for improving its conversion efficiency. Int. J. Mech. Eng. Technol. 2016, 4, 22–28. [Google Scholar]
  12. He, W.; Chow, T.T.; Ji, J.; Lu, J.; Pei, G.; Chan, L.S. Hybrid photovoltaic and thermal solar-collector designed for natural circulation of water. Appl. Energy 2006, 83, 199–210. [Google Scholar] [CrossRef]
  13. Odeh, S.; Behnia, M. Improving photovoltaic module efficiency using water cooling. Heat Transf. Eng. 2009, 30, 499–505. [Google Scholar] [CrossRef]
  14. Gomaa, M.R.; Mustafa, R.J.; Rezk, H. An experimental implementation and testing of a concentrated hybrid photovoltaic/thermal system with monocrystalline solar cells using linear Fresnel reflected mirrors. Int. J. Energy Res. 2019, 43, 8660–8673. [Google Scholar] [CrossRef]
  15. Othman, M.Y.H.; Ab Hamid, S.; Tabook, M.; Sopian, K.; Roslan, M.; Ibarahim, Z. Performance analysis of PV/T Combi with water and air heating system: An experimental study. Renew. Energy 2016, 86, 716–722. [Google Scholar] [CrossRef]
  16. Fudholi, A.; Sopian, K.; Yazdi, M.H.; Ruslan, M.; Ibrahim, A.; Kazem, H.A. Performance analysis of photovoltaic thermal (PVT) water collectors. Energy Convers. Manag. 2014, 78, 641–651. [Google Scholar] [CrossRef]
  17. Herrando, M.; Markides, C.N. Hybrid PV and solar-thermal systems for domestic heat and power provision in the UK: Techno-economic considerations. Appl. Energy 2016, 161, 512–532. [Google Scholar] [CrossRef] [Green Version]
  18. Gomaa, M.R.; Gomaa, M.R.; Rezk, H.; Al-Dhaifallah, M.; Al-Salaymeh, A. Sizing methodology of a multi-mirror solar concentrated hybrid PV/thermal system. Energies 2018, 11, 3276. [Google Scholar] [CrossRef] [Green Version]
  19. Wang, G.; Wang, F.; Shen, F.; Jiang, T.; Chen, Z.; Hu, P. Experimental and optical performances of a solar CPV device using a linear Fresnel reflector concentrator. Renew. Energy 2020, 146, 2351–2361. [Google Scholar] [CrossRef]
  20. Prasad, G.S.C.; Reddy, K.S.; Sundararajan, T. Optimization of solar linear Fresnel reflector system with secondary concentrator for uniform flux distribution over absorber tube. Sol. Energy 2017, 150, 1–12. [Google Scholar] [CrossRef]
  21. Abbas, R.; Munoz-Anton, J.; Valdes, M.; Martínez-Val, J.M. High concentration linear Fresnel reflectors. Energy Convers. Manag 2013, 72, 60–68. [Google Scholar] [CrossRef]
  22. Beltagy, H.; Semmar, D.; Lehaut, C.; Said, N. Theoretical and experimental performance analysis of a Fresnel type solar concentrator. Renew. Energy 2017, 101, 782–793. [Google Scholar] [CrossRef]
  23. He, J.; Qiu, Z.; Li, Q.; Zhang, Y. Optical design of linear Fresnel reflector solar concentrators. Energy Procedia 2012, 14, 1960–1966. [Google Scholar] [CrossRef] [Green Version]
  24. Chemisana, D.; Barrau, J.; Rosell, J.I.; Abdel-Mesi, B.; Souliotis, M.; Badia, F. Optical performance of solar reflective concentrators: A simple method for optical assessment. Renew. Energy 2013, 57, 120–129. [Google Scholar] [CrossRef]
  25. Zhu, J.; Chen, Z. Optical design of compact linear Fresnel reflector systems, Sol. Energy Mater. Sol. Cells 2018, 176, 239–250. [Google Scholar] [CrossRef] [Green Version]
  26. Wang, G.; Wang, F.; Shen, F. Novel design and thermodynamic analysis of a solar concentration PV and thermal combined system based on compact linear Fresnel reflector. Energy 2019, 180, 133–148. [Google Scholar] [CrossRef]
  27. Duffie, J.A.; Beckman, W.A. Solar Engineering of Termal Process, 4th ed.; John Wiley & Sons, Inc.: New York, NY, USA, 2013. [Google Scholar]
  28. Bahaidarah, H.M.; Tanweer, B.; Gandhidasan, P.; Rehman, S. A combined optical, thermal and electrical performance study of a V-trough PV system—Experimental and analytical investigations. Energies 2015, 8, 2803–2827. [Google Scholar] [CrossRef] [Green Version]
  29. Hasan, M.A.; Krishnan, S. Photovoltaic thermal module concepts and their performance analysis: A review. Renew. Sustain. Energy Rev. 2010, 14, 1845–1859. [Google Scholar] [CrossRef]
Figure 1. Side view: (a) linear Fresnel concentrator system, (b) enlarge mirrors radiation (Section D).
Sustainability 12 05392 g001
Figure 2. (a) The angle of solar radiation falling on the base, (b) plan view showing azimuth angle.
Sustainability 12 05392 g002
Figure 3. (a) Receiver components; (b) the length of the absorber element (dx).
Sustainability 12 05392 g003
Figure 4. The equivalent thermal resistance circuit for the receiver: (a) equivalent thermal resistance; (b) value of thermal resistance.
Sustainability 12 05392 g004
Figure 5. Experimental set-up of concentrating photovoltaic/thermal (CPV/T) system: (a) linear Fresnel reflector mirror (LFRM) concentrating system, (b) electric measurement devices, and (c) thermal measurement system assembly. PV/T—photovoltaic/thermal.
Sustainability 12 05392 g005aSustainability 12 05392 g005b
Figure 6. Electric power versus solar radiation for different CRs.
Sustainability 12 05392 g006
Figure 7. Solar cell temperature versus solar radiation for different CRs.
Sustainability 12 05392 g007
Figure 8. Absorber plate temperature versus solar radiation for different CRs.
Sustainability 12 05392 g008
Figure 9. Solar panel efficiency versus solar radiation for different CRs.
Sustainability 12 05392 g009
Figure 10. Thermal efficiency versus solar radiation for different CRs.
Sustainability 12 05392 g010
Figure 11. Thermal energy versus solar radiation for different CRs.
Sustainability 12 05392 g011
Figure 12. Solar radiation, wind velocity, ambient temperature, inlet water temperature, exit water temperature for PV module under non-concentrated and concentrated systems (CR = 3) and ṁ = 0.7 kg/min.
Sustainability 12 05392 g012
Figure 13. Comparison between experimental and theoretical electrical, thermal, and total efficiencies: (a) PV module under non-concentration, and (b) PV module under mirror concentration system (CR = 3) and ṁ = 0.7 kg/min.
Sustainability 12 05392 g013
Figure 14. Comparison between experimental and theoretical electrical, thermal, and total efficiencies: (a) PV module under non-concentration and (b) PV module under mirror concentration system (CR = 3) and ṁ = 0.7 kg/min.
Sustainability 12 05392 g014
Table 1. Design parameter of each mirror.
ParametersSym.UnitsMirror No.
123456
Horizontal distanceXmm1542123114647071107
Mirrors tilt angleαDeg.6.19.6013.618.724.730.6
Mirrors widthWmm5692.5133183.3238290
Spacing between mirrorsSmm-1.8008.0024.069.0184
Concentration ratio of each mirrorCR W cos α / w 0.1860.3040.4310.5790.7210.832
Total concentration ratio, CR 1 n W cos α / w 0.1860.4900.921.502.223.10
Table 2. The photovoltaic (PV) characteristics used in the experiment.
Characteristics (STC), (Air Mass AM1.5, Irradiance 1000 W/m2, Cell Temperature 25 °C)
CharacteristicsSymbolValueUnit
Open Circuit VoltageVoc26.72V
Short Circuit CurrentIsc3.15A
Maximum Power VoltageVmpp24.85V
Maximum Power CurrentImpp2.83A
Maximum PowerPmax70W
Module Efficiencyηmod.17.5%

